Article

Efficacy Evaluation of Civil-Works Mud as Soil Matrix Modified by Organic Amendments

1
School of Resources, Environment and Materials, Guangxi University, Nanning 530004, China
2
College of Agriculture, Guangxi University, Nanning 530004, China
3
Guangxi Qinghui Environmental Protection Technology Co., Ltd., Chongzuo 532100, China
*
Author to whom correspondence should be addressed.
Agriculture 2025, 15(10), 1056; https://doi.org/10.3390/agriculture15101056
Submission received: 29 March 2025 / Revised: 6 May 2025 / Accepted: 12 May 2025 / Published: 13 May 2025
(This article belongs to the Special Issue Agricultural Soil Acidification Improvement Strategies)

Abstract

:
Converting civil-works mud (CWM) into soil matrix is a significant method for resource utilization, effectively mitigating CWM accumulation. In this study, CWM was utilized as a soil matrix and modified with three organic materials: pig manure, biochar, and corn straw. Field experiments were conducted using pig manure (PM), pig manure combined with biochar (PMB), and pig manure combined with straw (PMC), with the total organic matter content of the amendments applied in each treatment maintained at a consistent level. The physicochemical properties and soil matrix microbial biomass for all treatments were determined at the time of corn harvest. Additionally, the soil quality index (SQI) was calculated to evaluate the effectiveness of the various treatments. The results indicated that the addition of organic amendments significantly enhanced the physicochemical and soil microbial properties of soil matrix, significantly increasing the crop yield. Among the treatments, the application of pig manure combined with biochar (PMB) significantly improved the quality of soil matrix, with the SQI increasing by 65.2 times compared to soil matrix. This treatment achieved a crop yield of 5525 kg/ha, and the safety of the crops in all treatments complied with the National Food Safety Standard Limits of Contaminants in Foods. This study proposes a novel and feasible approach for the resource utilization of CWM, and the improved soil matrix can help alleviate the increasing issue of soil resource scarcity.

1. Introduction

Civil-works mud (CWM) is a residual material derived from construction waste and residue after the removal of impurities, sand, and gravel aggregates. According to the Standard for Engineering Classification of Soil [1], CWM is classified as silty clay, with silt and clay particle proportions ranging from 46.9% to 63.0% and 16.0% to 25.6%, respectively [2,3]. The improper stockpiling and indiscriminate disposal of CWM can lead to severe environmental issues, including water and soil erosion, as well as engineering safety hazards such as debris flows, slope instability, and landslides [3].
Traditionally, CWM has been primarily treated as waste, necessitating dedicated sites, equipment, and personnel for its treatment, transportation, and disposal [4]. Liu et al. [5] investigated the preparation of ceramisite using solid waste materials, including Na2O and CWM, while Liang et al. [6] focused on the firing of ceramisite using biochar and CWM. However, the sintering process generates waste gases that pose significant challenges to industrial carbon emission reduction efforts, hindering its large-scale promotion and application [7]. In addition, another method is to improve the soil matrix quality and utilize it for cultivation, which offers substantial economic benefits and environmental advantages [8]. Nevertheless, the application of CWM as a soil matrix is limited by several factors, including its susceptibility to compaction due to poor physical structure, low nutrient content (with soil organic matter levels ranging from 0.4% to 1.2%), and potential heavy metal contamination [2,3]. Therefore, the addition of soil amendments is essential to enhance its properties during utilization.
The application of soil amendments in soil is a highly effective method for improving soil quality. Recent studies have mainly focused on conventional substrates, such as peat [9], perlite [10], and coal gangue [11]. Additionally, research has increasingly investigated the feasibility of utilizing agricultural waste as a matrix material [12,13]. For instance, Guo et al. [14] demonstrated that animal manure can improve soil fertility via microbial mediated fermentation and decomposition processes, and significantly enhance crop productivity. Arif et al. [15] found that the application of biochar in soil can improve soil structure, nutrient retention, microbial activity, and plant nutrient uptake. Similarly, Zhang et al. [16] demonstrated that straw incorporation promotes soil aggregate formation and porosity, further optimizing soil structure. Therefore, this study focused on enhancing the quality and functionality of CWM using organic amendments, with a particular emphasis on evaluating their impact on soil quality.
The main methods for soil quality assessment are the soil quality index (SQI) and soil health score. The SQI has been widely applied in soil quality assessment because of its multi-index integration, scientific weight allocation, and flexible technical adaptation [17,18]. In this study, CWM modified with organic amendments was used as soil matrix for crop cultivation, and the effectiveness of various treatments was evaluated by calculating the SQI.
In this study, three organic materials (pig manure, biochar, and corn straw) were used as amendments to improve the quality of CWM as a soil matrix within one production cycle. The study objectives were as follows: (i) to investigate the effects of organic amendments on the physicochemical and microbial properties following their application to CWM; (ii) to investigate the effects of organic amendments on the SQI, yield, and safety of corn; and (iii) to conduct a preliminary assessment of the feasibility of CWM as soil matrix.

2. Materials and Methods

2.1. Experimental Materials

The experimental materials utilized in this study included CWM, pig manure, biochar, corn straw, urea, and compound fertilizer (N:P2O5:K2O = 15:15:15). Among these, CWM, pig manure and corn straw were obtained from Guangxi Qinghui Environmental Protection Technology Co., Ltd. (Chongzuo, China), while the biochar was supplied by Guangxi Guigang Yucheng Agricultural Technology Co., Ltd. (Guigang, China). Detailed specifications of these materials are presented in the Supplementary Materials (see Tables S1 and S2). Corn seed (Wanchuan 1306) was provided by Guangxi Wanchuan Seed Industry Co., Ltd. (Nanning, China). Urea was provided by Nanning Guangfei Agricultural Materials Co., Ltd. (Nanning, China). Compound fertilizer was provided by Guangxi Zhuangfangyuan Fertilizer Sales Co., Ltd. (Nanning, China).

2.2. Experimental Design

This study was conducted on approximately 0.06 hectares of farmland degraded by mining in the Guangxi Zhuang Autonomous Region, Chongzuo City, Fusui County (108°0′48″ E, 22°44′49″ N), where the mean annual temperature is 22.1 °C, the mean annual precipitation is 1261 mm, and the mean annual potential evapotranspiration is 1163 mm. A layer of CWM with a thickness of approximately 25 cm was laid as soil matrix in October 2023, and three organic amendments were immediately applied for improvement. Corn was planted from October 2023 to January 2024. The goal was to achieve the reconstruction of and improvement in the soil environment in this farmland. Four different treatments were set up: CK (CWM + normal fertilization), CK + pig manure (PM), CK + pig manure + biochar (PMB), and CK + pig manure + corn straw (PMC). Organic amendments were evenly surface-applied to the CWM and then thoroughly mixed by plowing. For normal fertilization, this study was carried out in accordance with the fertilization guidelines for high-standard farmland construction specified in the Fertilization Technical Regulation of Corn [19], which added 375 kg/ha of urea and 750 kg/ha of compound fertilizer at 20 and 40 days of corn growth, respectively. The water management of the maize growth process was carried out according to the high-yield and high-efficiency cultivation techniques recommended by the Maize Research Institute of Guangxi Zhuang Autonomous Region, that is, from emergence to 20 days after emergence (DAE). The soil water content was maintained at approximately 70% of field capacity (FC) to ensure proper seedling establishment; during the jointing to tasseling stage, moisture levels were sustained at 75–85% FC to support vigorous vegetative growth and tassel initiation; and for the critical 20-day period following tasseling, the soil moisture was maintained at 70–80% FC to optimize reproductive development and grain filling [20]. With three replicates randomly performed, each treatment plot covered an area of 30 square meters (6 m × 5 m). In this experiment, the total organic matter content of the applied organic amendments was kept consistent, and the specific application details are provided in Table 1.

2.3. Sample Collection

The physicochemical properties and microbial biomass of all treatments were determined at the end of the corn harvest. During the corn maturity stage, a representative area of 1 m2 was sampled from each plot to calculate yield and grain-to-gob ratio. The edible portions of the corn were dried and crushed for safety analysis [21]. After harvesting, three subsamples of 0 to 20 cm and about 1 kg were taken from each experimental plot, and composite samples of the treatment were prepared by mixing the subsample. The collected soil matrix was divided into two portions: one portion was immediately preserved in sterile cryogenic conditions for subsequent microbial analyses, while the other portion was air-dried, a 2 mm mesh sieve was used during the soil sample pretreatment to remove stones and organic residues, and it was homogenized through an 80-mesh sieve (≤0.177 mm particle size) and stored for physicochemical determination.

2.4. Measurement

The soil matrix’s pH was measured using a calibrated pH meter (PHS-3C, Shanghai Yidian Scientific Instrument Co., Ltd., Shanghai, China) with a soil-to-water ratio of 1:2.5. The soil matrix’s electrical conductivity (EC) was determined with a conductivity meter (DDS-801, Beijing Huarui Boyuan Technology Development Co., Ltd., Beijing, China) at a 1:5 soil-to-water ratio [21].
For the nutrient analyses, the assessed parameters of the soil matrix’s were as follows: available potassium (AK) was analyzed by flame atomic absorption spectrophotometry (AA-7000, Shimadzu International Trading Co., Ltd., Kyoto, Japan) after digestion by CH3COONH4 [22]; total phosphorus (TP) was measured by the molybdenum Sb colorimetric method (TU-1810plus, Shanghai Jipu Electronic Technology Co., Ltd., Shanghai, China) after being digested with HClO4-H2SO4 [23]; available phosphorus (AP) was measured by the molybdenum Sb colorimetric method (TU-1810plus, China) after being extracted by 0.5 mol/L NaHCO3 [24]; total nitrogen (TN) was measured by the Kjeldahl method which uses H2SO4 digestion (with CuSO4/K2SO4 catalyst), NaOH-driven steam distillation, and HCl titration of the trapped NH3 in boric acid solution [21]; alkali hydrolyzable nitrogen (AN) was determined through alkaline hydrolysis (using 1.0 mol/L NaOH solution at 40 °C for 24 h), steam distillation (with 2% boric acid containing mixed indicator for NH3 trapping), and titration (with 0.01 mol/L HCl standard solution) [21]; soil organic matter (SOM) content was determined by potassium dichromate oxidation (using 0.4 mol/L K2Cr2O7 in concentrated H2SO4 at 170–180 °C for 5 min), followed by titration with 0.2 mol/L FeSO4·(NH4)2SO4 solution using diphenylamine as the indicator [25].
Soil aggregates were classified using the dry sieving method with a series of standard sieves of different mesh sizes, while the mean gravimetric diameter (MWD) and geometric mean diameter (GWD) of the soil matrix were measured using the wet sieving method with a series of standard sieves of different mesh sizes [26,27]. Bulk density (BD) was determined using the ring knife method, where undisturbed soil cores of known ring-knife volume (5 cm diameter × 5 cm height) were extracted, oven-dried at 105 °C for 24 h, and weighed. BD was calculated as the dry matter mass of soil divided by the ring knife volume (g cm−3) [21]. The soil matrix’s permeability coefficient (PC) was measured by the variable head method [28].
Soil microbial biomass carbon (MBC) and nitrogen (MBN) were quantified through chloroform fumigation–extraction followed by TOC analysis (TOC–VSH, Shanghai Jipu Electronic Technology Co., Ltd., Shanghai, Japan) [29].
The height of the corn plants was measured using a tape measure. Heavy metal concentrations (Cd, Hg, As, Zn, Pb, Cr) in the CWM and crops were analyzed using ICP–MS (SUPEC 7000A, Focus Technology (Hangzhou) Co., Ltd., Hangzhou, China) following their microwave-assisted acid digestion (HNO3–HF). The acid digestion method is detailed in Text S1 [21].
All samples were prepared in triplicate to ensure the reliability and reproducibility of the results. Silica was used as the procedural blank for the analysis of SOM, TN, AN, TP, and AP, while the national standard reference materials were used as the procedural blank for the analysis of AK, Cd, Hg, As, Zn, Pb, Cr, MBC, and MBN. The detailed information of the national standard reference materials is provided in the Supplementary Materials, as detailed in Table S3.

2.5. The Assessment of SQI

A Pearson correlation analysis of all indicators and yields was performed. Correlations greater than 0.20 were identified as indicators for evaluating the quality of soil matrix within the total data set (TDS). To assess the quality of soil matrix, principal component analysis (PCA) was conducted, and the minimum data set (MDS) was determined, and soil indicators that exhibited significant differences (p < 0.05) were selected based on the TDS. The selected soil matrix indicators were normalized to a scale of 0 to 1. For the indicators that positively influence the quality of soil matrix, a “more is better” scoring model was employed in the selection of scoring methodologies, including SOM, TN, TP, AN, AP, AK, MBC, MBN, MWD, GWD, and PC. Indicators that negatively affect the quality of soil matrix utilized a “less is better” scoring model, including BD, pH, and EC. The weighted method was employed to determine the SQI. The following function (Equation (1)) was used for determining the score of the soil matrix indicator [30]:
S = 1 1 + ( X / X m ) b  
where S is score of the soil matrix indicator, X is the soil matrix indicator value, Xm is the mean value of each soil indicator, and b is the slope of the equation and is set as −2.5 for a “more is better” curve and 2.5 for a “less is better” curve.
The transformed indicator scores were integrated into a comparative SQI using weighted additive (Equation (2)) methods, as follows:
S Q I = i = 1 n W i × S i
where SQI is the soil quality index, Si is the indicator score, n is the number of soil indicators in the MDS and TDS, and Wi is the weighting value of soil indicators.

2.6. Statistical Analysis

Microsoft Excel 2016 was employed for the integration and processing of the soil matrix and plant data. Researchers determined the TDS and MDS of soil matrix indicators using the correlation analysis and PCA. IBM SPSS 24.0 was employed to conduct the one-way analysis of variance (ANOVA), LSD test, Pearson correlation analysis, and PCA. The Origin 2021 software was used for creating various types of graphs and charts related to the research data.

3. Results

3.1. Effects of Different Treatments on Soil Matrix Properties

The physical and chemical properties of soil matrix in the experimental fields (Table 2) indicated that adding organic amendments to the soil matrix significantly enhanced the fertility of soil matrix, and the improvement effect was markedly superior to that of the CK treatment (p < 0.01). Among the treatments, the soil matrix treated with PM treatment significantly improved SOM, TN, and AN, increasing by 135.1%, 67.4%, and 2856.3% when compared with CWM, respectively. The soil matrix treated with PMC treatment significantly increased AK, increasing by 134.8% when compared with CWM. Additionally, the soil matrix treated with PMB and PMC treatments showed considerable improvements in TP, with increases of 32.8% and 24.0% when compared with CWM, respectively. The researchers observed significant differences in the effects of different treatments on the chemical properties of CWM. Compared to CWM, all treatments significantly reduced soil matrix’s pH and electrical conductivity (EC). The soil matrix treated with CK treatment had the most significant effect on reducing pH (p < 0.05). However, the differences among treatments with organic amendments were insignificant. The degree of reduction in EC by various treatments was ranked as PMB > PMC > PM > CK. Furthermore, the soil matrix treated with the PMC and PMB treatments significantly improved the physical structure. Specifically, compared to untreated CWM, MWD increased by 42.2% (PMC) and 39.6% (PMB), GWD increased by 90.4% (PMC) and 84.6% (PMB), PC increased 22.3 times (PMC) and 20.4 times (PMB), and BD decreased by 15.3% (PMC) and 13.5% (PMB).
As illustrated in Figure 1A, the levels of soil matrix MBC and MBN in the improved CWM significantly increased (p < 0.05). Compared to CWM, the concentration of MBC in the soil matrix treated with the CK, PMB, PMC, and PM treatments increased by 247.0%, 216.3%, 151.5%, and 149.3%, respectively, while the concentration of MBN increased by 558.1%, 488.2%, 310.3%, and 306.9%, respectively. Notably, the concentrations of MBC and MBN in the treatments with organic amendments were significantly lower than those in the soil matrix treated with CK treatment, except for the PMB treatment. Furthermore, crop cultivation and the application of organic amendments to the soil matrix significantly enhanced the proportion of large aggregates (>2 mm) in the soil matrix (Figure 1B). Organic amendments had a more pronounced effect on increasing the proportion of large aggregates (>2 mm).

3.2. Effects of Different Treatments on Crop

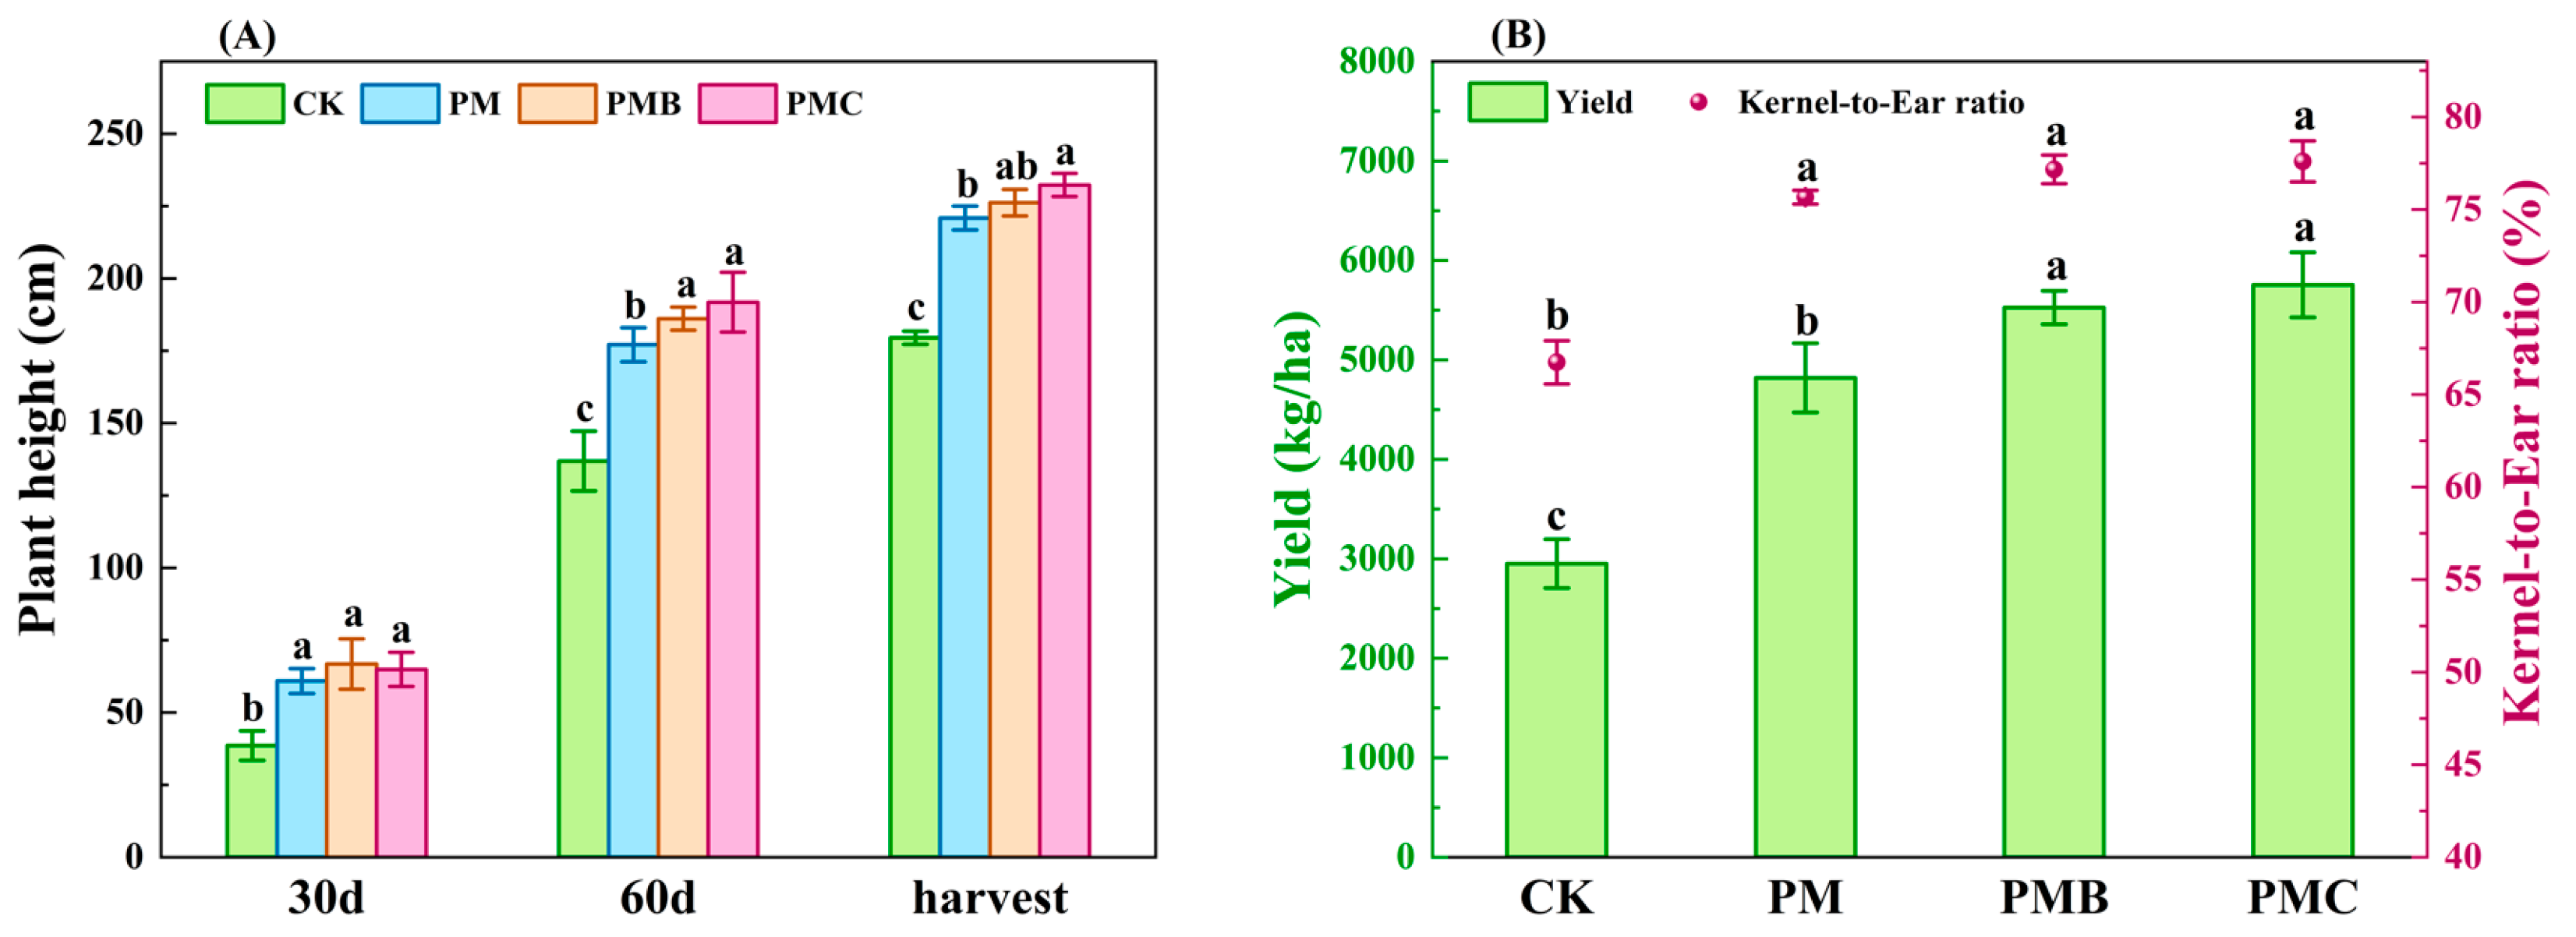
3.2.1. Plant Height and Yield

As illustrated in Figure 2A, the application of organic amendments to the soil matrix led to a significant increase in corn plant height during each growth period compared to the CK treatment. The effects of the various treatments on corn growth varied with the progression of the crop cycle progression. In comparison to the CK treatment, the yield significantly increased following the addition of organic amendments to the soil matrix (Figure 2B) (p < 0.05). The PMC and PMB treatments had notably pronounced effects, increasing yields by 94.9% and 87.2% compared to the CK treatment, respectively. Furthermore, the incorporation of organic amendments to the soil matrix led to a significant increase in the kernel-to-ear ratio (Figure 2B) (p < 0.05). However, the differences among the various organic amendment treatments were statistically insignificant. Overall, in terms of promoting corn growth, the effects of the different treatments on corn growth can be ranked as follows: PMC > PMB > PM > CK.

3.2.2. Safety Evaluation of Corn

As shown in Table S1 of the Supplementary Materials, the content of each heavy metal element in CWM was below the standard values specified by the Soil Environmental Quality-Risk Control Standard for Soil Contamination of Agricultural Land [31]. However, this study required a safety assessment of the produced corn. According to Table 3, the concentrations of contaminants in the corn were all below the standard values established by the National Food Safety Standard Limits of Contaminants in Food [32]. This indicates that the safety of the corn in this study complied with the established standards.

3.3. Effects of Different Treatments on Soil Quality Index (SQI)

3.3.1. Determination of Total Data Set (TDS) and Minimum Data Set (MDS)

This study employed the Pearson correlation analysis to assess the relationship between soil matrix indicators and crop yield, with a focus on indicators having correlation coefficients greater than 0.2 (Figure 3). Based on the analysis results, the researchers selected 14 indicators that constitute the total data set (TDS). Subsequently, principal component analysis (PCA) was conducted on these 14 indicators. The Kaiser–Meyer–Olkin (KMO) value was 0.67, meeting the statistical requirement of being greater than 0.6. Compared to the TDS, the minimum data set (MDS) has advantages such as high computational efficiency, optimized data quality, and strong domain adaptability [30]. For the MDS determined from the PCA results of the TDS, the eigenvalues of the first two principal components (PCs) were both greater than 1.0, and the cumulative contribution rate exceeded 90.5% (Table 4). The first PC component alone accounted for 55.5% of the total variance. Among the variables in the first principal component, PC had the highest loading value, followed by SOM, BD, and AP. The loading values of the latter all fell within 10% of the highest loading value. The researchers observed a significant correlation (p < 0.01) among these indicators (Figure 3). Therefore, due to its highest loading value, PC was selected as the primary indicator for PC 1. The second PC accounted for 35.0% of the total variance. Three highly weighted indicators had values within 10% of the highest loading value. These indicators were MBC, MBN, and pH, with the loading value of MBN exceeding that of both MBC and pH, respectively. Due to the extremely significant correlation (p < 0.01) among MBN, MBC, and pH, MBN was chosen as the representative indicator for PC 2. Ultimately, PC and MBN were chosen to form the minimum data set (MDS).

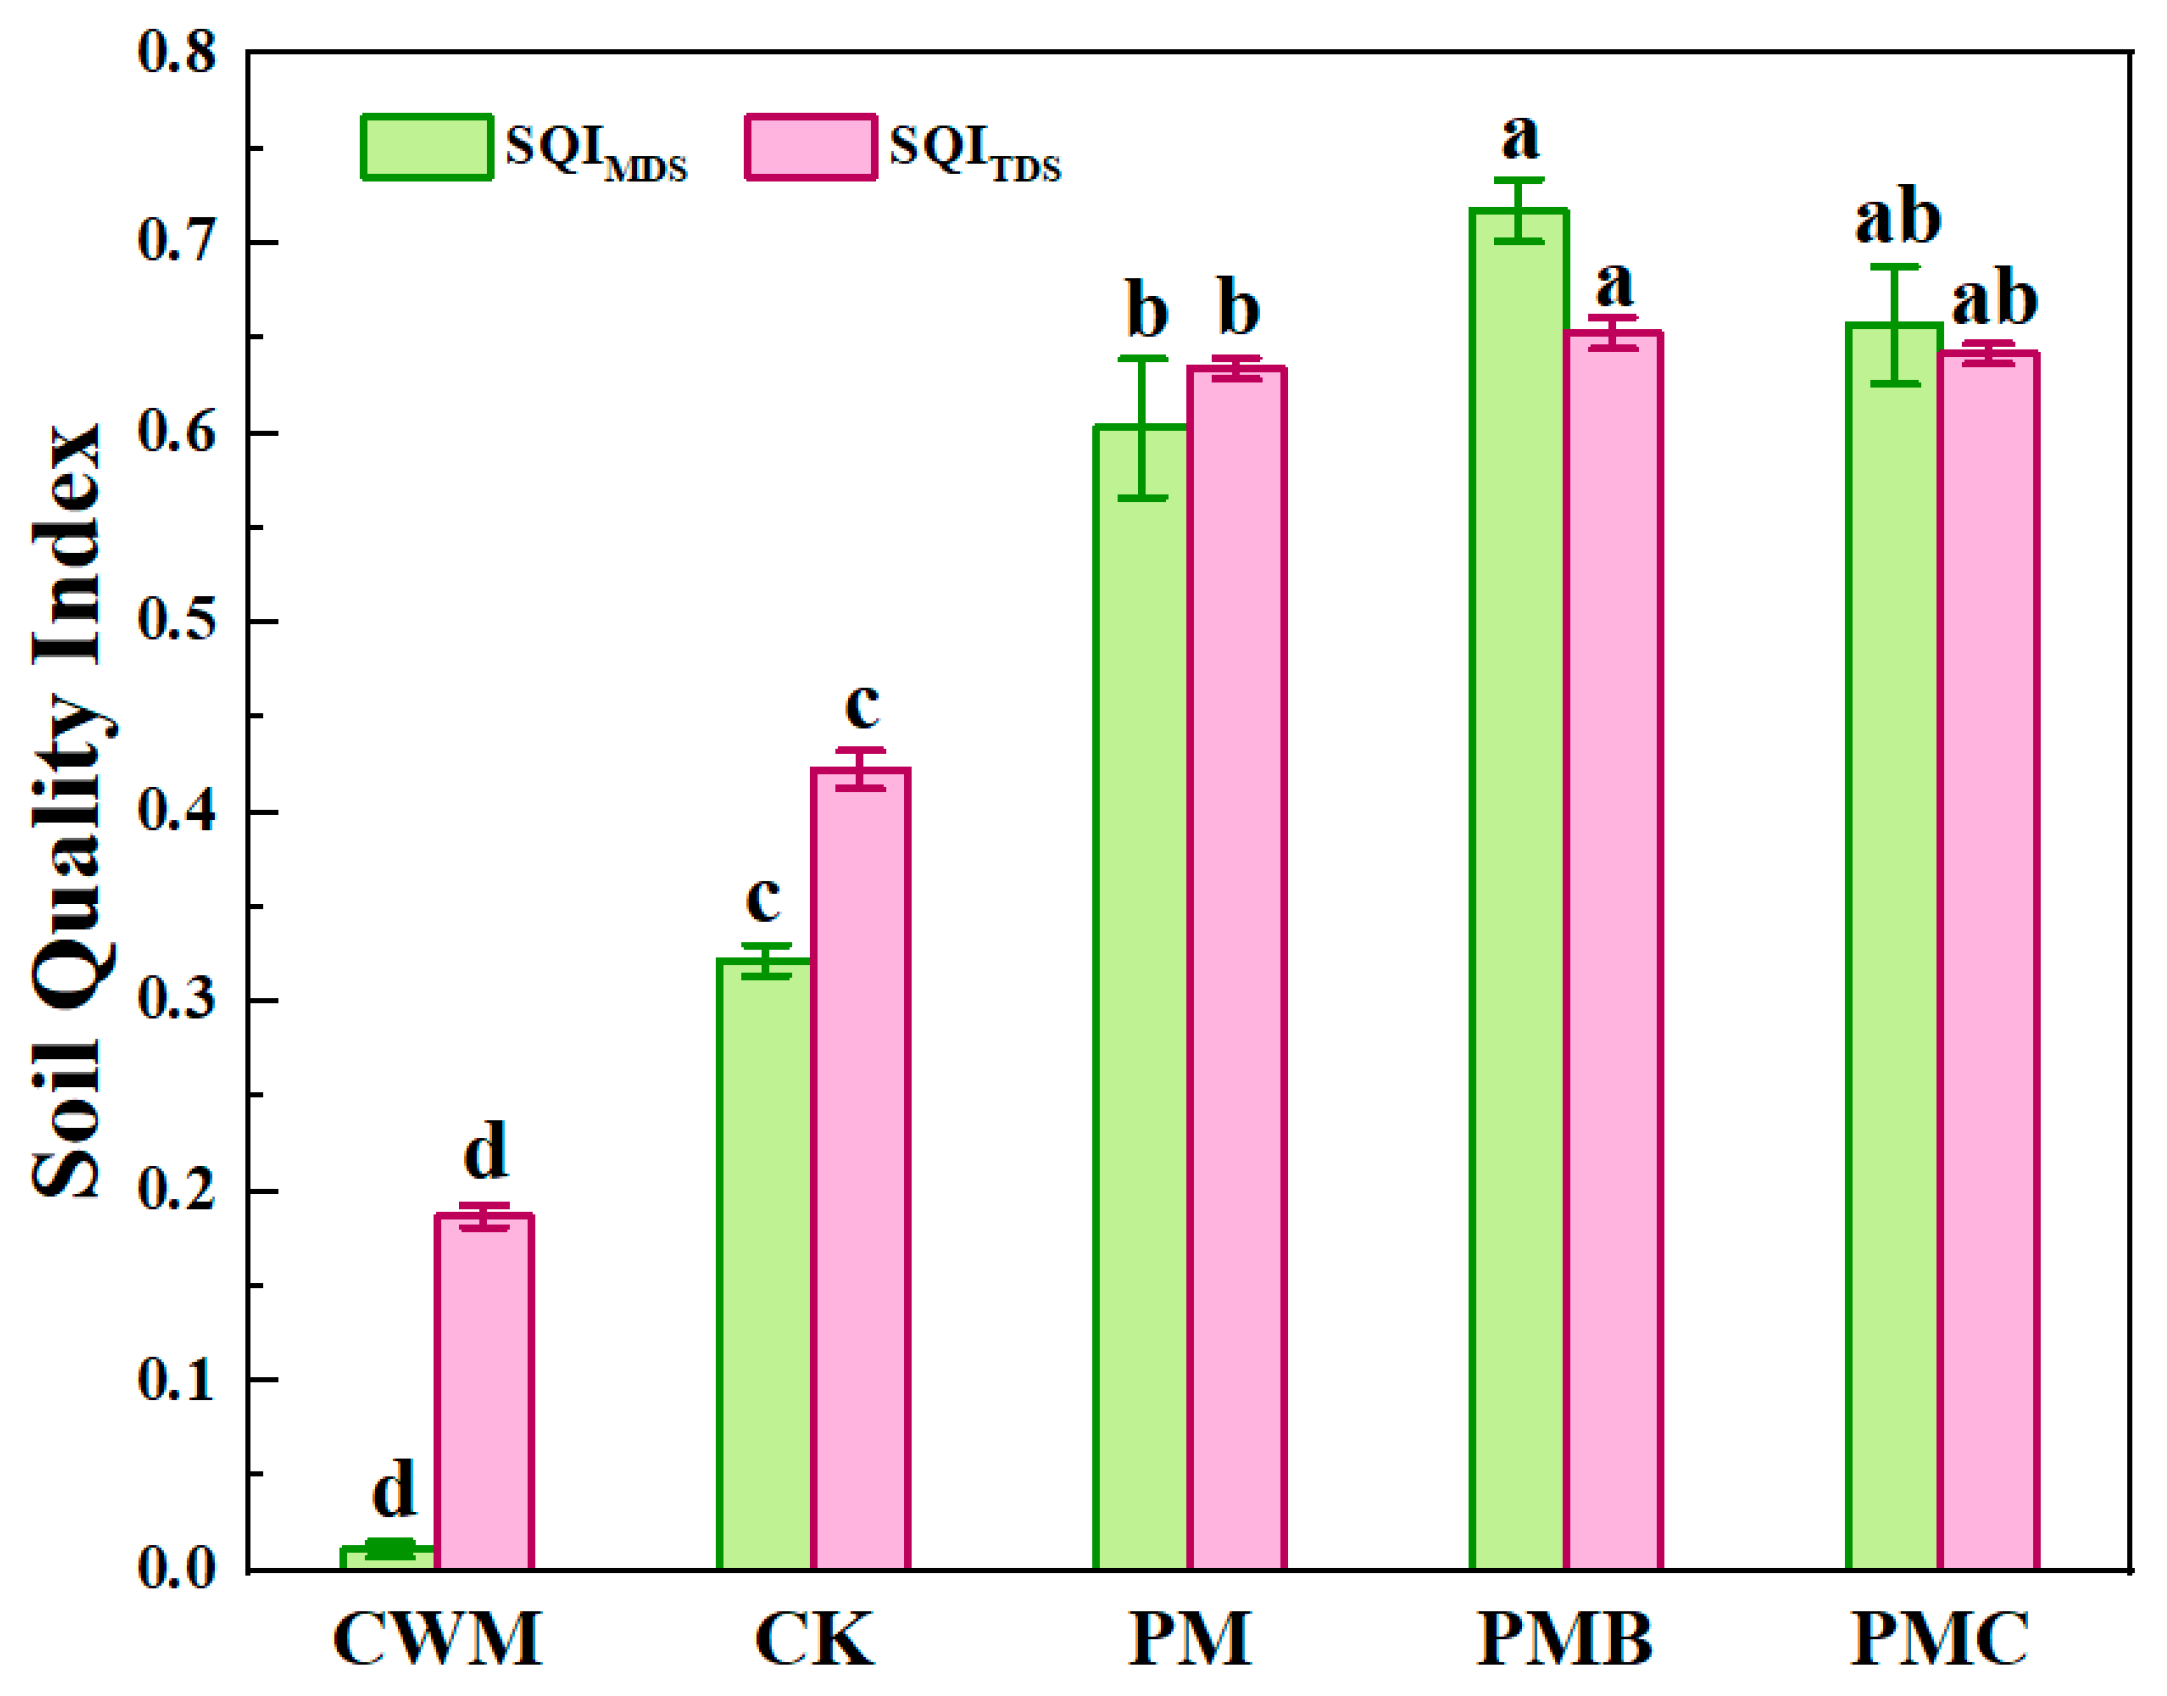
3.3.2. Soil Quality Index (SQI) Calculation

According to a formula (Equation (2)), the TDS and MDS were employed to calculate the SQI, as illustrated in Figure 4. The results indicated that all treatments significantly enhanced the SQI compared to CWM. The treatments involving organic amendments to the soil matrix had markedly superior effects compared to the CK treatment. Compared to the CWM, all treatments significantly increased the SQITDS and SQIMDS values. Specifically, the SQITDS increased by 2.32 times, 3.36 times, 3.42 times, and 3.49 times for the CK, PM, PMC, and PMB treatments, respectively, while the SQIMDS increased by 29.3 times, 54.8 times, 59.7 times, and 65.2 times for the same treatments. The results from the MDS were highly consistent with those from the TDS, with the improvement efficacy order being PMB > PMC > PM > CK. The Pearson correlation analysis revealed a correlation coefficient of 0.99 between the two SQIs, indicating a strong correlation between the SQIMDS and SQITDS and validating the reliability of the SQIMDS for the quality of soil matrix assessment.

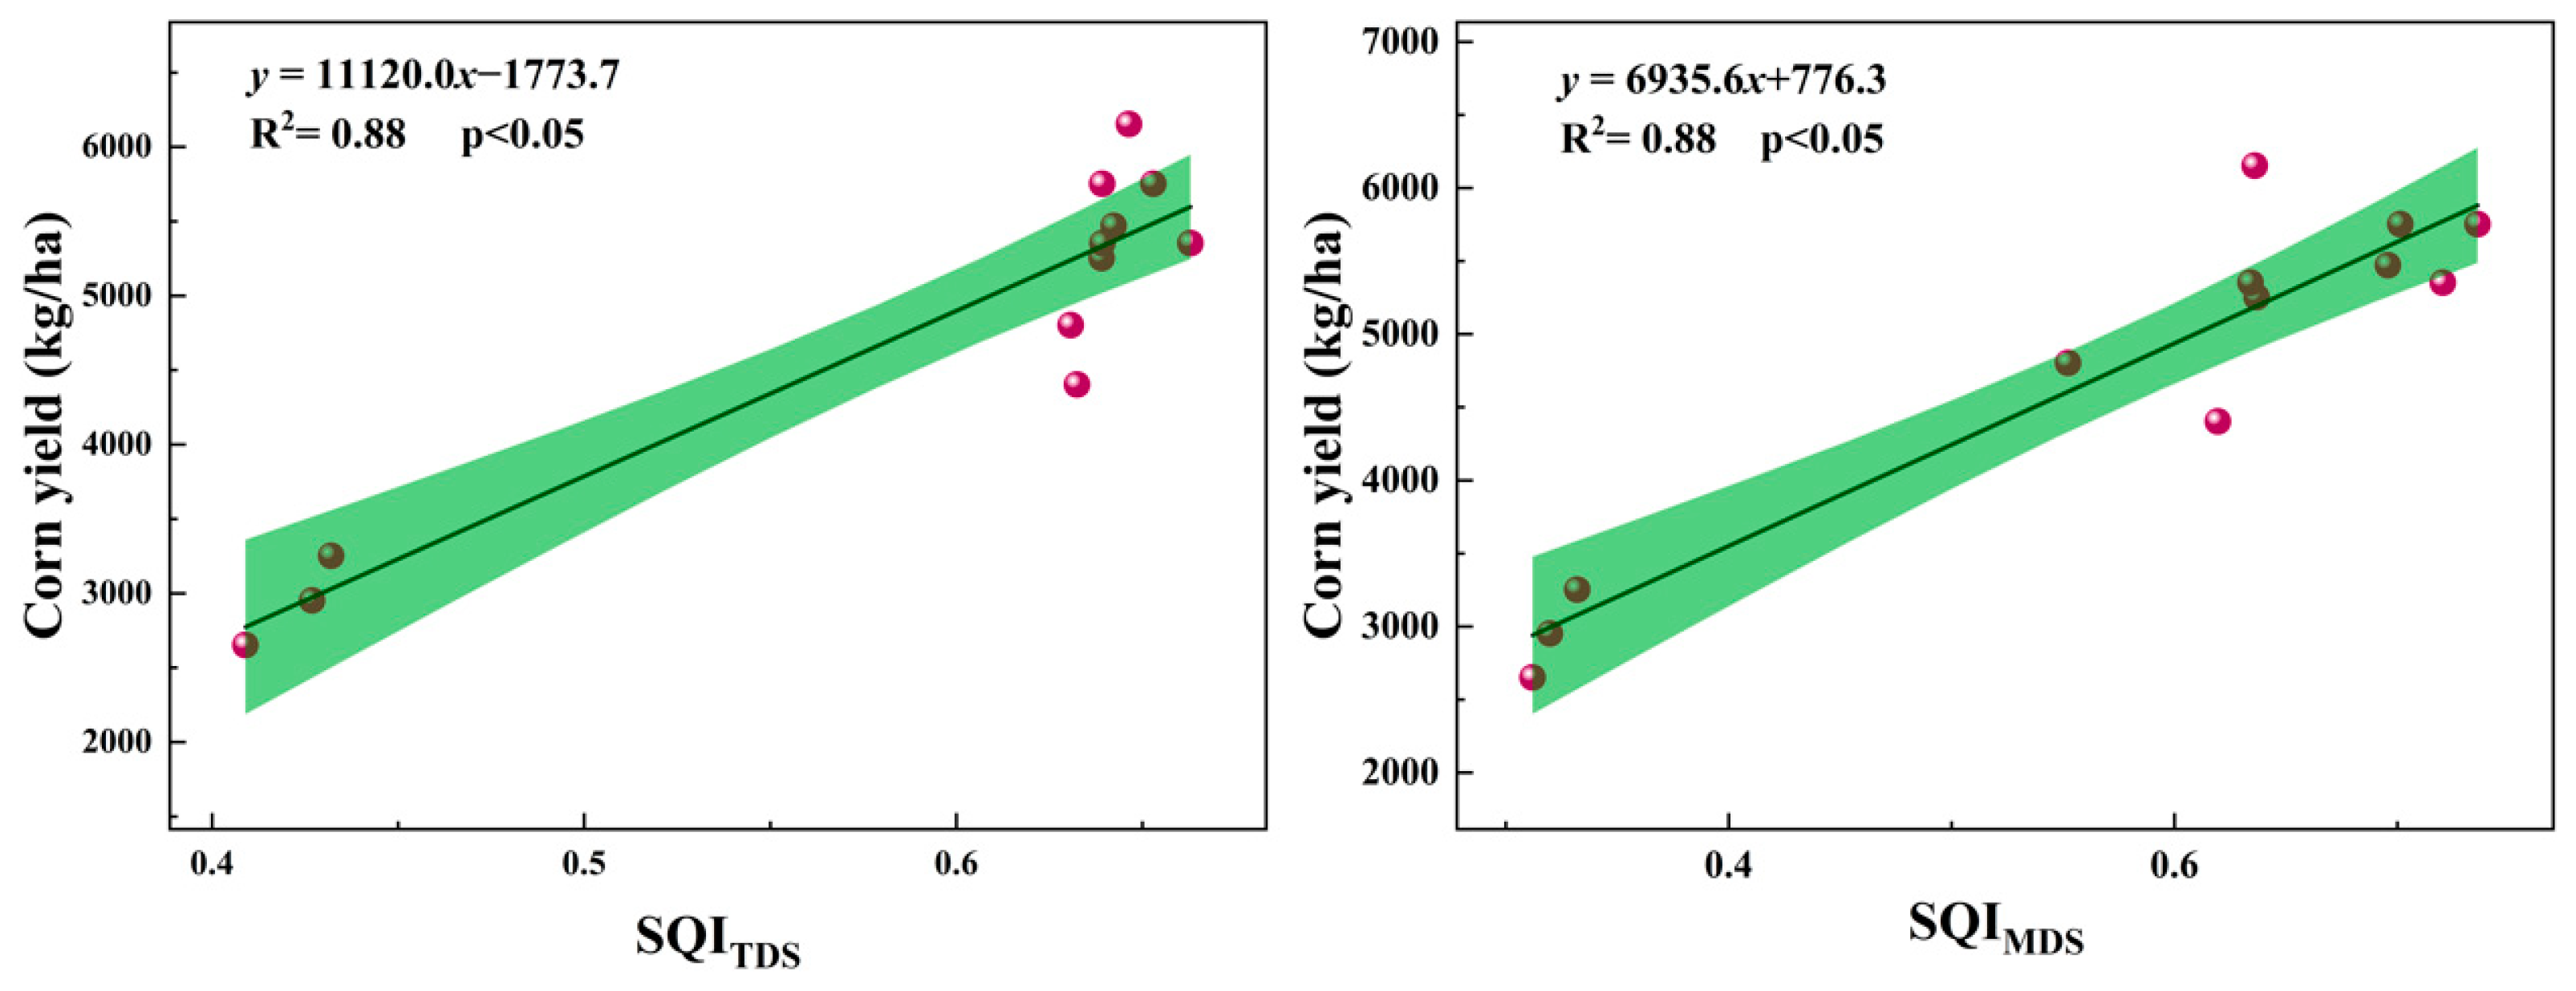
3.4. Relationship Between Crop Yield and SQI

The results of the linear regression analysis (Figure 5) showed a significant positive linear relationship between the SQI and corn yield (p < 0.01). The SQI for MDS and TDS accounted for 89% and 86% of the variations in yield, respectively. This suggests that the application of organic amendments to soil matrix for improving the quality of soil matrix can effectively increase crop yields. Overall, considering both the SQI and crop yield, the PMB treatment had the most substantial effect on CWM improvement.

4. Discussion

Fourteen critical soil physicochemical and biological indicators were systematically analyzed to assess the impact of crop cultivation and organic amendments on the quality of soil matrix [33,34,35]. All treatments significantly improved the soil matrix’s nutrient availability and biological properties compared to CWM (p < 0.05). Notably, the soil matrix treated with the PM treatment showed the highest levels of TN, AN, and SOM, likely attributable to the relatively low C/N ratio of animal manure that enhanced nitrogen mineralization and subsequent nitrogen accumulation [36,37]. Pig manure may contain residual antibiotics, salts, and heavy metals that negatively affect the activity of certain microbial groups. Although pig manure has a low C/N ratio (which typically favors mineralization), an excess of nitrogen could cause osmotic stress or toxicity for some microorganisms [38,39]. The soil matrix treated with the PMB treatment demonstrated significantly higher MBC and nitrogen MBN than other added amendments treatments, indicating that the biochar–pig manure synergy enhanced microbial growth while reducing community competition [40,41]. Interestingly, the soil matrix treated with PMB treatment soils showed a lower SOM content than the other amended treatments, possibly because the biochar-induced microbial activity accelerated the decomposition of exogenous organic matter [42]. Despite the lower microbial activity, the soil matrix treated with organic amendments treatments significantly boosted the maize yield compared to the control (CK), aligning with Fang et al.’s observations [43]. The PMC treatment achieved the highest yield, potentially due to the combination of pig manure with corn straw, which decomposes more slowly and may have provided an optimal nutrient balance, promoting a more balanced and gradual release of N, P, and K throughout the crop cycle. In addition, corn straw, with its high lignin and cellulose content, may have contributed to improved soil aggregate formation and water retention, which favors root development and nutrient uptake [44].
The physical structure of the soil matrix underwent a significant improvement following a series of treatments. This enhancement resulted from organic residue inputs promoting the organo-mineral complex and macroaggregate formation [45,46,47]. PC, which reflects the soil matrix pore structure and particle bonding, was significantly increased by crop cultivation and organic amendment application. This increase enhanced the soil matrix’s water permeability and optimized its structure [48,49]. The soil matrix treated with the PMB and PMC treatments surpassed the PM treatments in enhancing PC and reducing BD through the following: (1) biochar and corn stover lignin polymers improving water infiltration [50] and (2) the amendments’ low density directly decreasing BD (Table S2) [51].
Significant changes occurred in the EC and pH of the CWM following the treatments. This reduction can be attributed to the enhanced soil organic matter content and water-stable aggregates, thereby improving the soil water conductivity and facilitating the leaching of soil matrix salts through rainfall and irrigation. Additionally, organic amendments such as biochar or crop residues may directly adsorb ions, reducing the concentration of soluble salts [52,53]. In contrast, pH levels were significantly lower in all treatments compared to the CWM, with the CK treatment exhibiting a statistically significant and more pronounced reduction. This phenomenon may be attributed to microbial activity or to root exudates that could induce mild acidification in the rhizosphere, indirectly influencing both EC and pH dynamics, while the alkaline components of organic amendments partially counteract this effect [54].
In summary, applying organic amendments to soil matrix significantly enhances the quality of soil matrix by increasing its nutrient content and soil microbial activity, as well as improving its physicochemical properties. According to the MDS, PC and MBN were selected as important factors affecting the SQI, which play a crucial role in soil water circulation, soil microbial activity, and nitrogen cycling [48,55]. Among the organic amendment combinations, the combination of pig manure and biochar (PMB) exhibited the highest soil matrix quality (Figure 4), the highest yield (Figure 2B), and the lowest organic material usage (Table 1). In addition, the measured concentrations of corn pollutants in this study were lower than the corresponding national standards (Table 4), which supports the feasibility of using CWM as a soil matrix in farmland. These findings highlight the effectiveness of organic amendments in improving the physicochemical properties of soil matrix, thereby promoting sustainable agricultural practices. At the same time, the soil matrix improved in this experiment exhibits substantial potential for application in ecological restoration, such as environmental recovery activities, recovery of degraded areas, and reforestation.

5. Conclusions

This study successfully enhanced the efficacy of CWM modified by organic amendments as soil matrix, and its application effect in crop cultivation was verified. The results indicated that organic amendment-modified CWM exhibits significantly enhanced soil functionality, with PMB treatment (16,875 kg/ha pig manure + 4950 kg/ha biochar) showing optimal performance, as follows: (1) quantitatively improving 14 key indicators, including a 65.2-fold SQI increase and a 5525 kg/ha crop yield; (2) mechanistically enhancing nutrient pools (TP + 32.8%) and microbial activity (MBC + 216.3%, MBN + 488.2%); while (3) structurally reducing BD by 13.5% through improved aggregation (MWD + 39.6%, GWD + 84.6%). Overall, this study provides a novel and feasible perspective for the resource utilization of CWM, offering valuable insights for future research on the utilization of similar resources in ecological restoration.

Supplementary Materials

The following supporting information can be downloaded at: https://www.mdpi.com/article/10.3390/agriculture15101056/s1, Text S1: Acid digestion method; Table S1: Basic physical and chemical properties of the civil-works mud (CWM); Table S2: Physical and chemical properties of the organic materials; Table S3: The Information of national standard reference materials.

Author Contributions

Conceptualization, Y.S.; methodology, Y.S. and K.Z.; software, Y.S. and J.T.; validation, Y.S. and J.Y.; formal analysis, Y.S., H.W. and C.Z.; investigation, Y.S. and Q.Z.; resources, C.Z. and X.P.; data curation, Y.S. and H.W.; writing—original draft preparation, Y.S.; writing—review and editing, J.G. and Z.X.; visualization, J.T.; supervision, X.P.; project administration, H.W.; funding acquisition, C.Z., X.P. and H.W. All authors have read and agreed to the published version of the manuscript.

Funding

This research was supported by the Guangxi Key Research and Development Program (GuikeAB23075115), the National Natural Science Foundation of China (U22A20590), the National Key Research and Development Program (2023YFD1901300), and the Guangxi University Horizontal Scientific Research Program (202300328).

Institutional Review Board Statement

Not applicable.

Data Availability Statement

The data presented in this study are available on request from the corresponding author. The data are not publicly available due to ethical restrictions.

Conflicts of Interest

Author Haile Wu was employed by the company Guangxi Qinghui Environmental Protection Technology Co., Ltd. The remaining authors declare that the research was conducted in the absence of any commercial or financial relationships that could be construed as potential conflicts of interest.

References

  1. GB T 50145-2007; Ministry of Construction of the People’s Republic of China. Standard for Engineering Classification of Soils. China Planning Press: Beijing, China, 2007; pp. 6–14.
  2. Zhang, C.; Liu, X.; Fu, J.; Yang, J.; Li, L.; Xie, Y. Evaluating the feasibility of muck from slurry shield tunnels as a growth medium for landscaping. J. Air Waste Manag. Assoc. 2022, 72, 455–462. [Google Scholar] [CrossRef] [PubMed]
  3. Tanner, S.; Katra, I.; Argaman, E.; Ben-Hur, M. Erodibility of waste (Loess) soils from construction sites under water and wind erosional forces. Sci. Total Environ. 2017, 616, 1524–1532. [Google Scholar] [CrossRef]
  4. Bellopede, R.; Brusco, F.; Oreste, P.; Pepino, M. Main aspects of tunnel muck recycling. Am. J. Environ. Sci. 2011, 7, 338–347. [Google Scholar] [CrossRef]
  5. Liu, Z.; Zhang, H.; Lin, X.; Zhang, H.; Zhang, Z.; Zhang, S. Investigations on the preparation of ceramsite from petrochemical excess sludge. Front. Chem. 2022, 10, 1008884. [Google Scholar] [CrossRef] [PubMed]
  6. Liang, C.; Lin, S.; Liu, G. Study on the Preparation of biochar ceramsite based on sewage sludge and the characterization of its properties. Appl. Sci. 2021, 11, 5522. [Google Scholar] [CrossRef]
  7. Tang, K.; An, H.; Liu, C.; Li, Y.; Jia, L.; Tang, Y.; Wang, Q.; Jiang, Y.; Song, Z. Safety and environmental protection application of high performance solid waste unburned ceramsite and its lightweight high strength concrete. Sustain. Chem. Pharm. 2024, 40, 101611. [Google Scholar] [CrossRef]
  8. Sugden, A.M. Plants, soils, and climate. Science 2019, 366, 197. [Google Scholar]
  9. Schwarzel, K.; Renger, M.; Sauerbrey, R.; Wessolek, G. Soil physical characteristics of peat soils. J. Plant Nutr. Soil Sci. 2002, 165, 2–8. [Google Scholar] [CrossRef]
  10. Du, T.; Wang, D.; Bai, Y.; Zhang, Z. Optimizing the formulation of coal gangue planting substrate using wastes: The sustainability of coal mine ecological restoration. Ecol. Eng. 2020, 143, 105669. [Google Scholar] [CrossRef]
  11. Meng, G.; Luan, D.; Tai, Z.; Deng, J.; Han, J.; Zhou, Y. Effects of different substrate ratios on the growth and physiology of Sequoia sempervirens container seedlings. Compos. Sci. Util. 2019, 27, 169–177. [Google Scholar] [CrossRef]
  12. Li, J.; Zhao, Y.; Shao, X.; Huang, D.; Shang, J.; Li, H.; He, Y.; Liu, K. The mixed addition of biochar and nitrogen improves soil properties and microbial structure of moderate-devere fegraded alpine grassland in Qinghai-Tibet plateau. Front. Plant Sci. 2021, 12, 765041. [Google Scholar]
  13. Mengqi, Z.; Shi, A.; Ajmal, M.; Ye, L.; Awais, M. Comprehensive review on agricultural waste utilization and high-temperature fermentation and composting. Biomass Convers. Biorefin. 2021, 13, 5445–5648. [Google Scholar] [CrossRef]
  14. Guo, Z.; Zhang, J.; Fan, J.; Yang, X.; Yi, Y.; Han, X.; Wang, D.; Zhu, P.; Peng, X. Does animal manure application improve soil aggregation? Insights from nine long-term fertilization experiments. Sci. Total Environ. 2019, 660, 1029–1037. [Google Scholar] [CrossRef] [PubMed]
  15. Arif, M.; Ali, S.; Ilyas, M.; Riaz, M.; Akhtar, K.; Ali, K.; Adnan, M.; Fahad, S.; Khan, I.; Shah, S.; et al. Enhancing phosphorus availability, soil organic carbon, maize productivity and farm profitability through biochar and organic-inorganic fertilizers in an irrigated maize agroecosystem under semi-arid climate. Soil Use Manag. 2021, 37, 104–119. [Google Scholar] [CrossRef]
  16. Zhang, S.; Wang, Y.; Shen, Q. Influence of straw amendment on soil physicochemical properties and crop yield on a consecutive mollisol slope in northeastern China. Water 2018, 10, 559. [Google Scholar] [CrossRef]
  17. Valani, G.P.; Vezzani, F.M.; Cavalieri-Polizeli, K.M.V. Soil quality: Evaluation of on-farm assessments in relation to analytical index. Soil Tillage Res. 2020, 198, 104565. [Google Scholar] [CrossRef]
  18. Shi, Z.; Bai, Z.; Guo, D.; Chen, M. Develop a soil quality index to study the results of Black Locust on soil quality below different allocation patterns. Land 2021, 10, 785. [Google Scholar] [CrossRef]
  19. DB22 T 2073-2014; Jilin Provincial Bureau of Quality and Technical Supervision. Technical Specification for Safety Production Standardization of Small and Micro Industrial Enterprises. Jilin Provincial Bureau of Quality and Technical Supervision: Changchun, China, 2014; pp. 2–9.
  20. Chen, F.Y. High yield cultivation techniques for corn in Youjiang District, Baise City. South China Agric. 2025, 19, 37–39. [Google Scholar]
  21. Bao, S.D. Soil and Agricultural Chemistry Analysis, 3rd ed.; Chinese Agriculture Publishing House: Beijing, China, 2008; pp. 14–245. [Google Scholar]
  22. Lu, Y.; Cong, P.; Kuang, S.; Tang, L.; Li, Y.; Dong, J.; Song, W. Long-term excessive application of K2SO4 fertilizer alters bacterial community and functional pathway of tobacco-planting soil. Front. Plant Sci. 2022, 13, 1005303. [Google Scholar] [CrossRef]
  23. Qiao, J.; Zhu, Y.; Jia, X.; Huang, L.; Shao, M. Vertical distribution of soil total nitrogen and soil total phosphorus in the critical zone on the Loess Plateau, China. Catena 2018, 166, 310–316. [Google Scholar] [CrossRef]
  24. Ke, W.; Li, C.; Zhu, F.; Luo, X.; Feng, J.; Li, X.; Jiang, Y.; Wu, C.; Hatrley, W.; Xue, S. Effect of potentially toxic elements on soil multifunctionality at a lead smelting site. J. Hazard. Mater. 2023, 454, 131525. [Google Scholar] [CrossRef] [PubMed]
  25. NY T 1121.6-2006; Ministry of Agriculture of the People’s Republic of China. Soil Testing—Part 6: Method for Determination of Soil Organic Matter. Standards Press of China: Beijing, China, 2006; pp. 1–3.
  26. Tang, J.; Zhang, C.; Liu, X.; Wu, X.; Zhang, Y.; Zhang, T.; Xia, R.; Zhong, K. The fate of Cd in soils with various particle sizes: Characteristics, speciation distribution and influencing factors. Bull. Environ. Contam. Toxicol. 2024, 113, 60. [Google Scholar] [CrossRef] [PubMed]
  27. Ren, C.; Liu, K.; Dou, P.; Li, J.; Wang, K. The changes in soil microorganisms and soil chemical properties affect the heterogeneity and stability of soil aggregates before and after grassland conversion. Agriculture 2022, 12, 307. [Google Scholar] [CrossRef]
  28. Zhang, Y.; Chen, T.; Zhang, Y.; Ren, W. Deep Rock Mechanics: From Research to Engineering, 1st ed.; CRC Press: London, UK, 2018; pp. 483–487. [Google Scholar]
  29. Chen, G.; Liu, Y.; Yao, H.; Huang, C. An extraction method for measuring soil microbial biomass C. Acta Pedol. Sin. 2006, 6, 981–988. [Google Scholar]
  30. Yu, P.; Liu, S.; Zhang, L.; Zhou, D. Selecting the minimum data set and quantitative soil quality indexing of alkaline soils under different land uses in northeastern China. Sci. Total Environ. 2018, 616, 564–571. [Google Scholar] [CrossRef]
  31. GB 15618-2018; China Environmental Publishing Group. Soil Environmental Quality—Risk Control Standard for Soil Contamination of Agricultural Land. Standards Press of China: Beijing, China, 2018; pp. 1–3.
  32. GB 2762-2022; National Health Commission of the People’s Republic of China. National Food Safety Standard—Maximum Levels of Contaminants in Foods. Standards Press of China: Beijing, China, 2022; pp. 1–12.
  33. Zhang, M.; Riaz, M.; Zhang, L.; El-Desouki, Z.; Jiang, C. Biochar induces changes to basic soil properties and bacterial communities of different soils to varying degrees at 25 mm rainfall: More effective on acidic soils. Front. Microbiol. 2019, 10, 1321. [Google Scholar] [CrossRef]
  34. Brindhadevi, K.; Chinnathambi, A.; Obaid, S.A. An investigation on the conversion of infertile soil into fertile soil using crop waste as a remedial (compost) approach and its influence on Vigna mungo biometric and biomolecule profile. Environ. Res. 2024, 258, 119351. [Google Scholar] [CrossRef]
  35. Song, W.; Shu, A.; Liu, J.; Shi, W.; Li, M.; Zhang, W.; Li, Z.; Liu, G.; Yuan, F.; Zhang, S.; et al. Effects of long-term fertilization with different substitution ratios of organic fertilizer on paddy soil. Pedosphere 2022, 32, 637–648. [Google Scholar] [CrossRef]
  36. Mary, B.; Recous, S.; Darwis, D.; Robin, D. Interactions between decomposition of plant residues and nitrogen cycling in soil. Plant Soil 1996, 181, 71–82. [Google Scholar] [CrossRef]
  37. Wang, J.; Sun, N.; Xu, M.; Wang, S.; Zhang, J.; Cai, Z.; Cheng, Y. The influence of long-term animal manure and crop residue application on abiotic and biotic N immobilization in an acidified agricultural soil. Geoderma 2019, 337, 710–717. [Google Scholar] [CrossRef]
  38. Staley, Z.R.; Schmidt, A.M.; Woodbury, B.; Eskridge, K.M.; Durso, L.; Li, X. Corn stalk residue may add antibiotic-resistant bacteria to manure composting piles. J. Environ. Qual. 2020, 49, 745–753. [Google Scholar] [CrossRef] [PubMed]
  39. Qian, X.; Sun, W.; Gu, J.; Wang, X.; Zhang, Y.; Duan, M.; Li, H.; Zhang, R. Reducing antibiotic resistance genes, integrons, and pathogens in dairy manure by continuous thermophilic composting. Bioresour. Technol. 2016, 220, 425–432. [Google Scholar] [CrossRef] [PubMed]
  40. Lehmann, J.; Rillig, M.C.; Thies, J.; Masiello, C.A.; Hockaday, W.C.; Crowley, D. Biochar effects on soil biota—A review. Soil Biol. Biochem. 2011, 43, 1812–1836. [Google Scholar] [CrossRef]
  41. Steinbeiss, S.; Gleixner, G.; Antonietti, M. Effect of biochar amendment on soil carbon balance and soil microbial activity. Soil Biol. Biochem. 2009, 41, 1301–1310. [Google Scholar] [CrossRef]
  42. Tejada, M.; Sanchez-Monedero, M.A.; Gomez, I. Influence of particle size of municipal solid waste amendments and presence or absence of Eisenia fetidaon soil greenhouse gases emission. Commun. Soil Sci. Plant Anal. 2014, 45, 1214–1226. [Google Scholar] [CrossRef]
  43. Fang, Y.; Huang, H.; Wang, X.; Zhao, Y.; Gao, Y.; Cui, X. Effects of composite soil conditioner on soil properties and corn yield in a saline-alkali soil. Soil Use Manag. 2024, 40, e13095. [Google Scholar] [CrossRef]
  44. Xu, J.; Han, L.; Wu, L. Effects of exogenous organic materials on the yield of double cropping rice, soil fertility and soil quality. J. China Agric. Univ. 2024, 29, 23–32. [Google Scholar]
  45. Polakowski, C.; Sochan, A.; Ryżak, M.; Beczek, M.; Mazur, R.; Majewska, K.; Turski, M.; Bieganowski, A. Measurement of soil dry aggregate size distribution using the laser diffraction method. Soil Tillage Res. 2021, 211, 105023. [Google Scholar] [CrossRef]
  46. Zhou, M.; Liu, C.; Wang, J.; Meng, Q.; Yuan, Y.; Ma, X.; Liu, X.; Zhu, Y.; Ding, G.; Zhang, J.; et al. Soil aggregates stability and storage of soil organic carbon respond to cropping systems on black soils of northeast China. Sci. Rep. 2020, 10, 265. [Google Scholar] [CrossRef]
  47. Spohn, M.; Giani, L. Water-stable aggregates, glomalin-related soil protein, and carbohydrates in a chronosequence of sandy hydromorphic soils. Soil Biol. Biochem. 2010, 42, 1505–1511. [Google Scholar] [CrossRef]
  48. Kozlowski, T.; Ludynia, A. Permeability coefficient of low permeable soils as a single-variable function of soil parameter. Water 2019, 11, 2500. [Google Scholar] [CrossRef]
  49. Qin, T.; Wang, L.; Zhao, J.; Zhou, G.; Li, C.; Guo, L.; Jiang, G. Effects of Straw mulching thickness on the soil health in a temperate organic vineyard. Agriculture 2022, 12, 1751. [Google Scholar] [CrossRef]
  50. Matteo, T.D.; Bulletti, L.; Capecchi, E.; Viola, A.L.; Piccinino, D.; Piscopo, V. Perspectives of using lignin as additive to improve the permeability of in-situ soils for barrier materials in landfills. Sustainability 2020, 12, 5197. [Google Scholar] [CrossRef]
  51. Jiang, S.; Zhang, H.; Yang, D.; Hu, F.; Zou, Y.; Du, B.; Wu, Q.; Zhu, J. Effects of combined application of chemical and organic fertilizer on soil bulk density, pH, and carbon and nitrogen metabolism in ratooning rice fields. Chin. J. Eco-Agric. 2023, 31, 1053–1066. [Google Scholar]
  52. Mao, X.; Yang, Y.; Guan, P.; Geng, L.; Ma, L.; Di, H.; Liu, W.; Li, B. Remediation of organic amendments on soil salinization: Focusing on the relationship between soil salts and microbial communities. Ecotoxicol. Environ. Saf. 2022, 239, 113616. [Google Scholar] [CrossRef]
  53. Wu, Y.; Liu, R.; Si, W.; Zhang, J.; Yang, J.; Qiu, Z.; Luo, R.; Wang, Y. The growth and ion absorption of Sesbania (Sesbania cannabina) and Hairy Vetch (Vicia villosa) in saline soil under improvement measures. Plants 2024, 13, 3413. [Google Scholar] [CrossRef]
  54. Ma, J.; Saleem, M.H.; Yasin, G.; Mumtaz, S.; Qureshi, F.F.; Ali, B.; Ercisli, S.; Alhag, S.K.; Ahmed, A.E.; Vodnar, D.C.; et al. Individual and combinatorial effects of SNP and NaHS on morpho-physio-biochemical attributes and phytoextraction of chromium through Cr-stressed spinach (Spinacia oleracea L.). Front. Plant Sci. 2022, 13, 973740. [Google Scholar] [CrossRef]
  55. Gao, W.; Yan, D. Warming suppresses microbial biomass but enhances N recycling. Soil Biol. Biochem. 2019, 131, 111–118. [Google Scholar] [CrossRef]
Figure 1. (A) Changes in soil matrix microbial biomass carbon (MBC), soil matrix microbial biomass nitrogen (MBN), and (B) classification of soil aggregates under different treatments. CWM—unmodified civil-works mud, CK—CWM + normal fertilization, PM—CK + pig manure, PMB—CK + pig manure + biochar, PMC—CK + pig manure + corn straw. Different lowercase letters indicate significant differences between treatments (p < 0.05).
Agriculture 15 01056 g001
Figure 2. (A) Plant height, (B) yield and kernel-to-ear ratio under various treatments. CK—CWM + normal fertilization, PM—CK + pig manure, PMB—CK + pig manure + biochar, PMC—CK + pig manure + corn straw. Different lowercase letters indicate significant differences between treatments (p < 0.05).
Agriculture 15 01056 g002
Figure 3. Correlation heat map between soil matrix indicators and yield. SOM—soil organic matter, TN—total nitrogen, AN—alkaline nitrogen, TP—total phosphorus, AP—available phosphorus, AK—available potassium, EC—electrical conductivity, BD—bulk density, MWD—mean weight diameter, GMD—geometric mean diameter, PC—permeability coefficient, MBC—microbial biomass carbon, MBN—microbial biomass nitrogen.
Agriculture 15 01056 g003
Figure 4. Calculated soil quality index (SQI) values based on total data set (TDS) and minimum data set (MDS). CWM—unmodified civil-works mud, CK—CWM + normal fertilization, PM—CK + pig manure, PMB—CK + pig manure + biochar, PMC—CK + pig manure + corn straw. Different lowercase letters are significantly different among treatments (p < 0.05).
Agriculture 15 01056 g004
Figure 5. The linear regression analysis of crop yield and SQI. SQI—soil quality index, TDS—total data set, MDS—minimum data set.
Agriculture 15 01056 g005
Table 1. The dosage of organic amendments under various treatments.
TreatmentDosage
CKwithout any organic amendments
PM22,500 kg/ha of pig manure
PMB16,875 kg/ha of pig manure + 4950 kg/ha of biochar
PMC16,875 kg/ha of pig manure + 7200 kg/ha of corn straw
Note: CK—CWM + normal fertilization, PM—CK + pig manure, PMB—CK + pig manure + biochar, PMC—CK + pig manure + corn straw.
Table 2. Physical and chemical properties of the soil matrix under various treatments.
IndicatorsCWMCKPMPMBPMCANOVA
p
SOM (g/kg)2.47 ± 0.04 d2.29 ± 0.03 e6.23 ± 0.09 a5.35 ± 0.09 c5.66 ± 0.04 b<0.01
TN (g/kg)0.25 ± 0.02 d0.34 ± 0.02 c0.42 ± 0.01 a0.38 ± 0.01 b0.38 ± 0.01 b<0.01
AN (mg/kg)0.38 ± 0.01 d6.83 ± 0.10 c11.25 ± 0.37 a7.56 ± 0.31 b7.43 ± 0.15 b<0.01
TP (g/kg)0.40 ± 0.02 c0.43 ± 0.01 bc0.45 ± 0.02 b0.53 ± 0.02 a0.49 ± 0.02 ab<0.01
AP (mg/kg)11.84 ± 0.31 c20.58 ± 0.31 b27.82 ± 0.64 a27.95 ± 0.88 a27.76 ± 1.02 a<0.01
AK (mg/kg)21.95 ± 1.49 d30.37 ± 1.91 c38.51 ± 2.06 b38.33 ± 2.27 b51.55 ± 2.79 a<0.01
pH8.54 ± 0.07 a8.11 ± 0.05 c8.21 ± 0.03 bc8.29 ± 0.06 b8.27 ± 0.05 b<0.01
EC (us/cm)521.78 ± 10.88 a232.99 ± 11.31 b141.41 ± 7.83 c123.83 ± 6.67 c134.00 ± 9.75 c<0.01
BD (g/cm3)1.63 ± 0.03 a1.56 ± 0.02 b1.45 ± 0.02 c1.41 ± 0.02 cd1.38 ± 0.02 d<0.01
MWD1.06 ± 0.01 c1.41 ± 0.02 b1.49 ± 0.02 a1.48 ± 0.01 a1.51 ± 0.01 a<0.01
GMD0.52 ± 0.01 c0.89 ± 0.02 b0.97 ± 0.03 a0.96 ± 0.02 a0.99 ± 0.01 a<0.01
PC (cm/d)6.40 ± 0.02 e25.57 ± 0.83 d121.54 ± 2.67 c130.75 ± 1.47 b142.56 ± 1.87 a<0.01
Note: Civil-works mud was used as soil matrix. The results are expressed as means (± standard deviation). SOM—soil organic matter, TN—total nitrogen, AN—alkaline hydrolyzable nitrogen, TP—total phosphorus, AP—available phosphorus, AK—available potassium, EC—electrical conductivity, BD—bulk density, MWD—mean weight diameter, GMD—geometric mean diameter, PC—permeability coefficient. CWM—unmodified civil-works mud, CK—CWM + normal fertilization, PM—CK + pig manure, PMB—CK + pig manure + biochar, PMC—CK + pig manure + corn straw. Values that share different lowercase letters within the same row are significantly different at p < 0.01.
Table 3. Contaminant content in corn.
IndicatorsCKPMPMBPMCLimit Value
Cd (μg/kg)25.53 ± 1.0318.03 ± 0.4212.47 ± 0.3417.70 ± 0.45<100
Hg (μg/kg)4.23 ± 0.263.86 ± 0.283.35 ± 0.163.96 ± 0.31<20
As (μg/kg)210.5 ± 15.3198.3 ± 16.7175.6 ± 13.5156.3 ± 12.8<500
Zn (mg/kg)26.96 ± 2.2427.69 ± 2.4925.36 ± 2.1526.26 ± 1.68<50
Pb (μg/kg)46.23 ± 3.5246.59 ± 3.8840.36 ± 2.9642.36 ± 3.45<200
Cr (mg/kg)0.36 ± 0.020.31 ± 0.020.28 ± 0.010.31 ± 0.01<1
Note: The results are expressed as means (±standard deviation). CK—CWM + normal fertilization, PM—CK + pig manure, PMB—CK + pig manure + biochar, PMC—CK + pig manure + corn straw. Cd—cadmium, Hg—mercury, As—arsenic, Zn—zinc, Pb—lead, Cr—chromium, Limit values refer to the National Food Safety Standard Limits of Contaminants in Food.
Table 4. PCA analysis results of soil matrix indicators.
IndicatorsPC1PC2CommunalityWeight (%)
SOM0.970.010.9411.90
TN0.790.500.872.82
AN0.680.600.825.81
TP0.770.250.664.12
AP0.880.460.995.12
AK0.870.210.815.56
pH−0.16−0.930.894.96
EC−0.78−0.620.9921.92
BD−0.92−0.230.918.44
MWD0.740.670.994.59
GWD0.750.650.984.63
PC0.980.140.9810.08
MBC0.220.940.925.18
MBN0.130.960.934.87
Eigenvalue7.774.90
Variance (%)55.5035.03
Cumulative variance (%)55.5090.53
Note: PC: principal component. Boldface factor loading values are considered highly weighted. Boldface and underlined loading values correspond to the soil matrix indicators included in the MDS. SOM—soil organic matter, TN—total nitrogen, AN—alkaline hydrolyzable nitrogen, TP—total phosphorus, AP—available phosphorus, AK—available potassium, EC—electrical conductivity, BD—bulk density, MWD—mean weight diameter, GMD—geometric mean diameter, PC—permeability coefficient, MBC—microbial biomass carbon, MBN—microbial biomass nitrogen.
Disclaimer/Publisher’s Note: The statements, opinions and data contained in all publications are solely those of the individual author(s) and contributor(s) and not of MDPI and/or the editor(s). MDPI and/or the editor(s) disclaim responsibility for any injury to people or property resulting from any ideas, methods, instructions or products referred to in the content.

