Abstract
Background: This research evaluated the metabolic and antioxidant activity in red, white, and yellow corn varieties cultivated in the Cotopaxi region. Methods: Colorimetric methods were used for the total phenolic content and total flavonoids, while the LC-MS method was used for the metabolic profile. Also, assays like ABTS, FRAP, and DPPH were used to determine their ability to neutralize free radicals and reduce oxidants. Results: Red corn contains a significantly higher level of natural bioactive compounds compared to other varieties. Phenolics and flavonoids are crucial in antioxidant capacity, contributing significantly to scavenging free radicals and reducing oxidants. Comparative analysis of the biological properties and bioactive compounds in these maize varieties provides treasured insights into the fitness ability advantages of consuming red corn, emphasizing the importance of phenolics and flavonoids in its antioxidant activity. Conclusions: Our findings suggest that red corn could offer greater health benefits compared to white and yellow corn, underscoring the importance of ongoing studies of the biological properties and bioactive compounds in different maize varieties.
1. Introduction
The genus Zea (Poaceae family), native to the American continent [1], is the most important representative of this genus, the maize (Zea mays L.), a grass that was domesticated around 9000 years ago [2], and it is indispensable in the global food industry, being the crop with the highest production volume and among the most sold and widely cultivated food [3]. Its current importance extends beyond the food sector; it is also used in the production of fuels and as a raw material in multiple industrial sectors [4]. The global economic relevance of maize cultivation is among the largest in the agricultural sector. In Ecuador, about 1.4 million tons of maize were produced in 2021, ranking 43rd globally among producers that year [5]. According to data from the Ministry of Agriculture and Livestock, the province of Cotopaxi is an important producer of highland maize, where around 8.845 hectares of dry maize are cultivated, with a production of around 0.94 t/ha, and where the cultivation of soft maize reaches around 2776 hectares, with an average yield of 2.56 t/ha [6].
Maize holds millennial cultural value in Ecuador and other countries in the Andean and Mesoamerican regions. Its cultivation has been key to the survival of countless human populations in the history of this region and has become part of the worldview and folklore of its inhabitants [7]. Maize has been used in rituals and celebrations as an offering; it is also the main ingredient in the preparation of foods and beverages of ceremonial importance, such as chicha, which remains significant in the social life of American populations even today [8]. Maize has diversified as it has been distributed across the American continent and the world, experiencing changes in its genome and morphology. To define a distinct variety, a group of closely related specimens sharing sufficient morphological and genetic characteristics that distinguish this population from others is considered [9]. In various regions, maize varieties have been adapted to different cultivation environments. Additionally, through various genetic improvement techniques, new lines have been developed to meet current industry requirements. The most widely cultivated varieties worldwide have been developed to achieve higher yields or to be resistant to hostile cultivation conditions, pests, and pesticides [10]. Breeding techniques have not been employed in the same way to develop varieties to produce different metabolites or in higher concentrations, despite having potential nutritional and pharmacological applications. Secondary metabolites present in plants have been used in multiple industries, one of which is the pharmaceutical industry, because some metabolites generate therapeutic effects for humans. Free radicals, together with reactive oxygen species, generate oxidative processes at the cellular level, accelerating tissue aging and increasing the frequency of disease occurrence. The biochemical properties of antioxidants and their affinity for ROS and free radicals allow them to react with these substances and prevent their harmful effects on cells [11]. The consumption of carotenoids and phenolic compounds present in corn kernels has beneficial health effects and they could be used as drugs and supplements [12]. These secondary metabolites, including phenolic acids (such as gallic acid and caffeic acid) and flavonoids (such as quercetin), are known for their antioxidant properties and have been studied for their therapeutic potential. Despite the research carried out (biochemical variability depending on climatic conditions [13]), gaps in knowledge are identified, such as the lack of in-depth information on the genetic and metabolic resources of Ecuador’s endemic maize populations. There is a demand for studies characterizing the metabolic profiles and evaluating the antioxidant capacity of local maize varieties, many of which have small populations at risk of disappearing.
This article presents a comparative assessment of the biological properties and natural bioactive compounds in white, red, and yellow maize varieties cultivated in the Cotopaxi region. We investigate the metabolic profile of each variety, evaluating their antioxidant characteristics and potential as sources of health-beneficial bioactive compounds. This assessment aims to determine their possible use as nutraceuticals, thereby exploiting their therapeutic potential. Furthermore, this research paves the way for innovative uses of this abundant and diverse Ecuadorian resource in the development of drugs and other products.
2. Materials and Methods
Mature ears of Z. mays, including white, red, and yellow varieties, were harvested from two distinct locations within the Cotopaxi region to capture the diversity of environmental conditions. The first set of samples was gathered from the Chinchil neighborhood in Robayos, situated at 3080 m.a.s.l., where average temperatures range from 10 to 17 °C. The second group of samples was collected from the Alaques area, positioned at 2860 m above sea level (coordinates: 0°50′37.6″ S, 78°35′15.5″ W), with a slightly warmer temperature range of 15 to 20 °C. These sites were selected to explore the potential influence of varying climatic and altitudinal conditions on the antioxidant capacity and secondary metabolite composition of the maize varieties under study.
The methodology for compound extraction was based on the protocol outlined by Claros (2021) [14], with modifications to suit the maize varieties studied.
Fresh, ripe kernels of white, red, and yellow varieties of Z. mays were ground directly using a mortar and pestle to produce fine flour while still moist. This method was employed to preserve the heat-sensitive bioactive compounds. Precisely 1 g of wet flour was measured with an analytical balance, macerated in 96% ethanol (10 mL), mixed manually with a glass rod, and kept at 5 °C for 72 h to ensure complete extraction of bioactive compounds. The extraction was performed in triplicate, and the absorbance was determined with a UV-Vis spectrophotometer.
The phenolic content in white, red, and yellow maize varieties was analyzed after the Folin–Ciocalteu method, adapted from López-Froilán et al. (2018) [15]. The extracts (0.4 mL) were combined with Folin–Ciocalteu reagent (2 mL) diluted to 10% (v/v) and 7.5% sodium carbonate (1.6 mL) and kept for 30 min at room temperature. The absorbance was recorded at 765 nm using a UV-Vis spectrophotometer. The calibration curve was performed based on gallic acid solutions (0–250 mg/L), with the results being expressed as milligrams of gallic acid equivalents per liter (mg GAE/L). All assays were performed in triplicate, and a blank was prepared by substituting the sample with ethanol.
In addition, the flavonoid content of maize extracts was determined through a colorimetric assay involving aluminum chloride complexation, following Pekal et al. (2014) [16]. A volume of 1 mL of each extract was mixed with 1.5 mL solvent, 100 µL 1 M sodium acetate (CH3COONa), 100 µL 10% (v/v) aluminum chloride, and 2.3 mL distilled water. The mixtures were kept at room temperature for 40 min, and their absorbance was measured at 435 nm. Quercetin solutions (0–1.5 mg/L) were used to make the calibration curve, with results expressed as milligrams of quercetin equivalents per liter (mg QE/L). These analyses provided insight into the antioxidant potential and secondary metabolite profiles of the maize varieties under different cultivation conditions.
The antioxidant capacity of white, red, and yellow maize varieties was assessed using three complementary assays: FRAP, DPPH, and ABTS for a complete assessment of the antioxidant capability of the maize varieties studied, highlighting their capacity to scavenge free radicals and reduce metal ions under different conditions.
The FRAP assay (the reduction of Fe3+ to Fe2+) was conducted using Rajurkar et al.’s (2011) methodology [17], which consists of the preparation of FRAP reagent by using 300 mM acetate buffer (pH 3.6), 40 mM HCl, and 20 mM FeCl3 · 6 H2O. To perform the FRAP assay, maize extract (100 µL) was mixed with distilled water (300 µL) and prepared FRAP solution (3 mL). The reaction mix was kept at room temperature for 30 min, and the absorbance was measured with a spectrophotometer at 593 nm. The calibration curve based on FeSO4 × 7H2O concentrations (0–5 mM) yielded the equation y = 0.5981x − 0.0082 with R2 = 0.9989.
The DPPH assay, which evaluates the scavenging activity of antioxidants against the DPPH radical, was adapted from Sachett et al. (2021) [18] and Thaweesang (2019) [19]. The reaction mixture consisted of 2 mL DPPH stock solution (1 µg L−1), and maize extract (0.1 mL) was kept in the dark for 30 min at room temperature; the absorbance was measured at 517 nm.
The approach of Kuskoski et al. (2005) [20] was followed to perform the ABTS assay, which consists of the generation of ABTS•+ radical and its adjustment to an absorbance of 0.7 ± 0.1 at 754 nm. A mixture of 2 mL of ABTS solution and 20 µL of maize extract was kept for 7 min in the dark, and the absorbance was recorded at 754 nm. As a positive control, Trolox was used, with the results being expressed in Trolox equivalents (TE).
For the examination of the interested compounds present in maize varieties, a liquid chromatography–mass spectrometry approach was implemented, following modifications to the methodology outlined by Tohma et al. (2016) [21]. The ethanolic extracts used for LC-MS were represented by 1 g of lyophilized maize and 20 mL of 80% ethanol, incubated at 30 °C for 2 h [22]. After extraction, the samples were centrifuged (5000 rpm) at 4 °C for 10 min, followed by filtration and ethanol removal at 30 °C through rotary evaporation. The processed extracts were kept at −20 °C.
A Vanquish HPLC unit (Thermo Fisher Scientific, Waltham, MA, USA) coupled with an Ion Trap mass spectrometer was used. An Accucore Vanquish column (150 × 2.1 mm), maintained at 35 °C, with a flow rate of 0.5 mL/min, was used for chromatographic separation [23]. A 10 µL injection of 0.1% formic acid solution was employed as the mobile phase. The metabolites were determined by comparing mass spectra and retention times with ions from standard solutions and reference databases such as PubChem, ChEBI, Metlin, and HPLC repositories. All analysis and identification were performed using MZmine 2.53 software and scientific literature [24].
Statistical Analysis
Statistical analyses were carried out using RStudio software (R version 4.3.2). Data were analyzed by two-factor ANOVA, and significant differences among maize varieties (white, red, and yellow) were determined using Tukey’s test (p < 0.05). All experiments were executed in triplicate, and the results are expressed as mean values accompanied by their respective standard deviations (SD). Pearson’s correlation was applied to explore the relationship between secondary metabolites and antioxidant capacity.
3. Results
The bioactive compounds represented by the total phenolic content (TPC) and total flavonoid content (TFC) showed variation between the maize varieties analyzed. White maize showed an average TPC of 1.766 ± 0.094 mg GAE g−1 DW and an average TFC of 0.285 ± 0.015 mg CE g−1 DW. Yellow maize exhibited higher values, with an average TPC of 1.804 ± 0.046 mg GAE g−1 DW and an average TFC of 0.419 ± 0.019 mg CE g−1 DW. In contrast, red maize presented the widest variability, with an average TPC of 1.985 ± 0.444 mg GAE g−1 DW and an average TFC of 0.300 ± 0.025 mg CE g−1 DW (Figure 1). These results suggest that yellow maize accumulates higher levels of phenolic and flavonoid compounds than white and red varieties, potentially reflecting genetic and metabolic differences.
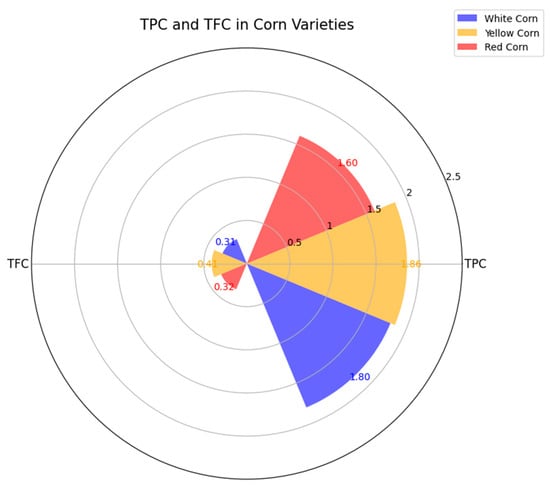
Figure 1.
Radar plot showing the values of bioactive compounds in different corn varieties (white, yellow, and red corn). The data illustrate variations in TPC and TFC among the corn varieties, with red corn showing the highest TPC, while white corn has the highest TFC. Values are based on average measurements for each variety, highlighting distinct antioxidant profiles.
The antioxidant capacity of the maize varieties was analyzed using three complementary methods: ABTS, FRAP, and DPPH. Among the white maize samples, the average antioxidant activity levels were 6.921 ± 0.484 µmol Trolox g−1 DW (ABTS), 5.309 ± 0.375 µmol Fe2+ g−1 DW (FRAP), and 5.871 ± 0.498 µmol Trolox g−1 DW (DPPH). Yellow maize demonstrated slightly higher values, with averages of 6.487 ± 0.565 µmol Trolox g−1 DW (ABTS), 5.538 ± 0.474 µmol Fe2+ g−1 DW (FRAP), and 6.259 ± 0.342 µmol Trolox g−1 DW (DPPH). Red maize exhibited the highest variability, recording averages of 46.825 ± 3.161 µmol Trolox g−1 DW (ABTS), 8.842 ± 1.302 µmol Fe2+ g−1 DW (FRAP), and 17.283 ± 2.110 µmol Trolox g−1 DW (DPPH) (Figure 2). These results indicate that red maize possesses superior antioxidant capacity compared to white and yellow varieties, likely due to its higher levels of secondary metabolites. The trends observed align with those of the TPC and TFC, suggesting that antioxidant capability is sharply similar to the phenolics and flavonoids in these maize varieties.
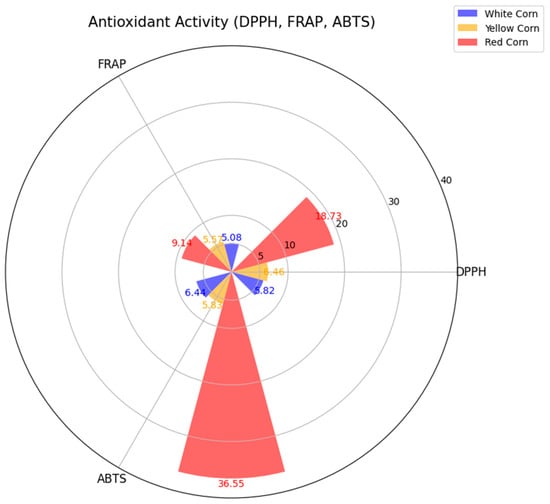
Figure 2.
FRAP, DPPH, and ABTS assays in white, yellow, and red corn. The radar chart represents the average antioxidant activity values for each corn type, highlighting significant differences across the methods. The data indicate higher antioxidant activity in red corn, particularly in the ABTS assay, compared to white and yellow corn. Values are based on triplicate measurements for each sample.
Significant and strong relationships between the total phenolic content (TPC) and antioxidant capacity in corn species were observed. A high correlation was identified between ABTS and the TPC (r = 0.636), indicating an important relationship between these antioxidant capacities. However, notable negative correlations were also identified, such as between the TPC and TFC (r = −0.284) and between the TFC and ABTS (r = −0.448), suggesting that the total flavonoid content may not be directly associated with certain antioxidant capacities. Additionally, very strong correlations were found between FRAP and DPPH (r = 0.995), FRAP and ABTS (r = 0.912), and DPPH and ABTS (r = 0.894), highlighting that phenolic compounds play a key role in the antioxidant capacity of these corn samples (Figure 3).
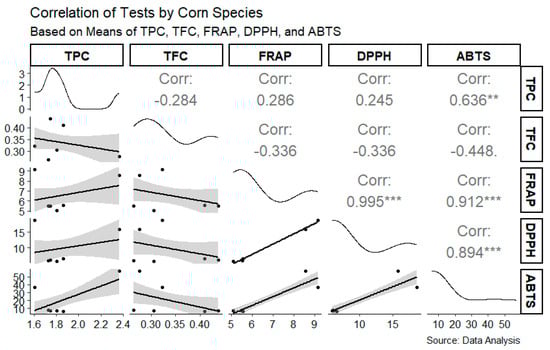
Figure 3.
Correlation matrix between bioactive compounds (TPC, TFC) and antioxidant capacity (FRAP, DPPH, ABTS) in corn species. Correlation coefficients (r) are displayed in each cell of the matrix, with statistical significance indicated by asterisks (** medium correlation, *** strong correlation). The plot includes density distributions along the diagonal and scatterplots with regression lines for each pairwise comparison. Data were analyzed based on mean values for each variable.
LC-MS was used to identify bioactive and metabolic compounds in white, red, and yellow maize varieties cultivated in the Cotopaxi region, by molecular mass and retention times. In this way, a diverse range of significant compounds across all maize types was revealed. In yellow corn, key compounds included daphnetin, arginine, biotin, and abscisic acid, with notable antioxidants such as pelargonidin-3-O-glucoside and sinigrin hydrate (Table 1). White corn presented metabolites like L-tryptophan, feruloylputrescine, and N1, N10-bis(p-coumaroyl) spermidine (Table 2, Figure 4). Red corn exhibited high levels of phenolic derivatives, including diferuloyl putrescine, p-coumaroyl caffeoyl spermidine, and bis-ferulamidobutane (Table 3, Figure 5, Figure 6 and Figure 7).

Table 1.
Compounds identified in yellow corn.
Table 2.
Bioactive and metabolic compounds identified in white corn crops from Cotopaxi Province using HPLC-MS.
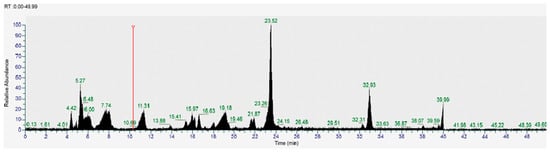
Figure 4.
HPLC-MS chromatogram (positive ions) of yellow corn from the Cotopaxi region. The chromatogram displays the retention times and corresponding molecular ion peaks of various bioactive compounds identified in the sample. Vertical axis: relative absorbance, horizontal axis: time (minutes), NL: 1.11 × 10⁶, Base Peak m/z = 50.00–2000.00 MS, MA_F6.
Table 3.
Compounds identified in red corn.
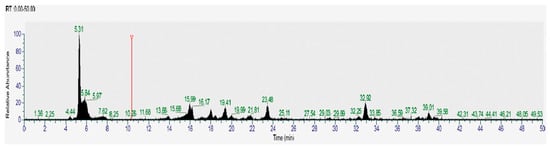
Figure 5.
HPLC-MS chromatogram (negative ions) of yellow corn from the Cotopaxi region. The chromatogram displays the retention times and corresponding molecular ion peaks of various bioactive compounds identified in the sample. Vertical axis: relative absorbance, horizontal axis: time (minutes), NL: 1.0 × 10⁶, Base Peak m/z = 50.00–2000.00 MS, MA_N10.
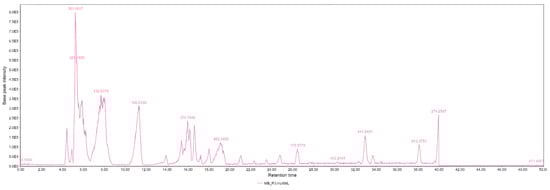
Figure 6.
HPLC-MS chromatogram of white corn from the Cotopaxi region. The chromatogram displays the retention times and corresponding molecular ion peaks of various bioactive compounds identified in the sample. Key peaks represent different bioactive metabolites, which contribute to the biochemical profile of white corn. The data obtained from the HPLC-MS analysis help to identify compounds associated with the antioxidant and metabolic properties of this maize variety.
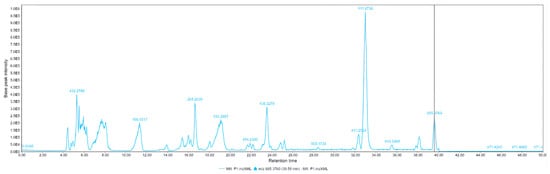
Figure 7.
HPLC-MS chromatogram of red corn from the Cotopaxi region. The chromatogram illustrates the retention times and molecular ion peaks of various bioactive compounds identified in the sample. Prominent peaks correspond to phenolic derivatives such as diferuloyl putrescine, p-coumaroyl caffeoyl spermidine, and bis-ferulamidobutane, which contribute to the antioxidant properties of red corn. This profile highlights the richness of secondary metabolites present in this maize variety.
Among these, a substantial portion of the identified metabolites included phenolic acids, amino acids, and flavonoids, all of which are known for their antioxidant and health-promoting properties. The identified compounds underscore the biochemical complexity of these maize varieties and highlight their potential antioxidant capacity, likely resulting from the synergistic interplay of a couple of metabolites. These findings emphasize the potential of yellow, red, and white maize as valuable sources of natural antioxidants and bioactive compounds, supporting their use in functional foods and nutraceutical applications.
4. Discussion
The variations observed in bioactive compounds, particularly phenolics and flavonoids, across white, yellow, and red corn varieties reflect inherent genetic and metabolic differences that influence the accumulation of secondary metabolites. Yellow maize exhibited the highest total flavonoid content (TFC), which can be linked to the regulation of specific biosynthetic pathways. Flavonoid biosynthesis in maize is governed by a complex network of structural and regulatory genes, with studies identifying 21 key genes whose expression levels significantly impact flavonoid accumulation. Certain transcription factors may enhance flavonoid biosynthesis, contributing to the differences observed among maize varieties [25]. In contrast, red maize demonstrated the highest total phenolic content (TPC), suggesting a notable accumulation of phenolic compounds. This indicates that red maize may possess unique genetic factors or regulatory mechanisms favoring phenolic biosynthesis, as phenolics in maize are influenced by both genetic and environmental factors, with specific gene regulatory networks playing a critical role in phenolic metabolism [26]. The variability in TPC among red maize samples could stem from differential gene expression in the phenylpropanoid pathway, which drives phenolic compound synthesis [25].
The antioxidant activity of red, white, and yellow corn varieties, assessed through ABTS, FRAP, and DPPH assays, revealed distinct capacities to scavenge free radicals and reduce oxidants. Red maize consistently exhibited a superior antioxidant capacity across all methods, particularly in the ABTS assay, where it outperformed the white and yellow varieties. This enhanced activity is likely due to its elevated phenolic and flavonoid contents, as phenolic compounds contribute directly to the antioxidant potential by donating hydrogen atoms or electrons to neutralize free radicals [27]. Flavonoids, in turn, are pivotal due to their ability to chelate transition metals and mitigate oxidative damage [28]. These findings highlight the critical role of secondary metabolites in shaping the antioxidant profiles of maize varieties.
The trends in antioxidant activity aligned closely with the TPC and TFC, as phenolics and flavonoids are well-known contributors to reducing power and radical scavenging capacity. Yellow corn, for instance, displayed moderately higher FRAP and DPPH activity compared to white corn, reflecting its enhanced ability to reduce Fe3+ to Fe2+ and neutralize stable free radicals. This is consistent with prior research indicating that phenolic acids and flavonoids act synergistically to bolster the antioxidant activity of maize and other cereals [29]. Environmental factors, such as altitude, soil composition, and cultivation practices in the Cotopaxi region, may further influence the biosynthesis of these compounds, contributing to the observed differences among varieties [30]. The superior antioxidant activity of red maize across all assays underscores its potential as a valuable source of natural antioxidants, with variability within samples possibly reflecting genetic diversity or environmental adaptation affecting secondary metabolite production [27]. The notably high ABTS results suggest that red maize may contain phenolic compounds with exceptional electron-donating capacities, such as anthocyanins, which are recognized as key contributors to antioxidant capacity in pigmented maize [31].
The positive correlation between the TPC and antioxidant capacity, particularly with ABTS, aligns with evidence that phenolic compounds are primary drivers of antioxidant activity in maize and other crops. Phenolic acids and flavonoids exhibit robust radical scavenging capacity due to their ability to donate hydrogen atoms or electrons [28]. However, the negative correlations between the TPC and TFC, as well as between the TFC and ABTS, suggest a more intricate interplay between these secondary metabolites, potentially arising from structural differences and distinct antioxidant mechanisms of flavonoids compared to other phenolics. This complexity underscores the importance of differentiating between the total phenolic content and specific flavonoids when evaluating their antioxidant contributions [29]. The strong correlations between FRAP, DPPH, and ABTS assays further emphasize the central role of phenolics in maize antioxidant activity, as these methods—measuring reducing power and radical scavenging—are highly responsive to phenolic compounds [30]. The weaker or negative correlations with the TFC indicate that flavonoids may exert more specialized effects, such as metal chelation, rather than broadly contributing to reducing power or radical scavenging [29].
The identification of specific monomeric compounds via LC-MS, such as pelargonidin-3-O-glucoside in yellow corn and diferuloyl putrescine in red corn, provides deeper insight into their contributions to antioxidant activity. Pelargonidin-3-O-glucoside, a flavonoid in yellow maize, is renowned for its potent free radical scavenging capacity, likely enhancing DPPH performance [32]. Similarly, diferuloyl putrescine, a hydroxycinnamic acid derivative in red maize, is associated with antioxidant and anticarcinogenic properties, bolstering the cultivar’s ability to neutralize reactive oxygen species [32]. These observations suggest that, beyond total phenolic and flavonoid contents, the specific composition of monomeric metabolites significantly influences the antioxidant properties of these maize varieties.
LC-MS analysis unveiled a diverse array of compounds in white, red, and yellow maize from the Cotopaxi region, highlighting their biochemical complexity and potential health benefits. Key metabolites, including phenolic acids, amino acids, and flavonoids, underscore the nutritional and functional value of these varieties. Yellow maize showed significant levels of daphnetin, pelargonidin-3-O-glucoside, and sinigrin hydrate, known for their antioxidant and anti-inflammatory effects [32]. Red maize contained elevated levels of diferuloyl putrescine, p-coumaroyl caffeoyl spermidine, and bis-ferulamidobutane, linked to enhanced radical scavenging and potential anticarcinogenic benefits [32]. These findings position red and yellow maize as superior sources of natural antioxidants compared to white maize, likely due to their enriched phenolic profiles. The presence of abscisic acid and amino acids like arginine in yellow maize further highlights their roles in plant stress responses and human health, particularly in metabolic regulation [33].
The detection of compounds such as feruloylputrescine, N1, N10-bis(p-coumaroyl) spermidine, and bis-ferulamidobutane in white and red maize emphasizes the importance of hydroxycinnamic acid derivatives in their antioxidant capacity. These metabolites are well-documented for neutralizing reactive oxygen species and preventing oxidative damage in biological systems [28]. Additionally, the presence of trihydroxyflavone derivatives and orientin underscores the role of flavonoids in conferring health benefits, such as cardiovascular protection [27]. The variations in metabolite profiles among maize varieties suggest that distinct genetic and environmental factors, potentially modulated by agricultural practices in the Cotopaxi region, shape secondary metabolite biosynthesis.
5. Conclusions
This comparative study of red, white, and yellow maize varieties cultivated in the Cotopaxi region reveals that red maize exhibits a significantly higher antioxidant capacity compared to the other varieties studied. This remarkable antioxidant potential of red maize is attributed to its higher content of phenolics and flavonoids, with a crucial role in neutralizing the free radicals and reducing oxidants. The results suggest that incorporating red maize into the diet could offer greater health benefits based on the content of natural bioactive compounds, emphasizing their importance in its antioxidant activity.
Furthermore, this study underscores the necessity of ongoing research into the biological properties and bioactive compounds of different maize varieties. The variation in phenolic and flavonoid contents among the varieties indicates that certain maize varieties, such as red maize, could be more beneficial from a nutritional health perspective.
Author Contributions
Conceptualization, R.A.M.; methodology, R.A.M.; formal analysis, D.O.C.R., D.A.T.J., R.F.V.G., C.D.B.T. and N.S.C.I.; investigation, D.O.C.R., D.A.T.J. and N.S.C.I.; resources, R.A.M.; writing—original draft preparation, R.A.M.; writing—review and editing, R.D.C.; supervision, R.A.M.; project administration, R.A.M.; funding acquisition, R.A.M. All authors have read and agreed to the published version of the manuscript.
Funding
This research was funded by Universidad de Las Fuerzas Armadas-ESPE, grant number CV-GNP-0066-2020, and the Institute of Biology Bucharest, Romanian Academy, RO1567-IBB06/2025.
Institutional Review Board Statement
Not applicable.
Informed Consent Statement
Not applicable.
Data Availability Statement
The original contributions presented in this study are included in the article; further inquiries can be directed to the corresponding author to uphold privacy.
Acknowledgments
The authors would like to express their sincere gratitude to the communities of Cotopaxi Province, particularly the members of Jatari Unancha College in Guasaganda, for their invaluable assistance during the plant collection process and to the Universidad de Las Fuerzas Armadas-ESPE for its financial support.
Conflicts of Interest
The authors declare no conflicts of interest. The funders had no role in this study's design; in the collection, analyses, or interpretation of data; in the writing of the manuscript; or in the decision to publish the results.
References
- Xu, G.; Zhang, X.; Chen, W.; Zhang, R.; Li, Z.; Wen, W.; Warburton, M.L.; Li, J.; Li, H.; Yang, X. Population genomics of Zea species identifies selection signatures during maize domestication and adaptation. BMC Plant Biol. 2022, 22, 72. [Google Scholar] [CrossRef] [PubMed]
- Costa, F.M.; Vidal, R.; de Almeida Silva, N.C.; Veasey, E.A.; de Oliveira Freitas, F.; Zucchi, M.I. Archaeological findings show the extent of primitive characteristics of maize in South America. Sci. Adv. 2024, 10, 9. [Google Scholar] [CrossRef]
- Erenstein, O.; Jaleta, M.; Sonder, K.; Mottaleb, K.; Prasanna, B.M. Global maize production, consumption and trade: Trends and R&D implications. Food Secur. 2022, 14, 1295–1319. [Google Scholar] [CrossRef]
- Ranilla, L.G. The application of metabolomics for the study of cereal corn (Zea mays L.). Metabolites 2020, 10, 300. [Google Scholar] [CrossRef]
- FAO. The State of Food and Agriculture 2021. Making Agrifood Systems More Resilient to Shocks and Stresses; FAO: Rome, Italy, 2021. [Google Scholar]
- Zambrano, J.; Garcés, S.; Villacrés, E.; Velásquez, J.; Cartagena, Y.; Pintado, P.; Peñaherrera, D.; Sangoquiza, C.; León, J.; López, V.; et al. Guía Para la Producción Sustentable de Maíz en la Sierra Ecuatoriana; INIAP: Quito, Ecuador, 2021; Volume 122, p. 148. [Google Scholar]
- Tanumihardjo, S.A.; McCulley, L.; Roh, R.; Lopez-Ridaura, S.; Palacios-Rojas, N.; Gunaratna, N.S. Maize agro-food systems to ensure food and nutrition security in reference to the Sustainable Development Goals. Glob. Food Sec. 2020, 25, 100327. [Google Scholar] [CrossRef]
- Sión Saltos, G.J.; Velásquez Campozano, M.R.; Rodríguez Pincay, I. La cosmovisión en torno al consumo de la chicha de maíz en Ecuador. Rev. Cien. Multi. Sapientiae 2024, 7, 111–127. [Google Scholar] [CrossRef]
- Ranilla, L.G.; Zolla, G.; Afaray-Carazas, A.; Vera-Vega, M.; Huanuqueño, H.; Begazo-Gutiérrez, H.; Chirinos, R.; Pedreschi, R.; Shetty, K. Integrated metabolite analysis and health-relevant in vitro functionality of white, red, and orange maize (Zea mays L.) from the Peruvian Andean race Cabanita at different maturity stages. Front. Nutr. 2023, 10, 1132228. [Google Scholar] [CrossRef]
- Jackson, D.; Tian, F.; Zhang, Z. Maize genetics, genomics, and sustainable improvement. Mol. Breed. 2022, 42, 2. [Google Scholar] [CrossRef]
- Nakai, K.; Tsuruta, D. What Are Reactive Oxygen Species, Free Radicals, and Oxidative Stress in Skin Diseases? Int. J. Mol. Sci. 2021, 22, 10799. [Google Scholar] [CrossRef]
- Sánchez-Nuño, Y.A.; Zermeño-Ruiz, M.; Vázquez-Paulino, O.D.; Nuño, K.; Villarruel-López, A. Bioactive Compounds from Pigmented Corn (Zea mays L.) and Their Effect on Health. Biomolecules 2024, 14, 338. [Google Scholar] [CrossRef]
- Ranilla, L.G.; Rios-Gonzales, B.A.; Ramírez-Pinto, M.F.; Fuentealba, C.; Pedreschi, R.; Shetty, K. Primary and Phenolic Metabolites Analyses, In Vitro Health-Relevant Bioactivity and Physical Characteristics of Purple Corn (Zea mays L.) Grown at Two Andean Geographical Locations. Metabolites 2021, 11, 722. [Google Scholar] [CrossRef]
- Claros, P. Evaluacion de la Capacidad Antioxidante Total y Contenido de Polifenoles Totales del Phaseolus vulgaris “Frijol”. Bachelor’s Thesis, Universidad Nacional José Faustino Sánchez Carrión, Huacho, Peru, 2021. Available online: https://repositorio.unjfsc.edu.pe/handle/20.500.14067/5297 (accessed on 19 January 2025).
- López-Froilán, R.; Hernández-Ledesma, B.; Cámara, M.; Pérez-Rodríguez, M. Evaluation of the Antioxidant Potential of Mixed Fruit-Based Beverages: A New Insight on the Folin-Ciocalteu Method. Food Anal. Met. 2018, 11, 2897–2906. [Google Scholar] [CrossRef]
- Pekal, A.; Pyrzynska, K. Evaluation of aluminum complexation reaction for flavonoid content assay. Food Anal. Met. 2014, 7, 1776–1782. [Google Scholar] [CrossRef]
- Rajurkar, N.S.; Hande, S.M. Estimation of phytochemical content and antioxidant activity of some selected traditional Indian medicinal plants. Indian J. Pharm. Sci. 2011, 73, 146–151. [Google Scholar] [CrossRef]
- Sachett, A.; Gallas-Lopes, M.; Conterato, G.M.M.; Herrmann, A.; Piato, A. Antioxidant Activity by DPPH Assay: In Vitro Protocol. Protocols Io. 2021. Available online: https://www.protocols.io/view/antioxidant-activity-by-dpph-assay-in-vitro-protocbtbpnimn (accessed on 3 September 2023).
- Thaweesang, S. Antioxidant activity and total phenolic compounds of fresh and blanching banana blossom (Musa ABB CV. Kluai “Namwa”) in Thailand. IOP Conf. Ser. Mat. Sci. Eng. 2019, 639, 012047. [Google Scholar] [CrossRef]
- Kuskoski, E.M.; Asuero, A.G.; Troncoso, A.M.; Mancini-Filho, J.; Fett, R. Aplicación de diversosmétodos químicos para determinar actividad antioxidante en pulpa de frutos. Food Sci. Technol. 2005, 25, 726–732. [Google Scholar] [CrossRef]
- Tohma, H.; Koksal, E.; Kılıc, O.; Alan, Y.; Yılmaz, M.A.; Gulcin, I.; Bursal, E.; Alwasel, S.H. RP-HPLC/MS/MS analysis of the phenolic compounds, antioxidant and antimicrobial activities of Salvia L. species. Antioxidants 2016, 5, 38. [Google Scholar] [CrossRef]
- Irakli, M.; Skendi, A.; Bouloumpasi, E.; Chatzopoulou, P.; Biliaderis, C.G. LC-MS identification and quantification of phenolic compounds in solid residues from the essential oil industry. Antioxidants 2021, 10, 2016. [Google Scholar] [CrossRef]
- Pluskal, T.; Castillo, S.; Villar-Briones, A.; Orešič, M. MZmine 2: Modular framework for processing, visualizing, and analyzing mass spectrometry-based molecular profile data. BMC Bioinform. 2010, 11, 395. [Google Scholar] [CrossRef]
- Cellier, G.; Moreau, A.; Chabirand, A.; Hostachy, B.; Ailloud, F.; Prior, P. A Duplex PCR Assay for the Detection of Ralstonia solanacearum Phylotype II Strains in Musa spp. PLoS ONE 2015, 10, e0122182. [Google Scholar] [CrossRef]
- Falcone Ferreyra, M.L.; Rius, S.P.; Casati, P. Maize flavonoid biosynthesis, regulation, and human health relevance: A review. Molecules 2022, 27, 5166. [Google Scholar] [CrossRef] [PubMed]
- Yang, F.; Jensen, J.D.; Svensson, B.; Jørgensen, H.J.L.; Collinge, D.B.; Finnie, C. A maize gene regulatory network for phenolic metabolism. Mol. Plant-Microbe Interact. 2017, 30, 443–455. [Google Scholar] [CrossRef] [PubMed]
- Shahidi, F.; Yeo, J.D. Bioactivities of phenolics by focusing on suppression of chronic diseases: A review. Int. J. Mol. Sci. 2018, 19, 1573. [Google Scholar] [CrossRef]
- Górnaś, P.; Juhnevica-Radenkova, K.; Lacis, G. Phenolic compounds as potential natural antioxidants in cereal-based foods: Insights into their composition, stability, and bioavailability. Antioxidants 2020, 9, 469. [Google Scholar] [CrossRef]
- Adom, K.K.; Liu, R.H. Antioxidant activity of grains. J. Agric. Food Chem. 2002, 50, 6182–6187. [Google Scholar] [CrossRef]
- Hossain, F.; Muthusamy, V. Biofortification of maize: An Indian perspective. Indian J. Genet. 2015, 75, 1–22. [Google Scholar]
- Salinas-Moreno, Y.; Valle-Guadarrama, S.; García-Salinas, C.; Velázquez-Cardelas, G.A. Anthocyanin distribution and color variation in maize (Zea mays L.) landraces. J. Cereal Sci. 2005, 41, 259–266. [Google Scholar]
- Zhao, D.; Shahidi, F.; Xiao, C. Phenolic profiles and antioxidant activities of yellow and red maize kernels. J. Agric. Food Chem. 2019, 67, 697–707. [Google Scholar] [CrossRef]
- Nakabayashi, R.; Saito, K. Integrated metabolomics for abiotic stress responses in plants. Curr. Opin. Plant Biol. 2015, 24, 10–16. [Google Scholar] [CrossRef]
Disclaimer/Publisher’s Note: The statements, opinions and data contained in all publications are solely those of the individual author(s) and contributor(s) and not of MDPI and/or the editor(s). MDPI and/or the editor(s) disclaim responsibility for any injury to people or property resulting from any ideas, methods, instructions or products referred to in the content. |
© 2025 by the authors. Licensee MDPI, Basel, Switzerland. This article is an open access article distributed under the terms and conditions of the Creative Commons Attribution (CC BY) license (https://creativecommons.org/licenses/by/4.0/).