Article

An OCRNet-Based Method for Assessing Apple Watercore in Cold and Cool Regions of Yunnan Province

1
College of Mechanical and Electrical Engineering, Kunming University of Science and Technology, Kunming 650500, China
2
Modern Postal College, Shijiazhuang Posts and Telecommunications Technical College, Shijiazhuang 050021, China
3
College of Mechanical and Electrical Engineering, Kunming University, Kunming 650214, China
4
School of Rail Transportation, Soochow University, Suzhou 215131, China
*
Authors to whom correspondence should be addressed.
Agriculture 2025, 15(10), 1040; https://doi.org/10.3390/agriculture15101040
Submission received: 29 March 2025 / Revised: 19 April 2025 / Accepted: 9 May 2025 / Published: 11 May 2025
(This article belongs to the Section Digital Agriculture)

Abstract

:
The content of the watercore in apples plays a decisive role in their taste and selling price, but there is a lack of methods to accurately assess it. Therefore, this paper proposes an OCRNet-based method for apple watercore content evaluation. A total of 720 watercores of apples from Mengzi, Lijiang, and Zhaotong City in Yunnan Province were used as experimental samples. An appropriate watercore extraction model was selected based on different evaluation indicators. The watercore feature images extracted using the optimal model were stacked, and the watercore content of apples in different regions was evaluated by calculating the fitted area of the stacked watercore region. The results show that the OCRNet model is optimal in all evaluation metrics when facing different datasets. The error of OCRNet is also minimized when extracting overexposed as well as underexposed images with 0.15% and 0.38%, respectively, and it can be used to extract the characteristics of the apple watercore. The evaluation result of the watercore content of apples in different regions is that Lijiang apples have the highest watercore content, followed by Mengzi apples, and Zhaotong apples have the least watercore content.

1. Introduction

During the ripening process of apples, dysregulation in sorbitol metabolism prevents its conversion to fructose in fruit cells [1,2]. This leads to the accumulation of sorbitol between fruit cells, resulting in the formation of translucent water stains that expand from the apple’s ventricle to its exterior, a phenomenon known as the “watercore” [3,4]. The extent of watercore formation significantly influences both the taste and market value of apples. When present in moderate amounts, the watercore can enhance the flavor of apples, thus allowing them to be sold at a higher price [5]. However, when the watercore is stored for a long time, the watercore will also gradually disappear, and it may even cause the phenomenon of rotting inside of the apple, resulting in the decrease of the apple’s edibility [6,7,8].
In recent years, the detection of the watercore in apples has been successfully achieved using various technologies, including optical features, electrical characteristics, near-infrared spectroscopy, and computer vision [9,10,11,12]. Yuan et al. [13] developed a predictive model for the sugar content of watercore apples based on near-infrared spectral data. They acquired near-infrared spectral curves of the watercores of Fuji apples in Aksu and used a sugar meter to collect quality data, thereby enabling real-time, non-destructive detection. Zhang et al. [14] analyzed the effect of different spectral detection methods on apple moldy heart disease by independently developing three spectral acquisition systems: diffuse reflectance, diffuse transmittance, and transmittance. However, these studies primarily focus on qualitative analysis of apple watercores and lack quantitative investigations into the watercore content within apples. For the detection of watercore content in apples, manual visual inspection remains the primary method. Tong et al. [15] assessed the watercore content by cutting the apples crosswise and observing the extent of watercore scattering along the radius in the cross-sectional profiles. However, due to the irregular distribution of the watercore, the human eye can only provide a rough estimate of its content. Zhang et al. [16] used near-infrared full transmission spectrum data to establish a model for classifying and evaluating the watercore content in apples. In that study, the cross-sectional image of apples was converted into a grayscale image, and the channel threshold segmentation method was applied to extract the watercore region. In the experiment to establish a regression prediction model for apple watercore content, Chang et al. [17] applied a traditional clustering decomposition algorithm to extract the watercore region from apple cross-sections and calculate the watercore content. Although these methods can successfully extract the watercore region, accurately separating the watercore from the part of the fruit that closely resembles the color of the core and the flesh remains challenging. This results in part of the fruit core being incorrectly classified as watercore, making it difficult to precisely measure the watercore content in the apple section [18].
Given the success of deep learning in a variety of image processing tasks, an increasing number of studies have focused on feature extraction using deep learning techniques [19,20,21]. Yu and Zhang [22] developed a pest detection model based on YOLOv5s, which demonstrates superior performance in detecting rice pests and diseases. Ni et al. [23] employed the DNLNet [24] network for medical image segmentation to enhance the accuracy of blood vessel segmentation. Ren et al. [25] proposed a remote sensing image open-pit extraction method based on the deep learning model of EMANet [26] and the Fully-Connected Conditional Random Field (FC-CRF) algorithm to extract open-pit mining areas from remote sensing images, effectively identifying open-pit mining regions. In recent years, research on the detection of watercore content in apple cross-sections has also increased. Peng and Cai [27] used the FCN model to extract the watercore region from apple cross-sections, achieving an average intersection-over-union of only 73.7%, as their model classified pixels independently without considering the interrelationships between pixels or incorporating spatial regularization. Yin et al. [28] used the BiSeNet [29] model for feature extraction of watercores in apple cross-sections, obtaining better extraction results. However, previous studies have not considered the actual factors affecting the extraction effect of the model, and there is a lack of a suitable method to accurately assess the content of apple watercores in different regions.
For feature extraction, two key aspects are resolution and contextual information. Higher resolution provides more detailed information, while contextual information enables the model to understand the relationships between a pixel and its surrounding pixels, allowing for better segmentation of continuous regions and more accurate boundary delineation. The main concept behind OCRNet is to use target region representations to enhance the pixel-level features and to incorporate contextual information through the features of the target region [30]. Rather than focusing solely on pixels at different spatial locations, OCRNet distinguishes context pixels belonging to the same object class from those of different object classes. This approach enhances the model’s ability to handle variations in image data caused by different lighting conditions. In practical applications. Jiang [31] applied a method based on the OCRNet [32] semantic segmentation model combined with HRNet for water body extraction, which achieved high accuracy in water body recognition.
Therefore, in this study, four network models, namely, OCRNet, FCN, BiSeNet, and the commonly used Deeplabv3P, were employed to extract watercore features from apple cross-sections, and the optimal watercore region extraction model was selected based on the commonly used evaluation indexes. Finally, the images containing watercore features extracted from the optimal model were stacked, and the watercore regions were fitted to assess the watercore content of apples from different regions. This study aims to identify a model that is less susceptible to lighting interference and demonstrates greater practicality in evaluating the watercore content of apples across different regions. The experimental results demonstrate that compared to other models, the OCRNet model achieved the best performance across all evaluation metrics, whether with a normal dataset or a complex dataset, making it the most suitable model for watercore region extraction. Furthermore, the evaluation of watercore content in apples from different regions revealed that apples from Lijiang had the highest watercore content, followed by those from Mengzi, while apples from Zhaotong had the lowest watercore content.

2. Materials and Methods

2.1. Data Preparation

A total of 720 watercore apples from three regions of Yunnan Province—Mengzi, Lijiang, and Zhaotong—were selected as experimental samples. Among these, 360 apples (120 from each region of Mengzi, Lijiang, and Zhaotong) were used for the optimal modeling of watercore extraction. The remaining 360 apples (120 from each region) were used to evaluate the watercore content. The apple samples used in the experiment were mature Fuji watercore apples, harvested by experienced fruit growers, with an average fruit diameter of approximately 85 mm. The apples were horizontally sliced to observe the watercore content in each cross-section. A Sony NEX-5T digital camera (Sony Corporation, Tokyo, Japan) was used to capture images of slices with higher watercore content. To ensure accurate watercore extraction, external factors that could interfere with the shooting process were minimized, and the background was kept uniform. Additionally, the focal length was maintained consistently to ensure that the apple cross-section remained centered in the image [33]. The camera parameters were adjusted during the photo-taking process to collect image data at three different exposure levels: normal exposure, underexposure, and overexposure. Finally, the captured image was cropped to a size of 512 × 512 px (pixels) to meet the size requirements specified in the training model configuration file. Figure 1 presents image data of the same apple watercore cross-section at different exposure levels. Because the cross-section of an apple watercore has the watercore as the main body and flesh as the background, the only difference between the watercore cross-sections of different apples is the amount of content in the watercore region and the location of the distribution of the watercore. Therefore, the model used in this study is applicable for feature extraction from cross-sections of apples from various regions.
The processed image data were divided into two datasets: data_1 and data_2. The data_1 dataset consists of 360 images of apple watercore cross-sections captured under normal exposure conditions. In contrast, the data_2 dataset includes 360 images captured under normal exposure, 360 images underexposed, and 360 images overexposed, resulting in a total of 1080 images. Based on the data partition ratios used in previous studies, the data_1 and data_2 datasets were divided into training, testing, and validation sets in an 8:1:1 ratio. The data_1 dataset was partitioned into 288 images for the training set, 36 images for the testing set, and 36 images for the validation set. The data_2 dataset was partitioned into 864 images for the training set, 108 images for the testing set, and 108 images for the validation set [28,34].

2.2. Data Annotation

Labelme is a widely used annotation tool in the field of computer vision, enabling users to mark key points and draw lines to label object contours or paths as needed. Its annotation interface is shown in Figure 2. In this study, the task involves semantic segmentation of the watercore region in the cross-section of an apple watercore, where only the watercore region is labeled. To delineate the watercore region from the rest of the section, a green line is used to form a closed loop around the watercore region. The labeled region is then named, while the unlabeled areas correspond to the core and the pulp. Upon completion of the labeling process, a JSON file is generated, which is subsequently converted into an image format required for model training, as shown in Figure 3.

2.3. Experimental Environment

The deep learning framework employed in this experiment is PaddlePaddle, which offers superior distributed training capabilities, significantly reducing model training time and improving overall training efficiency. The hardware environment is an Intel Core i7-12650H processor and an NVIDIA GeForce RT 4060 laptop GPU. Table 1 describes the specific parameter settings.

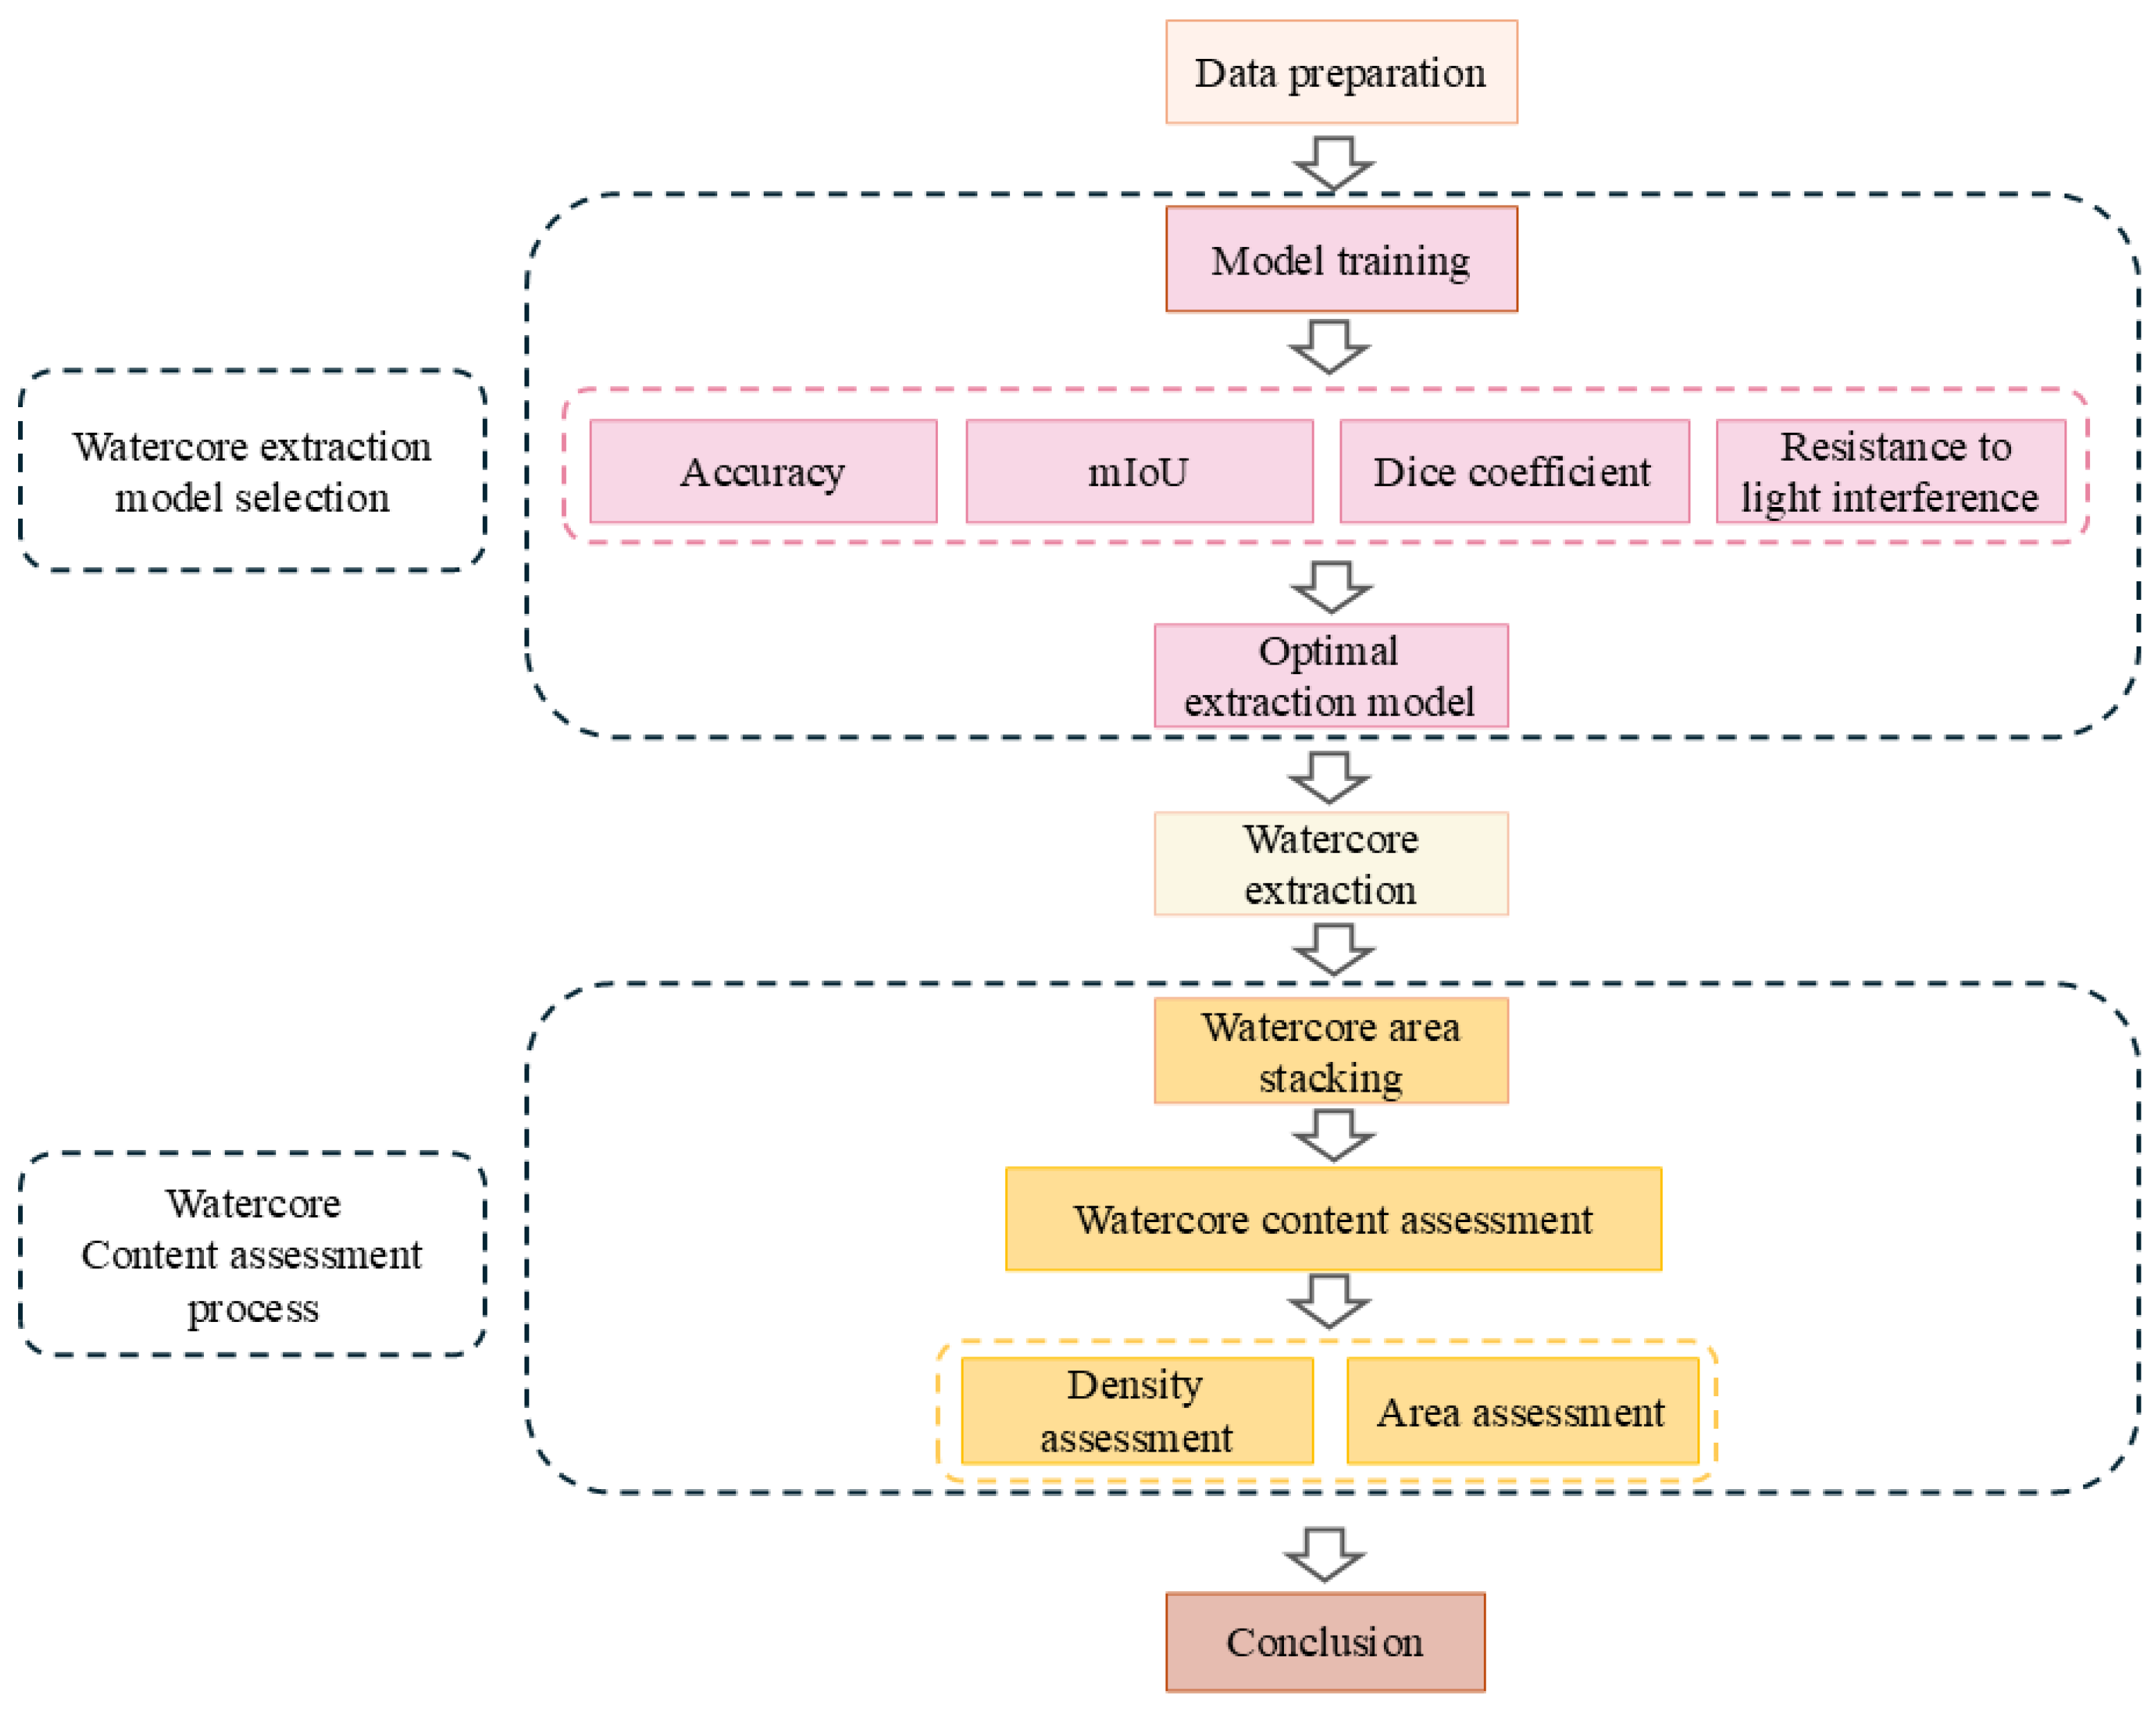
2.4. Experimental Method

2.4.1. Selection of Watercore Extraction Model

OCRNet, Deeplabv3P, FCN, and BiSeNet were employed to train semantic segmentation models for apple watercore slices across different datasets. The optimal watercore extraction model was selected based on a comparison of training accuracy, mean intersection-over-union (mIoU), and Dice coefficient across the different models. After fine-tuning the individual models, it was decided that all models would use uniform hyperparameters to ensure a consistent training environment for each model. This approach allows for more accurate evaluation of their performance differences. The specific parameters during training are shown in Table 2.

2.4.2. Evaluation of Watercore Content
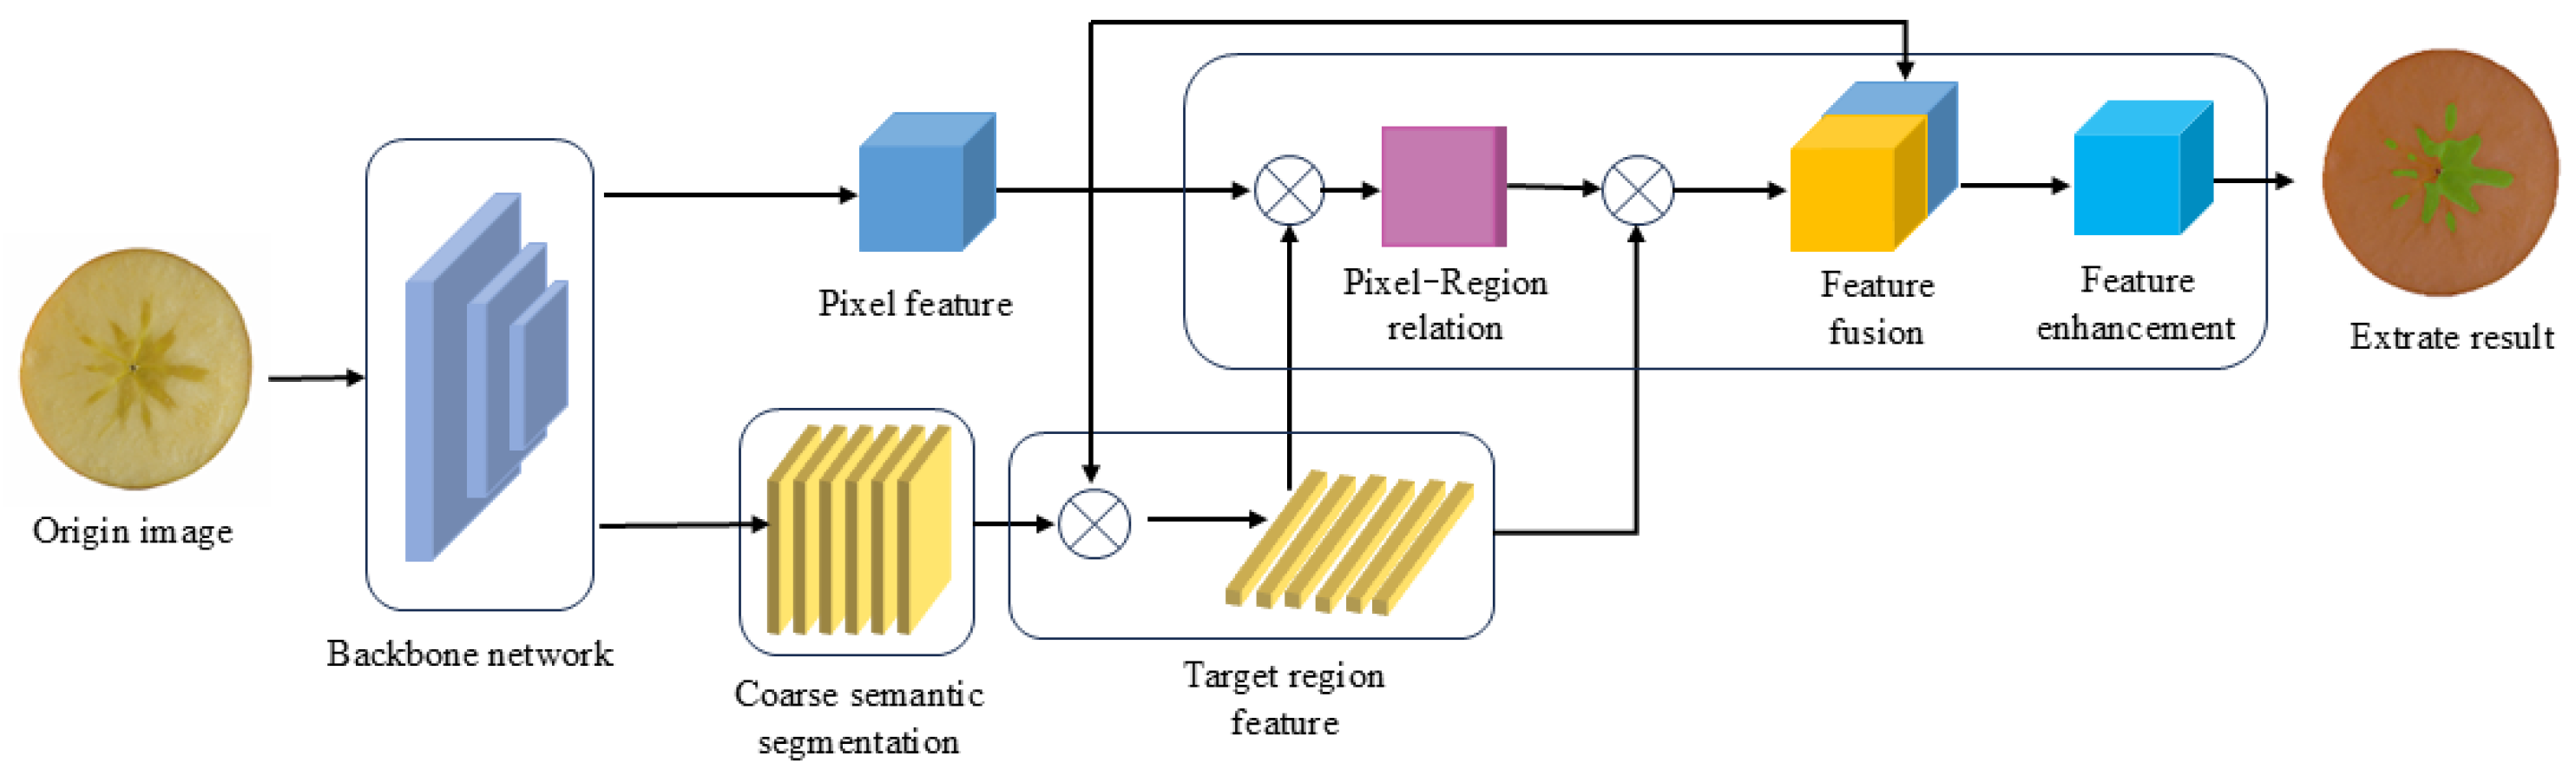
A total of 360 watercore apples from Zhaotong, Mengzi, and Lijiang in Yunnan were sliced. The cross-sections with the highest watercore content from each apple were selected, and the optimal extraction model was then applied to extract the watercore regions from each slice. The selected watercore cross-sections were stacked, and apple edge sections were also extracted from the selected slices. These edge images were subsequently stacked to generate an overall apple edge representation. Finally, the stacking diagrams of the watercore and the apple edge were superimposed to obtain the comprehensive distribution of the core within the apple cross-section (the stacking process was implemented using MATLAB R2022b). The watercore content was evaluated by calculating the watercore density and area in the stacked diagram. Figure 4 presents the experimental flow chart for selecting the optimal watercore extraction model and assessing the watercore content.

2.5. OCRNet Model

Figure 5 illustrates the main structure of the OCRNet network model. First, a coarse semantic segmentation result is generated by the backbone network, and pixel features are simultaneously extracted. Next, the region representation of the object, i.e., the features corresponding to each category, is computed based on the coarse segmentation result and the extracted pixel features. The similarity between the pixel features and the category features is then calculated, which allows for estimation of the probability that each pixel belongs to each category. We further weight the features of each region to obtain the contextual feature representation of the object. Finally, the contextual feature representation is fused with the pixel features to form the enhanced feature representation.

2.6. Model Evaluation Indicators

In deep learning, there are several metrics for evaluating the goodness of network models. In this experiment, four metrics, accuracy, mIoU, Dice coefficient, and resistance to light interference in different models, are used to evaluate the different models.
(1) Accuracy
In semantic segmentation tasks, each pixel is assigned a corresponding category label, and accuracy measures the agreement between the pixels predicted by the model and the true labels. The formula for calculating accuracy is as follows:
Acc = T P + T N T P + F P + T N + F N
(2) mIoU
The mIoU is a metric used to evaluate the segmentation performance of a model across different categories. It calculates the ratio of the intersection to the union between the predicted segmentation and the ground truth label, and then averages the values across all categories. A higher mIoU indicates better segmentation performance, meaning the model is more effective at distinguishing between different categories. The formula for calculating mIoU is as follows:
mIoU = 1 k + 1 i = 0 k T P F N + F P + T P
(3) Dice coefficient
The Dice coefficient is a metric used to assess the similarity between the segmentation results of a model and the ground truth labels. It evaluates segmentation accuracy by calculating the ratio of the intersection to the union of the segmented and true regions. A Dice coefficient closer to 1 indicates a higher similarity between the model’s segmentation results and the ground truth labels. The calculation formula is as follows:
Dice = 2 × T P 2 × T P + F N + F P
where TP is the number of pixels that the model correctly classifies as positive class, TN is the number of negative class pixels correctly classified as negative by the model, FP indicates the number of negative class pixels that the model incorrectly classified as positive classes, FN is the number of positive class pixels incorrectly classified as negative by the model, k is the total number of categories, and i is the true value.
(4) Resistance to light interference in different models
Considering that the extraction of watercore features from apple cross-sectional images may vary with different exposure levels using the same model, a comparative experiment was conducted to evaluate the performance of four models in extracting watercore features from images with varying exposure levels.
Judging the degree of image exposure based on the brightness histogram is a fundamental method for evaluating image exposure. In the brightness histogram, the pixel values of images with normal exposure are distributed continuously, with a concentration in the middle region. In contrast, images with underexposure and overexposure have pixel values concentrated in the left and right regions, respectively. For the same apple cross-sectional image, three images were captured at different exposure levels: underexposure, normal exposure, and overexposure. To better illustrate the differences between these exposure levels, the histogram function in Adobe Photoshop 2022 was used to generate histograms for the three different exposure levels of the same cross-section. Figure 6 shows an example of the histogram for one sample at three different exposure levels. As shown in the figure, the pixel values of underexposed, normally exposed, and overexposed images are primarily concentrated in the left, center, and right regions of the histogram, respectively.
Fifty apple cross-section pictures, each with normal exposure, underexposure, and overexposure, were selected. All of the normal exposure apple cross-section images were first used for watercore feature extraction, and then the underexposed and overexposed apple cross-section images were sequentially used for watercore extraction. For the same apple cross-section, the areas of the watercore region extracted from the normally exposed, overexposed, and underexposed images were calculated separately. The area occupied by the watercore region extracted from the overexposed and underexposed images was then compared to that extracted from the normally exposed images. The relative error was computed, followed by the calculation of the average relative error for each model. The calculation formula is as follows:
δ = x * x x
δ * = 1 n i = 1 n δ i
where δ is the relative error, x* is the area occupied by the glycocentric region calculated by extracting overexposed or underexposed images, x is the area occupied by the glycocentric region calculated by extracting normally exposed images, δ* is the average relative error, n is the number of images extracted, and i is the sample number.

3. Results and Analysis

3.1. Watercore Extraction Model Selection

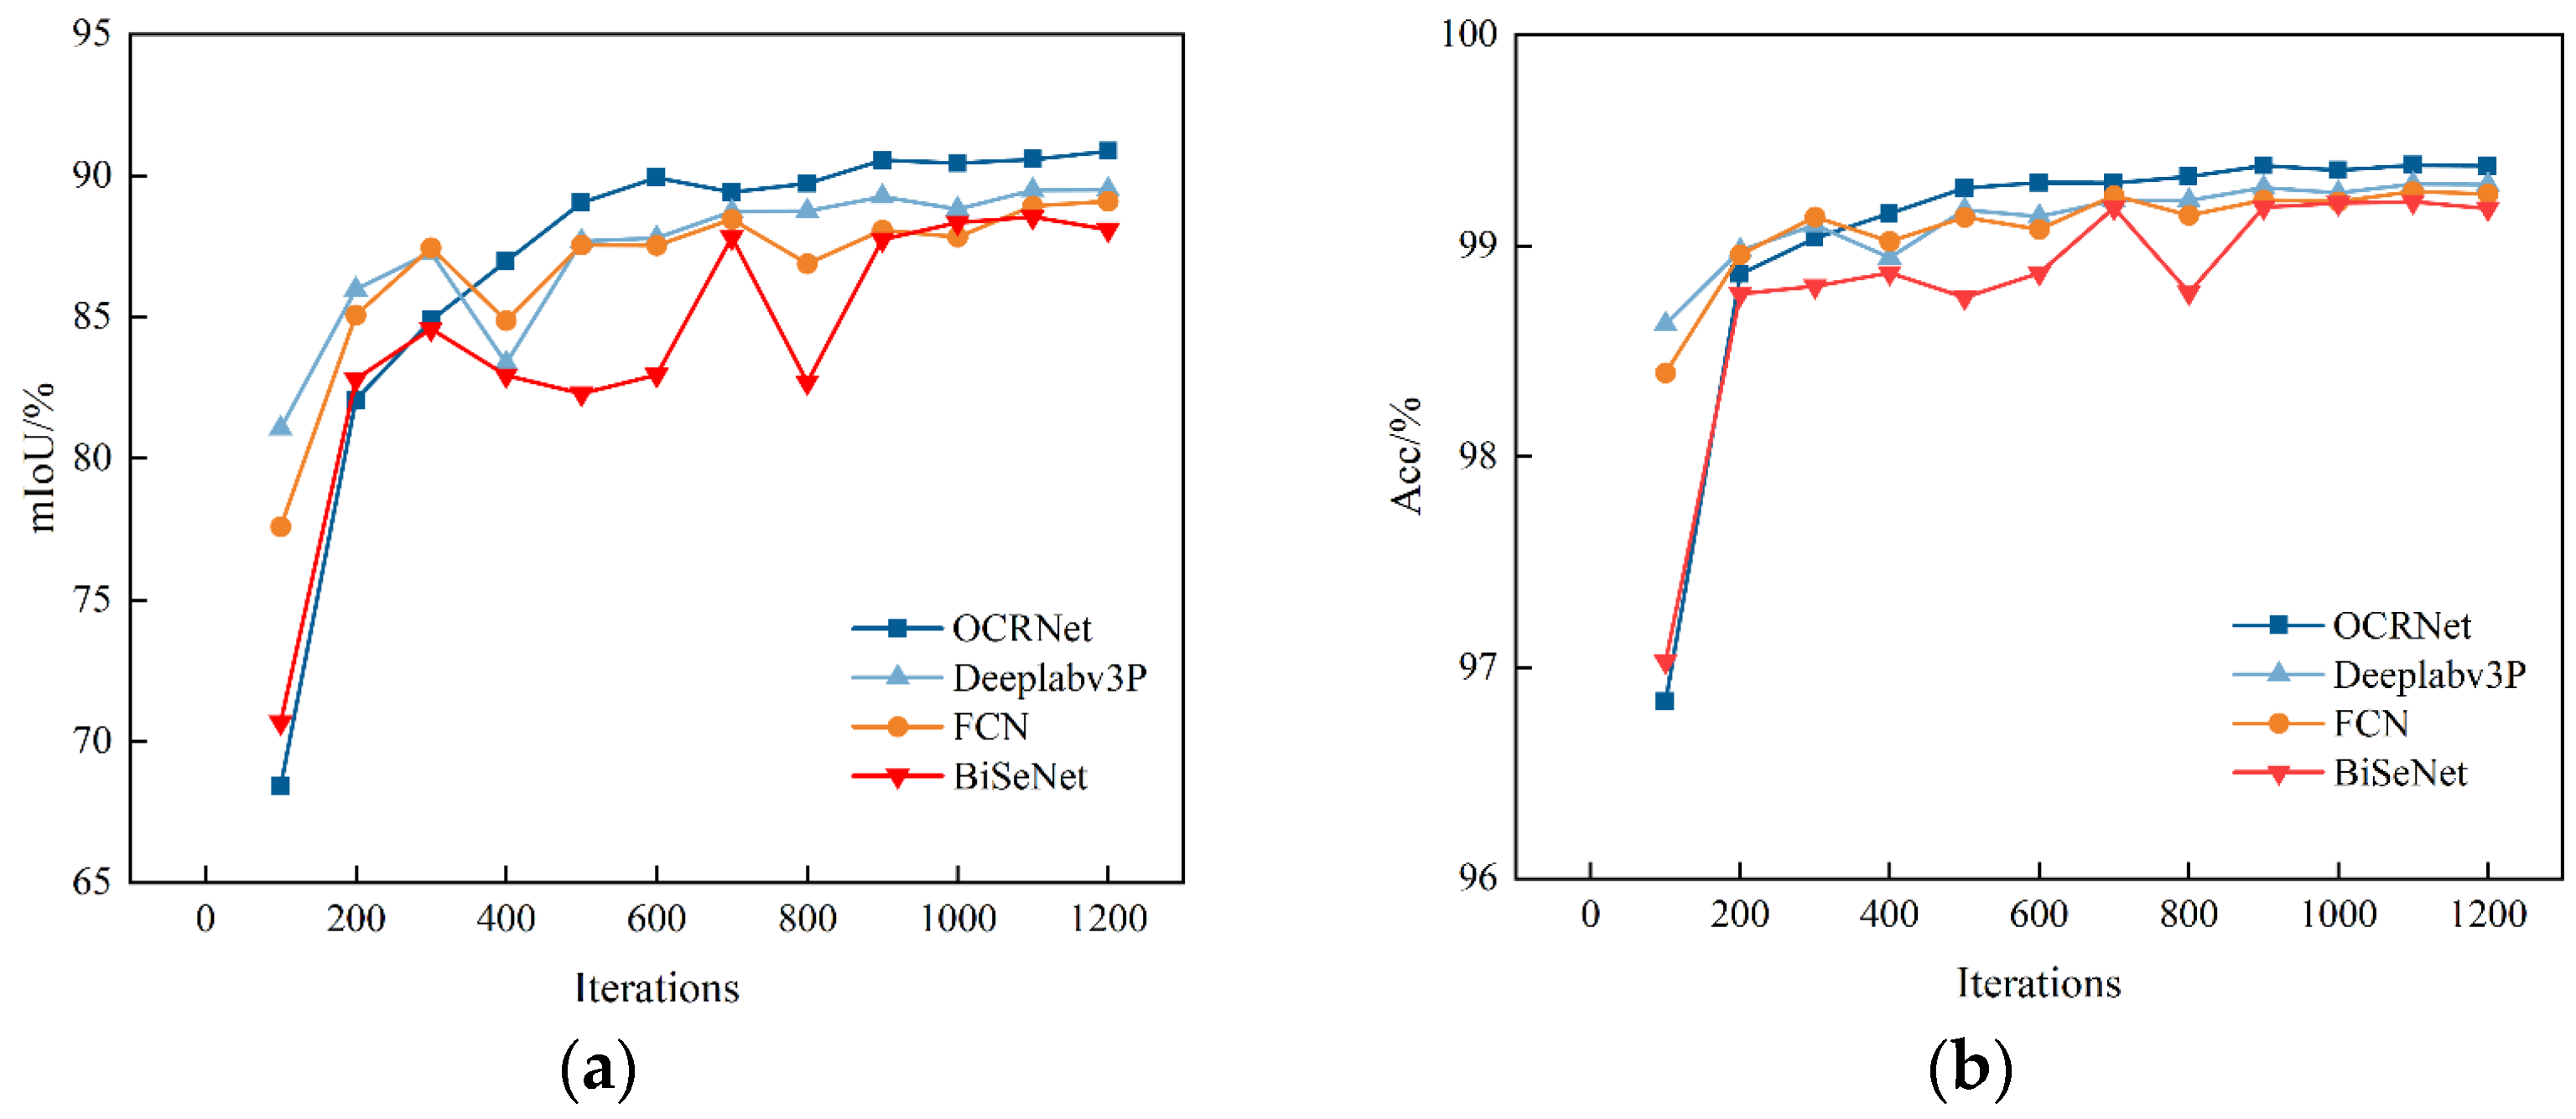
3.1.1. Comparison of Models Under the Data_1 Dataset

The batch size was set to four, and the number of iterations was 1200 for each model when performing the watercore region extraction test using the data_1 dataset. Table 3 presents a comparison of the evaluation metrics for the different models. As shown in Table 3, OCRNet outperforms the other three network models across all evaluation metrics. Specifically, its mIoU, accuracy, and Dice coefficient are 90.14%, 99.33%, and 94.57%, respectively. In contrast, the BiSeNet model yielded relatively poor evaluation results.
Figure 7 illustrates the variations in the mIoU and accuracy curves for the different models. Figure 7a presents the mIoU curves of the four models. As shown in the figure, after 400 iterations, the OCRNet curve consistently remains at the highest position, with a peak value of 90.14%, outperforming the other three models. Both Deeplabv3P and FCN models exhibit intermediate mIoU values, with the former reaching a maximum of 88.48% and the latter 87.68%. The BiSeNet curve consistently remains at the lowest position, with a maximum value of 86.45%, indicating the model’s poorest performance. Figure 7b shows that the OCRNet curve exhibits fewer fluctuations and maintains higher accuracy compared to the other three models, peaking at 99.33%. The accuracy of the Deeplabv3P and FCN models is comparable, while the BiSeNet curve displays more fluctuations, with a peak value of 99.10%.

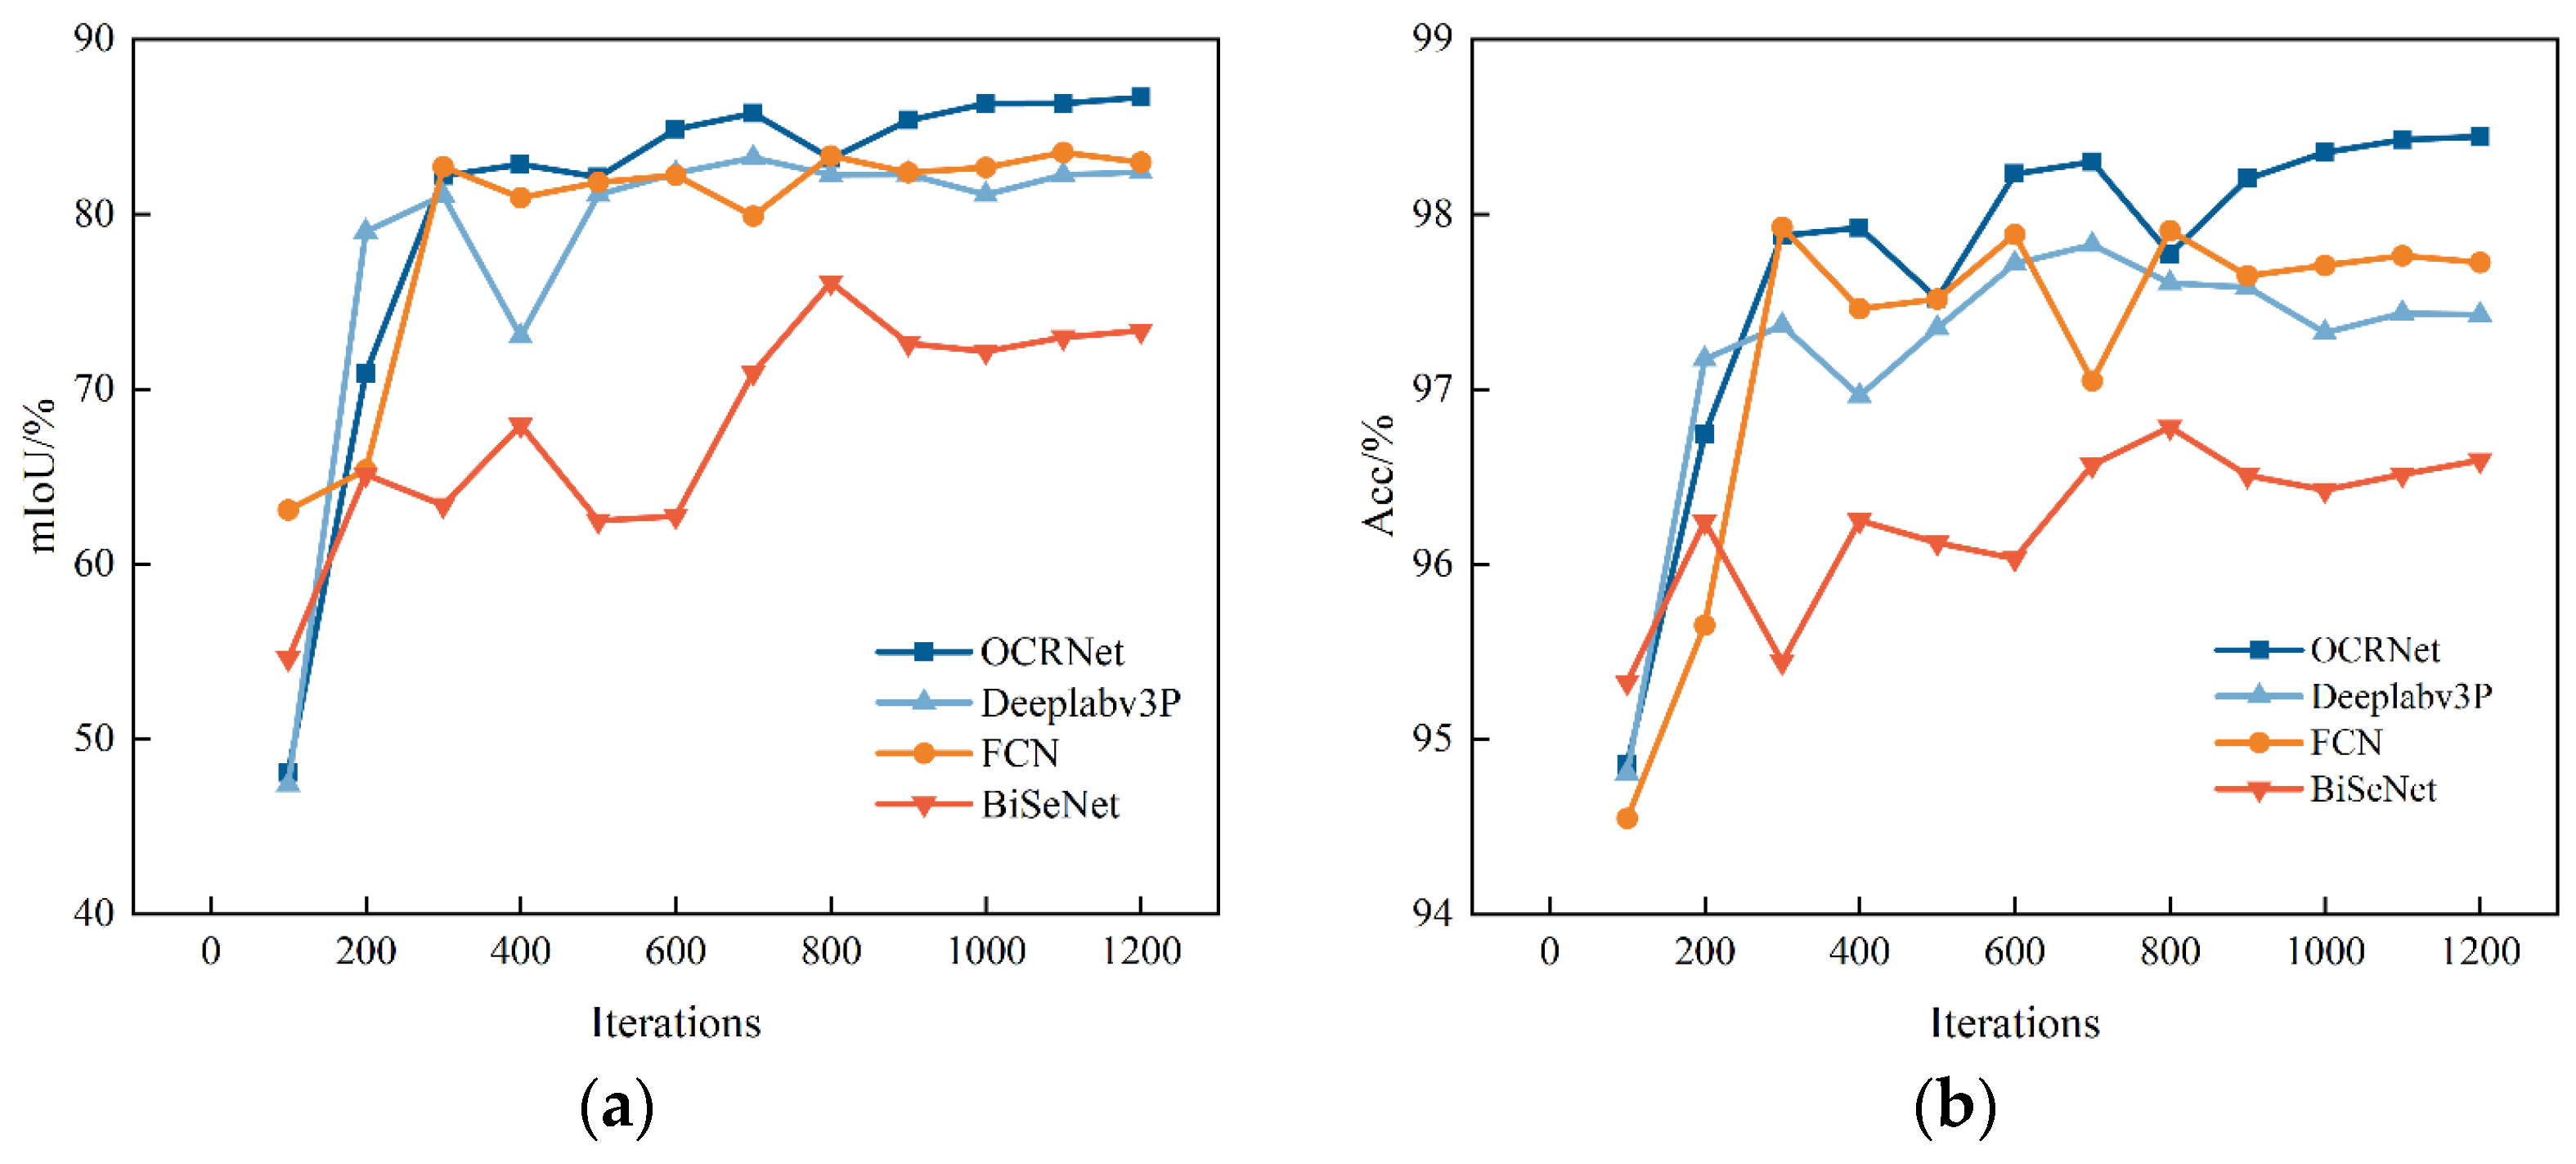
3.1.2. Comparison of Models Under the Data_2 Dataset

Due to the difficulty in avoiding excessive light interference during daytime shooting or low light conditions at night, overexposure or underexposure may occur in the captured images. This imposes a higher demand on the performance of the watercore region extraction model. Therefore, when capturing watercore apple cross-section images, we adjusted the camera parameters to take images under different exposure conditions, including underexposed and overexposed images. These three exposure levels were then combined to form the dataset, denoted as data_2, to evaluate the impact of varying exposure levels of apple watercore cross-section images on the performance of individual models.
The model parameter settings for training with the data_2 dataset are identical to those used with the data_1 dataset, and the optimal evaluation metrics for each model are presented in Table 4. Compared to the results obtained using the data_1 dataset, the optimal evaluation metrics for each model have decreased, indicating that image data with varying exposure levels have an impact on the extraction performance of each model. The OCRNet model remains the best across all evaluation metrics, while the Deeplabv3P and FCN models exhibit similar performance. The BiSeNet model continues to show the poorest performance.
As shown in Figure 8a, the mIoU curve of the OCRNet model exhibits minimal fluctuation, demonstrating superior performance compared to the other three models. In contrast, the BiSeNet model’s curve fluctuates significantly, with a maximum value of only 76.11%, which is 10 percentage points lower than the OCRNet model’s peak. Figure 8b presents the accuracy curves for each model under the data_2 dataset, where it is more evident that the accuracy curves fluctuate more than those in Figure 8a. This indicates that varying exposure levels have a greater impact on model performance. The OCRNet model remains in the highest position after 800 iterations, achieving the best accuracy of 98.35%. The accuracy of the FCN and Deeplabv3P models follows closely behind, at 97.93% and 97.83%, respectively, while the BiSeNet model’s optimal accuracy is 96.78%, which is significantly lower than that of the OCRNet model. Despite the use of a more complex dataset, the OCRNet model continues to perform well, demonstrating its robustness and suitability as the optimal model for extracting the watercore region from cross-sectional images of watercore apples.

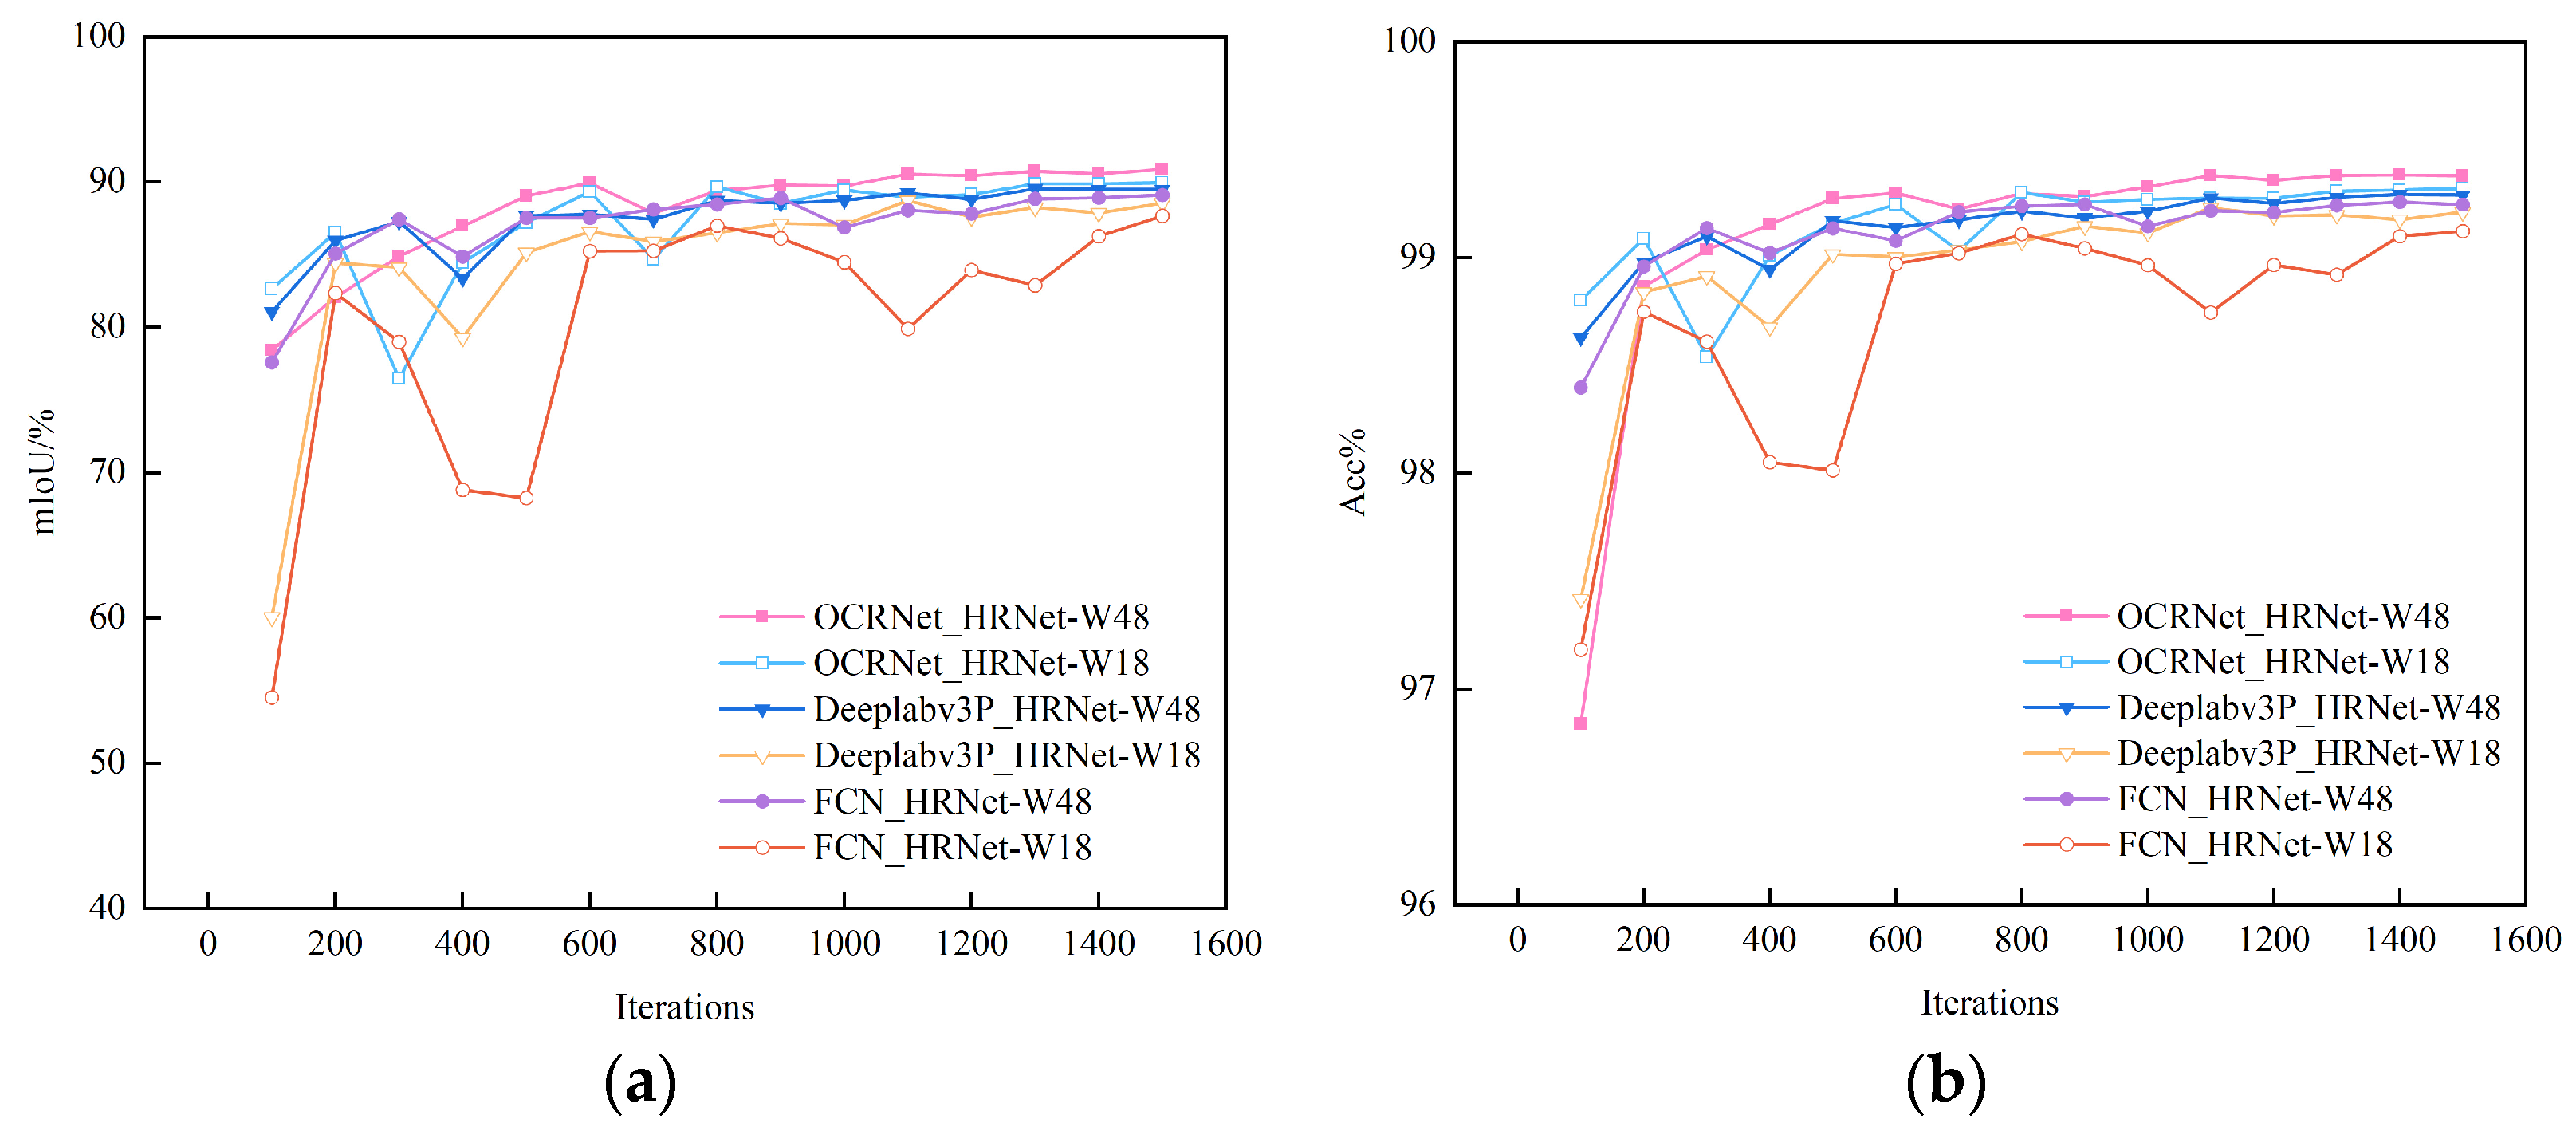
3.1.3. Comparison of Models Under Different Backbone Networks

Based on the results presented in Section 3.1.1 and Section 3.1.2, the BiSeNet model exhibits the poorest performance. The backbone network of the BiSeNet model consists of the Spatial Path and the Context Path. In contrast, the OCRNet, Deeplabv3P, and FCN models use two distinct backbone networks: HRNet-W48 and HRNet-W18. To investigate the impact of different backbone networks on model performance, experiments were conducted on the data_1 dataset, equipping the OCRNet, Deeplabv3P, and FCN models with HRNet-W48 and HRNet-W18 backbone networks. The batch size was set to four, and the number of iterations was set to 1500.
Table 5 presents the optimal evaluation results for each model using different backbone networks. As shown in Table 5, the OCRNet model consistently outperforms the other models with both backbone networks. Among them, the OCRNet_HRNet-W48 model achieves the best results, with an mIoU of 89.94%, accuracy of 99.37%, and a Dice coefficient of 94.35%. On the other hand, the FCN model equipped with the HRNet-W18 backbone yields the poorest performance.
Figure 9 illustrates the mIoU and accuracy curves for each model using different backbone networks. According to the fluctuation changes of each curve in Figure 9a, the OCRNet_HRNet-W48 model achieves the best performance, with its curve consistently remaining at the highest position after 800 iterations. The final result surpasses that of the other two models. The two curves for the Deeplabv3P model lie in the middle, showing minimal difference between them. The FCN model with the HRNet-W18 backbone remains at the lowest position throughout, displaying significant fluctuations and poor stability. The change trend of each curve in Figure 9b is the same as that in Figure 9a. The curve corresponding to the OCRNet model with the HRNet-W48 backbone consistently remains at the highest position after 800 iterations. Both curves for the EMANet model are positioned in the middle range, while the FCN model with the HRNet-W18 backbone exhibits the largest fluctuations and the lowest accuracy. These results indicate that the OCRNet model is better suited to the HRNet-W48 backbone, leading to superior overall performance.

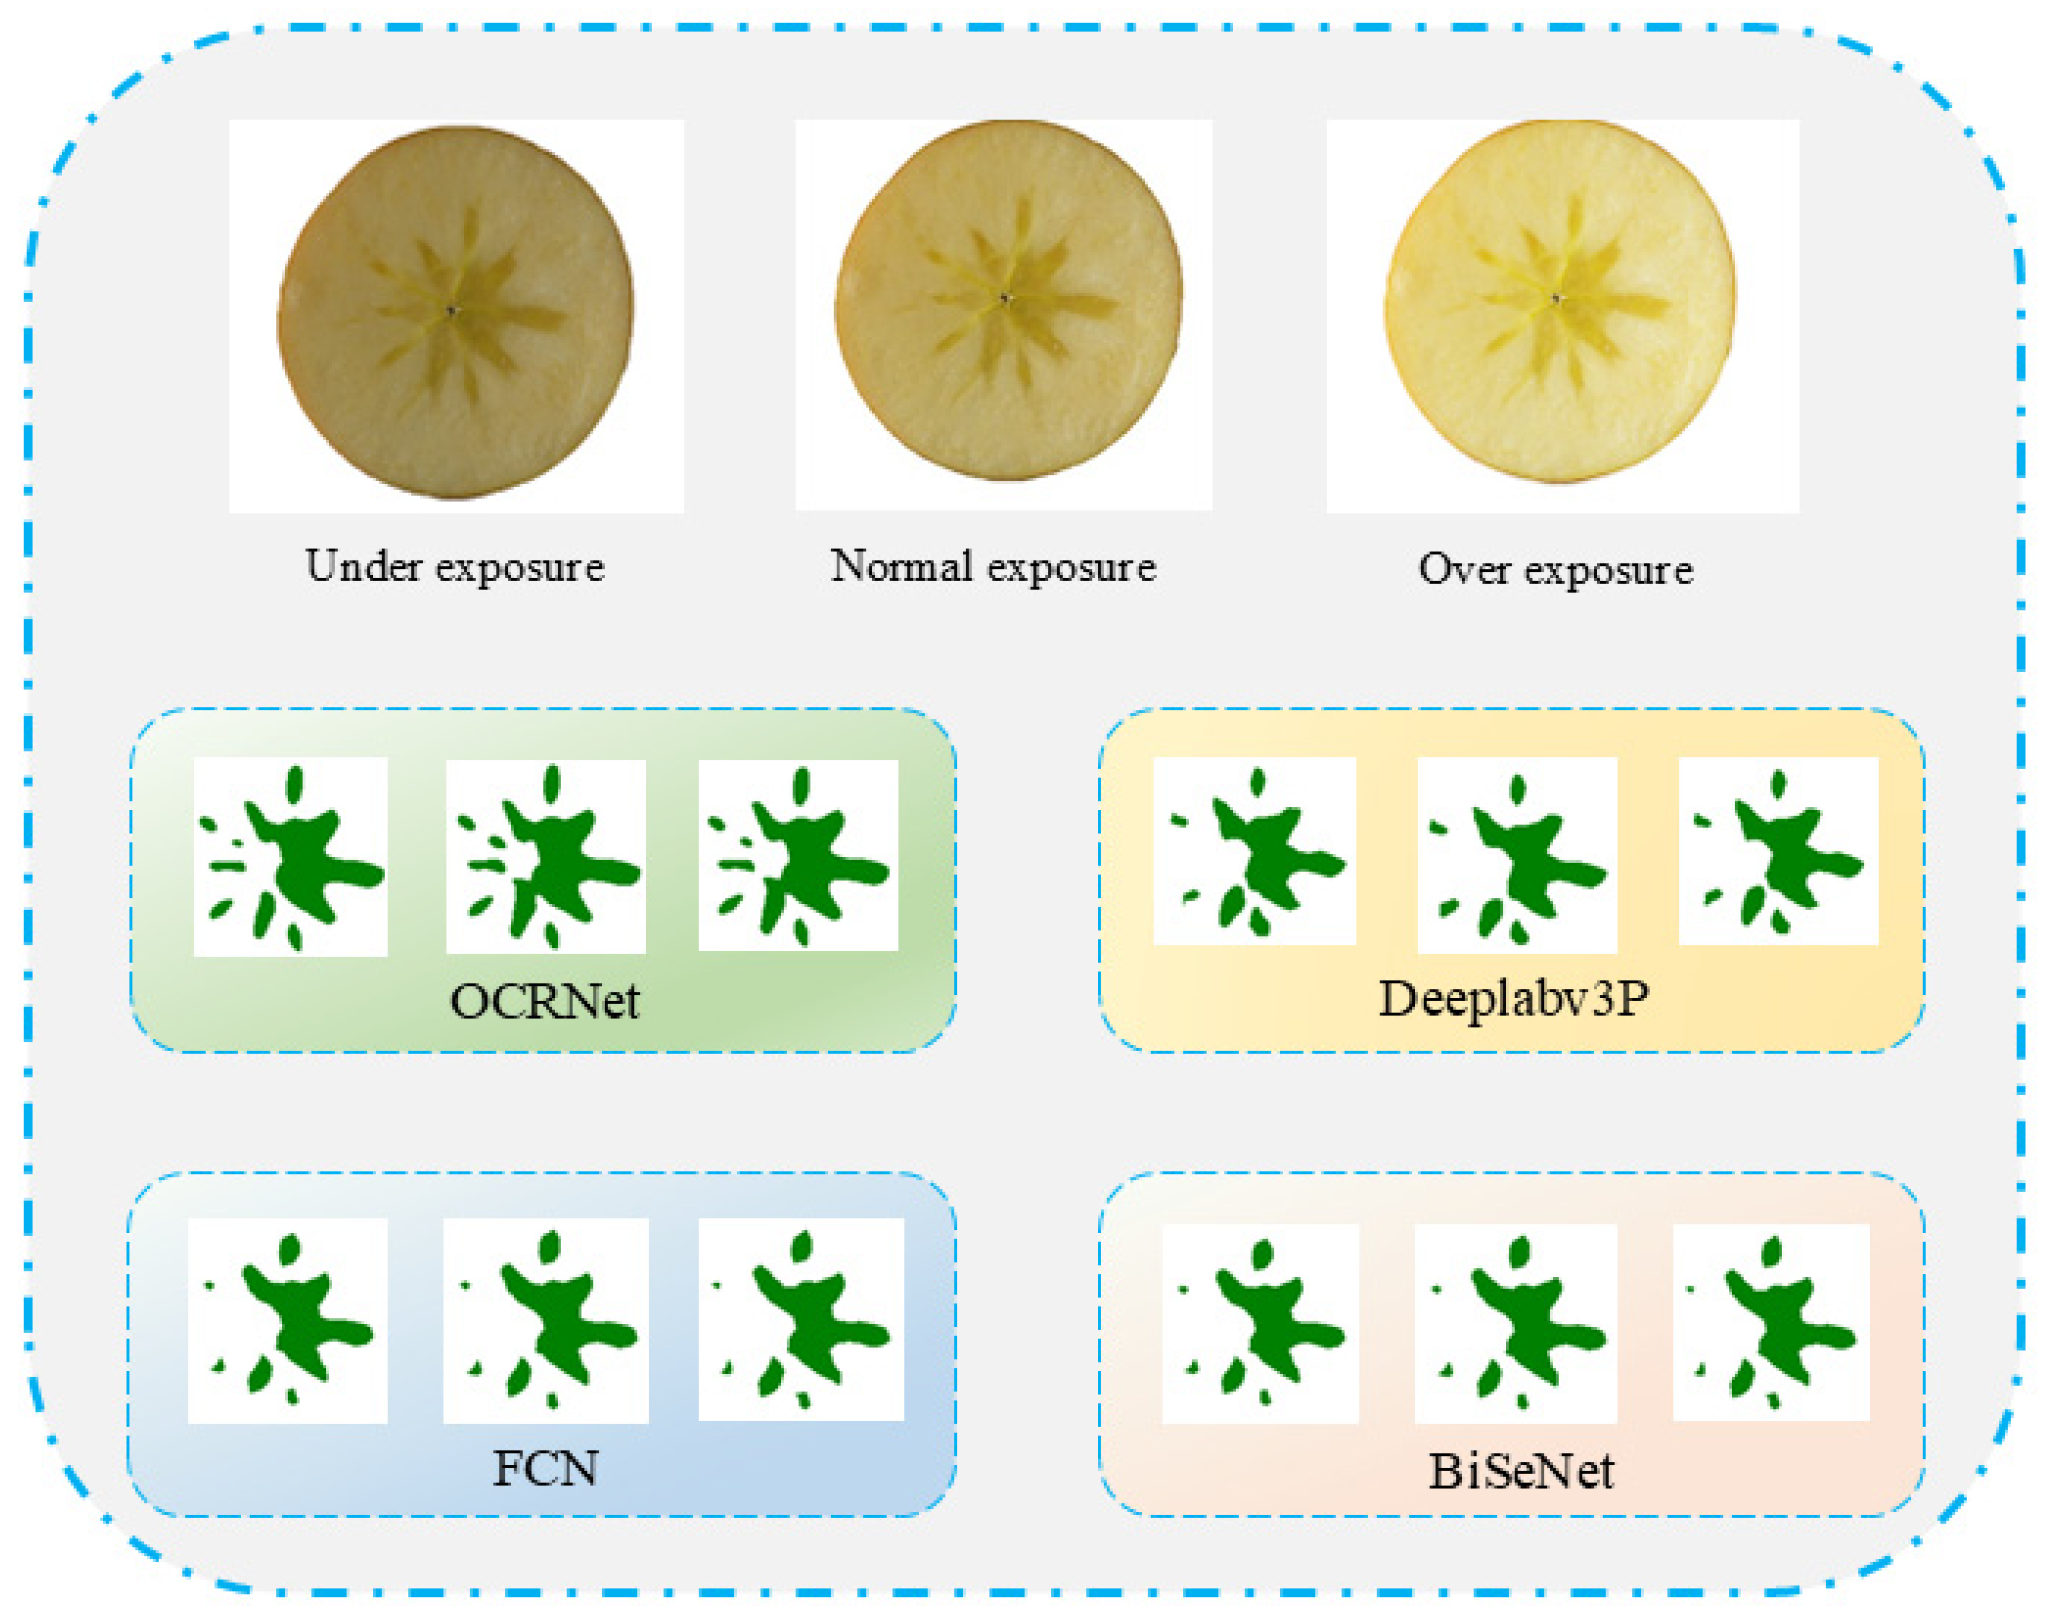
3.1.4. Comparison of Extraction Results from Different Models

Different models were used to extract features from apple cross-section images with varying exposure levels, resulting in feature extraction maps for watercore regions at different exposure levels. A schematic representation of the extraction results from images with different exposure levels using different models is shown in Figure 10. The upper section displays the apple cross-section images under various exposure conditions, while the lower section presents the watercore extraction results from different models across different exposure levels. The watercore extraction results for underexposed, normally exposed, and overexposed images are displayed from left to right in the corresponding watercore maps of each model.
Using the watercore feature maps obtained under different exposure conditions, the error between the area proportion of the watercore region extracted from underexposed or overexposed images and the area proportion extracted from normally exposed images was calculated for each model, as shown in Figure 11. The results reveal noticeable differences in the watercore regions extracted from images with varying exposure levels. Regardless of the model, the error associated with underexposed images is larger than that of overexposed images, indicating that underexposure has a more significant impact on the model’s extraction performance. Among all models, the BiSeNet model exhibits the largest extraction error, with errors of 2.67% and 1.63% for underexposed and overexposed images, respectively. In contrast, the OCRNet model shows the smallest errors, 0.38% and 0.15%, indicating that the OCRNet model performs stably when processing images with different exposure levels. Its extraction results are less influenced by exposure variations, making it better suited to adapting to different lighting conditions compared to the other models.

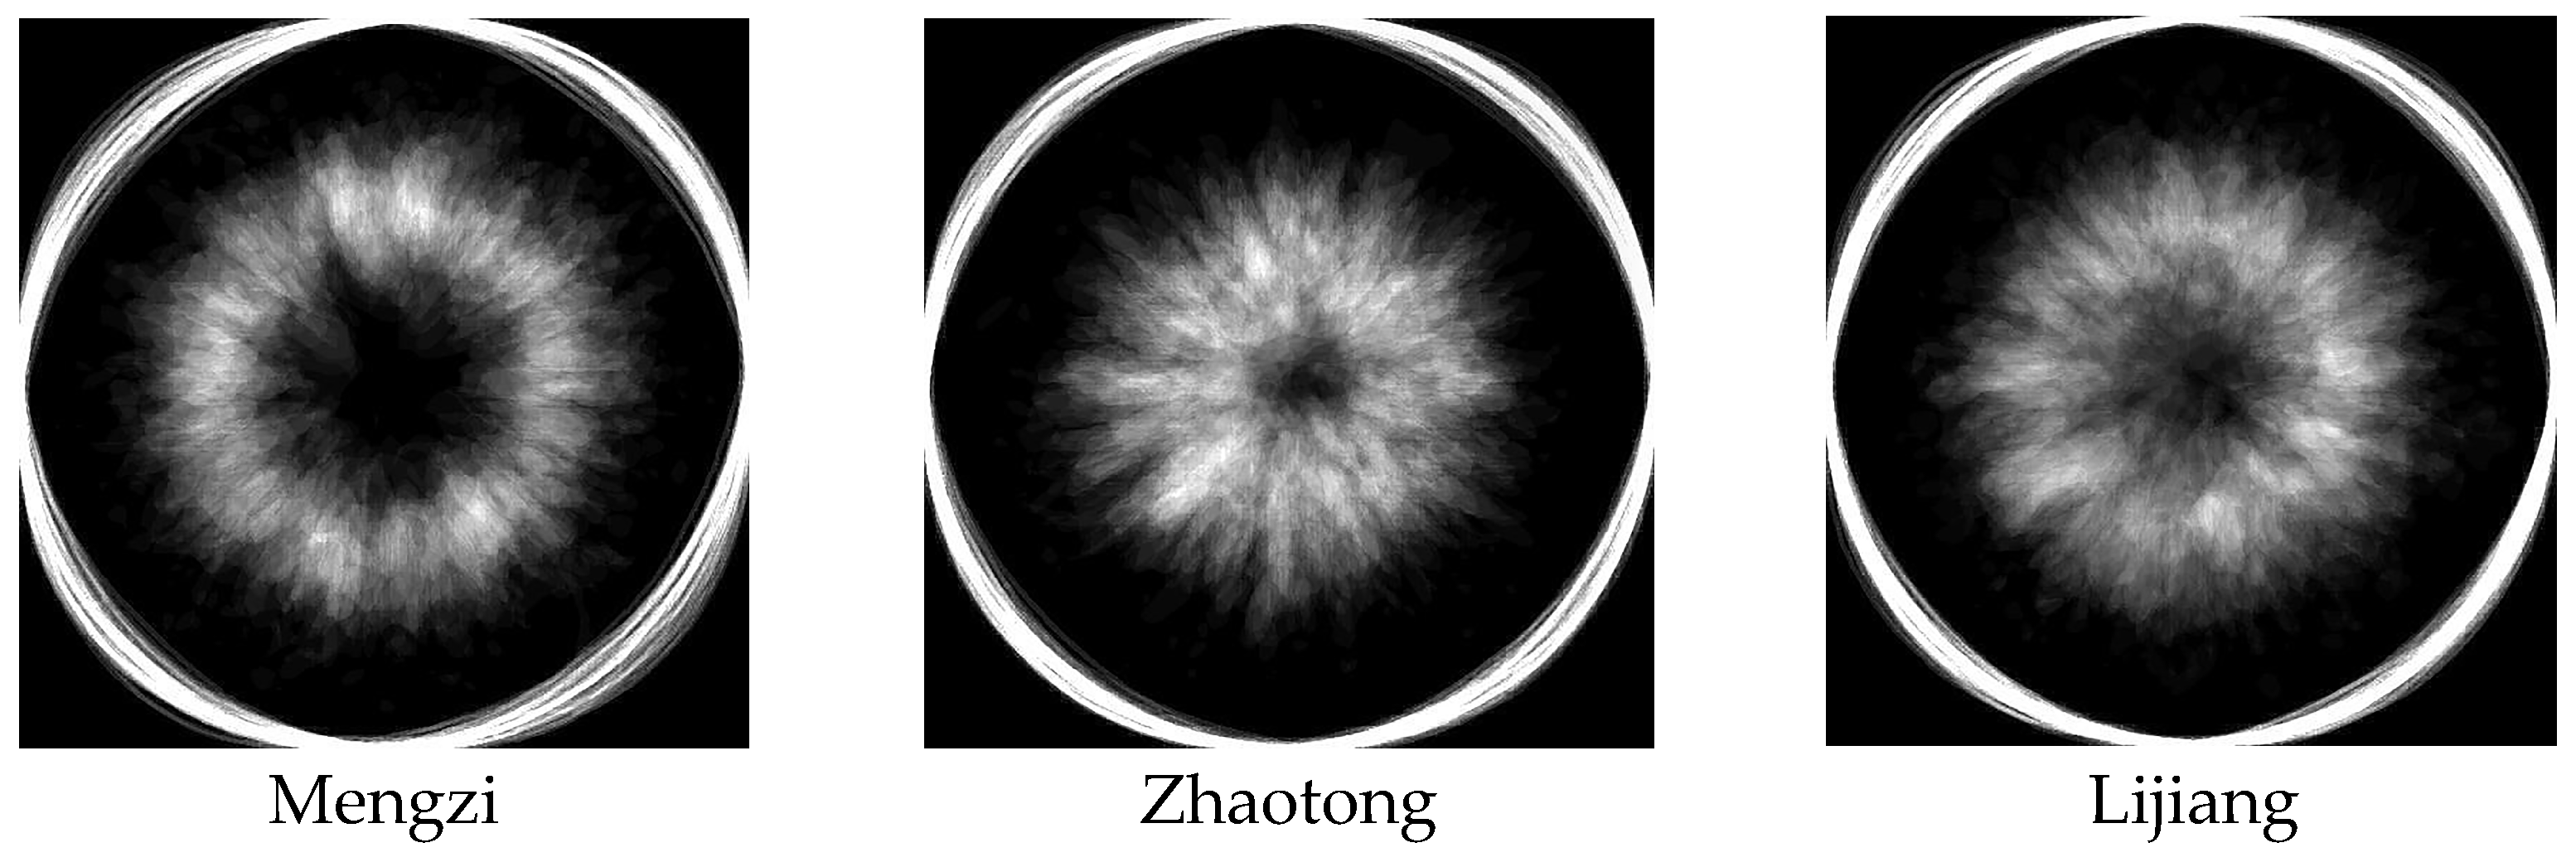
3.2. Evaluation of Apple Watercore Content in Different Regions

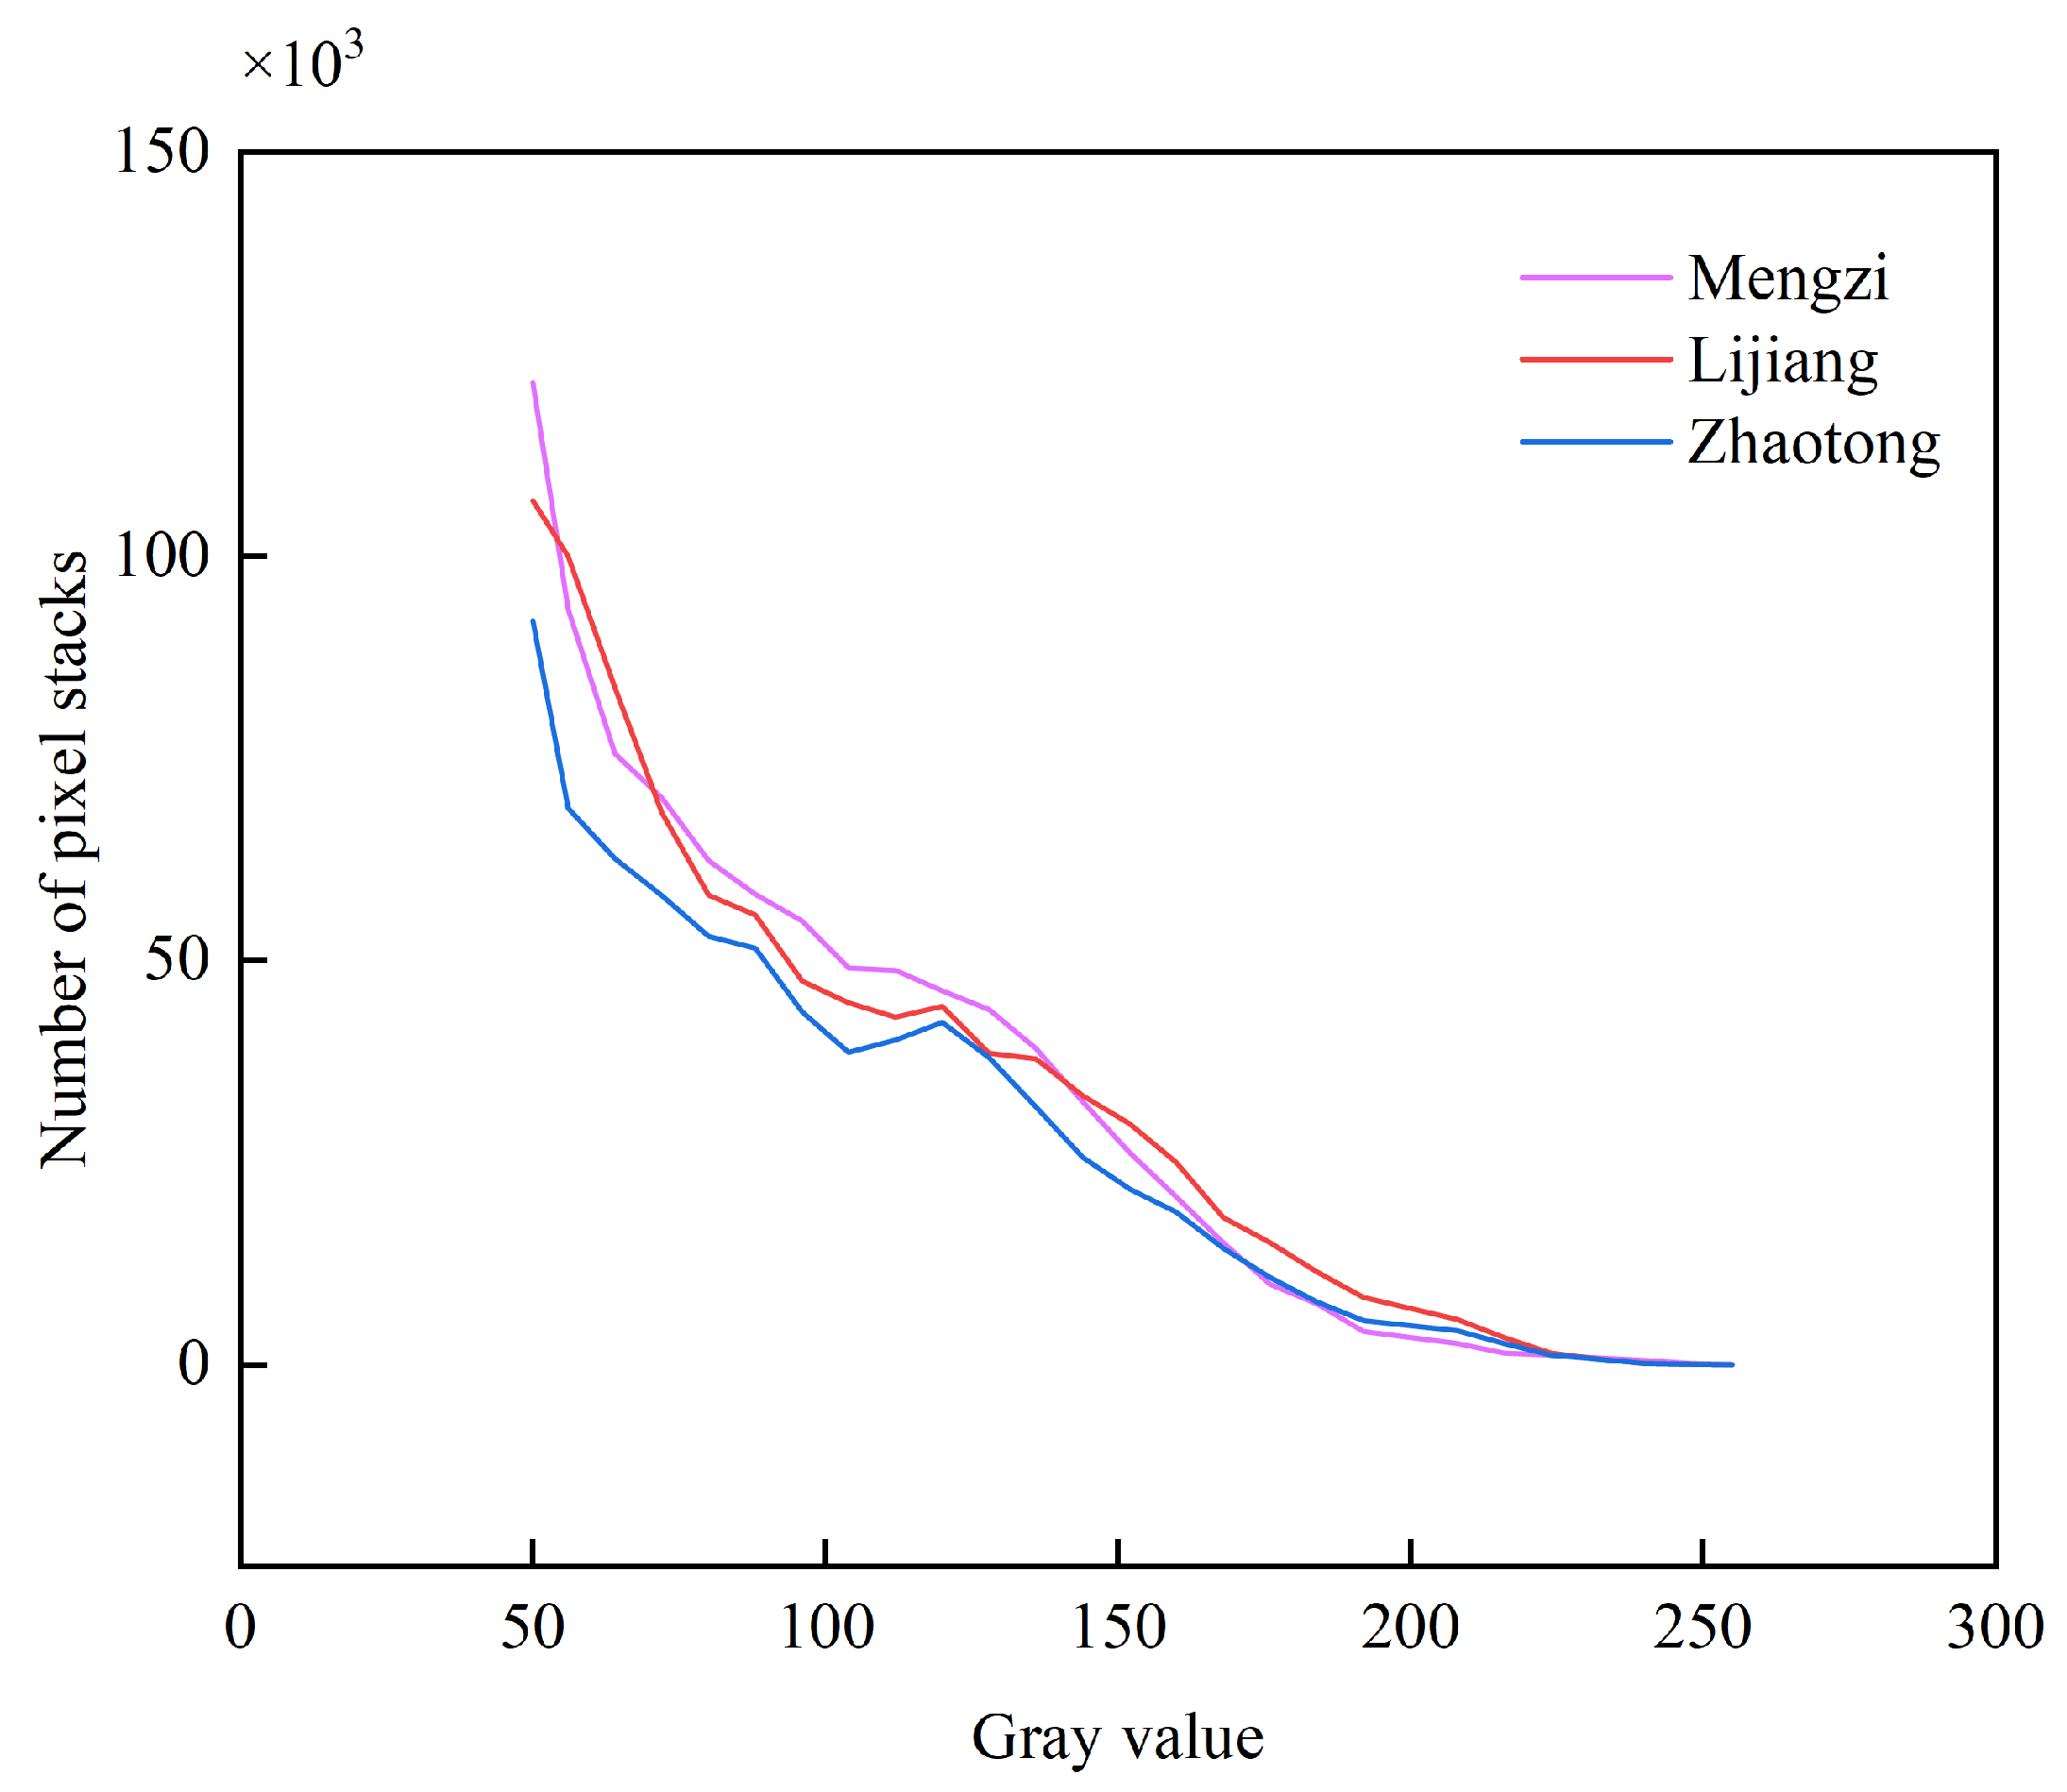
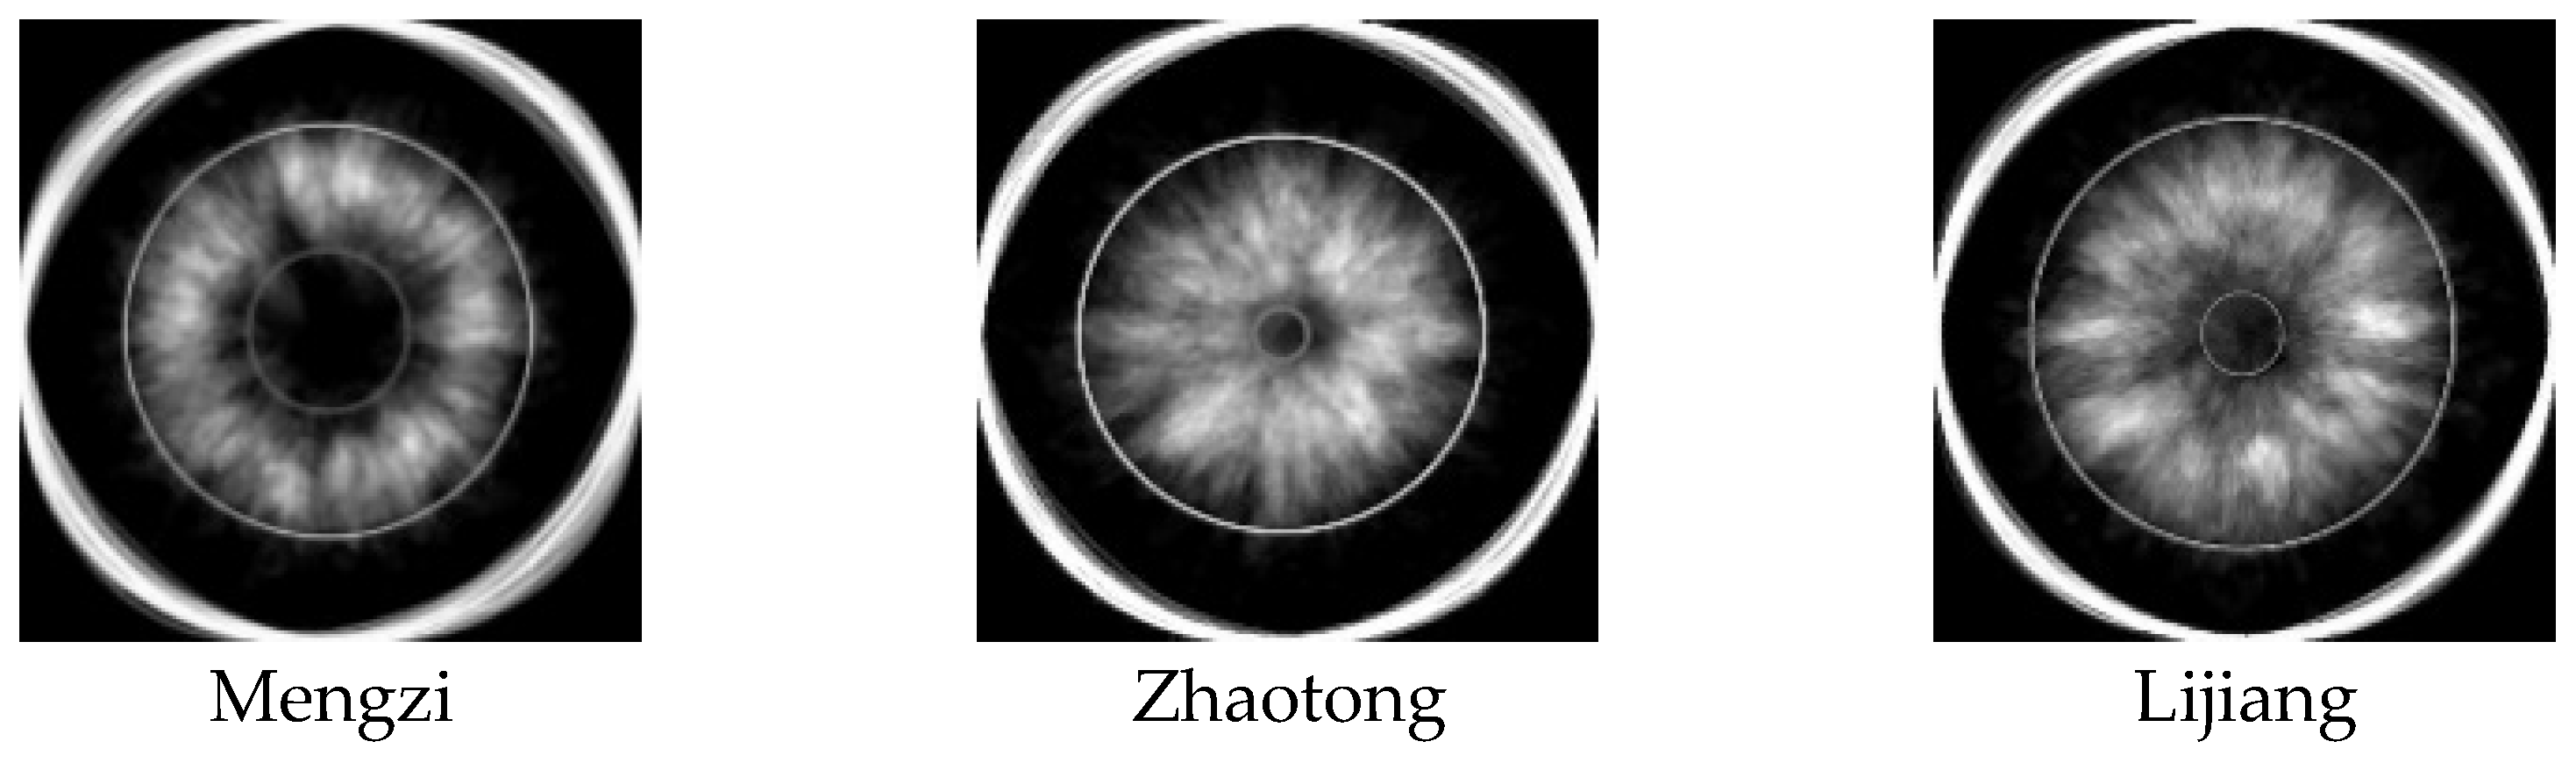
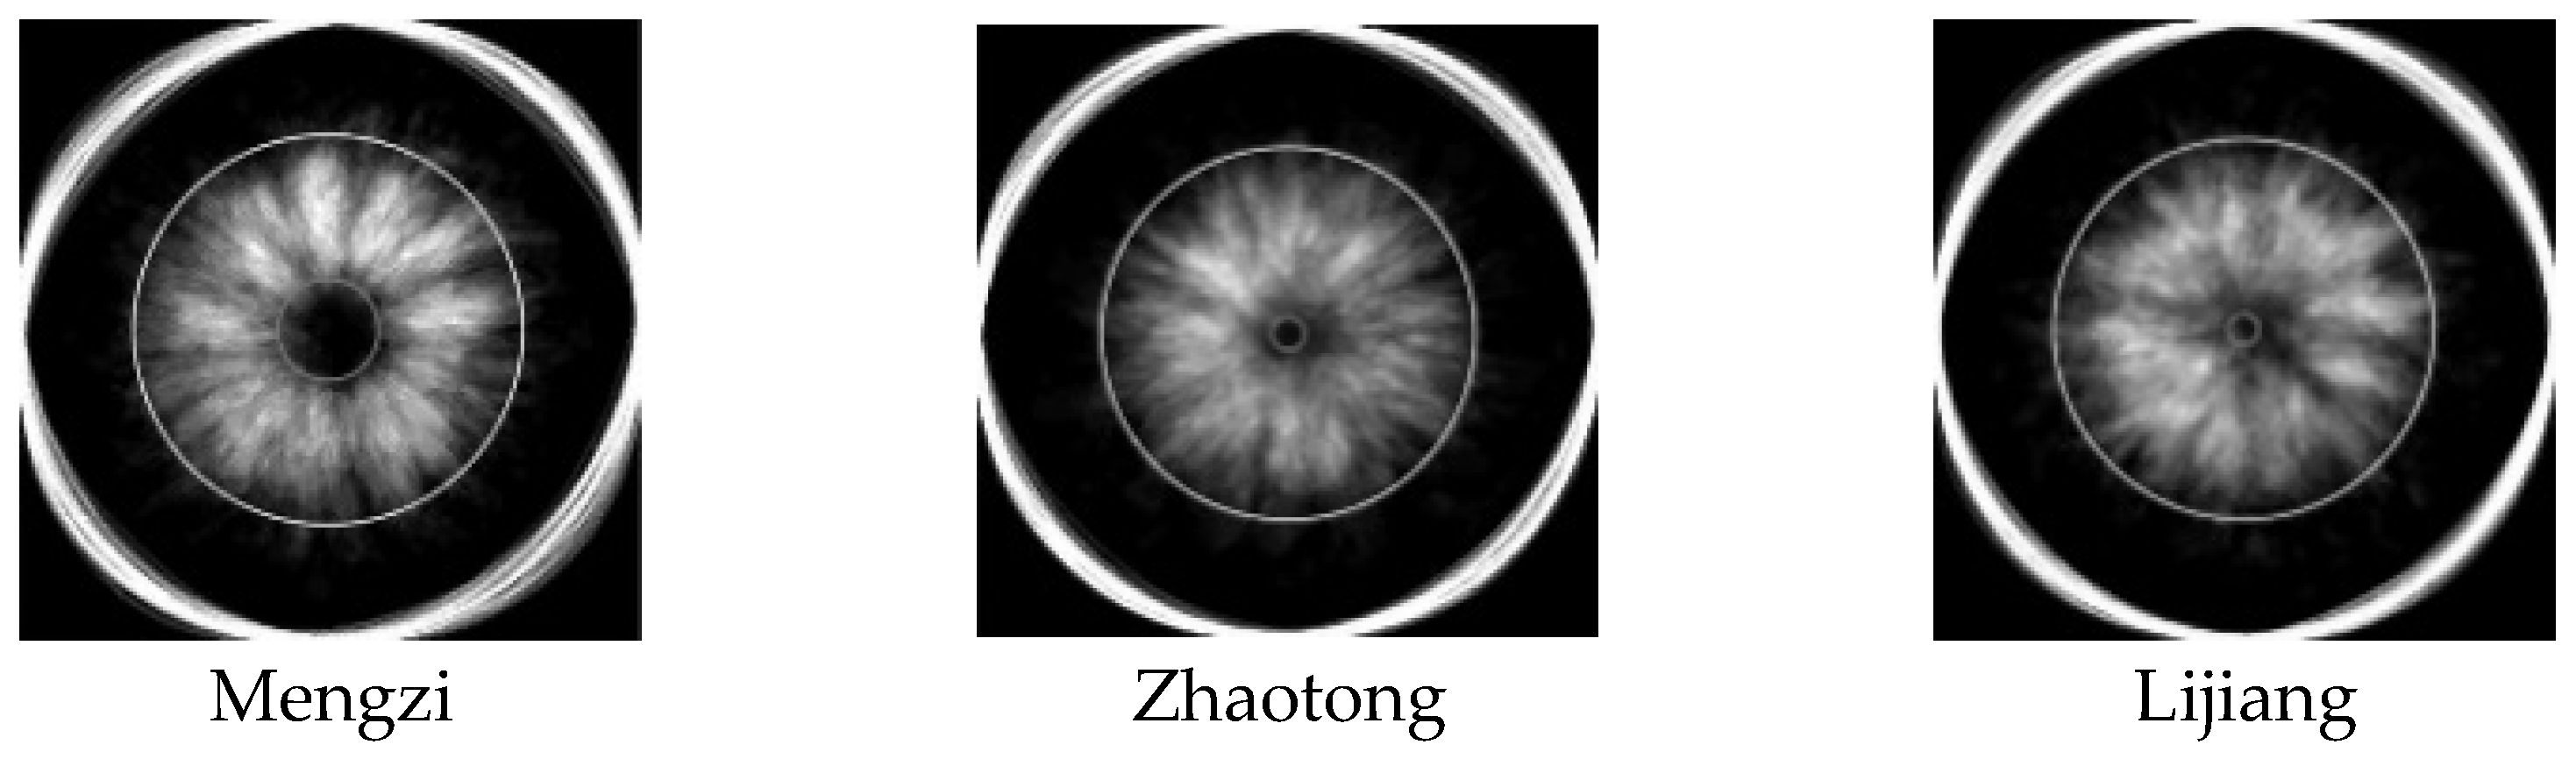
3.2.1. Watercore Region Stacking Results

First of all, 70 watercore cross-sectional images of apples from different regions were selected and stacked, and then 10 more watercore cross-sectional images were added in turn, and the stacked results were compared with the previous ones. It was finally found that after stacking 90 images, the effect of stacking the apple cross-section images from different regions tended to become consistent, i.e., the distribution of the watercore did not change anymore. The schematic diagram of stacking watercore cross-sectional images with different quantities is shown in Figure 12.
The final stacked image of the watercore, obtained after stacking 90 slices, is shown in Figure 13. The outermost part of the image represents the apple peel, while the darker region at the center corresponds to the core area. As the center of the apple cross-section extends outward, the color gradually shifts to white, with the white hue deepening, indicating an increasing probability of watercore distribution. The darker regions of the white area indicate higher watercore distribution, while the color lightens as it extends outward, signaling a decreasing probability of watercore presence. This indicates that the watercore extends outward in a radial pattern with the core as the center, with the tendency to increase and then decrease, and the distribution area and position of the watercore in the cross-section of apples from different regions are also different.

3.2.2. Density Assessment of Watercore Fitting Regions

In the watercore stacking diagram, the whiter the color, the higher the corresponding pixel’s gray value, indicating a greater number of stacking iterations and higher watercore density. The stacking process shows a close correlation between the number of stacking iterations and both the density and content of the watercore. With more stacking iterations, the watercore becomes more densely distributed within the apple, resulting in a higher proportion and greater content of the watercore overall. Figure 14 illustrates the total stacking counts for pixels corresponding to each gray value in the watercore stacking diagram. The horizontal coordinate is a different gray value, and the vertical coordinate is the total number of pixels under this gray value. From the figure, it is clear that watercore stacking differs across regions. The curve for apples from the Zhaotong area consistently remains at the lowest position, indicating fewer stacking iterations and a lower watercore density compared to the other two regions. In contrast, the curve for apples from the Mengzi region is highest within the gray value range of 72–136, while in other ranges, the curve for apples from the Lijiang region consistently stays at the highest position. This indicates that apples from Lijiang undergo the most stacking iterations, resulting in the highest watercore content.

3.2.3. Assessment of the Area of the Watercore Fitting Region

Using least squares to fit the edges of the watercore region in the stacked apple cross-section image can more clearly highlight the differences in watercore distribution across apples from different regions. First, MATLAB R2022b software was used to read the image of the apple watercore region. The Canny edge detection algorithm was then applied to detect the contour of the watercore region, and least squares fitting was used to obtain the radii of the inner and outer circles. These circles were used to describe the distribution of the watercore regions. Using the radii of the fitted inner and outer circles, the area of the watercore region was calculated to evaluate its content. The results of fitting the edges of the stacked apple cross-section watercore region are shown in Figure 15.
The radius of the inner circle fitted to the watercore distribution area in Mengzi apples is 61 px, while the outer circle has a radius of 167 px. In contrast, for Zhaotong apples, the radii of the inner and outer circles are 22 px and 155 px, respectively, while for Lijiang apples, the corresponding radii are 31 px and 161 px. The radii of both the inner and outer circles in the Zhaotong apples’ cross-sections are smaller than those in the other two types of apples, indicating that the watercore in Zhaotong apples is more concentrated around the center of the apple cross-section. The radii of the fitted outer circles in Mengzi and Lijiang apples are relatively similar, while the radius of the fitted inner circle in Mengzi apples is larger, suggesting that the watercore in Mengzi apples is more widely distributed farther from the center of the cross-section.
The size of the fitted image is 512 × 512 px with a resolution of 96 dpi (dots per inch). Using the conversion factor that 1 inch equals 2.54 cm at 96 dpi, the dimensions of the image can be translated into centimeters. Based on the radii of the inner and outer circles fitted to the watercore distribution areas in the apple cross-sections from Mengzi, Zhaotong, and Lijiang, the calculated areas of the watercore regions are 53.138 cm2, 51.744 cm2, and 56.737 cm2, respectively. These calculations indicate that Lijiang apples have the largest watercore area, followed by Mengzi apples, with Zhaotong apples exhibiting the smallest watercore area.
In this experiment, the cross-sections of apples from different regions with less watercore content were also selected for stacking and fitting to their watercore regions. The number of stacked images was also 90. The final results after fitting the edges of the stacked areas of apple sections with watercore are shown in Figure 16. The inner circle radius of the distribution area of the apple watercore in Mengzi is 39 px, and the outer circle radius is 159 px; the inner and outer circle radii of the distribution area of the apple watercore in Zhaotong and Lijiang are 18 px, 154 px, 12 px, and 156 px, respectively. The areas of the fitted areas of the apple watercore in Mengzi, Zhaotong, and Lijiang are calculated to be 52.231 cm2, 51.430 cm2, and 53.188 cm2, respectively. By stacking the cross-sections of different regions with less apple watercore content and fitting their watercore areas, from the area of the fitted area, it can be seen that Lijiang apples have the most watercore content, Mengzi apples are the second largest, and Zhaotong apples have less watercore content compared with the other two regions.

4. Conclusions

Aiming at the problem of the practicality of the model for extracting watercore features in apple cross-sections and the lack of a suitable method for assessing the watercore content of apples in different regions, this paper employs different network models to extract the watercore content from apple cross-sections. The models are evaluated based on various performance metrics, and the impact of image exposure levels on the extraction results is also considered. By doing so, we identify the most suitable model for watercore feature extraction. Finally, the extracted watercore feature images are stacked to assess the watercore content in apples from different regions.
Compared to the FCN and BiSeNet models used in previous studies, the OCRNet model demonstrates superior performance on both datasets, achieving the best evaluation metrics. Specifically, it achieves an mIoU of 90.14% and accuracy of 99.33% on data_1, and an mIoU of 86.35% and accuracy of 98.35% on data_2. In comparing the influence of different backbone networks on the model performance, the performance of the OCRNet combined with the HRNet-W48 backbone network is the best. Furthermore, when comparing the watercore area extracted from underexposed and overexposed images with the area extracted from normally exposed images, OCRNet exhibits the smallest error, confirming its robustness in handling complex conditions for watercore region extraction. This validates OCRNet as a reliable tool for assessing the internal watercore content of apples. Subsequently, the model was employed to extract the watercore regions from apples of different areas, enabling the evaluation of regional variations in watercore content. The results show that Lijiang apples exhibit the highest watercore content, followed by Mengzi apples, where the watercore is more distributed farther from the center of the cross-section. Zhaotong apples have the lowest watercore content, with the watercore more concentrated around the center of the cross-section. These findings are consistent with the research by Kim et al. [35] on regional differences in apple watercore content, further validating the model’s applicability for regional assessments.
The OCRNet model used in this study outperforms previous feature extraction models, providing a more accurate and reliable theoretical model for subsequent watercore content measurements. The stacking of watercore regions extracted by this model, along with the fitting area of the stacked regions, serves as an effective method for evaluating watercore content. This approach can guide farmers in adjusting their cultivation practices based on regional variations in watercore content, thus improving apple quality and taste, enhancing market competitiveness, and increasing economic value. Furthermore, by collecting apple cross-sectional data and processing them to obtain accurate watercore content measurements from different regions, this study provides reliable reference data for the validation of non-destructive methods for evaluating watercore content in apples. This will contribute to the continuous improvement and refinement of non-destructive evaluation techniques for watercore content.
Although the experimental results demonstrate that the OCRNet model is effective for extracting the watercore region from apple cross-sections and for evaluating the watercore content across different regions, there are still some limitations. The limitations are as follows. (1) In this study, the data on the watercore content in apples are still obtained through a destructive method by slicing the apples. In the future, non-destructive testing methods could be integrated to enable a more convenient and accurate assessment of watercore content. (2) Images with varying exposure levels were used as datasets to evaluate the performance of each model, and the OCRNet model outperformed the others. However, images with different exposure levels did have some impact on the performance of the OCRNet model. Therefore, future work could focus on enhancing the model’s adaptability by further refining its internal structure and adjusting the hyperparameters of each model, enabling it to better handle the extraction of watercore regions in more complex scenarios

Author Contributions

Conceptualization, Y.M. and Y.T.; methodology, Y.M.; software, Y.M. and W.Z.; validation, W.Z. and C.Z.; formal analysis, Z.Y.; investigation, P.G.; resources, H.W.; data curation, Y.T.; writing—original draft preparation, Y.M.; writing—review and editing, W.Z. and Y.T.; visualization, C.Z.; supervision, D.H.; project administration, Y.T.; funding acquisition, Y.T. and W.Z. All authors have read and agreed to the published version of the manuscript.

Funding

This research was funded by the “Xingdian Talent Support Program, grant number: YNWR-QNBJ-2018-349” and “Integration and Demonstration of Quality and Efficiency Improvement Technologies for Yunnan Plateau Characteristic Agriculture ‘Ninglang Apple In-dustry Quality and Efficiency Improvement Technology Integration and Demonstration’ grant number: 2021FYD1100407”. This paper is supported by the Hebei Province College Research Center for Express Intelligent Technology and Equipment Applications. This work was supported by the S&T Program of Hebei (Grant No. 22321902D).

Institutional Review Board Statement

Not applicable.

Data Availability Statement

The data supporting this study can be obtained upon request from the corresponding author. However, due to privacy considerations and the presence of undisclosed intellectual property, these data are not accessible to the public.

Acknowledgments

The authors would like to thank Quan Lu for his support through the project “Integration and Demonstration of Quality and Efficiency Improvement Technologies for Yunnan Plateau Characteristic Agriculture–Technology Integration and Demonstration for Quality and Efficiency Improvement in the Ninglang Apple Industry” (Grant No. 2021FYD1100407).

Conflicts of Interest

The authors declare no conflicts of interest.

References

  1. Jia, Y.; Zhang, Y.; Tong, P.; Wang, J. Aksu candied apple primary metabolites and mineral elements. J. Tarim Univ. 2021, 33, 1–6. [Google Scholar] [CrossRef]
  2. Zhou, X.; Wang, D.; Nurmaimaiti; Xiong, R. Quality Analysis of “Sugar Core” ‘Fuji’ Apple in Aksu. J. Tarim Univ. 2019, 31, 60–65. [Google Scholar] [CrossRef]
  3. Liu, X. The Studies on Mechanism and Control of Apple Watercore. Master’s Thesis, Gansu Agricultural University, Lanzhou, China, 2008. [Google Scholar] [CrossRef]
  4. Feng, J.; Han, X.; Song, S.; Wang, H.; Xie, P.; Yang, H.; Li, S.; Wu, Y. Fruit quality characters and causes of watercore apple in high altitude areas of Guizhou. J. South. Agric. 2021, 52, 1273–1281. [Google Scholar] [CrossRef]
  5. Yamada, H.; Minami, J.; Amano, S.; Kadoya, K. Development of early watercore in ‘Orin’ apples grown in warmer regions and its physiology. J. Jpn. Soc. Hortic. Sci. 2001, 70, 409–415. [Google Scholar] [CrossRef]
  6. Zhou, W.; Li, W.; Wang, A.; Wu, Z.; Hu, A. Quality Changes of Sugar Core Red Fuji Apple under Two Storage Conditions. Xinjiang Agric. Sci. 2020, 57, 1431–1442. Available online: https://d.wanfangdata.com.cn/periodical/Ch9QZXJpb2RpY2FsQ0hJTmV3UzIwMjUwMTE2MTYzNjE0Eg94am55a3gyMDIwMDgwMDcaCGZobzM5ejFt (accessed on 8 May 2025).
  7. Guo, Z.; Wang, M.; Agyekum, A.A.; Wu, J.; Chen, Q.; Zuo, M.; EI-Seedi, H.; Tao, F.; Shi, J.; Yang, Q.; et al. Quantitative detection of apple watercore and soluble solids content by near infrared transmittance spectroscopy. J. Food Eng. 2020, 279, 109955. [Google Scholar] [CrossRef]
  8. Hu, W.; Sun, D.; Pu, H.; Pan, T. Recent developments in methods and techniques for rapid monitoring of sugar metabolism in fruits. Compr. Rev. Food Sci. Food Saf. 2016, 15, 1067–1079. [Google Scholar] [CrossRef] [PubMed]
  9. Zhang, S.; Xu, H.; Wang, J.; Sun, Y.; Wang, H. Detection of watercore disease in apple based on inversion of optical characteristic parameters. J. Nanjing Agric. Univ. 2023, 46, 986–994. [Google Scholar] [CrossRef]
  10. Yin, Y. Numerical Characterization of Sugar Content of Aksu Apple Based on Electrical Characteristics. Master’s Thesis, Tarim University, Aral, China, 2023. [Google Scholar] [CrossRef]
  11. Zhang, Z. Research and System Implementation of Pixel-Level Image Exposure Evaluation Method. Master’s Thesis, Beijing University of Posts and Telecommunications, Beijing, China, 2023. [Google Scholar] [CrossRef]
  12. Zhang, H.; Cai, C. Lossless and Online Classification System for Apple Water Core Disease Based on Computer Vision. Agric. Mech. Res. 2018, 40, 208–210. [Google Scholar] [CrossRef]
  13. Yuan, M.; Wang, B.; Chen, J.; Wang, C.; Yang, S.; Chen, J. Real-time nondestructive inspection system of Aksu Bingxin apple. Inf. Commun. 2019, 7, 54–56. [Google Scholar] [CrossRef]
  14. Zhang, Z.; Liu, H.; Wei, Z.; Pu, Y.; Zhang, Z.; Zhao, J.; Hu, J. Comparison of Different Detection Modes of Visible/Near-Infrared Spectroscopy for Detecting Moldy Apple Core. Spectrosc. Spectr. Anal. 2024, 44, 883–890. Available online: https://d.wanfangdata.com.cn/periodical/gpxygpfx202403047 (accessed on 8 May 2025).
  15. Tong, P.; Zhang, Y.; Tang, L.; Zhang, S.; Xu, Q.; Wang, J. Effects of Light and Temperature on Sugar Core Formation of Fuji Apple. J. Northwest Agric. 2020, 29, 579–586. [Google Scholar] [CrossRef]
  16. Zhang, Y.; Wang, Z.; Tian, X.; Yang, X.; Cai, Z.; Li, J. Online analysis of watercore apples by considering different speeds and orientations based on Vis/NIR full-transmittance spectroscopy. Infrared Phys. Technol. 2022, 122, 104090. [Google Scholar] [CrossRef]
  17. Chang, H.; Wu, Q.; Yan, J.; Luo, X.; Xu, H. On-line evaluation of watercore in apples by visible/near infrared spectroscopy. In Proceedings of the ASABE Annual International Meeting, St Joseph Michigan, MI, USA, 7–10 July 2019; p. 1. [Google Scholar] [CrossRef]
  18. Clark, C.J.; MacFall, J.S.; Bieleski, R.L. Loss of watercore from ‘Fuji’ apple observed by magnetic resonance imaging. Sci. Hortic. 1998, 73, 213–227. [Google Scholar] [CrossRef]
  19. Zhu, L.; Chen, B.; Xiao, P.; Zhang, Y.; Xu, Y. Selection and implementation of semantic segmentation model for intelligent recognition of scrap type. Metall. Ind. Autom. 2023, 47, 81–92. [Google Scholar] [CrossRef]
  20. Zhao, W.; Chen, H.; Guo, L.; Wang, S.; Pan, X.; Wang, X. Substation Meter Readings and Dial Information Identification Method Based on YOLO-E and Enhanced OCRNet Image Segmentation. Electr. Power Constr. 2023, 44, 75–85. [Google Scholar] [CrossRef]
  21. Hu, T.; Gao, X.; Hua, Y.; Cai, L. Deep learning-based adaptive multi-defect detection in apple images. J. Shandong Univ. Sci. Technol. (Nat. Sci. Ed.) 2024, 38, 42–47. [Google Scholar] [CrossRef]
  22. Yu, J.; Zhang, B. MDP-YOLO: A lightweight YOLOv5s algorithm for Multi-Scale pest detection. Eng. Agrícola 2023, 43, e20230065. [Google Scholar] [CrossRef]
  23. Ni, J.; Wu, J.; Elazab, A.; Tong, J.; Chen, Z. DNL-Net: Deformed non-local neural network for blood vessel segmentation. BMC Med. Imaging 2022, 22, 109. [Google Scholar] [CrossRef]
  24. Yin, M.; Yao, Z.; Cao, Y.; Li, X.; Zhang, Z.; Lin, L.; Han, H. Disentangled non-local neural networks. In Proceedings of the Computer Vision–ECCV 2020: 16th European Conference, Glasgow, UK, 23–28 August 2020; pp. 191–207. [Google Scholar] [CrossRef]
  25. Ren, Z.; Wang, L.; He, Z. Open-Pit mining area extraction from high-resolution remotesensing images based on EMANet and FC-CRF. Remote Sens. 2023, 15, 3829. [Google Scholar] [CrossRef]
  26. Li, X.; Zhong, Z.; Wu, J.; Yang, Y.; Lin, Z.; Liu, H. Expectation-maximization attention networks for semantic segmentation. In Proceedings of the IEEE/CVF International Conference on Computer Visio, Seoul, Republic of Korea, 27 October–2 November 2019; pp. 9167–9176. [Google Scholar] [CrossRef]
  27. Peng, Z.; Cai, C. An effective segmentation algorithm of apple watercore disease region using fully convolutional neural networks. In Proceedings of the Asia-Pacific Signal and Information Processing Association Annual Summit and Conference (APSIPA ASC), Kuala Lumpur, Malaysia, 12–15 December 2017; pp. 1292–1299. [Google Scholar] [CrossRef]
  28. Yin, Z.; Zhang, W.; Zhao, C. Method of extracting characteristics of watercore in cross section of watercore apple based on BiSeNet. J. Huazhong Agric. Univ. 2023, 42, 209–215. [Google Scholar] [CrossRef]
  29. Yu, C.; Wang, J.; Peng, C.; Gao, C.; Yu, G.; Sang, N. Bisenet: Bilateral segmentation network for real-time semantic segmentation. In Proceedings of the Computer Vision—ECCV 2018: 15th European Conference, Munich, Germany, 8–14 September 2018; pp. 325–341. [Google Scholar] [CrossRef]
  30. Liu, Y.; Ding, L.; Meng, F. High Spatial Resolution Imagery Semantic Segmentation Based on Object-context Representation CNN. Remote Sens. Inf. 2021, 36, 66–74. [Google Scholar] [CrossRef]
  31. Jiang, P. Research on Water Extraction from UAV Remote Sensing Images Based on Deep Semantic Segmentation. Mod. Comput. 2022, 28, 50–56. [Google Scholar] [CrossRef]
  32. Yuan, Y.; Chen, X.; Chen, X.; Wang, J. Object-contextual representations for semantic segmentation. In Proceedings of the Computer Vision–ECCV 2020: 16th European Conference, Glasgow, UK, 23–28 August 2020; pp. 173–190. [Google Scholar] [CrossRef]
  33. Yang, G.; Xu, N.; Hong, Z. Identification of navel orange lesions by nonlinear Deep Learning algorithm. Eng. Agrícola 2018, 38, 783–796. [Google Scholar] [CrossRef]
  34. Zheng, Y.; Chen, R.; Yang, C.; Zhou, T. Improved YOLOv5s based identification of pests and diseases in citrus. J. Huazhong Agric. Univ. 2024, 43, 134–143. [Google Scholar] [CrossRef]
  35. Kim, S.K.; Choi, D.G.; Choi, Y.M. Relationship between the temperature characteristics and the occurrence of watercore at various altitudes in ‘Hongro’ and ‘Fuji’ apples. Hortic. Sci. Technol. 2023, 41, 595–604. [Google Scholar] [CrossRef]
Figure 1. Cross-section data of watercore under different exposure degrees. (a) Underexposure; (b) normal exposure; (c) overexposure.
Agriculture 15 01040 g001
Figure 2. Labelme indicates the interface.
Agriculture 15 01040 g002
Figure 3. Apple watercore cross-section marking image. (a) img.png; (b) label.png.
Agriculture 15 01040 g003
Figure 4. Experimental flow chart of selecting the optimal extraction model and evaluating the content of saccharine.
Agriculture 15 01040 g004
Figure 5. OCRNet network structure.
Agriculture 15 01040 g005
Figure 6. Histograms of apple watercore cross-sections with different levels of exposure. (a) Underexposure. (b) Normal exposure. (c) Overexposure.
Agriculture 15 01040 g006
Figure 7. MIoU and accuracy change curve of different models under the data_1 dataset. (a) mIoU; (b) accuracy.
Agriculture 15 01040 g007
Figure 8. MIoU and accuracy change curve of different models under the data_2 dataset. (a) mIoU; (b) accuracy.
Agriculture 15 01040 g008
Figure 9. MIoU and accuracy curve of each model under different backbone networks. (a) mIoU; (b) accuracy.
Agriculture 15 01040 g009
Figure 10. Different models extract the results of different exposure images.
Agriculture 15 01040 g010
Figure 11. Errors in extracting the watercore from different exposure pictures using different models.
Agriculture 15 01040 g011
Figure 12. Stacking process of different numbers of watercore section pictures.
Agriculture 15 01040 g012
Figure 13. Stacking maps of apple cross-sections and watercores in different regions.
Agriculture 15 01040 g013
Figure 14. The grayscale value in the watercore stacking image corresponds to the total stacking time of the pixels.
Agriculture 15 01040 g014
Figure 15. Regional distribution map of apple watercore in different regions.
Agriculture 15 01040 g015
Figure 16. Stack fitting plot with less watercore cross-sections in different regions.
Agriculture 15 01040 g016
Table 1. Experiment’s specific parameter configuration.
ParameterVersion
CPUIntel(R) Core(TM) i7-12650H
Memory16 GB
GPURTX 4060
Memory8 GB
Program languagePython3.9
CUDA11.7
Cudnn8.4
Paddlepaddle-gpu2.5.1
Paddleseg2.8.0
Table 2. Experimental parameter settings of different network models.
ModelOptimizerLr_SchedulerLoss Function
TypeMomentumWeight_DecayTypeLearning_Rate
OCRNetSGD0.94.0 × 10−5PolynomialD-ecay0.01CrossEntropy-Loss
EMAnet
DNLNet
BiSeNet
Table 3. Comparison of evaluation results of different models.
ModelmIoU/%Acc/%Dice Coefficient/%
OCRNet90.1499.3394.57
Deeplabv3P88.4899.2093.48
FCN87.6899.1693.04
BiSeNet86.4599.1092.24
Table 4. The optimal evaluation index of each model in data_2.
ModelmIoU/%Acc/%Dice Coefficient/%
OCRNet86.3598.3592.22
Deeplabv3P83.2297.8390.15
FCN83.3497.9390.23
BiSeNet76.1196.7884.87
Table 5. The optimal evaluation index of each model under different backbone networks.
ModelmIoU/%Acc/%Dice Coefficient/%
OCRNet_HRNet-W4889.9499.3794.35
OCRNet_HRNet-W1889.4599.3294.26
Deeplabv3P_HRNet-W4888.7199.2993.69
Deeplabv3P_HRNet-W1888.5399.2193.52
FCN_HRNet-W4887.6899.2593.30
FCN_HRNet-W1885.8999.1293.04
Disclaimer/Publisher’s Note: The statements, opinions and data contained in all publications are solely those of the individual author(s) and contributor(s) and not of MDPI and/or the editor(s). MDPI and/or the editor(s) disclaim responsibility for any injury to people or property resulting from any ideas, methods, instructions or products referred to in the content.

