1. Introduction
Rice is one of China’s main staple crops, supplying the food needs for the majority of the population. With the continuous growth of China’s population, rice production directly affects China’s food supply and the stability of the global food market [
1]. The fluctuations in rice production not only affect the domestic food supply but also have a profound impact on the stability of the world food market. Ensuring stable rice yields holds substantial importance for China’s food security. The leaf area index (LAI) and soil–plant analysis development (SPAD) are critical variables in crop photosynthesis, respiration, and transpiration processes. The leaf area index (LAI) is an important parameter that reflects the ratio of plant leaf area to soil area. Changes in LAI not only indicate the health status of rice plants but also reveal their adaptability to changes in environmental conditions. Soil Plant Analysis Development (SPAD) is a tool used to assess nitrogen content and photosynthetic efficiency by measuring the greenness of rice leaves. The SPAD value is directly related to the crop’s nutritional status and the intensity of photosynthesis. As key indicators in biomass production simulation, yield, and yield losses [
2], they serve to monitor growth stages for various abiotic and biotic stresses [
2,
3]. The LAI and SPAD measurements help assess crop health and detect crop stress, photosynthetic capacity, and productivity [
4,
5]. The accurate, rapid, and nondestructive quantitative estimation of rice growth parameters can ensure rice yield and quality and is crucial to the macro-control of agricultural production and ensuring food security [
6].
Traditional methods of measuring leaf area index and chlorophyll content typically involve on-site measurements, which are relatively accurate but are inefficient, time-consuming, labor-intensive, and highly destructive, limiting their application to large-scale rice crops [
7]. Satellite remote sensing has been extensively used in crop studies because of its rich spectral information and wide coverage. However, the limited spatial resolution interferes with high-precision surface information and detailed feature observations, restricting its application at fine spatial and temporal scales [
8]. In recent years, with the continuous improvement in sensor technology, multi-sensor fusion has become a hot spot in agricultural remote sensing research. By fusing data from different platforms and sensors, the limitations of a single sensor can be overcome and higher-precision monitoring can be achieved. At present, the combination of optical remote sensing and radar remote sensing has achieved significant applications in the agricultural field. Mao et al. [
9] fused the time-series data of Sentinel-1A and Sentinel-2 images and used the Dual-1DCNN algorithm based on the CNN model to achieve in-season detection of crop types. This study utilized multi-source remote sensing data, providing a new method for crop type identification. Asam et al. [
10] proposed a method to fuse Sentinel-1 and Sentinel-2 image time series data with LPIS data, and used a random forest algorithm to classify and map 17 crop types in Germany. Research shows that this data fusion method can improve the overall accuracy and is helpful in improving the accuracy of most non-grain crops in regional hierarchical classification.
As an emerging monitoring method with a high spatio-temporal resolution, UAV remote sensing has gradually been widely used in agricultural monitoring. UAV remote sensing offers advantages, such as ease of operation, convenience, flexibility, and high resolution. As UAVs carrying multispectral sensors capture high-resolution images of farmland, they enable the extraction of spectral information for estimating LAI and chlorophyll content; this technology has become a promising solution for more precise and efficient monitoring of crop health. Despite its advantages, the cost of multispectral sensors remains a challenge. To overcome these challenges, researchers have combined satellite and UAV images for research, leveraging the advantages of multisource data. By combining multisource data, the wide-area coverage of satellite images with high resolution, and detailed observations of UAV images, researchers can achieve more accurate and comprehensive assessments of crop conditions. Zhao et al. [
11] performed pixel-level fusion of UAV and satellite remote sensing images and employed object-oriented supervised classification methods, including random forest (RF), support vector machine (SVM), and maximum likelihood estimation (MLE), to classify and identify the study region. The use of fused images significantly improved the accuracy of vegetation classification and identification. Zhao et al. [
12] fused Sentinel-2A satellite images with UAV images for refined crop classification, using the random forest algorithm to categorize the images into 10 classes. They assessed different UAV images of varying spatial resolutions to select the best-performing ones. The classification accuracy of the fused images was superior to that of the original images. These studies indicate that combining satellite and UAV remote sensing data to leverage the advantages of each sensor has gradually become a new trend in the development of remote sensing technologies. As sensor technology continues to evolve, the integration of various remote sensing platforms will likely play an increasingly important role in achieving more sustainable, efficient, and productive agricultural systems.
Currently, machine-learning algorithms are widely applied to crop parameter estimation. The use of UAV and satellite imagery, combined with machine learning methods, can more efficiently and accurately assess the growth and health status of crops, providing important decision support. Liu et al. [
13] used multispectral UAVs to obtain multispectral images of wheat canopies at different heights and constructed relationship models between spectral indices, ground-measured LAI, and chlorophyll content using multiple linear regression (MLR), partial least squares regression (PLSR), and back propagation neural network (BPNN) models. The results showed that PLSR and artificial neural networks achieved the highest accuracy in estimating wheat LAI and chlorophyll content. Kganyago et al. [
14] employed PLSR, RF, and gradient boosting to estimate leaf area index, chlorophyll content, and canopy chlorophyll content of crops based on Sentinel-2 imagery. Their research indicates that random forest outperforms the rest in estimating all three biophysical parameters. These studies demonstrate the potential of machine learning algorithms in remote sensing data processing. By combining various algorithms and remote sensing technologies, they can more accurately predict and monitor crop growth conditions. With the continuous development of remote sensing technology and machine learning algorithms, future crop parameter estimation will be more efficient, precise, and adaptable to a more diverse and complex agricultural production environment.
With the development of spectral detection technology, non-destructive remote sensing has become a crucial method for assessing the physicochemical parameters of crops [
15]. In the field of agricultural monitoring and crop management, remote sensing technology can help scientists and farmers conduct a comprehensive assessment of crop growth conditions by obtaining crop characteristic information. Most existing studies rely on data from one source to establish inversion models, although these models can provide estimates of crop growth parameters to some extent, fail to fully exploit the advantages of multisource remote sensing data, and limit the accuracy of the established inversion models. To address the high cost associated with multispectral sensors on drones and the limited spatial resolution of satellite remote sensing, this study proposes a pixel-level fusion approach to integrate satellite remote sensing data with visible light data from drones. Extracts spectral and texture feature information based on the fused image, thereby improving the accuracy of rice growth parameter estimation. Traditional rice growth parameter estimation methods mostly rely on fixed hyperparameter settings or traditional statistical models and cannot flexibly respond to changes in different environments and growth stages. In order to solve this problem, this study proposes an extreme gradient boosting (XGBoost) regression model optimized by combining the sparrow search algorithm (SSA). SSA optimization can not only enhance the tuning effect of XGBoost’s hyperparameters but also avoid over-fitting and greatly improve the training efficiency and prediction performance of the model. Compared with traditional methods, the SSA-optimized XGBoost model can better adapt to the nonlinear relationships in the data and improve the estimation accuracy of rice leaf area index and chlorophyll content. The principal aims of this research are as follows: (a) to obtain high-resolution multispectral images through pixel-level fusion of satellite remote sensing and drone visible light data; (b) to extract spectral and texture features from the fused imagery for accurate estimation of LAI and SPAD; and (c) to utilize SSA to optimize XGBoost regression for improved accuracy of LAI and SPAD estimation. This study also aims to compare the effectiveness of different methods in estimating LAI and SPAD.
2. Materials and Methods
2.1. Study Area Overview
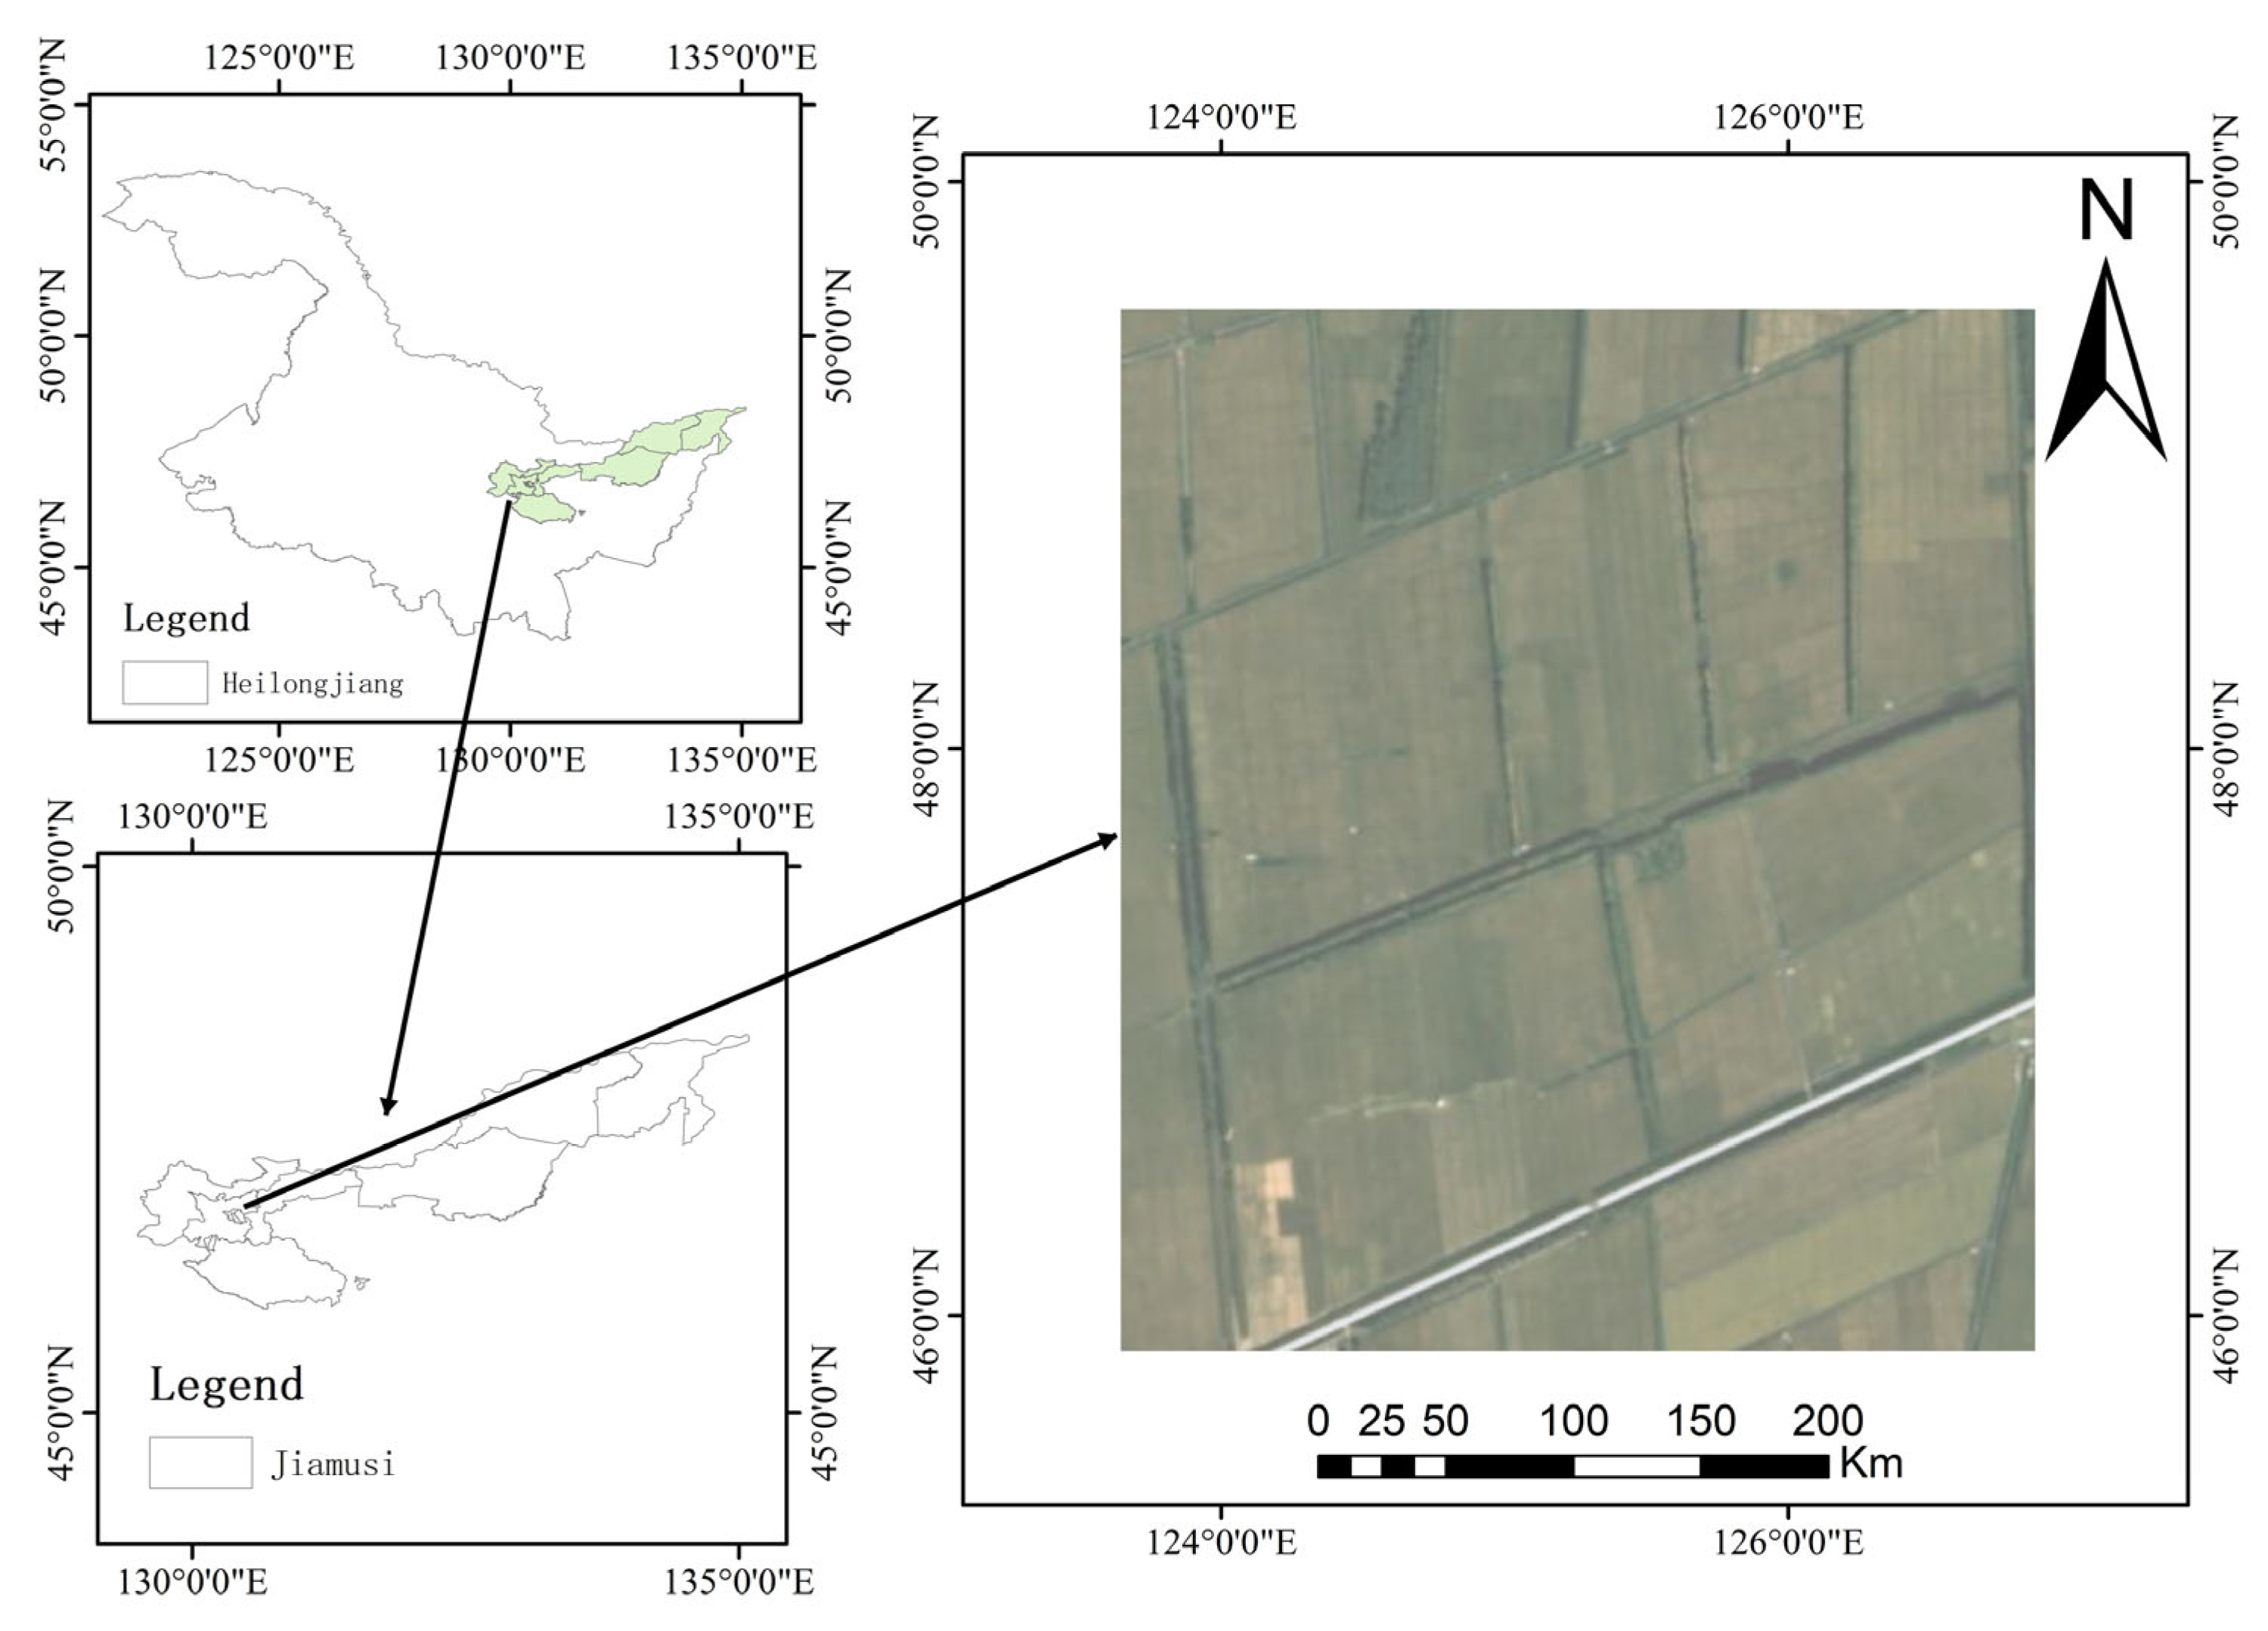
The experiments were conducted on 5 July 2023, at Qixing Farm, Jiamusi City, Heilongjiang Province, China (132.73° E, 47.29° N), as depicted in
Figure 1. The farm is located in the eastern part of the Heilongjiang Reclamation Area, in the Sanjiang Plain hinterland. The terrain is flat with gentle undulations, primarily devoted to rice cultivation. The area experiences a temperate humid climate with continental monsoon influence, characterized by long winters and short summers. The summers feature high temperatures and abundant rainfall, whereas the winters are cold and dry. The yearly average temperature is approximately 3 °C, and the annual precipitation is roughly 500 mm. The frost-free period lasts for approximately 130 days. A mild climate and fertile soil provide an excellent environment for rice growth.
2.2. Collection of Ground Data
A total of 54 uniformly growing 1 m2 plots were selected in the rice field experimental area. The LAI and SPAD values of the rice were collected on 5 July 2023 from 10:00 to 17:00. The LAI was measured using an LAI-2200C plant canopy analyzer, with measurements taken at 1/4 of the length along the two diagonals of each plot. The averaged LAI values were used for each plot. The SPAD values were obtained with a SPAD-502 chlorophyll meter, selecting four healthy top rice leaves from each plot, with the average value used as the chlorophyll content for each plot. After the data collection was completed, corresponding data pretreatment was carried out to ensure the high quality and reliability of the data. By checking the integrity of the LAI and SPAD data for each cell, we can identify and eliminate obvious errors or abnormal data points. For missing values, a linear interpolation method is used—that is, the missing values are estimated through linear fitting of the data from adjacent cells, thereby ensuring the integrity of the data in each cell. Through data preprocessing operations, the accuracy and consistency of the data are ensured, providing a solid and reliable data foundation for the subsequent establishment and analysis of rice growth parameter estimation models.
2.3. UAV-Based Data Acquisition and Preprocessing
The UAV imagery data and the rice ground data were collected synchronously on 5 July 2023. In this study, a standard model of DJI Phantom 4 RTK multicopter drone available on the market was selected, which was equipped with a DJI FC6310R RGB camera to conduct high-resolution imagery acquisition of the research area. The effective payload of the drone is approximately 240 grams, and its flight endurance is 30 min, which can meet the requirements of the data-acquisition task. The DJI FC6310R camera uses an electronic global shutter to ensure the clarity and accuracy of the captured images. To guarantee the quality of the acquired images, the data collection was carried out on clear and windless days, with the data collection time set from 10:00 to 14:00. The UAV was flown at a height of 60 m, the flight speed was 5 m per second, and its flight plan was formulated to have 75% forward and side overlap. The pixel resolution of the DJI FC6310R camera is 5472 × 3648. When the flight altitude is 60 m, the ground resolution is approximately 1.65 centimeters. The digitization footprint of UAV imagery data was about 300 MB per hectare. Since the flying altitude of the UAV is relatively low when shooting and the coverage of the acquired images is small, it is necessary to stitch the collected images of multiple research areas to form a single image covering the entire research area. In this study, Agisoft PhotoScan1.8.0 software was used to stitch UAV images. First, all the captured small-range UAV images were imported into the system, and the automatic alignment function of the software was used to align the images. By detecting common feature points between images, the spatial position and attitude of the images are automatically calculated, so that images taken from different angles can be accurately matched. In addition, data screening is carried out to remove images outside the flight trajectory, and only images on the flight route are retained to reduce the amount of data during splicing, thereby shortening the calculation time and ensuring the accuracy of the splicing results. A more refined dense point cloud model is then generated based on the aligned images. This dense point cloud contains more spatial information and terrain details and is the basis for generating high-quality 3D models and digital surface models (DSMs). Based on dense point clouds, the system further generates high-precision three-dimensional mesh models and performs texture mapping to ensure the visual effects and geometric accuracy of digital orthophoto and digital land models. After the above steps, a high-resolution digital orthophoto image is finally generated.
2.4. Satellite Remote Sensing Image Acquisition
Planet satellites have emerged as remote sensing satellites in recent years, and they are the only satellites in the world with high global resolution, high frequency, and full coverage [
16]. The constellation consists of hundreds of Dove satellites (10
10
30 cm
3), making it the largest fleet of small satellites globally. Currently, the Planet constellations include more than 170 satellites in orbit. In this study, Planet satellite data were acquired from the SuperDove PSB SD sensor within the PlanetScope constellation with the specific parameters detailed in
Table 1. Satellite imagery was captured on 8 July 2023, as close as possible to the UAV data acquisition time to facilitate more accurate analysis of rice. Log in to Planet’s official website to download satellite images of the required area. The digitization footprint of satellite imagery data was approximately 200 KB per hectare. Since the downloaded area is large, it is necessary to clip the image according to the geographical coordinates measured in the field to obtain satellite data. This study uses ENVI5.6 software to achieve image clipping, draws the region of interest (ROI) according to the coordinates, and finally outputs the clipped image. The downloaded data were orthorectified surface reflectance products processed through sensor correction, radiometric calibration, orthorectification, and atmospheric correction, and thus were suitable for subsequent research analysis.
2.5. Multi-Source Image Fusion
Image fusion can be categorized into three levels based on different levels of image representation: pixel-, feature-, and decision-level fusion [
17]. Among these three levels, pixel-level fusion is the most basic level, which directly processes the pixels of the input image. Since the fusion involves the pixel information of the image, more details and accurate spatial information can be retained, and then presented with rich details.
In order to obtain high-resolution multi-spectral images, the Gram–Schmidt (G-S) pixel-level fusion method was used in this study to achieve the fusion of satellite remote sensing and UAV images. Gram–Schmidt fusion optimally matches the spectral bands involved in the fusion process through statistical analysis, addressing issues such as overconcentration of certain band information in traditional fusion methods and inconsistencies in spectral responses emanating from the extended wavelength range of new high-spatial-resolution panchromatic bands. Compared with other image fusion methods, the G-S fusion method has stronger spectral information fidelity, can preserve the original spectral characteristics of the image to the greatest extent during the fusion process, and ensures that the images before and after fusion remain in spectral aspects. Consistency is extremely critical for accurate remote sensing data analysis. The G-S fusion process includes multiple steps: first, a low-resolution satellite remote sensing image is used to simulate a low-resolution panchromatic band image as the first component of the G-S transformation; then, the simulated panchromatic band and the original multi-spectral band satellite image are subjected to G-S transformation, and the mean value and standard deviation of the first principal component of the transformed image are calculated. Next, the mean and standard deviation of the drone panchromatic image are calculated, and the mean and standard deviation of the drone panchromatic image are adjusted according to the mean and standard deviation of the first principal component of the image after G-S transformation, so that it can be better matched with satellite remote sensing images in terms of statistical characteristics. Through this adjustment, a modified high-resolution panchromatic image is obtained. Finally, the G-S transformed image and the modified high-resolution panchromatic band image are subjected to G-S inverse transformation, and the information separated in the previous transformation process is recombined to finally obtain a fused high-resolution multi-spectral image. Since the statistical characteristics and correlation of each band are fully considered during the fusion process, spectral distortion can be effectively avoided so that the fused image maintains the spectral characteristics of the original image to the greatest extent and achieves optimization in terms of spatial resolution and spectral fidelity, providing more reliable data support for subsequent remote sensing analysis.
Figure 2 details the complete workflow from image acquisition to fusion of UAV and satellite remote sensing images.
2.6. Vegetation Indices and Texture Feature Selection
Vegetation indices such as LAI and SPAD are simple, effective, and empirical measures of surface vegetation conditions capable of effectively estimating vegetation characteristics [
18]. Based on previous research findings, this study selected eight vegetation indices related to LAI and chlorophyll to estimate the rice LAI and SPAD. The selected vegetation indices are presented in
Table 2.
Texture features are global characteristics that reflect the visual patterns of homogeneity within images. The gray level co-occurrence matrix (GLCM) [
27] exhibits strong adaptability and robustness [
28]. This study develops in-depth mining of texture features based on GLCM. During the GLCM texture extraction process, the window size is set to 3 × 3, and the texture direction is set to 0 degrees. Based on this setting, GLCM is used to calculate statistical attributes used to quantitatively describe texture features, including mean value, variance, degree of homogeneity, contrast value, dissimilarity measure, entropy value, angular second moment (ASM), and correlation. The calculation formulas are shown in
Table 3.
2.7. Model Construction
This study was based on the selected vegetation indices and texture features. By computing their correlations with LAI and chlorophyll content, the optimal vegetation indices and texture features were screened. Subsequently, four estimation models—multiple linear regression, partial least squares regression, support vector regression, and extreme gradient boosting regression—were optimized using the sparrow search algorithm for comparative analysis. The model for estimating rice LAI and chlorophyll content was constructed using Python3.8.
Multiple linear regression [
29], a type of statistical method, is utilized for modeling the linear connection of a dependent variable to multiple independent variables by means of regression equations, whereby several independent variables are considered to provide a straightforward representation of their relationships with the dependent variables [
30]. MLR quantifies the impact of each independent variable using regression coefficients, which are calculated by minimizing the sum of the squared residuals between the observed data points and the regression line.
Partial least squares regression [
31] is a multivariate data analysis method in machine learning that addresses the issue of multicollinearity among the independent variables of MLR [
32]. This is achieved by finding new orthogonal projection directions (principal components) that maximize the covariance between the projected dependent and independent variables, thereby establishing a predictive model. PLSR is capable of building accurate models even with relatively small sample sizes, making it suitable for many practical data analysis problems [
33,
34].
Support vector regression (SVR) [
35] extends the concept of SVM from classification to regression problems, aiming to determine a decision boundary that minimizes the difference between the predicted and actual values within a certain tolerance. The core of SVR involves optimization to determine the best hyperplane that minimizes the prediction error of the model. SVR demonstrates good estimation potential because of its generality, robustness, and effectiveness when dealing with data in multiple dimensions and nonlinear issues, while demonstrating robust generalization capabilities [
36,
37].
Extreme gradient boosting regression [
38] is a predictive modeling technique that iteratively trains multiple weak learners (decision trees) and combines them into a powerful ensemble model. Based on gradient boosting decision trees (GBDT) [
39], XGBoost constructs an optimal model by defining an objective function that evaluates the quality of the tree structures. The objective function consists of a loss function and a regularization term. XGBoost employs gradient boosting to train the model. In each iteration, the algorithm computes the gradient of the loss function and adjusts the predictions of the current model using this gradient information to minimize the loss function and build an optimal model.
The sparrow search algorithm [
40] optimizes XGBoost by leveraging a novel swarm intelligence technique. In natural settings, individuals in sparrow populations monitor each other to enhance their foraging rates, often competing for food resources among high-yield companions. During foraging, all individuals remain vigilant to avoid predators. SSA draws inspiration from these biological behaviors and abstracts rules to ultimately determine the optimal function values. This study applied SSA to search for the best parameter combinations within the XGBoost model, including the learning rate, number of trees, and depth. By utilizing SSA for global optimization, superior configurations can be identified within the parameter space, thereby enhancing the performance of XGBoost model generalization. This approach enables a more accurate estimation of LAI and chlorophyll content, making the constructed models more effective in practical applications.
2.8. Model Evaluation Metrics
The collected data were randomly separated into a training set and a testing set, where 70% of the data were earmarked for constructing the model and 30% for its validation. The accuracy of the model inversion was evaluated using the coefficient of determination (R
2) and root mean square error (RMSE). R
2 is the ratio of the variance of the predicted values to that of the actual values, indicating how well the model explains the variability of the response variable. Its values fall within the interval of 0 to 1, and when the values are nearer to 1, it indicates a higher degree of fit to the data, while those closer to 0 poorly explain the variability in response variables. The RMSE is the result of calculating the square root of the average of the squared differences between the values predicted and the values that are actually observed, reflecting the magnitude of the deviation between them. R
2 and RMSE are expressed as follows:
In the above equations, denotes the current sample index; represents the total number of samples; stands for the true value of each sample; denotes the predicted value for each sample; and denotes the mean of the true values across all samples.
3. Results
3.1. Correlation Analysis
Pearson correlation analysis was conducted between selected vegetation indices and textural features using actual measurements of rice LAI and SPAD [
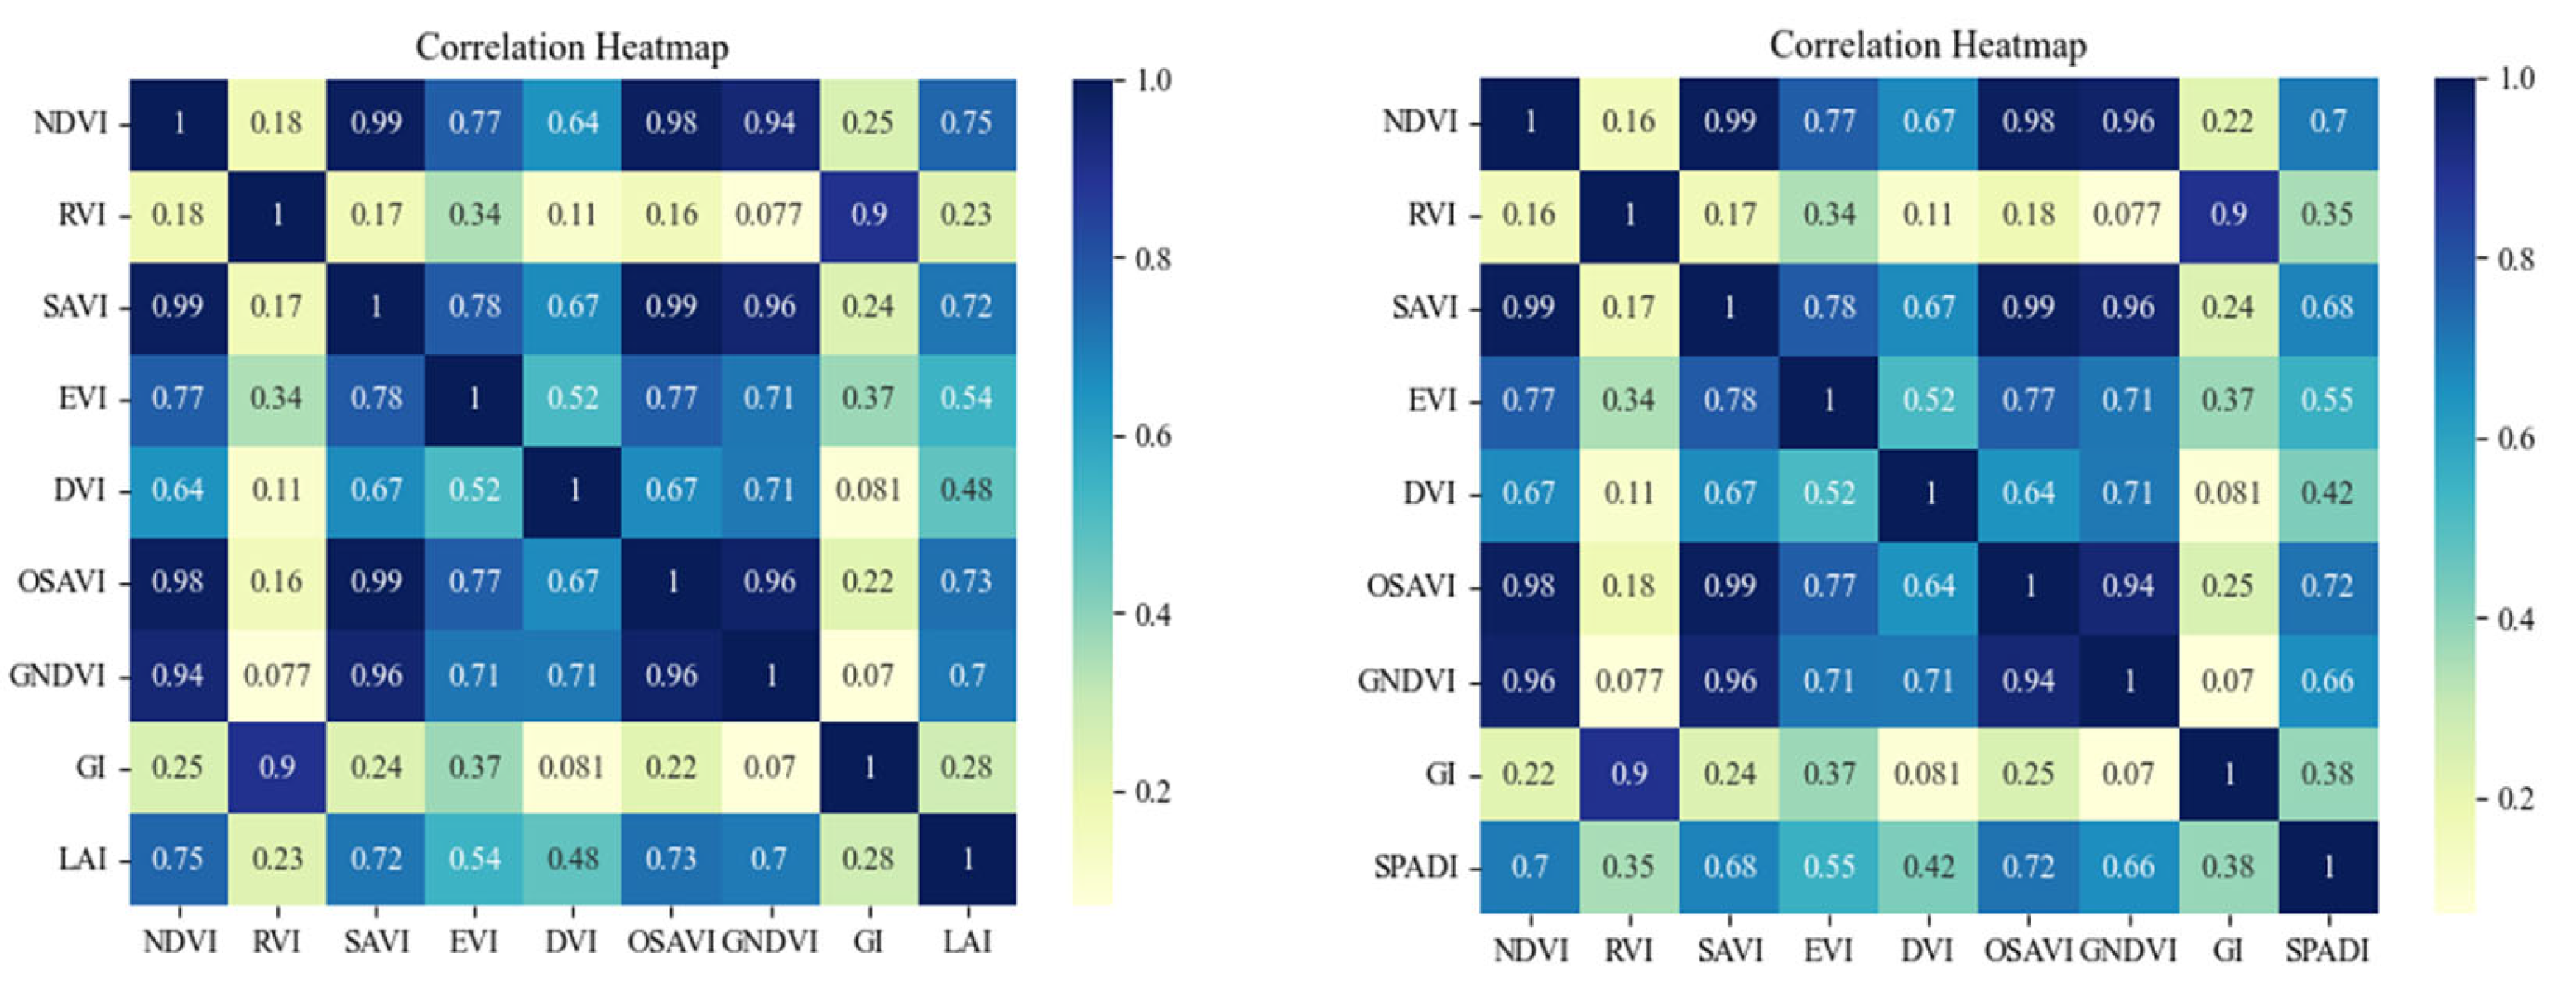
41]. We performed correlation analysis to assess the effectiveness and applicability of various vegetation indices and texture features in estimating rice leaf area index (LAI) and SPAD values. The correlation coefficients of the eight vegetation indices with rice LAI and SPAD are shown in
Table 4, and the correlation heat diagram is shown in
Figure 3. The NDVI has the highest correlation with LAI, exhibiting a positive correlation coefficient of 0.752. This suggests that the NDVI can be effectively used to monitor the growth of rice, especially in areas with higher leaf coverage. The SAVI, OSAVI, and GNDVI also show strong correlations with coefficients of 0.7 or higher; this further indicates that these vegetation indices can effectively estimate the leaf area index. The EVI and DVI show a moderate level of correlation with LAI. Specifically, the coefficient for the EVI in relation to LAI is 0.543, and for the DVI, it is 0.477. This means that they can reflect the growth status of rice to some extent, but their predictive accuracy is relatively low. The RVI and GI show lower correlations with LAI, with coefficients of 0.232 and 0.281, respectively. These indices may not fully reflect the changes in the LAI. The OSAVI exhibits the highest correlation with SPAD, with a coefficient of 0.722. This indicates that the OSAVI can more accurately estimate the rice chlorophyll content. The correlations of the NDVI, SAVI, EVI, and GNDVI with SPAD are above 0.5; this indicates that these indices have a certain sensitivity in assessing the chlorophyll content of rice. And the RVI, DVI, and GI show lower correlations with SPAD, with coefficients of 0.352, 0.421, and 0.381, respectively. These vegetation indices may contribute limitedly to the prediction of SPAD.
Table 5 compares the correlations between the LAI, SPAD, and texture features, and the correlation heat diagram is shown in
Figure 4. DIS shows the highest correlation with LAI and SPAD, both exhibiting significant positive correlations with coefficients of 0.762 and 0.764, respectively. This suggests that DIS has high effectiveness in reflecting the LAI and SPAD. HOM, CON, ENT, and ASM also show relatively strong correlations with LAI and SPAD, with absolute coefficients ranging from 0.5 to 0.75. This suggests that these texture features can effectively complement vegetation indices, providing additional information about rice growth status. In contrast, MEA, VAR, and COR show lower correlations with the LAI and SPAD, although not significant, and they may be insufficient for practical applications in rice growth monitoring.
3.2. Comparative Analysis of Different Optimization Algorithms
The sparrow search algorithm (SSA) is a global optimization algorithm based on swarm intelligence that can effectively explore the parameter space, reduce computational complexity, and improve global search capabilities, thereby avoiding falling into local optimal solutions. Therefore, this study uses the SSA algorithm to optimize the XGBoost model. In order to further evaluate the performance of SSA in optimizing the XGBoost model, this study uses a variety of common optimization algorithms, including genetic algorithm (GA), particle swarm optimization algorithm (PSO), ant colony algorithm (ACO), and sparrow search algorithm (SSA) used in this study. Each algorithm is used to optimize the hyperparameter settings of the XGBoost model and compare its application effect in rice leaf area index and chlorophyll content estimation. In the study, R
2 and RMSE were used as evaluation indicators to quantitatively evaluate the model performance under different optimization algorithms.
Table 6 and
Table 7 show the results of different optimization algorithms in LAI and SPAD estimation, respectively.
It can be seen in the data in the table that the SSA-optimized XGBoost model shows significant advantages in estimating rice LAI and SPAD. In LAI estimation, among the models built using spectral characteristics (NDVI), the SSA-XGBoost regression model performed best, with an R2 of 0.694 on the test set, proving its efficiency in capturing and utilizing spectral characteristic information. The XGBoost model optimized by GA performs poorly. The reason is that GA mainly relies on genetic operators such as crossover and mutation to update the population, which can easily fall into local optimization during the search process, and it is difficult to fully mine potential information in spectral features. When building models based on texture features (DIS), although the accuracy of the PSO-XGBoost regression model is relatively high (R2 = 0.406), when spectral and texture features are combined, the performance of the SSA-XGBoost model is more prominent, with R2 reaching 0.904, demonstrating the advantages of the SSA optimized model under feature combinations. The results show that the SSA-optimized XGBoost model can effectively learn and fit potential relationships between complex features and build a more accurate prediction model. In the case of the PSO algorithm, as particles are prone to gathering in local areas, it is difficult to effectively integrate the complex correlations between different features. For GA, due to the randomness of its genetic operations, it is hard to precisely locate the optimal solution in the complex space of feature combinations. Although the ACO algorithm can perform searches through the pheromone mechanism, when it comes to multi-feature fusion, its update mechanism fails to effectively adapt to the complex relationships among features.
In SPAD estimation, the PSO-XGBoost regression model built based on spectral features (OSAVI) performed best, with an R2 of 0.460 on the test set, while the ACO-XGBoost regression model built based on texture features (DIS) had higher accuracy, with an R2 of 0.562. However, when combining spectral and texture features, the model built by SSA-XGBoost has the best effect, with an R2 of 0.857, which further proves the advantages of SSA optimization in handling multi-source information fusion. PSO has certain advantages when processing a single feature, but its simple particle update rules make it difficult to take into account the complex associations of multiple features when combining features. However, ACO’s update mechanism responds slowly in multiple feature fusion scenarios and is difficult to quickly adapt to new feature combination patterns.
3.3. Estimation of Rice LAI and SPAD
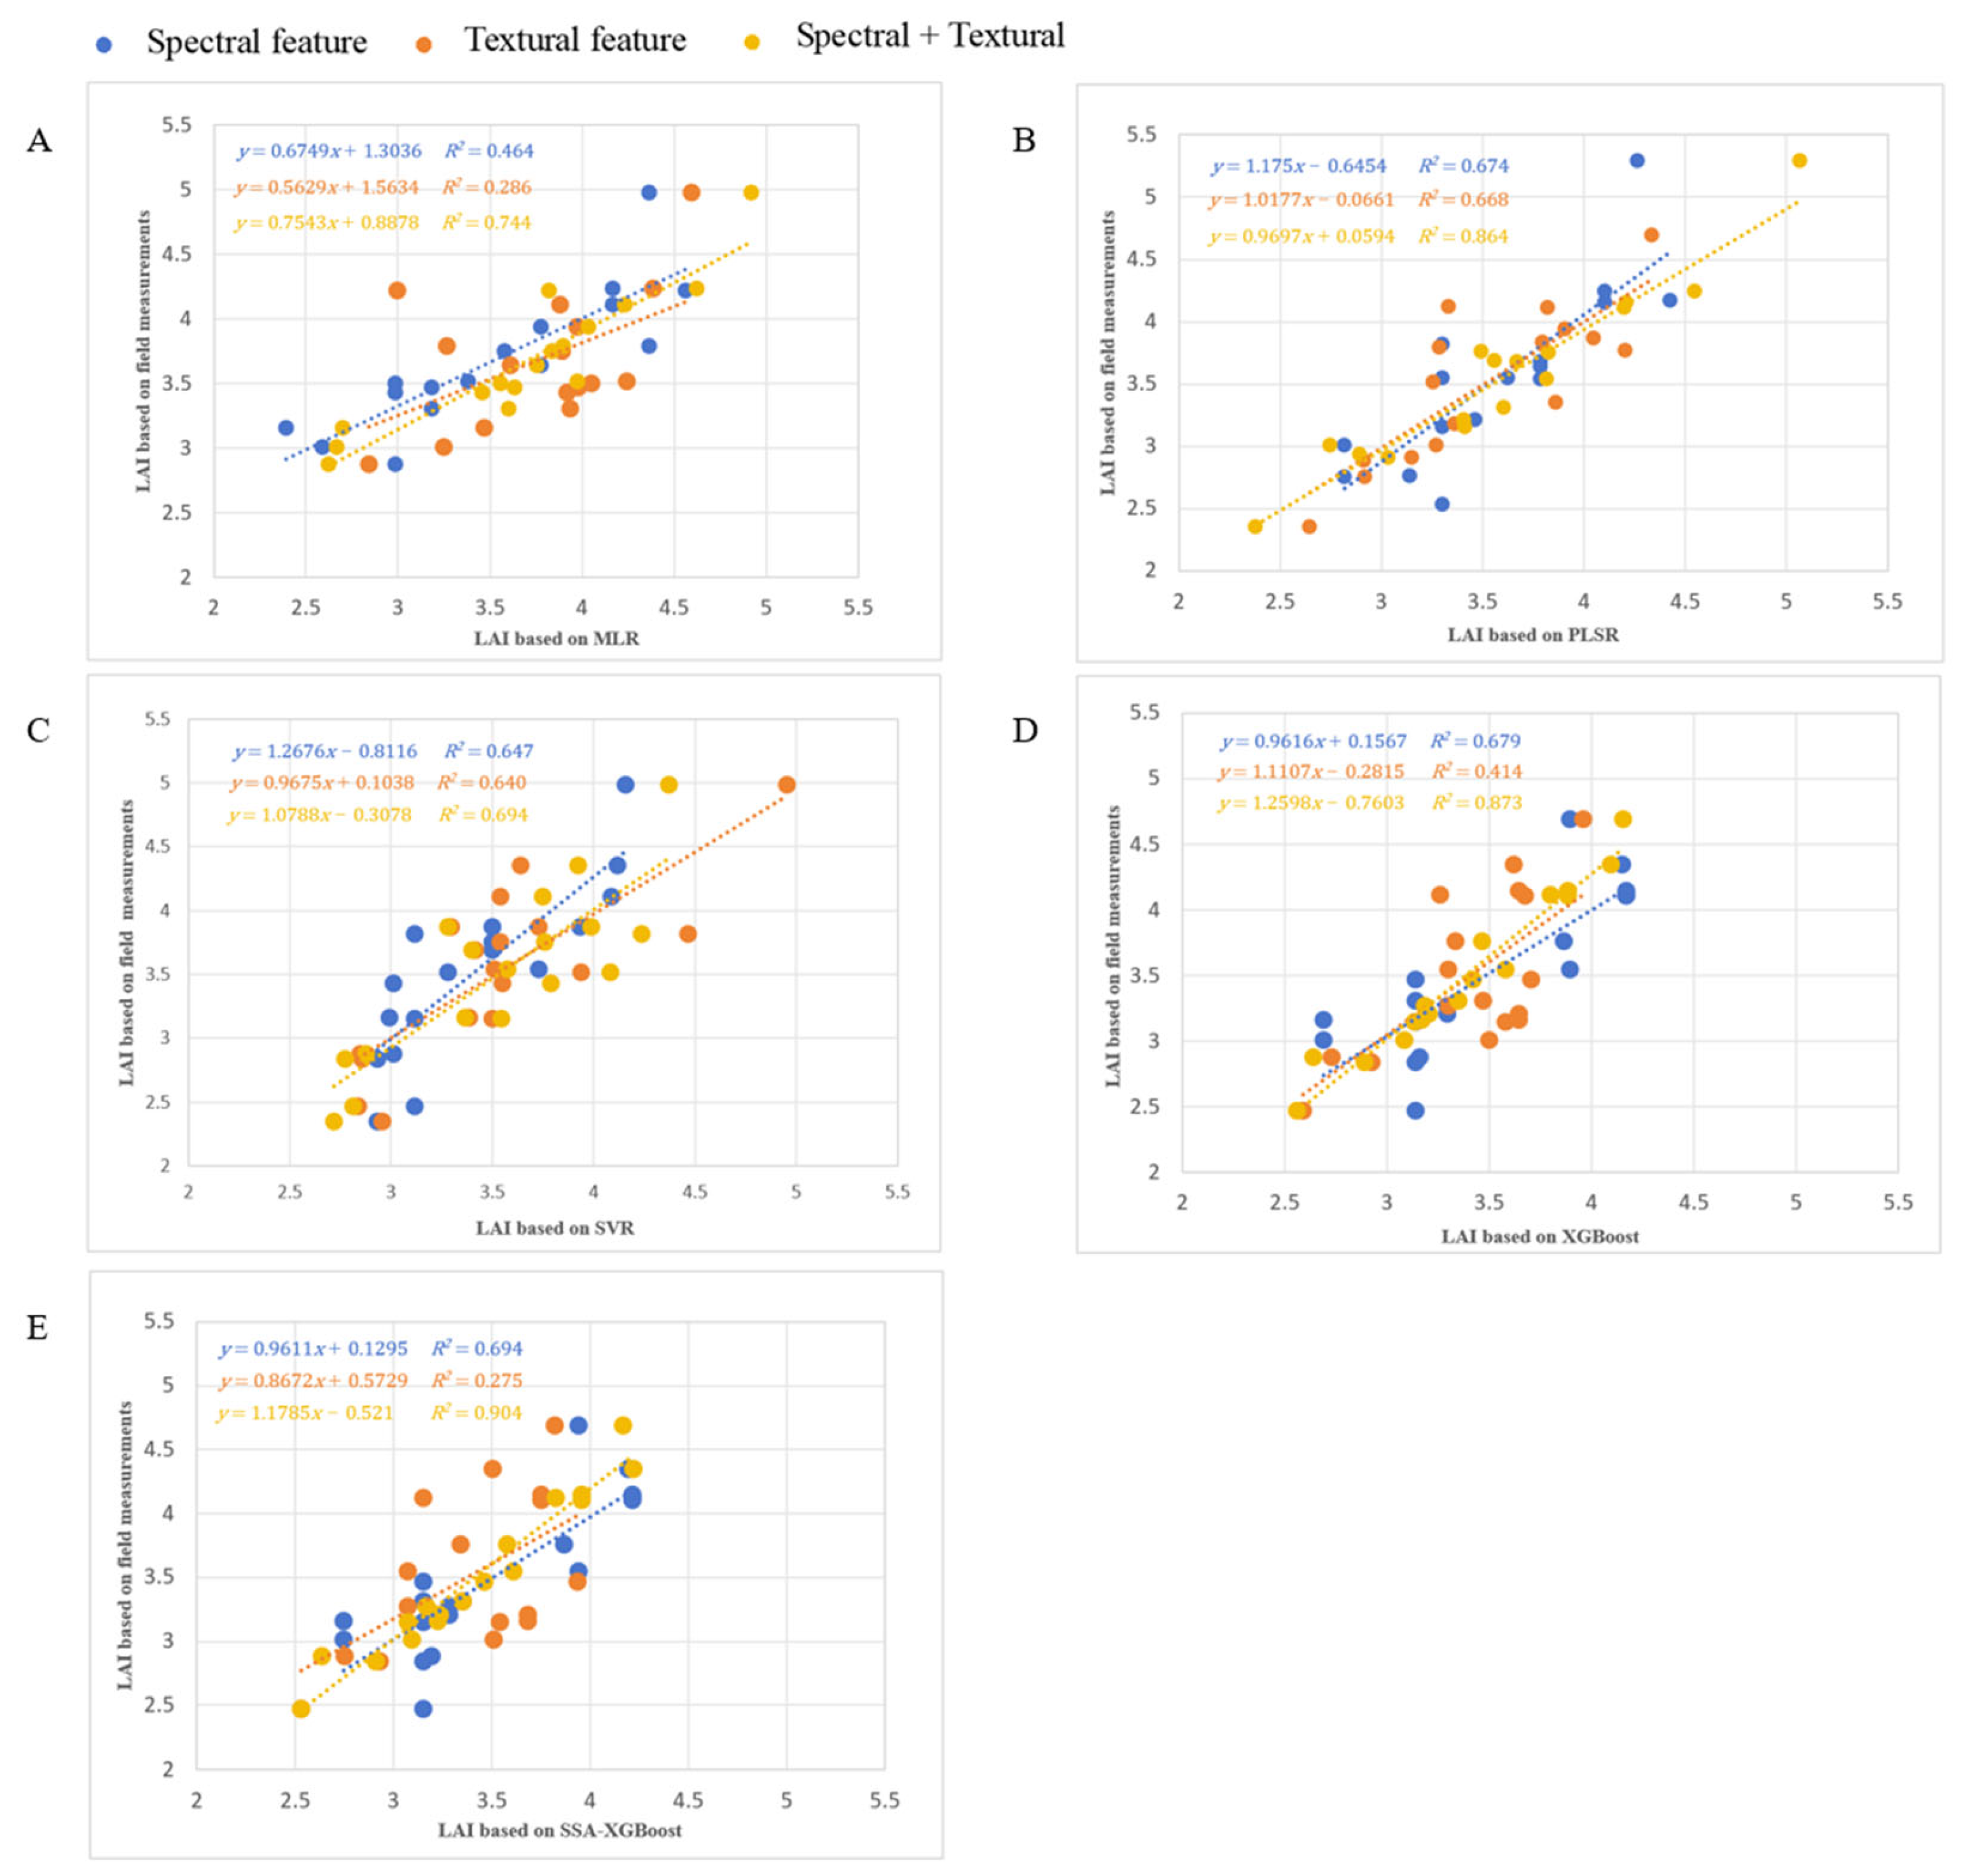
In this study, we employed five methods—MLR, PLSR, SVR, XGBoost, and SSA-XGBoost—to construct estimation models for rice LAI and SPAD using spectral features, textural features, and combinations of spectral and textural features that exhibited the highest correlations with LAI and SPAD. We quantitatively evaluated the prediction performance of these models based on the differences between estimated and measured values (R
2 and RMSE), aiming to establish the most suitable models for estimating rice leaf area index and chlorophyll content. The evaluation metrics for the LAI estimation models are presented in
Table 8. The models based on spectral features, such as the NDVI, demonstrated higher accuracy than those based on textural features, such as DIS. Specifically, the SSA-XGBoost regression model based on spectral features, namely, the NDVI, performed the best, achieving an R
2 value of 0.694 for the test set. When spectral features were used to construct LAI inversion models, the SSA-XGBoost proposed in this study provided a better estimation of the LAI. The PLSR regression model based on textural features, namely, DIS, showed the highest accuracy, with an R
2 of 0.668, which was slightly lower than that of the spectral features, indicating the potential application of textural features in constructing LAI estimation models for rice. To enhance the LAI estimation accuracy, models were constructed by combining spectral and textural features. Compared to using only single spectral or texture features, the accuracy of the models constructed after integrating multiple features showed a significant improvement. Among the five methods compared, the SSA-XGBoost model proposed in this study achieved the best performance, with an R
2 of 0.904, effectively estimating LAI inversion.
Figure 5 illustrates the results of the test set for the five methods based on single features and feature combinations. The SSA-XGBoost model, constructed with integrated multi-feature inputs, outperformed the other models in terms of LAI estimation accuracy, showing high consistency between the predicted and measured values.
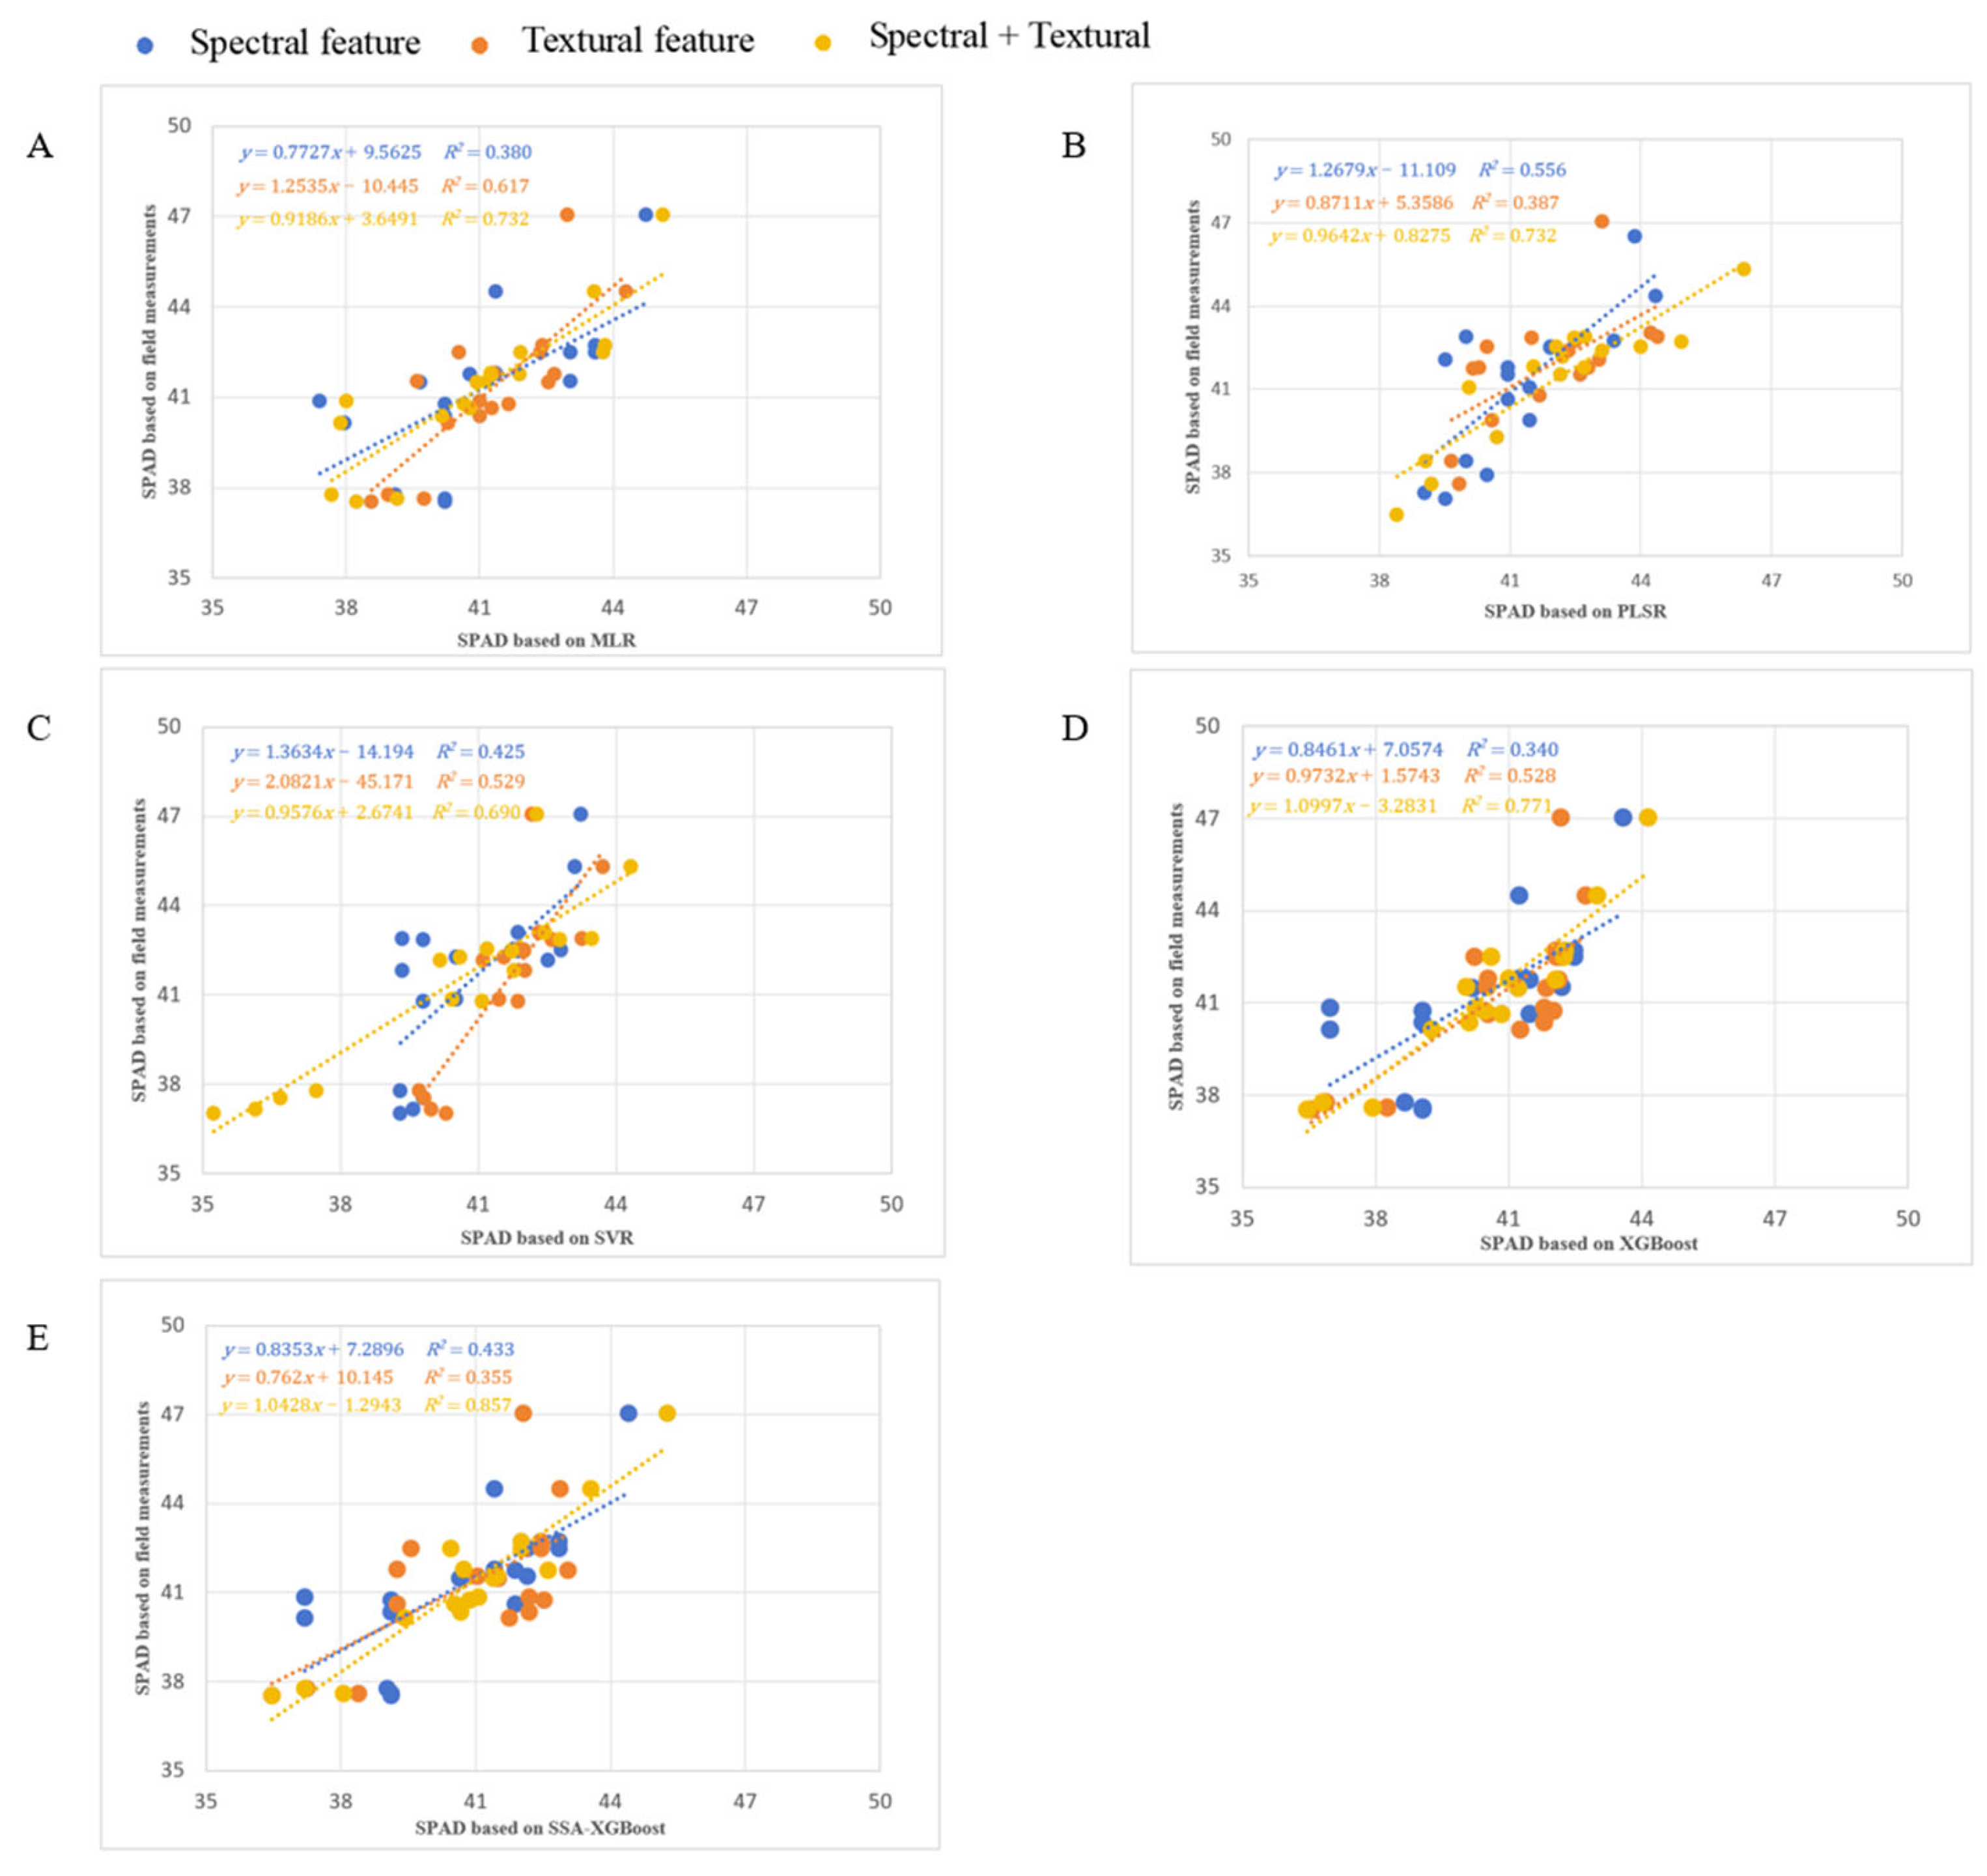
The evaluation metrics for the SPAD estimation models are listed in
Table 9. Models based on single spectral features (OSAVI) and texture features (DIS) showed poor accuracy. The PLSR regression model based on spectral features (OSAVI) performed the best with an R
2 of 0.556 on the test set, whereas the SSA-XGBoost regression model achieved an R
2 of 0.443. Among the models constructed with texture features (DIS), the MLR model achieved the highest level of accuracy, boasting an R
2 of 0.617, whereas the SSA-XGBoost regression model achieved an R
2 of 0.355, indicating poorer performance. Notably, the SSA-XGBoost models proposed in this study based on single features did not accurately estimate SPAD. To improve SPAD estimation accuracy, models were constructed by combining spectral and textural features, whereby significant improvements in accuracy were achieved using multi-feature integration. Compared to the other four methods, the SSA-XGBoost model proposed in this study showed the best performance, with an R
2 of 0.857, effectively estimating SPAD.
Figure 6 illustrates the results of the test set for the five methods based on single features and feature combinations. Clearly, the SSA-XGBoost model constructed with multiple integrated features outperforms the other models in terms of accuracy for SPAD estimation, demonstrating higher precision in predicted values compared to measured values.
4. Discussion
In agriculture, remote sensing has emerged as an essential instrument for overseeing crop growth. UAVs, known for their flexibility and ease of operation, can capture detailed surface information. Equipped with multispectral sensors, UAVs obtain images of crops, and the extracted information is used to infer crop growth parameters, which is a widely researched area. Satellite remote sensing, with its broad coverage and rich spectral information, plays a significant role in agriculture. However, multispectral sensors are costly, and satellite remote sensing suffers from a low spatial resolution. This study proposes a solution by fusing satellite remote sensing images of rice fields with visible-light images captured by UAVs. This fusion yields high-resolution multispectral images, from which both spectral and textural features are extracted. Various algorithms are then constructed based on these features to estimate rice growth parameters. The results demonstrate the feasibility of estimating rice growth parameters through the fusion of satellite remote sensing and UAV visible-light images.
The selection of model variables significantly affects the accuracy when constructing models to estimate rice growth parameters. Choosing variables that are highly correlated with the LAI and SPAD can notably enhance estimation precision. In their study, Haolei et al. [
42] utilized five multispectral indices (the NDVI, GNDVI, NDRE, LCI, and OSAVI), demonstrating that the NDVI is optimal for predicting LAI, achieving an R
2 of 0.809 using their optimized model. In this study, we explored eight vegetation indices, calculating their correlation with the LAI and SPAD, thereby selecting the most highly correlated variables to construct models for estimating rice's LAI and SPAD. The NDVI exhibited the highest correlation with LAI, and the SSA-XGBoost model based on the NDVI demonstrated the highest estimation accuracy. The OSAVI showed the highest correlation with SPAD, and the PLSR model based on the OSAVI achieved the highest estimation accuracy. Currently, most studies rely on single spectral features to build models for estimating rice growth parameters, which may contain limited and saturating information [
43], thereby restricting the model accuracy. Textural features reflect structural and periodic variations on object surfaces. Previous studies successfully employed textural features to estimate crop growth parameters. Incorporating texture features into model variables for LAI and SPAD estimation can enhance accuracy. Models integrating spectral and textural features significantly improved estimation accuracy compared to those based solely on spectral features. This study demonstrates that integrating texture features into model variables enhances estimation accuracy, which presents a new way for future investigations into estimating rice the LAI and SPAD. Pearson’s correlation coefficients were used to determine the vegetation indices and textural features most correlated with the LAI and SPAD, employing the variables with the highest correlation for modeling. However, further research is required to explore the combined modeling of multiple highly correlated vegetation indices and textural features.
When constructing models to estimate crop growth parameters, the choice of modeling algorithm significantly affects estimation accuracy. Current research on crop growth parameter estimation often employs traditional regression methods or machine-learning algorithms. Wang et al. [
44] utilized multispectral drone remote-sensing data, selected five vegetation indices that were highly correlated with the leaf area index, and built a soybean LAI estimation model using simple linear regression, with an R
2 of 0.737 and an RMSE of 0.274. Traditional linear regression methods often yield limited accuracy, whereas machine learning, with its unique advantages, has gradually replaced stepwise regression and has found wide application in crop monitoring [
45]. Mouafik et al. [
46] developed LAI prediction models using random forest and obtained R
2 values of 0.89, 0.93, and 0.92 on Sentinel-2, UAV imagery, and Mohammed VI satellite data, respectively, demonstrating high consistency between predicted and measured values. In this study, five methods—MLR, PLSR, SVR, XGBoost, and SSA-XGBoost—were selected to construct and analyze the estimation models. MLR is a straightforward method that describes the relationships between variables using linear equations and provides relatively accurate predictions. PLSR combines the advantages of principal component analysis (PCA), MLR, and canonical-correlation analysis (CCA3), offering stability and high precision in regression analyses involving single or multiple predictors [
47]. SVR, based on support vector machines, minimizes errors and maximizes margins by identifying support vectors, excelling in small sample sizes, non-linear regression, and high-dimensional data, thereby demonstrating strong generalization capabilities for small datasets. XGBoost, which combines multiple weak classifiers, builds highly accurate models with excellent generalization. SSA-XGBoost, which integrates spectral and textural features, achieved the highest accuracy in estimating rice LAI and SPAD, surpassing the other models. This superiority may be attributed to XGBoost’s optimization techniques, regularization parameters that prevent overfitting, and its efficient evaluation of feature importance in complex models. This study optimizes the XGBoost parameters using SSA and, as a result, boosts the accuracy of the estimation model. In order to better evaluate the optimization effect of the SSA algorithm, this study compares it with GA, PSO, and ACO. The results show that compared with other optimization algorithms, SSA can more effectively avoid falling into local optima in complex feature combination tasks and fully tap the potential advantages of each feature. SSA’s search mechanism can flexibly adjust search strategies by simulating the behavior of sparrows. Especially in the case of multiple feature fusion, it can accurately capture the relationship between different features, thereby greatly improving the prediction ability and stability of the model. In summary, the proposed SSA-XGBoost offers valuable insights and methodologies for future crop growth parameter estimation models.
In this study, the SSA-XGBoost model performed well on the current dataset, but whether its prediction accuracy can be consistent on datasets from different regions or different growth stages is still a question worthy of further exploration. In addition, this study only considered data from a single growth period to estimate rice growth parameters, which may limit the generalization ability of the model. Data from a single growth period cannot fully reflect the changing characteristics of each stage of rice growth, so the performance of the model may be affected in other growth stages or in different environments. Although SSA has optimized the hyperparameters of the XGBoost model and reduced the risk of overfitting, since this study only models based on data from a single growth period and the data volume is relatively small, the model may over-rely on noise in the training data and local features, and there is still a certain risk of overfitting, which may affect the model’s generalization ability on unknown data sets. In future research, in order to further reduce the risk of overfitting, more diverse training data can be introduced, and more regularization methods can be explored to enhance the robustness and adaptability of the model. At the same time, in order to improve the adaptability and prediction accuracy of the model in different growth stages, future research will also consider introducing multiple growth period data for modeling and estimation to further improve the generalization ability and prediction stability of the model and ensure its performance in diverse datasets.


