Article

Increasing Planting Density with Reduced Topdressing Nitrogen Inputs Increased Nitrogen Use Efficiency and Improved Grain Quality While Maintaining Yields in Weak-Gluten Wheat

1
Agronomy College, Anhui Science and Technology University, Fengyang 233100, China
2
Key Laboratory of Crop Physiology and Ecology, Ministry of Agriculture and Rural Affairs, Institute of Crop Sciences, Chinese Academy of Agricultural Sciences, Beijing 100081, China
*
Authors to whom correspondence should be addressed.
These authors contributed equally to this work.
Agriculture 2025, 15(1), 13; https://doi.org/10.3390/agriculture15010013
Submission received: 19 November 2024 / Revised: 19 December 2024 / Accepted: 23 December 2024 / Published: 25 December 2024
(This article belongs to the Section Crop Production)

Abstract

:
Increasing nitrogen fertilizer will increase wheat grain yield and grain quality at the same time, but the goal of high quality and stable yield in weak-gluten wheat production is to reduce grain protein content and increase grain yield. Our research goal is to reduce nitrogen input while increasing planting density to maintain high quality and stable yield. Field studies were conducted during two successive seasons using a widely planted cultivar, Yangmai 15. We studied the effects of reduced nitrogen topdressing and increased planting density on yield, quality and nitrogen agronomic efficiency. The field experiment was conducted with four nitrogen (N) levels for topdressing at jointing stage: 37.8 (N1), 43.2 (N2), 48.6 (N3) and 54 kg N ha−1 (N4). Moreover, there were three planting densities: 180, 240 and 300 × 104 plants ha−1 (D1, D2 and D3, respectively). When the amount of nitrogen topdressing was reduced, the number of tillers and spikes in each growth period of wheat decreased significantly, and the yield increased first and then decreased, with the highest yield at the level of 48.6 kg N ha−1. When the planting density was increased, the number of tillers and spikes in each growth period of wheat increased significantly, the yield increased significantly, and the yield was the highest at the level of 180 × 104 plants ha−1. Under the same density level, the flag leaf chlorophyll content, leaf area index, nitrogen production efficiency and nitrogen use efficiency decreased with a decrease in the nitrogen application rate. Under the same nitrogen topdressing amount, the nitrogen fertilizer production efficiency and nitrogen fertilizer utilization efficiency increased with the increase in density. The relative chlorophyll content, leaf area index, nitrogen partial factor productivity, nitrogen use efficiency, grain accumulation, grain distribution ratio and grain yield of wheat were the highest under the treatment of a planting density of 300 × 104 plants ha−1 and nitrogen topdressing amount of 48.6 kg N ha−1. The combined decrease in nitrogen recovery and increase in planting density decreased protein content, sedimentation value and wet gluten content. Increasing density significantly improved dry matter accumulation in the population, partially compensating for the yield loss due to nitrogen reduction by increasing the effective number of spikes, thereby further improving grain quality and nitrogen use efficiency. Therefore, agronomic approaches combining low nitrogen and high planting densities may be effective in simultaneously increasing grain yield and nitrogen use efficiency and stabilizing grain processing quality in weakly reinforced wheat.

1. Introduction

Wheat is one of the important food crops in China. It plays a crucial role in ensuring national food security, accounting for approximately 11% of the total food consumed by humans [1]. The middle and lower reaches of the Yangtze River form the core area for producing weak-gluten wheat. The region is rich in heat, light and water resources, making it conducive to the production of weak-gluten wheat [2]. Weak-gluten wheat has low protein content and hardness. It is used as a raw material for making biscuits, cakes and other light-textured baked goods [3]. Increasing demand for cakes, driven by improved dietary habits, has led to a shortage of high-quality weak-gluten wheat for domestic supply [4]. Nitrogen application and planting density are key cultivation factors for achieving high yield and quality of wheat [5]. Optimal nitrogen application and planting density in wheat improve yield and quality synergistically, whereas excessive nitrogen application and high planting density increase the plant population and effective tillers, leading to reduced field ventilation and light transmission that ultimately reduces spike rate and affects yield [6,7]. Therefore, developing high-yield and high-quality weak-gluten wheat is essential to meet per capita consumption needs in China.
The accumulation, transport and distribution of dry matter in wheat are influenced by the environmental conditions, cultivation practices and other factors [8]. Nitrogen fertilizer application and population density are important factors influencing the accumulation and transport of assimilates in wheat after anthesis. Optimal nitrogen fertilizer and planting density can increase the net photosynthetic rate of wheat flag leaves, prolong the photosynthetic function period of leaves and promote the accumulation of assimilates, ultimately enhancing wheat yield [9]. Planting density is closely related to the total number of stems. Optimal planting density improves ventilation and light transmission in the wheat field, leading to increased dry matter accumulation and grain yield [10,11]. At each growth stage, dry matter accumulation in wheat initially increased and then decreased with higher planting density [12]. Optimal nitrogen fertilizer application in wheat promoted dry matter accumulation, whereas excessive nitrogen application prolonged the accumulation period in stems and leaves, leading to delayed maturity [13]. The interaction between the plant density and nitrogen application rate helps coordinate dry matter accumulation before and after anthesis and promote the transfer of dry matter to grains, thereby significantly increasing yield [14].
Nitrogen is an essential mineral element for crop growth [15]. It is estimated that only about half of the nitrogen fertilizer applied to farmland worldwide is recycled in the form of harvested yield [16]. Excessive nitrogen application will increase the cost of farmers’ production, increase soil nitrogen residue and leaching and cause the eutrophication of water bodies, which will have many negative effects on the ecosystem and restrict the sustainable development of agriculture [17]. Therefore, improving agricultural nitrogen use efficiency (NUE) has become a key measure to reduce farmers’ costs, protect the environment and increase crop yield, and has been widely recognized. Previous studies have shown that appropriate topdressing nitrogen fertilizer at the jointing stage can solve the problem of a low nitrogen utilization rate, promote the absorption of nitrogen fertilizer by wheat and achieve the regulation effect of increasing yield and improving grain quality [18]. In adjusting the planting density, nitrogen management or their interaction, a reasonable high-yielding population structure can be constructed to improve wheat grain yield and quality [19]. However, there is no consensus on the effect of the interaction between the nitrogen topdressing rate and planting density on nitrogen utilization and the processing quality of weak-gluten wheat. Therefore, there may be an interaction effect between nitrogen topdressing and planting density on wheat quality. However, there is no consensus on the effect of the interaction between the nitrogen topdressing rate and planting density on the yield, quality or nitrogen use efficiency of weak-gluten wheat. Therefore, it is necessary to explore whether there is an interaction effect between nitrogen topdressing and planting density on the yield, quality and nitrogen use efficiency of weak-gluten wheat.
The nitrogen requirement of weak-gluten wheat is about 180 kg N ha−1, and the quality meets the quality standard of weak-gluten wheat, but the yield may be lower. In order to increase its yield, the density can be appropriately increased to make up for the loss of yield. Therefore, the purposes of this study were to reveal the effects of reducing nitrogen topdressing and increasing planting density on population development characteristics, nitrogen uptake and the utilization, yield and quality of weak-gluten wheat, as well as determine the appropriate combination of nitrogen and density to improve weak-gluten wheat and provide a theoretical basis for actual production and cultivation.

2. Materials and Methods

2.1. Experimental Design

Field experiments were conducted at the Anhui Science and Technology University (117.56° E, 32.88° N), Anhui Province, China, in the wheat growing seasons of 2022–2023 and 2023–2024. The soil type of the test site was clay loam. The wheat variety tested here was the main promoted weak-gluten wheat variety Yangmai 15 along the Huaihe region, and the basal application of N fertilizer was 126 kg N ha−1. We used four nitrogen application levels for topdressing at the jointing stage, 37.8 kg N ha−1 (N1), 43.2 kg N ha−1 (N2), 48.6 kg N ha−1 (N3) and 54 kg N ha−1 (N4), in both growth seasons and another three planting densities included 180, 240 and 300 × 104 ha−1 (D1, D2 and D3, respectively). Yangmai 15, a weak-gluten wheat variety, is widely planted in the wheat ecological region of the lower reaches of the Yangtze River. The region usually uses a nitrogen application rate of 180~240 kg N ha−1 and a planting density of 180~360 × 104 ha−1.
The field experiments were laid out in a two-factor completely randomized design with three replicates for each treatment. The plot size was 3 × 3 m with 10 rows (25 cm between rows). The field management of the experiment was fine, and no pests or diseases occurred. After wheat sowing, water was poured once to ensure seed germination, and other field management measures were the same as those in high-yield fields. The sowing date and harvest date of the first year were 28 October 2022 and 25 May 2023, respectively. The sowing date and harvest date of the second year were 1 November 2023 and 28 May 2024, respectively.

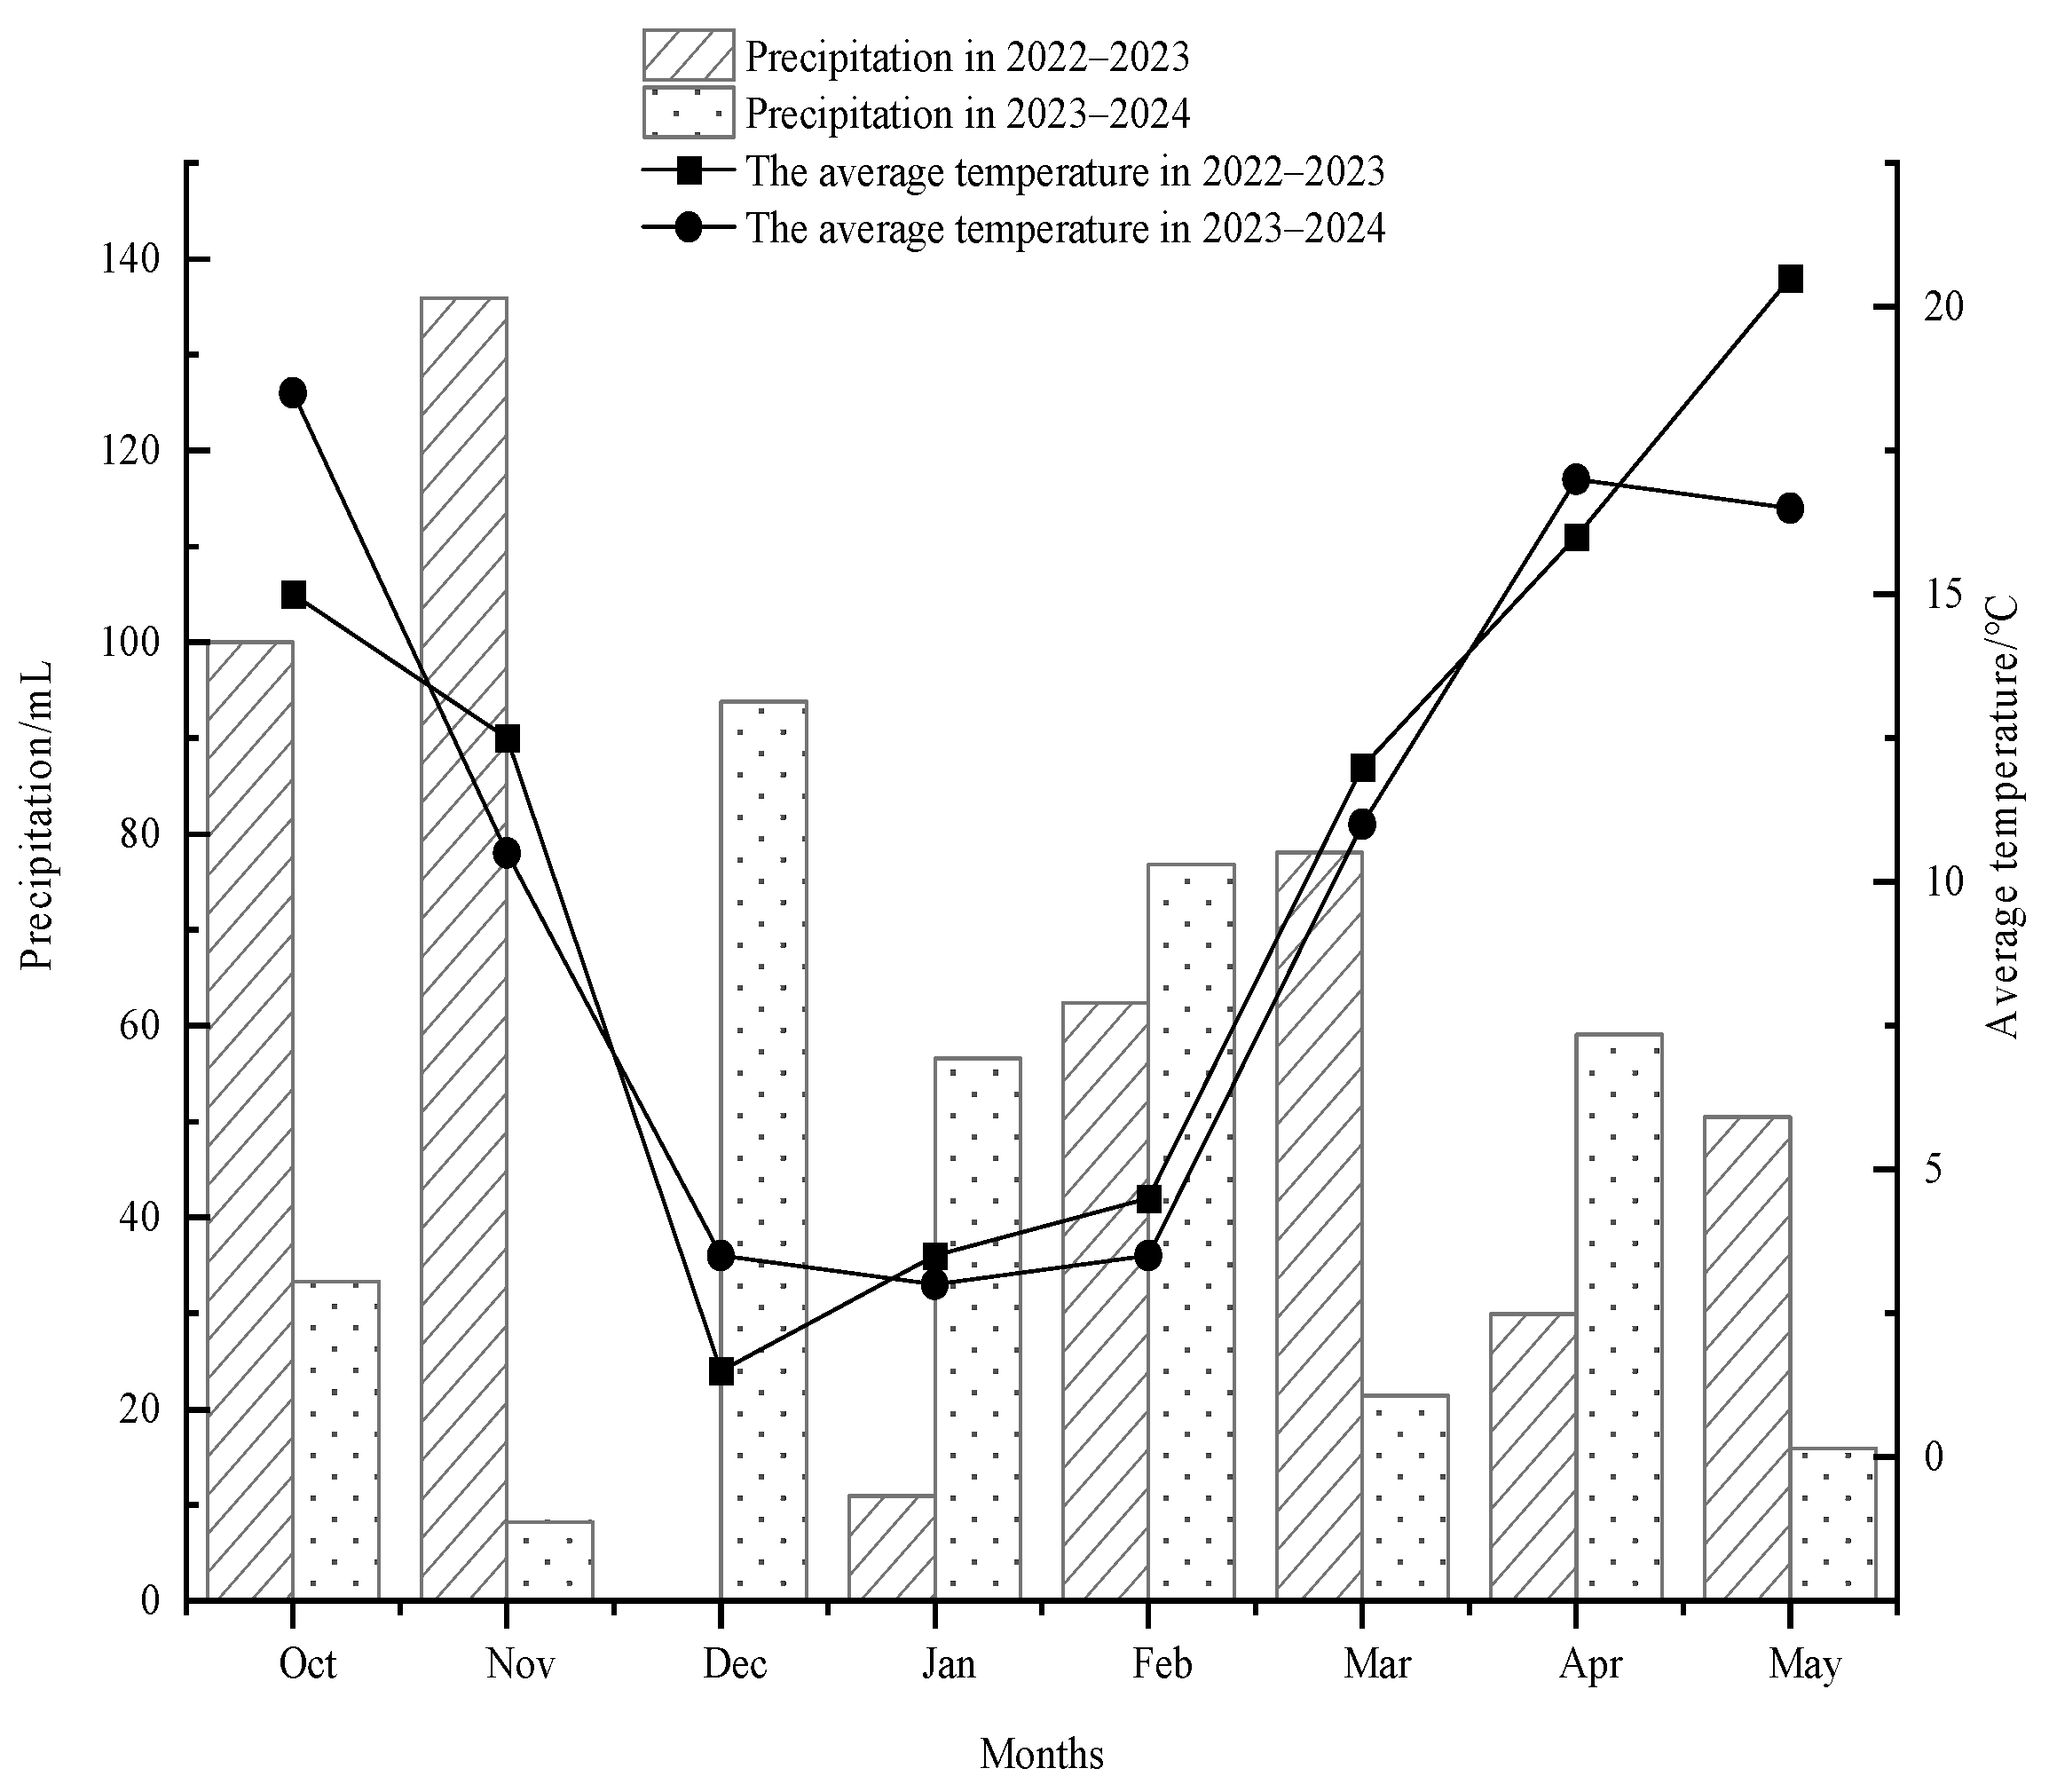
2.2. Overview of the Test Site

The soil texture of the test site was clay loam, and the previous crop was corn. All the phosphorus and potassium fertilizers in the two growing seasons were applied at 90 kg ha−1 for basal fertilization. The nutrient content of the 0–20 cm soil tillage layer is shown in Table 1. Soil nutrient content was determined according to the Rogers method [20]. The average temperature and precipitation in the growing seasons are shown in Figure 1.

2.3. Determination of Leaf Area Index

The leaf area index (LAI) was determined with a plant canopy analyser (Accupar LP-80, METER Group, Inc., Pullman, WA, USA) in selected diagonal areas of each plot during the wheat jointing (GS 31), booting (GS 45), heading (GS 55), anthesis (GS 65) and filling (GS 75), with six replications for each treatment. The Zadocks growth table was used to accurately represent the growth stage.

2.4. Determination of Relative SPAD Content in Flag Leaves

Three representative flag leaf single stems with consistent growth were selected from each plot, and the chlorophyll content of each wheat flag leaf was measured with an SPAD-502Plus chlorophyll metre (Zhejiang Top Instrument, Inc., Hangzhou, China). Attention was paid to avoid the veins, and the average of 9 measurements was the result. These measurements were performed from 9:00 to 11:00 on sunny days at the jointing stage 7, 14, 21 and 28 days after anthesis (DAA) and 35 days after anthesis (DAA).

2.5. Determination of Dry Matter Accumulation and Calculation of Related Parameters

At the flowering and maturity stages, 30 single stems were selected for each treatment, with each treatment repeated on 10 plants. The stems were divided into three parts: stem sheath + leaf, glume + cob and grain. The parts were dried at 80 °C until they reached a constant weight. Dry matter accumulation, transport and distribution were calculated.

2.6. Determination and Calculation of Nitrogen Accumulation

At the flowering stage and maturity stage, 4 uniform plants were selected per replicate for each treatment, for which the whole plant was selected at the flowering stage was, and for the maturity stage, the vegetative organs (stem and sheath, leaf, spike axis, glume) and grain. The samples were dried at 70 °C until they reached a constant weight and then crushed in a plant grinder. The total nitrogen content of the plants was determined with a K-05 automatic nitrogen analyzer (Shengsheng Automatic Analysis Instrument, Inc., Shanghai, China) and the isotope ratio mass spectrometer(Thermo Electron Corporation, Inc., Waltham, MA, USA). Nitrogen accumulation and nitrogen use efficiency in different parts of the plan were calculated according to Wang and Hu et al. [21,22].
Plant N accumulation(kg ha−1) = plant dry matter × plant N content;
Nitrogen transfer from nutrient organs = nitrogen accumulation in nutrient organs at flowering stage − nitrogen accumulation in nutrient organs at maturity stage;
Nitrogen fertilisers utilisation = (amount of nitrogen accumulated by the plant from fertilisers nitrogen/total nitrogen applied) × 100%;
NAE = seed yield/applied nitrogen.

2.7. Determination of Population Dynamics, Yield and Yield Components in Wheat

At the three-leaf stage of wheat, uniform growth areas in each plot were selected for tube marking and seedling establishment. Each plot was set in an area of 1 m2 for a later investigation of the spike count and yield measurements. Then, 45, 60 and 75 seedlings per metre were set at D1, D2 and D3, respectively. At the late stage of irrigation, the number of effective spikes and grains were investigated in the seeded areas of each treatment. Wheat was harvested at maturity for yield measurement, and then dried and threshed. Then, 500 grains were randomly selected to determine the thousand-grain weight, and each treatment was repeated three times.
In each plot, two 1 m rows (representing 1 m2) were selected using bamboo frames. The total stem count of wheat at the wintering period (GS 21) and jointing (GS 31), heading (GS 55), and maturity stages (GS 92), and the panicle-bearing tiller rate was calculated.
Panicle bearing tiller rate = effective panicle number/maximum tiller number × 100%

2.8. Measurement of Quality Traits

Wheat was harvested at maturity and stored in a cold room for 2 months. The protein content and wet gluten in the kernels were determined using a DA 7200 near-infrared analyser (Perten Instruments, Inc., Hägersten, Sweden).

2.9. Data Processing

Analysis of the variance was applied using DPS version 7.0. An LSD test was adopted as a post hoc test at the significance level of p < 0.05. In addition, we also used the origin 2021 version for mapping.

3. Results

3.1. Effect of Nitrogen Supplementation and Density on Wheat Stem Tiller Dynamics

Wheat population tiller dynamics showed a parabolic trend of increasing and then decreasing with increasing fertility, with the maximum value of tiller at the jointing stage, followed by a gradual decline in the number of tillers, which was consistent between the two years (Table 2), followed by a gradual decline in the number of tillers, which was consistent between the two years (Table 2). The effect of overwintering density treatment on the number of wheat tillers was highly significant. Density and nitrogen fertilizer had significant effects on the number of tillers in different years and in all periods after overwintering. At the same density, the number of tillers in each period after the jointing stage decreased significantly with decreased nitrogen supplementation. This pattern was consistent across years, indicating that decreased nitrogen supplementation was unfavourable to wheat tillering. At the same nitrogen level, the number of tillers in each period after the jointing stage increased significantly with increasing density in both years; the pattern was consistent across years (D3 > D2 > D1), and the difference was significant across treatments, indicating that an optimal increase in planting density was favourable to wheat tillering. At D1, the rate of spike formation decreased with decreased nitrogen chasing. At D2 and D3, the rate of spike formation increased with decreased nitrogen chasing and was higher at D3 than at D1, which might explain the low spike formation rate due to low density. The rate of spike formation ranged from 29.34% to 36.54% and was highest at N3D3 in both years. This indicates that the optimal reduction in nitrogen application and increased planting density are favourable for wheat panicle bearing till spike formation, which in turn improves grain yield.

3.2. Effect of Nitrogen Supplementation and Density on the LAI of Wheat

The wheat LAI was driven by a parabolic trend of increasing and then decreasing with the course of fertility (Table 3). Nitrogen fertilization did not significantly affect the wheat LAI at the jointing stage, but the effect was highly significant under density treatments. Different nitrogen application and density treatments had significant effects on the wheat LAI at the late jointing stage; the LAI was more affected by density than nitrogen application, and the performance was consistent between the two years. At the same density, the LAI decreased overall with decreasing nitrogen chasing at D1 and D2, with the highest LAI at N3D3, which increased by 2.87%, 9.30% and 24.16% in 2022–2023 compared with N4, N2 and N1, respectively, and by 0.74%, 4.92% and 15.27% in 2023–2024, respectively. At the same level of nitrogen chasing, the LAI increased with increasing density, where the difference between D3 and D2 treatments was small. For two years, both with N3D3 treatment, the LAI was significantly higher than that with the other treatments. Thus, the combination of D3 and optimal nitrogen application was conducive for improving the wheat LAI and laying the foundation for yield formation.

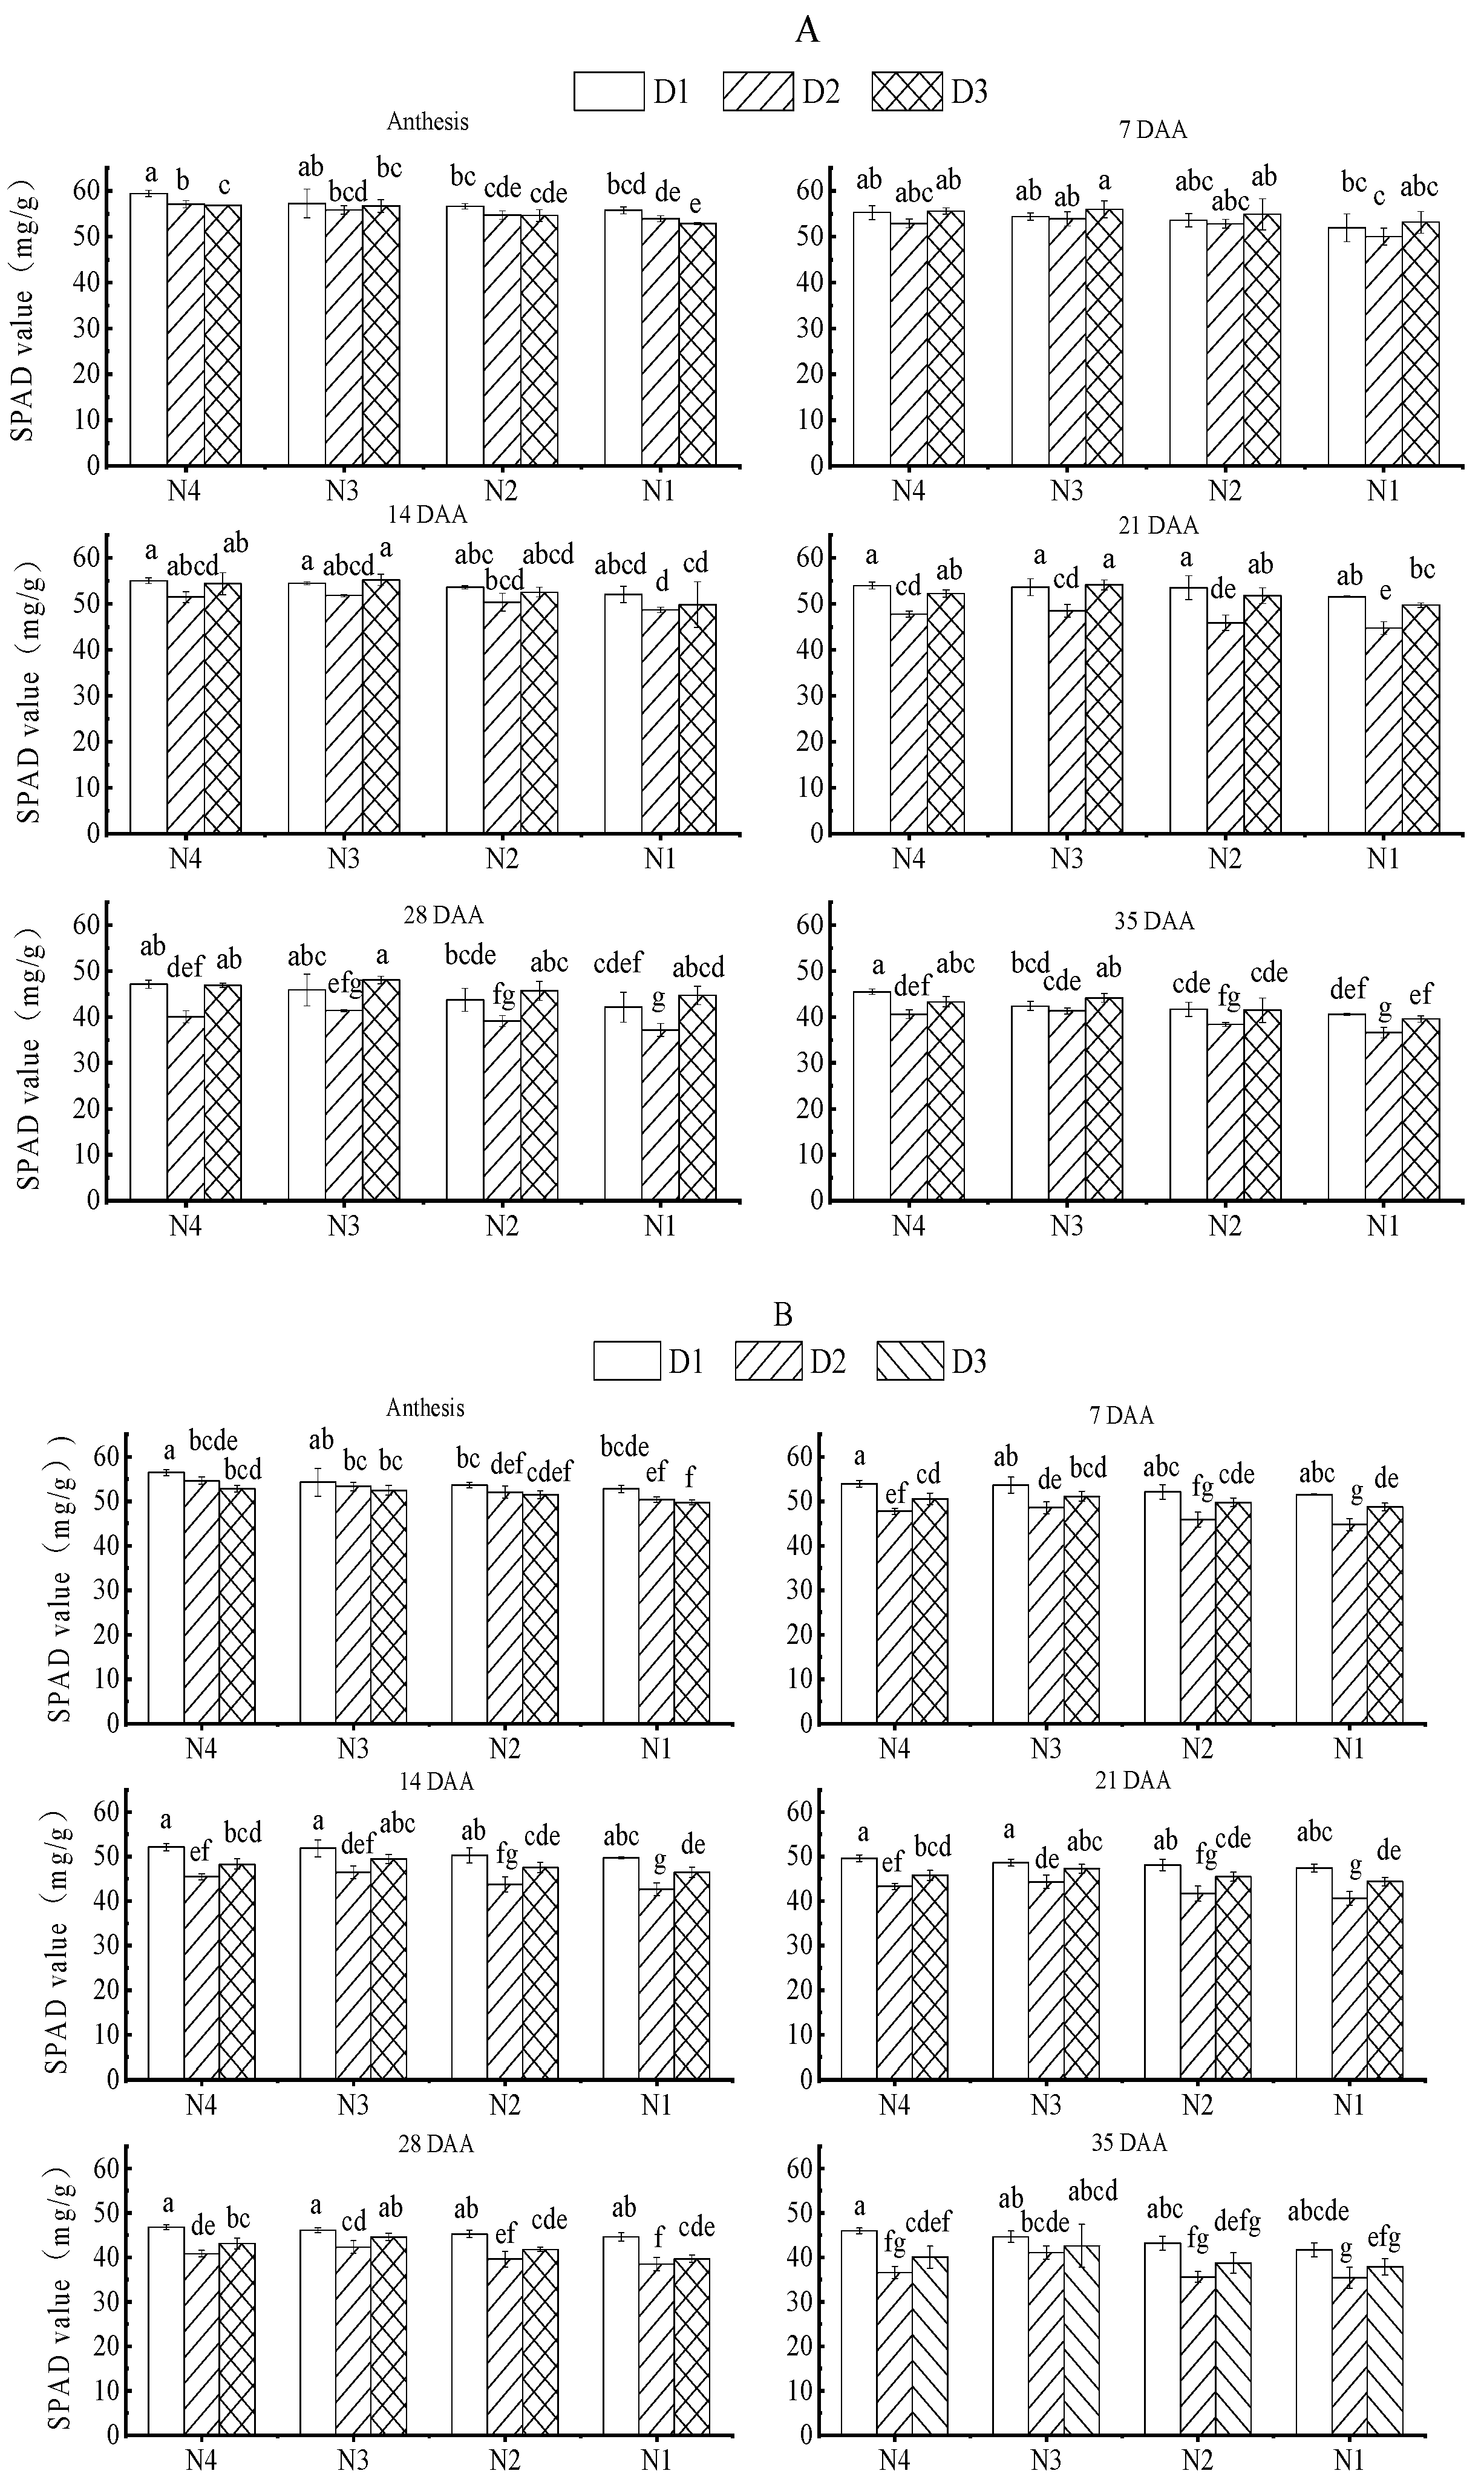
3.3. Effect of Nitrogen Supplementation and Density on Chlorophyll Content (SPAD Value) of Wheat

A parabolic trend of increasing and then decreasing is observed with the advancement of the fertility period; chlorophyll content peaked at the anthesis stage and then gradually decreased (Figure 2). Both density and nitrogen fertilization had significant effects on wheat flag chlorophyll content, with consistent performance between the two years. At the same density, the SPAD value of flag leaf decreased with decreased nitrogen application at D1, and the SPAD value of flag leaf after flowering increased and then decreased with decreased nitrogen application at D2 and D3, indicating that the nitrogen reduction at D1 was unfavourable to the accumulation of chlorophyll content, whereas the reduction in nitrogen application in D2 and D3 was beneficial to the increase in SPAD value. At the same level of nitrogen supplementation, the SPAD value of wheat flag leaf decreased and then increased with increasing density, and the SPAD value of flag leaf significantly increased in D3 compared with that in D1 and D2. These findings indicate that optimal planting density increased post flowering photosynthesis, which in turn increased chlorophyll content. The higher SPAD value of N3D3 treatment indicated that the increase in optimal density was favourable to increased chlorophyll content in the flag leaf when nitrogen application was optimally reduced.

3.4. Effect of Nitrogen Supplementation and Density on Dry Matter Translocation and Accumulation in Wheat

The amount of nitrogen topdressing and density had a significant effect on the amount of dry matter translocation pre-anthesis, translocation rate, grain contribution rate and dry matter accumulation post-anthesis of wheat in 2023 (Figure 3). The interaction of nitrogen topdressing and density had a significant effect on the accumulation of vegetative organs before anthesis, translocation rate, grain contribution rate and dry matter accumulation post-anthesis in 2023. The amount of nitrogen topdressing, density and their interaction had significant effects on the amount of dry matter translocation before anthesis, translocation rate, grain contribution rate, dry matter accumulation post-anthesis and grain contribution rate of wheat in 2024. Under the same density level, the dry matter translocation amount before flowering, translocation rate and grain contribution rate decreased first and then increased with the decrease in the nitrogen topdressing amount. The accumulation post-anthesis showed a trend of increasing first and then decreasing, and the dry matter accumulation post-anthesis and the contribution rate to grain post-anthesis were the highest under the N3 level, and the regularity between the two years was consistent. This indicates that the appropriate nitrogen topdressing amount was beneficial to increase the dry matter accumulation post-anthesis and the contribution rate of grain post-anthesis, thus increasing the grain yield. Under the same nitrogen topdressing level, the dry matter translocation amount pre-anthesis, translocation rate and grain contribution rate increased first and then decreased with the increase in density, and the dry matter accumulation amount post-anthesis and the contribution rate to grain after anthesis were the highest at the D3 level, and the law between the two years was consistent. This indicates that the suitable planting density was beneficial to increase the dry matter accumulation after anthesis and the contribution rate of grain post-anthesis, and then to increase the grain yield. The pre-anthesis contribution rate was 22.37~49.22%, and the post-anthesis contribution rate was 52.50~79.26%. The post-anthesis accumulation and grain contribution rate of N3 D3 were the highest among other treatments, and the performance was consistent between years (Figure 4). The results show that the suitable combination of nitrogen and density could improve the dry matter accumulation and transport efficiency post-anthesis, promote the transfer of dry matter accumulated in vegetative organs to grains and thus increase the yield.

3.5. Effects of Nitrogen Topdressing Amount and Density on Dry Matter Distribution of Wheat at Maturity Stage

Nitrogen supplementation and density had significant effects on the accumulation of leaf dry matter, stem sheath dry matter, rachis + glume dry matter and seed dry matter in different years (Figure 5). There were significant effects of nitrogen and planting density on the dry matter accumulation in the leaf, stem sheath, rachis + husk and grain in different years. The dry matter accumulation and distribution ratio in all organs at maturity in both years was of the order kernel > stem sheath > rachis + glume > leaf. At the same density, the dry matter accumulation in the leaves and kernels showed an overall increase followed by a decrease with nitrogen reduction. Both had the largest dry matter accumulation of kernels at the N3 level, and the pattern was consistent across years. At the same level of N application, the dry matter allocation of leaves, stem sheaths and grains increased overall with increasing density, and all showed the greatest accumulation of dry matter in grains at the D3 level, with a consistent pattern across years. Among them, the amount of dry matter allocated to kernels was larger under N3D3 treatment, and the pattern showed consistency between years. This indicates that the optimal nitrogen density combination is conducive to reducing the premature senescence of nutrient organs, increasing the proportion of grain dry matter accumulation, thus increasing grain yield in wheat.

3.6. Effects of Nitrogen Topdressing Amount and Density on Wheat Yield and Yield Components

The nitrogen topdressing amount and planting density significantly affected the number of spikes and yield, and their mutual effects were only significant in yield (Table 4). At the same density, the number of wheat spikes decreased significantly with decreasing N, whereas the number of grains and thousand grain weight first increased and then decreased. At D1, the yield decreased with decreasing N. In the D2 and D3 treatment groups, the yield increased and then decreased, and both were highest with N3 treatment. At the same level of nitrogen application, the number of spikes, thousand grain weight and yield increased significantly with increasing density, and the highest yield was obtained at the D3 level. Thus, optimal nitrogen application and planting density improved seed yield by harmonizing the number of wheat spikes, number of spikes and thousand grain weight, with the highest yield at N3D3.

3.7. Effects of Nitrogen Supplementation and Planting Density on Nitrogen Accumulation in the Nutrient Organs and Grains at the Flowering and Maturity Stages of Wheat

Nitrogen topdressing amount, planting density and their interaction had extremely significant effects on nitrogen accumulation in vegetative organs and grains in different years, at the wheat flowering stage and mature stage (Table 5). At the same density and decreased nitrogen application rate, nitrogen accumulation decreased in wheat plants and grains at the flowering and maturity stages, and the differences between N1 and N4 were significant. At the same nitrogen topdressing level and increased planting density, nitrogen accumulation significantly increased in plants at the flowering stage and vegetative organs and grains at the maturity stage, and the differences between D1 and D3 were significant. The nitrogen accumulation of N4D3 wheat at the flowering stage and maturity stage was significantly higher than that of other treatments. This shows that increasing the nitrogen application rate and planting density can promote nitrogen accumulation in wheat under the conditions of this experiment.

3.8. Effects of Nitrogen Topdressing and Planting Density on the Efficiency of Nitrogen Fertilizer Utilization

Nitrogen topdressing amount, planting density and their interaction had significant effects on the nitrogen harvest index, nitrogen harvest index, nitrogen production efficiency and nitrogen use efficiency of wheat in different years (Table 6). At the same density, the nitrogen fertilizer production efficiency and nitrogen fertilizer utilization rate decreased, with the amount of nitrogen topdressing decreasing significantly at D1, increasing first, then decreasing at D2 and D3, and peaking with N3. At the same nitrogen topdressing level, with increasing density, nitrogen fertilizer production efficiency and nitrogen fertilizer utilization efficiency increased significantly. Thus, nitrogen fertilizer utilization efficiency and nitrogen fertilizer production efficiency were high when the nitrogen topdressing amount was 48.0 kg N ha−1 and planting density was 300 × 104 plants ha−1.

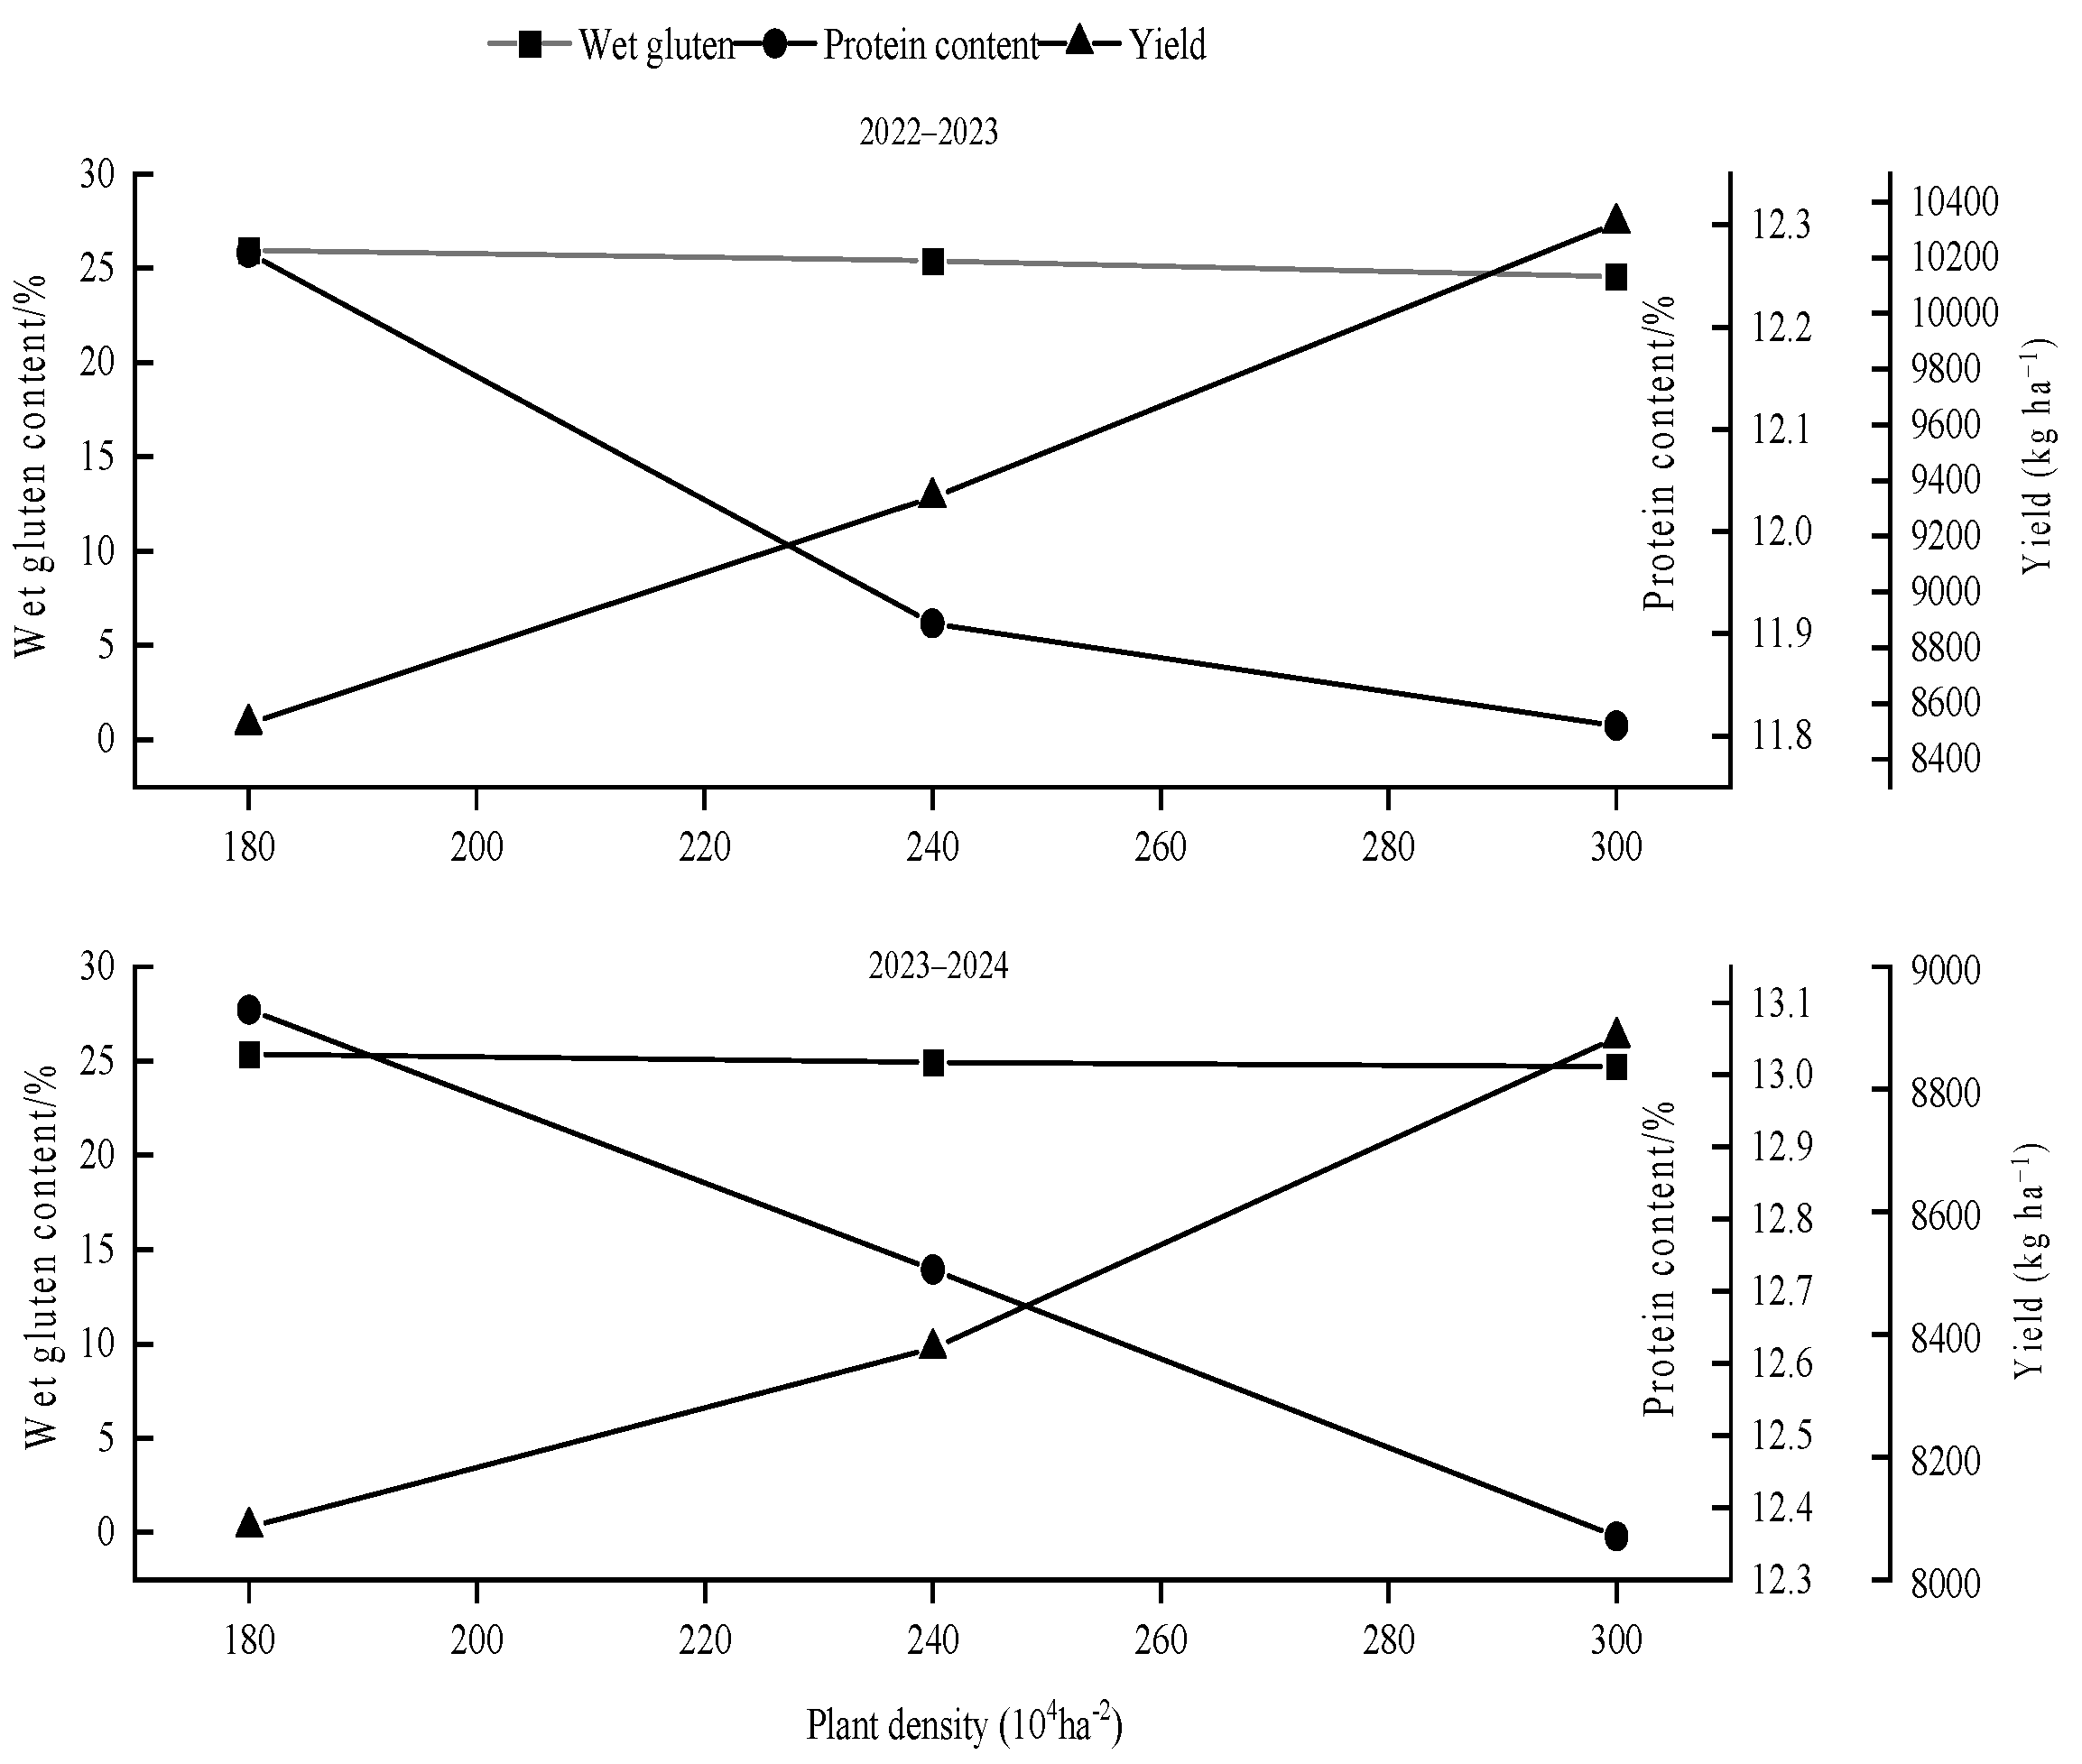
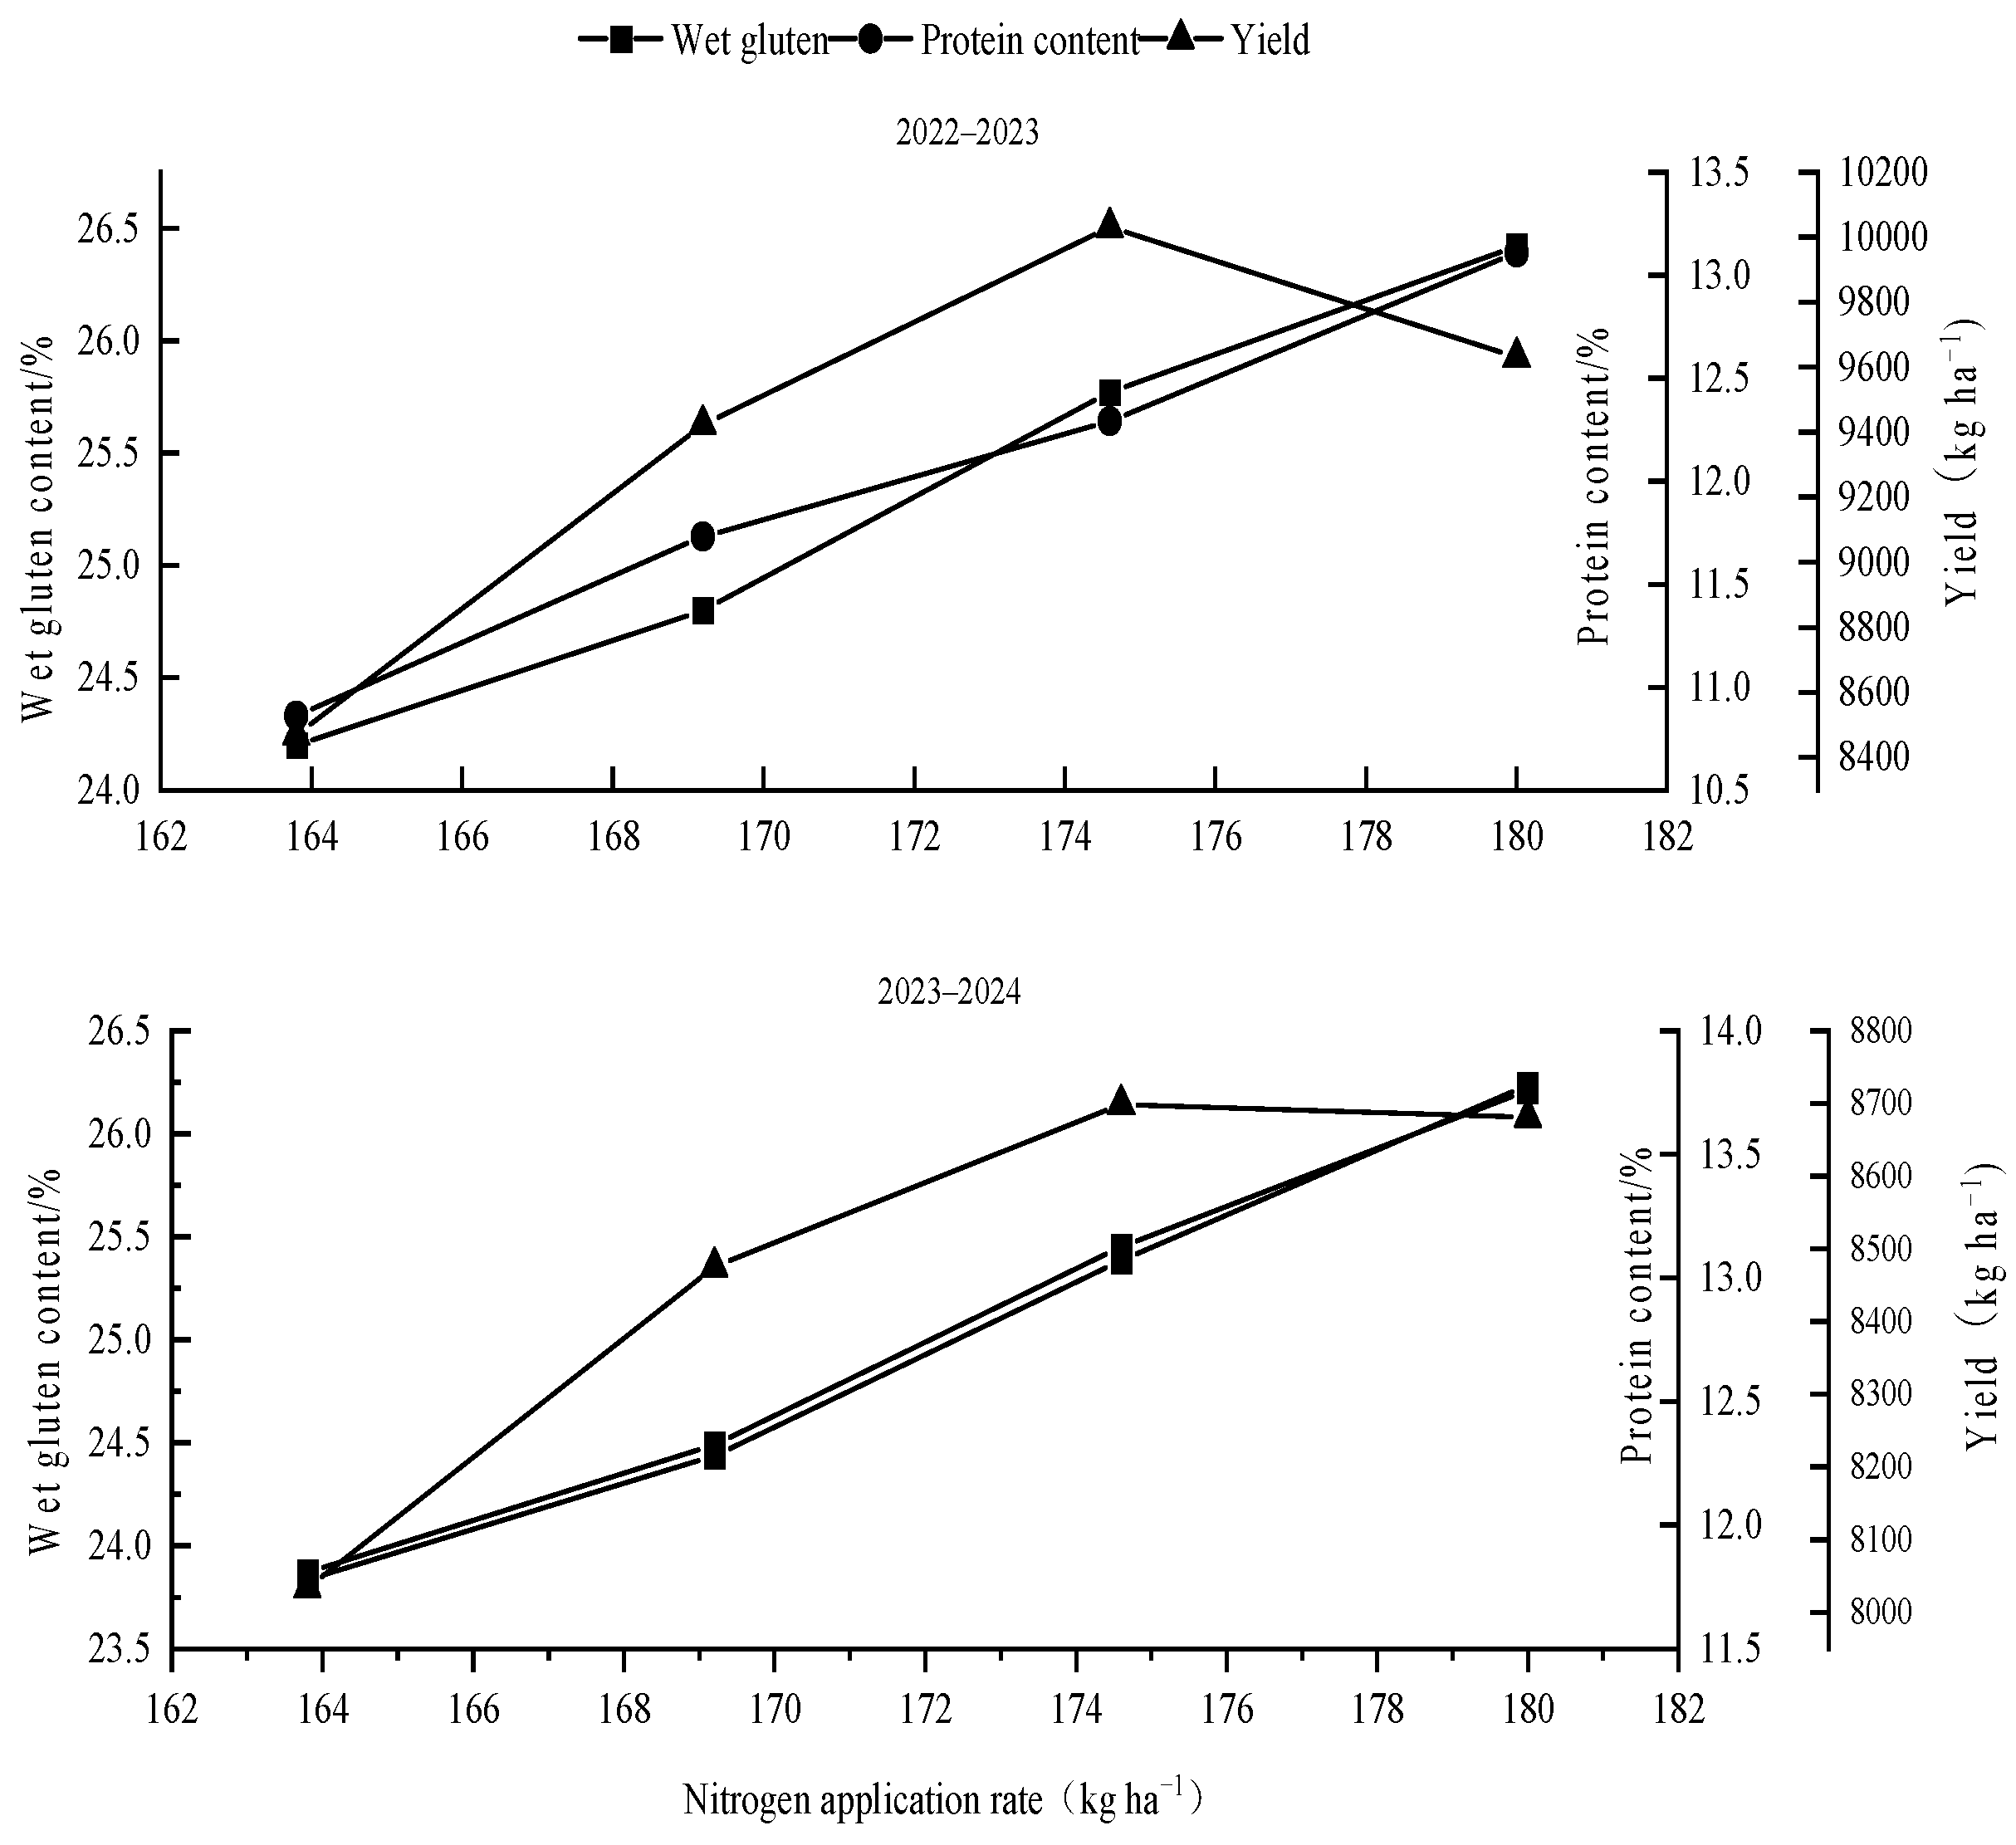
3.9. Effect of Nitrogen Supplementation and Density on Protein, Wet Gluten and Sedimentation Value of Wheat Kernels

The amount of nitrogen topdressing and planting density had significant effects on the wet gluten and protein content of wheat in different years. Under the same density level, the wet gluten and protein of wheat grain decreased significantly with the decrease in the nitrogen topdressing amount (Table 7), which was as follows: N4 > N3 > N2 > N1. And the law was consistent between years (Figure 6). Compared with N4, N3 and N1, the content of wet gluten and protein in wheat decreased significantly, and the regularity between years was consistent. Under the same nitrogen topdressing level, the wet gluten and protein content of wheat grains decreased with the increase in density, and the regularity between years was consistent, which was shown as D1 > D2 > D3. Compared with D1 and D2, the wet gluten and protein content of wheat decreased significantly, and the regularity between years was consistent. Decreasing nitrogen topdressing and increasing planting density significantly reduced the sedimentation value and protein content (Figure 6).

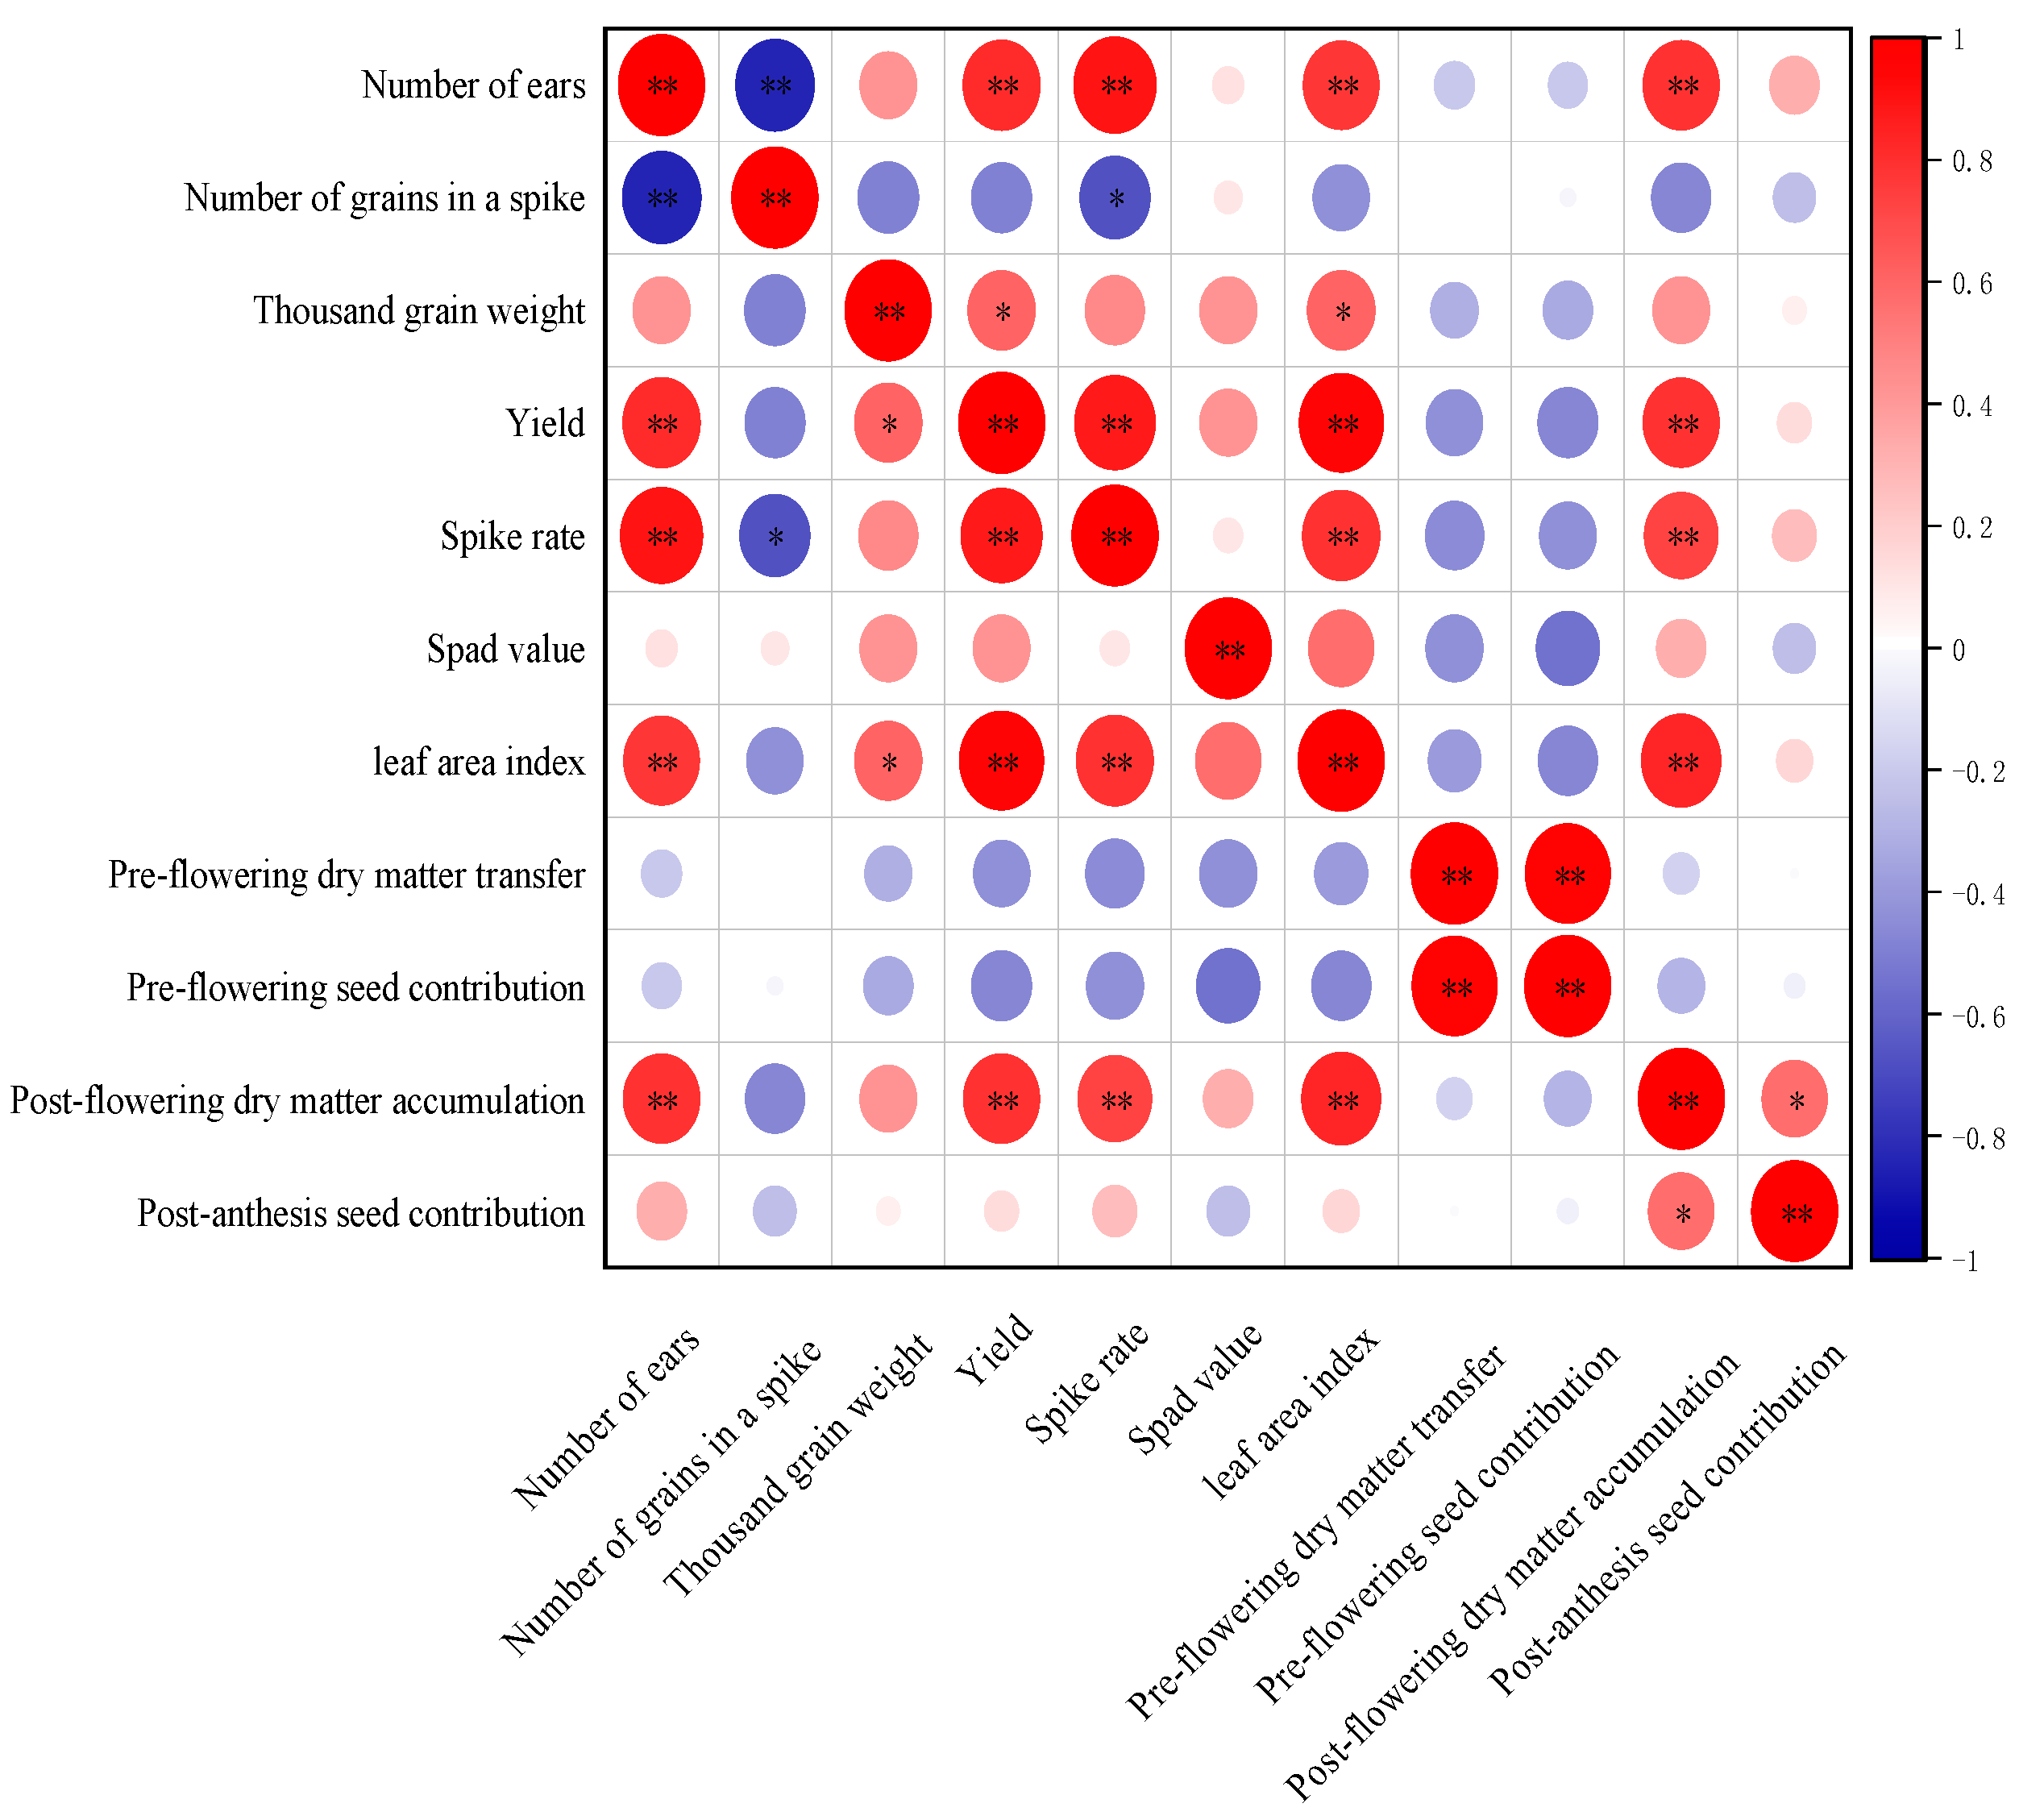
3.10. Correlation Analysis

The yield was significantly positively correlated with the panicle number, panicle rate, LAI and dry matter accumulation after anthesis, and significantly positively correlated with the panicle rate (Figure 7). There was a significant positive correlation between the spike number and spike rate. These findings indicate that the population structure of wheat can be improved by adjusting the number of spikes, thereby promoting the formation of spikes, and coordinating the competition among populations to increase the LAI and dry matter accumulation after anthesis, thereby increasing grain yield.

4. Discussion

The quality of wheat population is an index of the essential characteristics of the wheat population, and optimal nitrogen application can regulate the structural characteristics of wheat population, promote the synergistic improvement of yield and three elements, and then increase the seed yield [23]. Weak-gluten wheat promoted wheat tillering and increased the earing rate under suitable nitrogen density combinations [24]. This study shows that nitrogen reduction significantly reduced the number of tillers of wheat, while density significantly increased the number of tillers of wheat, and the two-year earing rate was the highest under the treatment of planting density of 300 × 104 plants ha−1 and nitrogen topdressing of 48.6 kg N ha−1. This shows that the combination of an appropriate nitrogen topdressing amount and planting density is beneficial to maintain a good population number, which is very important for wheat earing. Photosynthesis is the main source of wheat grain yield, accounting for 90–95%. The effect of photosynthesis is closely related to the photosynthetic area of the plant, photosynthetic rate and photosynthetic time [25]. At the same nitrogen application level, an optimal increase in planting density improved the transpiration rate and chlorophyll content [26]. Applying nitrogen fertilizer at the jointing stage increased the chlorophyll content of wheat, functional period of leaves, accumulation of photosynthate and grain yield [27]. The LAI level affected the yield of wheat, which is an important index for crop yield [28]. The results of this study show that from anthesis to 35 days after heading, nitrogen reduction significantly reduced the SPAD value and LAI of wheat flag leaves, and the density significantly increased the SPAD value and LAI of wheat flag leaves. In addition, it was found that increasing planting density had a more significant effect on the SPAD value and LAI than reducing topdressing nitrogen, and the interaction effect between the two was significant. It can be seen that although nitrogen reduction will lead to a decrease in the SPAD value and LAI of wheat, increasing the density will make up for the decrease in the SPAD value and LAI caused by nitrogen reduction. Therefore, this explains why weak-gluten wheat can maintain stable yield, because the interaction between nitrogen fertilizer and planting density can comprehensively regulate population structure and photosynthetic capacity. In the early stage of wheat growth, the combination of appropriate nitrogen fertilizer and reasonable density can promote the early growth and rapid development of wheat tillers, increase the number of tillers, promote the healthy growth of tillers, optimize the population structure, lay a good population foundation, and then improve the photosynthetic efficiency of wheat population, and lay a solid foundation for the stable yield of weak-gluten wheat.
The flowering stage is the key period of dry matter accumulation and translocation in vegetative organs [29]. A reasonable application of nitrogen fertilizer increased dry matter accumulation in various vegetative organs of wheat and improved its grain translocation rate [30]. Dry matter accumulation and translocation had a greater impact on wheat yield, with post-anthesis dry matter contributing more to grain yield [31]. The pre-anthesis contribution was smaller than the post-anthesis contribution in this study, which is in agreement with previous findings [31]. This study shows that when the planting density was 300 × 104 plants ha−1 and the nitrogen topdressing amount was 48.6 kg N ha−1, the grain accumulation and dry matter distribution post-anthesis were larger. The interaction of appropriate nitrogen topdressing and planting density significantly increased the dry matter accumulation post-anthesis and its contribution rate to grain and reduced the contribution rate of pre-anthesis assimilate transport to grain. The reason for the large accumulation of grain post-anthesis is that the reasonable amount of nitrogen topdressing provides raw materials for leaf photosynthesis and ensures the continuous synthesis of photosynthetic products post-anthesis. Suitable planting density optimizes population structure and improves photosynthetic efficiency. At the same time, the interaction between the two can synergistically enhance the pulling force of the grain bank, promote the transfer of stored substances from vegetative organs to grains, and finally promote the significant increase in dry matter accumulation post-anthesis of wheat, laying a foundation for high yield. That is, the less accumulation of leaves is due to the fact that nutrients in leaves are transported to other organs, especially grains.
Nitrogen accumulation in wheat kernels increased significantly with increasing nitrogen application from 0 to 180 kg N ha−1 [32]. Within a certain range, increasing planting density decreased nitrogen accumulation in wheat plants [33]. In this study, nitrogen accumulation at the flowering stage, plants at the maturity stage and mature seeds decreased with decreasing nitrogen application. This could be attributed to the decrease in nitrogen accumulation due to the reduction in nitrogen application, which reduced the transportation of the nitrogen accumulated before flowering to the seeds. The nitrogen content of plants at the flowering stage and in the nutrient organs and seeds at the maturity stage increased significantly with increasing density, and optimal density promoted the translocation of chased nitrogen fertilizer from the nutrient organs to the seeds; therefore, nitrogen accumulation was maintained at a high level. Improving the nitrogen fertilizer utilization efficiency of wheat is one of the main ways to achieve high yield. Cultivation measures are closely related to nutrient uptake and nitrogen fertilizer utilization efficiency [34]. The application of an optimal amount of nitrogen is beneficial to the simultaneous improvement of yield and nitrogen fertilizer utilization efficiency. Increasing planting density improved root length density in soil and promoted nitrogen absorption and thus improved the nitrogen utilization rate in wheat [35]. This study shows that reducing the amount of nitrogen topdressing significantly reduced the nitrogen production efficiency, nitrogen use efficiency and nitrogen accumulation, and increasing the density significantly increased the nitrogen production efficiency, nitrogen use efficiency and nitrogen accumulation. In addition, this study found that nitrogen application rate and planting density had a significant interaction effect on the NAE, and the effect of density on the NAE was greater than that of nitrogen topdressing. The amount of fertilizer nitrogen and nitrogen accumulation absorbed by 180 × 104 plants ha−1 density was significantly lower than that of 300 × 104 plants ha−1 density, which indicates that 300 × 104 plants ha−1 planting density could better regulate population relationship, promote plants to better absorb and utilize nitrogen and maintain wheat yield. When the planting density was 300 × 104 plants ha−1 and the nitrogen topdressing rate was 48.6 kg N ha−1, the nitrogen fertilizer productivity and nitrogen use efficiency of wheat were the highest. This shows that the increase in planting density can improve the nitrogen absorption capacity to a certain extent offset the decrease in nitrogen accumulation in wheat caused by the decrease in the nitrogen application rate, and can increase the grain production capacity of wheat. It can be seen that the combination of suitable nitrogen topdressing amount and planting density is a favourable cultivation measure for weak-gluten wheat to obtain higher NAE.
Nitrogen application increased the spike number, grain number per spike and thousand grain weight in wheat [36]. Increasing planting density significantly increased the spike number and yield but decreased the grain number in wheat [37]. This study shows that under the density of 180 × 104 plants ha−1, the grain yield and spike number of wheat decreased significantly after reducing the amount of nitrogen topdressing. When the nitrogen topdressing amount decreased from 54 kg·hm−2 to 48.6 kg N ha−1 under the planting density of 270~300 × 104 plants ha−1, the grain yield increased. Thia may be because the three elements of yield composition are more coordinated, and the light in the later stage of wheat growth is sufficient to promote photosynthesis, thereby increasing grain yield. When the amount of topdressing nitrogen decreased to 37.8 kg N ha−1, grain yield decreased significantly, probably because reducing topdressing nitrogen fertilizer affected plant tillering and reduced the panicle number. The grain yield under the treatment of planting density of 300 × 104 plants ha−1 and nitrogen topdressing of 48.6 kg N ha−1 was significantly higher than that under the treatment of planting density of 180 × 104 plants ha−1 and nitrogen topdressing of 48.6 kg N ha−1. The reason is that appropriately reducing the amount of nitrogen topdressing can increase the effective tiller number of plants by increasing the planting density, increasing the spike rate, and then increasing the grain yield. The yield correlation analysis verified why weak-gluten wheat could maintain stable yield (Figure 7). That is, the interaction of nitrogen and density regulates the number of spikes to optimize the population structure to promote wheat spike formation, coordinate group competition, increase leaf area index and dry matter accumulation after anthesis, provide sufficient material for grain filling and effectively promote grain yield. It is the key agronomic measure to ensure high wheat yield. In the production of weak-gluten wheat, reducing nitrogen application and increasing planting density reduced wheat grain quality [38]. In this study, according to the national weak-gluten wheat standard content, protein content < 12.5% and wet gluten content < 26% are the standards of high-quality weak-gluten wheat. Under the level of 300 × 104 plants ha−1, the amount of nitrogen topdressing was not more than 48.6 kg N ha−1, and all indexes reached the standard of weak-gluten wheat content. When the planting density was 300 × 104 plants ha−1 and the nitrogen topdressing amount was 48.6 kg N ha−1, the standard content of weak gluten wheat was reached. Therefore, the combination of reducing nitrogen and increasing density is an important cultivation way to improve the processing quality of weak-gluten wheat.

5. Conclusions

Reducing the amount of nitrogen topdressing improved the grain quality of weak-gluten wheat but reduced the number of populations, dry matter accumulation and nitrogen accumulation, resulting in a significant loss of grain yield. Increasing density significantly increased dry matter accumulation, nitrogen accumulation, yield and nitrogen fertilizer production efficiency under the condition of reducing nitrogen topdressing by increasing the number of effective panicles, thereby improving grain quality. In addition, reducing nitrogen topdressing and increasing planting density can reduce protein content and wet gluten content, and reducing nitrogen topdressing has a more significant effect on protein content than increasing planting density. Under the planting density of 300 × 104 plants hm−2, the amount of topdressing nitrogen was 48.6 kg N ha−1 (the amount of basal nitrogen fertilizer was 126 kg N ha−1), which could obtain qualified grain quality of weak-gluten wheat and maintain the best yield in this area. Therefore, under the condition of reducing nitrogen fertilizer input, it is feasible to maintain a high quality and stable yield of weak-gluten wheat and efficient utilization of nitrogen fertilizer by increasing planting density.

Author Contributions

Conceptualization, W.Z., W.L., S.Y. and C.Z.; investigation, H.L., S.Z., Y.Y., Y.L. and L.X.; resources, W.L. and S.Y.; writing—original draft, W.Z. and S.Y.; writing—reviewing and editing, S.Y., A.R. and C.Z.; supervision, W.L., S.Y. and C.Z.; funding acquisition, W.L. and C.Z. All authors have read and agreed to the published version of the manuscript.

Funding

This research was supported by the National Key Research and Development Program of China (2022YFD2300801-02), the Science and Technology Planning Project of Fengyang County (2024NY-02), the Special Fund for Anhui Agriculture Research System (Wheat), the Project of Sci-tech Special Commissioner in Anhui Province (2023tpt035), the Collaborative Innovation Project of Anhui Provincial Universities (GXXT-2021-089) and the Construction Funds for Crop Science of Anhui Science and Technology University (XK-XJGF001).

Institutional Review Board Statement

Not applicable.

Data Availability Statement

The data supporting the results of this study are included in the manuscript.

Acknowledgments

We are grateful to the reviewers for helping us to improve the original manuscript.

Conflicts of Interest

The authors declare no conflicts of interest.

References

  1. Lu, Y.; Jenkins, A.; Ferrier, R.C.; Bailey, M.; Gordon, I.J.; Song, S.; Huang, J.; Jia, S.; Zhang, F.; Liu, X. Addressing China’s grand challenge of achieving food security while ensuring environmental sustainability. Sci. Adv. 2015, 1, e1400039. [Google Scholar] [CrossRef] [PubMed]
  2. Ashraf, M. Stress-induced changes in wheat grain composition and quality. Crit. Rev. Food Sci. Nutr. 2014, 54, 1576–1583. [Google Scholar] [CrossRef] [PubMed]
  3. De Santis, M.A.; Giuliani, M.M.; Flagella, Z.; Reyneri, A.; Blandino, M. Impact of nitrogen fertilisation strategies on the protein content, gluten composition and rheological properties of wheat for biscuit production. Field Crops Res. 2020, 254, 107829. [Google Scholar] [CrossRef]
  4. Ghafoor, I.; Habib-ur-Rahman, M.; Ali, M.; Afzal, M.; Ahmed, W.; Gaiser, T.; Ghaffar, A. Slow-release nitrogen fertilizers enhance growth, yield, NUE in wheat crop and reduce nitrogen losses under an arid environment. Environ. Sci. Pollut. Res. 2021, 28, 43528–43543. [Google Scholar] [CrossRef]
  5. Si, Z.; Qin, A.; Liang, Y.; Duan, A.; Gao, Y. A review on regulation of irrigation management on wheat physiology, grain yield, and quality. Plants 2023, 12, 692. [Google Scholar] [CrossRef]
  6. Wan, C.; Dang, P.; Gao, L.; Wang, J.; Tao, J.; Qin, X.; Feng, B.; Gao, J. How does the environment affect wheat yield and protein content response to drought? A meta-analysis. Front. Plant Sci. 2022, 13, 896985. [Google Scholar] [CrossRef]
  7. Wang, J.; Hussain, S.; Sun, X.; Zhang, P.; Javed, T.; Dessoky, E.S.; Ren, X.; Chen, X. Effects of nitrogen application rate under straw incorporation on photosynthesis, productivity and nitrogen use efficiency in winter wheat. Front. Plant Sci. 2022, 13, 862088. [Google Scholar] [CrossRef]
  8. Wardlaw, I.; Sofield, I.; Cartwright, P. Factors limiting the rate of dry matter accumulation in the grain of wheat grown at high temperature. Funct. Plant Biol. 1980, 7, 387–400. [Google Scholar] [CrossRef]
  9. Gültekin Subaşı, B.; Vahapoğlu, B.; Capanoglu, E.; Mohammadifar, M. A review on protein extracts from sunflower cake: Techno-functional properties and promising modification methods. J. Cereal Sci. 2022, 62, 6682–6697. [Google Scholar] [CrossRef]
  10. Huang, X.; Wang, C.; Hou, J.; Du, C.; Liu, S.; Kang, J.; Lu, H.; Xie, Y.; Guo, T.; Ma, D. Coordination of carbon and nitrogen accumulation and translocation of winter wheat plant to improve grain yield and processing quality. Sci. Rep. 2020, 10, 10340. [Google Scholar] [CrossRef]
  11. Kant, S.; Bi, Y.M.; Rothstein, S.J. Understanding plant response to nitrogen limitation for the improvement of crop nitrogen use efficiency. J. Exp. Bot. 2011, 62, 1499–1509. [Google Scholar] [CrossRef] [PubMed]
  12. Koua, A.P.; Siddiqui, M.N.; Heß, K.; Klag, N.; Kambona, C.M.; Duarte-Delgado, D.; Oyiga, B.C.; Léon, J.; Ballvora, A. Genome-wide dissection and haplotype analysis identified candidate loci for nitrogen use efficiency under drought conditions in winter wheat. Plant Genome 2024, 17, e20394. [Google Scholar] [CrossRef] [PubMed]
  13. Li, X.X.; Shi, Z.L.; Wang, J.-C.; Wang, F.; Jiang, R.F. Economical nitrogen application rate of winter wheat under rice-wheat rotation in the Yangtze River basin of China. J. Appl. Ecol. 2020, 31, 3015–3022. [Google Scholar]
  14. Li, Y.; Cui, Z.; Ni, Y.; Zheng, M.; Yang, D.; Jin, M.; Chen, J.; Wang, Z.; Yin, Y. Plant density effect on grain number and weight of two winter wheat cultivars at different spikelet and grain positions. PLoS ONE 2016, 11, e0155351. [Google Scholar] [CrossRef]
  15. Liu, Q.; Wu, K.; Song, W.; Zhong, N.; Wu, Y.; Fu, X. Improving crop nitrogen use efficiency toward sustainable green revolution. Annu. Rev. Plant Biol. 2022, 73, 523–551. [Google Scholar] [CrossRef]
  16. Conant, R.T.; Berdanier, A.B.; Grace, P.R. Patterns and trends in nitrogen use and nitrogen recovery efficiency in world agriculture. Glob. Biogeochem. Cycles 2013, 27, 558–566. [Google Scholar] [CrossRef]
  17. Hawkesford, M.J. Reducing the reliance on nitrogen fertilizer for wheat production. J. Cereal Sci. 2014, 59, 276–283. [Google Scholar] [CrossRef]
  18. Zhang, Z.; Yu, Z.; Zhang, Y.; Shi, Y. Optimized nitrogen fertilizer application strategies under supplementary irrigation improved winter wheat (Triticum aestivum L.) yield and grain protein yield. PeerJ 2021, 9, e11467. [Google Scholar] [CrossRef]
  19. Arduini, I.; Masoni, A.; Ercoli, L.; Mariotti, M. Grain yield, and dry matter and nitrogen accumulation and remobilization in durum wheat as affected by variety and seeding rate. Eur. J. Agron. 2006, 25, 309–318. [Google Scholar] [CrossRef]
  20. Rogers, C.W.; Dari, B.; Schroeder, K.L. Comparison of Soil-Test Extractants for Potassium, Calcium, Magnesium, Sulfur, and Micronutrients in Idaho Soils. Agrosystems Geosci. Environ. 2019, 2, 1–9. [Google Scholar] [CrossRef]
  21. Wang, H.; Guo, Z.; Shi, Y.; Zhang, Y.; Yu, Z. Impact of tillage practices on nitrogen accumulation and translocation in wheat and soil nitrate-nitrogen leaching in drylands. Soil Till. Res. 2015, 153, 20–27. [Google Scholar] [CrossRef]
  22. Hu, C.; Tian, Z.; Gu, S.; Guo, H.; Fan, Y.; Abid, M.; Chen, K.; Jiang, D.; Cao, W.; Dai, T. Winter and spring night-warming improve root extension and soil nitrogen supply to increase nitrogen uptake and utilization of winter wheat (Triticum aestivum L.). Eur. J. Agron. 2018, 96, 96–107. [Google Scholar] [CrossRef]
  23. Kaur, R.; Kaur, H.; Srivastava, P. Role of tryptophan content in determining gluten quality and wheat grain characteristics. Heliyon 2022, 8, e10715. [Google Scholar] [CrossRef]
  24. Noor, H.; Noor, F.; Liang, L.T.; Ding, P.; Sun, M.; Gao, Z. Nitrogen fertilization and precipitation affected Wheat (Triticum aestivum L.) in dryland the Loess Plateau of South Shanxi, China. Heliyon 2023, 9, e18177. [Google Scholar] [CrossRef]
  25. Kubar, M.S.; Alshallash, K.S.; Asghar, M.A.; Feng, M.; Raza, A.; Wang, C.; Saleem, K.; Ullah, A.; Yang, W.; Kubar, K. Improving winter wheat photosynthesis, nitrogen use efficiency, and yield by optimizing nitrogen fertilization. Life 2022, 12, 1478. [Google Scholar] [CrossRef]
  26. Kubar, M.S.; Zhang, Q.; Feng, M.; Wang, C.; Yang, W.; Kubar, K.A.; Riaz, S.; Gul, H.; Samoon, H.A.; Sun, H. Growth, yield and photosynthetic performance of winter wheat as affected by co-application of nitrogen fertilizer and organic manures. Life 2022, 12, 1000. [Google Scholar] [CrossRef]
  27. Ma, C.; Liu, M.; Ding, F.; Li, C.; Cui, Y.; Chen, W.; Wang, Y. Wheat growth monitoring and yield estimation based on remote sensing data assimilation into the SAFY crop growth model. Sci. Rep. 2022, 12, 5473. [Google Scholar] [CrossRef]
  28. Ghafoor, I.; Rahman, M.H.U.; Hasnain, M.U.; Ikram, R.M.; Khan, M.A.; Iqbal, R.; Hussain, M.I.; Sabagh, A.E. Effect of slow-release nitrogenous fertilizers on dry matter accumulation, grain nutritional quality, water productivity and wheat yield under an arid environment. Sci. Rep. 2022, 12, 14783. [Google Scholar] [CrossRef]
  29. Chen, W.; Deng, X.-P.; Eneji, A.E.; Wang, L.L.; Xu, Y.; Cheng, Y. Dry-matter partitioning across parts of the wheat internode during the grain filling period as influenced by fertilizer and tillage treatments. Commun. Soil Sci. Plant Anal. 2014, 45, 1799–1812. [Google Scholar] [CrossRef]
  30. Li, J.; Wang, Z.; Song, Y.; Li, J.; Zhang, Y. Effects of reducing nitrogen application rate under different irrigation methods on grain yield, water and nitrogen utilization in winter wheat. Agronomy 2022, 12, 1835. [Google Scholar] [CrossRef]
  31. Zheng, B.; Zhang, X.; Wang, Q.; Li, W.; Huang, M.; Zhou, Q.; Cai, J.; Wang, X.; Cao, W.; Dai, T. Increasing plant density improves grain yield, protein quality and nitrogen agronomic efficiency of soft wheat cultivars with reduced nitrogen rate. Field Crops Res. 2021, 267, 108145. [Google Scholar] [CrossRef]
  32. Yang, D.; Cai, T.; Luo, Y.; Wang, Z. Optimizing plant density and nitrogen application to manipulate tiller growth and increase grain yield and nitrogen-use efficiency in winter wheat. PeerJ 2019, 7, e6484. [Google Scholar] [CrossRef] [PubMed]
  33. Li, J.; Xu, X.; Lin, G.; Wang, Y.; Liu, Y.; Zhang, M.; Zhou, J.; Wang, Z.; Zhang, Y. Micro-irrigation improves grain yield and resource use efficiency by co-locating the roots and N-fertilizer distribution of winter wheat in the North China Plain. Sci. Total Environ. 2018, 643, 367–377. [Google Scholar] [CrossRef] [PubMed]
  34. Ding, Y.G.; Zhang, X.B.; Quan, M.; Li, F.J.; Tao, R.-R.; Min, Z.; Li, C.Y.; Zhu, X.K.; Guo, W.S.; Ding, J.F. Tiller fertility is critical for improving grain yield, photosynthesis, and nitrogen efficiency in wheat. J. Integr. Agric. 2023, 22, 2054–2066. [Google Scholar] [CrossRef]
  35. Fuertes-Mendizábal, T.; Estavillo, J.M.; Duñabeitia, M.K.; Huérfano, X.; Castellón, A.; González-Murua, C.; Aizpurua, A.; González-Moro, M.B. 15N natural abundance evidences a better use of N sources by late nitrogen application in bread wheat. Front. Plant Sci. 2018, 9, 853. [Google Scholar] [CrossRef]
  36. Demotes-Mainard, S.; Jeuffroy, M.H. Effects of nitrogen and radiation on dry matter and nitrogen accumulation in the spike of winter wheat. Field Crops Res. 2004, 87, 221–233. [Google Scholar] [CrossRef]
  37. Ullah, I.; Ali, N.; Durrani, S.; Shabaz, M.A.; Hafeez, A.; Ameer, H.; Ishfaq, M.; Fayyaz, M.R.; Rehman, A.; Waheed, A. Effect of different nitrogen levels on growth, yield and yield contributing attributes of wheat. Int. J. Sci. Eng. Res. 2018, 9, 595–602. [Google Scholar]
  38. Wu, H.; Wang, Z.; Zhang, X.; Wang, J.; Hu, W.; Wang, H.; Gao, D.; Souza, E.; Cheng, S. Effects of different fertilizer treatments, environment and varieties on the yield, grain, flour, and dough-related traits and cookie quality of weak-gluten wheat. Plants 2022, 11, 3370. [Google Scholar] [CrossRef]
Figure 1. Meteorology during the whole growth period of wheat in two growing seasons from 2022 to 2024.
Agriculture 15 00013 g001
Figure 2. Relative chlorophyll content of wheat at different densities and levels of nitrogen supplementation. Note: N1, N2, N3 and N4 indicate the N rate of 37.8, 43.2, 48.6 and 54 kg N ha−1, respectively. D1, D2 and D3 indicate the plant density of 180, 240 and 300 × 104 plants ha−1, respectively. The relative chlorophyll content of each treatment in 2022~2023 (A); the relative content of leaf green in each treatment in 2023~2024 (B). Different lowercase letters in the figure indicate that the LSD test was significantly different at the 0.05 probability level. DAA, days after anthesis.
Agriculture 15 00013 g002
Figure 3. Organ accumulation in wheat at different densities and levels of nitrogen supplementation. Note: N1, N2, N3 and N4 were 37.8, 43.2, 48.6 and 54 kg N ha−1, respectively. D1, D2 and D3 represent the plant density of 180, 240 and 300 × 104 plants ha−1, respectively. Different lowercase letters in the figure indicate that the LSD test was significantly different at the 0.05 probability level.
Agriculture 15 00013 g003
Figure 4. The contribution rate of wheat grain under different densities and nitrogen topdressing levels. Note: N1, N2, N3 and N4 were 37.8, 43.2, 48.6 and 54 kg N ha−1, respectively. D1, D2 and D3 represent the plant density of 180, 240 and 300 × 104 plants ha−1, respectively. Different lowercase letters in the figure indicate that the LSD test was significantly different at the 0.05 probability level.
Agriculture 15 00013 g004
Figure 5. Dry matter distribution of wheat at maturity stage under different density and nitrogen topdressing levels. Note: N1, N2, N3 and N4 were 37.8, 43.2, 48.6 and 54 kg N ha−1, respectively. D1, D2 and D3 represent the plant density of 180, 240 and 300 × 104 plants ha−1, respectively. The number in the figure is the percentage of dry matter accumulation in each organ.
Agriculture 15 00013 g005
Figure 6. Relationship between different density and nitrogen topdressing amounts and wheat yield.
Agriculture 15 00013 g006aAgriculture 15 00013 g006b
Figure 7. Correlation analysis of yield and yield related indexes under different density and nitrogen topdressing levels. Note: *: p < 0.05; **: p < 0.01.
Agriculture 15 00013 g007
Table 1. Nutrient content of soil plough layer in two growing seasons from 2022 to 2024.
YearOrganic Matter
(g·kg−1)
Available Nitrogen
(mg·kg−1)
Available Phosphorus
(mg·kg−1)
Available Potassium
(mg·kg−1)
2022–202316.6572.7517.4596.05
2023–202417.6875.8716.81111.65
Table 2. Tillering dynamics of wheat under different density and nitrogen topdressing levels.
YearDensityNitrogen TopdressingTillers Number (×104 ha−1)Panicle Bearing Tiller Rate
Wintering PeriodJointing StageHeading StageMature Stage
2022–2023D1N4424.00 ± 18.18 bc1600.00 ± 29.93 d612.00 ± 23.55 cd522.67 ± 13.20 f32.66 ± 0.22 def
N3416.00 ± 14.97 c1633.33 ± 41.35 d577.33 ± 13.20 cd518.67 ± 26.40 fg31.74 ± 0.90 ef
N2430.67 ± 14.73 bc1636.00 ± 24.66 d572.00 ± 40.92 d516.00 ± 21.42 fg31.53 ± 0.86 ef
N1425.33 ± 16.76 bc1606.67 ± 54.78 d558.67 ± 12.36 d496.00 ± 40.92 fg30.83 ± 1.71 f
D2N4470.67 ± 9.98 bc1778.67 ± 57.35 b641.33 ± 28.53 bc600.00 ± 14.24 ef33.74 ± 0.43 bcd
N3510.67 ± 27.19 b1665.33 ± 29.45 cd616.00 ± 27.9 cd569.33 ± 16.76 def34.18 ± 0.46 bcd
N2494.67 ± 21.25 bc1664.00 ± 22.86 cd596.00 ± 57.78 cd556.00 ± 17.28 cde33.41 ± 0.63 cde
N1480.00 ± 40.13 bc1670.67 ± 70.07 cd594.67 ± 25.37 cd553.33 ± 14.73 bcd33.17 ± 1.55 cde
D3N4632.00 ± 34.10 a1886.67 ± 29.63 a736.00 ± 36.37 a657.33 ± 23.17 bc34.83 ± 0.70 abc
N3626.67 ± 13.60 a1718.67 ± 16.11 bc682.67 ± 18.86 ab628.00 ± 8.64 ab36.54 ± 0.47 a
N2632.00 ± 34.10 a1720.00 ± 16.33 bc638.67 ± 24.07 bc622.67 ± 26.40 ab36.20 ± 1.44 a
N1652.00 ± 20.40 a1678.67 ± 24.94 cd621.33 ± 38.96 bcd598.67 ± 9.43 a35.66 ± 0.18 ab
D153.55 **22.35 **16.69 **57.65 **39.057 **
F ValueN0.247.97 **6.08 **4.50 *1.00
D × N0.643.68 *0.610.41.01
2023–2024D1N4466.67 ± 12.36 d1612.00 ± 37.09 bcd694.67 ± 32.71 d521.33 ± 9.98 cdef32.35 ± 0.33 def
N3445.33 ± 16.44 d1556.00 ± 20.40 d677.33 ± 34.92 d497.33 ± 14.73 ef31.96 ± 0.68 ef
N2462.67 ± 13.20 d1557.33 ± 23.17 d525.33 ± 36.12 e482.67 ± 21.75 fg30.98 ± 1.12 fg
N1430.67 ± 34.31 d1540.00 ± 47.10 d521.33 ± 21.00 e452.00 ± 20.40 g29.34 ± 0.72 h
D2N4546.67 ± 17.99 bc1652.00 ± 43.20 abc845.33 ± 87.72 bc557.33 ± 19.14 bc33.73 ± 0.46 bcd
N3521.33 ± 18.57 c1588.00 ± 43.20 cd753.33 ± 55.55 cd541.33 ± 16.76 bcd34.09 ± 0.17 abc
N2550.67 ± 11.47 bc1666.67 ± 35.83 ab724.00 ± 36.81 d521.33 ± 27.39 cdef31.26 ± 0.97 efg
N1548.00 ± 25.51 bc1714.67 ± 55.55 a697.33 ± 49.46 d514.67 ± 21.00 def30.01 ± 0.44 gh
D3N4574.67 ± 22.23 ab1728.00 ± 14.97 a964.00 ± 75.33 a602.67 ± 13.20 a34.88 ± 0.65 ab
N3602.67 ± 9.98 a1594.67 ± 24.07 bcd940.00 ± 5.66 ab569.33 ± 19.14 ab35.69 ± 0.72 a
N2613.33 ± 13.20 a1660.00 ± 16.33 abc901.33 ± 75.64 ab545.33 ± 26.4 bcd32.85 ± 1.5 cde
N1596.00 ± 17.28 a1672.00 ± 43.20 ab885.33 ± 48.92 ab536.00 ± 18.18 bcde32.05 ± 0.54 ef
D117.32 **16.67 **76.63 **27.66 **23.94 **
F ValueN1.225.50 **8.92 **9.62 **26.04 **
D × N1.372.050.950.290.75
Note: N1, N2, N3 and N4 indicate the N rate of 37.8, 43.2, 48.6 and 54 kg N ha−1, respectively. D1, D2 and D3 indicate the plant density of 180, 240 and 300 × 104 plants ha−1, respectively. FN and FD represent the main effects of the nitrogen application rate and planting density. FN×D, the interaction between nitrogen the topdressing amount and density. The different lowercase letters in the table indicate that the LSD test was significantly different at the 0.05 probability level. The lowercase letters in the same column value show significant differences between treatments (p < 0.05). *: p < 0.05; **: p < 0.01. All data in the table are expressed as mean ± standard error.
Table 3. Leaf area index of wheat under different density and nitrogen topdressing levels.
YearDensityNitrogen TopdressingJointing StageBooting StageHeading StageAnthesis StageFilling Stage
2022–2023D1N42.91 ± 0.07 ef3.58 ± 0.11 def4.55 ± 0.24 cdef5.34 ± 0.53 bc4.16 ± 0.58 bcd
N32.83 ± 0.53 ef3.33 ± 0.25 ef4.08 ± 0.18 efg4.67 ± 0.26 cde3.73 ± 0.17 de
N22.55 ± 0.32 f3.13 ± 0.27 f3.96 ± 0.34 fg4.47 ± 0.83 cde3.91 ± 0.44 cde
N12.89 ± 0.49 ef3.02 ± 0.22 f3.79 ± 0.16 g3.94 ± 0.13 e3.33 ± 0.13 e
D2N43.96 ± 0.23 bc4.43 ± 0.27 bc4.86 ± 0.24 abcd5.18 ± 0.54 bcd4.38 ± 0.16 bcd
N33.45 ± 0.28 cde4.07 ± 0.37 cd4.79 ± 0.21 bcde4.86 ± 0.30 cde4.40 ± 0.31 bc
N23.60 ± 0.36 cd3.88 ± 0.35 cde4.34 ± 0.11 defg4.45 ± 0.23 cde3.98 ± 0.32 bcde
N13.29 ± 0.16 de3.77 ± 0.19 de4.14 ± 0.8 efg4.29 ± 0.34 de3.34 ± 0.35 e
D3N44.82 ± 0.24 a5.54 ± 0.03 a5.49 ± 0.36 ab6.11 ± 0.53 ab4.60 ± 0.26 b
N34.62 ± 0.24 ab5.29 ± 0.29 a5.56 ± 0.53 a6.38 ± 0.47 a5.39 ± 0.14 a
N24.88 ± 0.04 a5.02 ± 0.32 a5.41 ± 0.12 ab6.03 ± 0.36 ab4.48 ± 0.32 bc
N14.35 ± 0.36 ab4.97 ± 0.38 ab5.15 ± 0.06 abc5.41 ± 0.50 abc4.21 ± 0.18 bcd
D67.35 **97.39 **30.01 **21.17 **16.44 **
F ValueN1.505.42 **3.62 *4.99 **8.84 **
D × N0.840.020.40.491.67
2023–2024D1N42.61 ± 0.16 ef3.74 ± 0.24 cd4.37 ± 0.24 de4.92 ± 0.06 cde3.76 ± 0.25 def
N32.35 ± 0.23 f3.55 ± 0.23 cde4.06 ± 0.29 ef4.4 ± 0.65 def3.56 ± 0.50 ef
N22.73 ± 0.17 def3.27 ± 0.32 de3.80 ± 0.41 fg4.25 ± 0.47 def3.50 ± 0.28 ef
N12.36 ± 0.24 f3.11 ± 0.19 e3.42 ± 0.14 g4.11 ± 0.19 ef3.36 ± 0.33 f
D2N43.35 ± 0.19 c4.47 ± 0.18 b4.85 ± 0.31 bcd5.09 ± 0.95 bcd4.32 ± 0.35 bcd
N33.01 ± 0.24 cde3.94 ± 0.39 c4.7 ± 0.29 bcd4.49 ± 0.42 def4.09 ± 0.36 cde
N23.16 ± 0.38 cd3.00 ± 0.37 c4.51 ± 0.21 cde4.31 ± 0.72 def3.88 ± 0.35 def
N12.98 ± 0.07 cde3.46 ± 0.09 cde4.32 ± 0.21 def4.03 ± 0.17 f3.60 ± 0.28 ef
D3N44.48 ± 0.22 ab5.17 ± 0.16 a5.2 ± 0.27 ab6.34 ± 0.15 a4.58 ± 0.11 abc
N34.68 ± 0.22 ab4.94 ± 0.17 ab5.43 ± 0.15 a6.55 ± 0.18 a5.11 ± 0.20 a
N24.74 ± 0.09 a4.93 ± 0.08 ab5.17 ± 0.09 ab5.82 ± 0.35 ab4.76 ± 0.24 ab
N14.21 ± 0.40 b4.87 ± 0.15 ab5.02 ± 0.36 abc5.41 ± 0.51 bc4.11 ± 0.19 cde
D157.17 **84.98 **49.64 **36.17 **26.40 **
F ValueN2.807.57 **5.57 **5.41 **4.35 *
D × N0.830.850.810.511.04
Note: N1, N2, N3 and N4 indicate the N rate of 37.8, 43.2, 48.6 and 54 kg N ha−1, respectively. D1, D2 and D3 indicate the plant density of 180, 240 and 300 × 104 plants ha−1, respectively. FN and FD represent the main effects of the nitrogen application rate and planting density. FN×D, the interaction between nitrogen topdressing amount and density. The different lowercase letters in the table indicate that the LSD test was significantly different at the 0.05 probability level. The lowercase letters in the same column value show significant differences between treatments (p < 0.05). *: p < 0.05; **: p < 0.01. All data in the table are expressed as mean ± standard error.
Table 4. Wheat yield and yield components under different density and nitrogen topdressing levels.
YearDensityNitrogen TopdressingSpike Number
(kg ha−1)
Grains Per Spike1000-Kernels Weight (g)Yield (kg ha−1)
2022–2023D1N4522.67 ± 13.20 f51.53 ± 1.83 a43.96 ± 1.43 abc9173.87 ± 431.87 efg
N3518.67 ± 26.40 fg51.03 ± 4.24 ab44.42 ± 1.14 ab8622.93 ± 163.67 fgh
N2516.00 ± 21.42 fg50.47 ± 2.31 ab43.76 ± 1.18 bcd8396.53 ± 129.65 gh
N1496.00 ± 40.92 fg50.73 ± 3.16 ab42.37 ± 0.46 cd7912.67 ± 601.34 h
D2N4600.00 ± 14.24 ef44.63 ± 0.52 cd45.13 ± 0.37 ab9726.93 ± 269.40 cde
N3569.33 ± 16.76 def46.9 ± 0.99 bcd45.83 ± 0.98 a10188.93 ± 374.50 bc
N2556.00 ± 17.28 cde51.17 ± 0.87 a41.88 ± 1.26 d9324.80 ± 494.63 def
N1553.33 ± 14.73 bcd47.7 ± 1.16 abcd43.24 ± 0.15 bcd8113.20 ± 362.50 h
D3N4657.33 ± 23.17 bc43.77 ± 0.31 d43.97 ± 0.64 abc9992.67 ± 235.33 bcd
N3628.00 ± 8.64 ab48.53 ± 1.8 abc45.00 ± 1.47 ab11372.40 ± 330.32 a
N2622.67 ± 26.40 ab45.67 ± 1.82 cd44.57 ± 0.59 ab10549.47 ± 502.51 b
N1598.67 ± 9.43 a45.57 ± 0.59 cd44.09 ± 0.7 abc9379.73 ± 316.44 def
D57.65 **12.84 **1.4344.45 **
F ValueN4.50 *1.775.26 *18.65 **
D × N0.401.892.35 2.91 **
2023–2024D1N4521.33 ± 9.98 cdef58.80 ± 4.71 a44.24 ± 0.56 def8367.73 ± 129.82 de
N3497.33 ± 14.73 ef60.00 ± 2.68 a45.1 ± 0.22 bcd8259.00 ± 173.91 e
N2482.67 ± 21.75 fg49.80 ± 2.71 d43.75 ± 0.34 fg7932.27 ± 115.53 f
N1452.00 ± 20.40 g48.60 ± 2.42 d43.03 ± 0.85 g7787.87 ± 84.26 f
D2N4557.33 ± 19.14 bc57.20 ± 1.72 ab45.13 ± 0.55 bcd8596.27 ± 103.77 bcd
N3541.33 ± 16.76 bcd55.20 ± 4.71 abc45.50 ± 0.40 bc8718.60 ± 142.89 bc
N2521.33 ± 27.39 cdef52.60 ± 2.58 bcd44.88 ± 0.46 cde8375.60 ± 57.11 de
N1514.67 ± 21.00 def50.00 ± 4.38 cd43.91 ± 0.45 efg7818.67 ± 136.09 f
D3N4602.67 ± 13.20 a49.80 ± 3.06 d46.64 ± 0.35 a9078.93 ± 189.24 a
N3569.33 ± 19.14 ab56.40 ± 4.13 ab47.01 ± 0.53 a9118.60 ± 183.71 a
N2545.33 ± 26.40 bcd48.40 ± 4.27 d46.15 ± 0.75 ab8847.80 ± 195.14 ab
N1536.00 ± 18.18 bcde50.6 ± 4.92 cd44.79 ± 0.33 cdef8494.53 ± 103.05 cde
D27.66 **2.8834.15 **64.32 **
F ValueN9.62 **11.54 **15.49 **28.84 **
D × N0.292.330.371.09 *
Note: N1, N2, N3 and N4 indicate the N rate of 37.8, 43.2, 48.6 and 54 kg N ha−1, respectively. D1, D2 and D3 indicate the plant density of 180, 240 and 300 × 104 plants ha−1, respectively. FN and FD represent the main effects of nitrogen application rate and planting density. FN×D, the interaction between nitrogen topdressing amount and density. The different lowercase letters in the table indicate that the LSD test is significantly different at the 0.05 probability level. *: p < 0.05; **: p < 0.01. All data in the table are expressed as mean ± standard error.
Table 5. Nitrogen accumulation at anthesis and maturity stage of wheat under different density and nitrogen topdressing levels.
YearDensityNitrogen TopdressingFlowering Plants
mg·Plant−1
Mature Period
mg·Plant−1
PlantsGrain
2022–2023D1N435.60 ± 0.02 d11.07 ± 0.01 f33.62 ± 0.35 e
N335.00 ± 0.01 fg10.81 ± 0.01 g31.98 ± 0.07 f
N232.36 ± 0.04 h10.40 ± 0.06 h30.75 ± 0.06 g
N129.62 ± 0.16 i9.88 ± 0.15 i29.42 ± 0.07 h
D2N436.36 ± 0.05 c11.87 ± 0.02 d35.02 ± 0.31 c
N335.79 ± 0.06 d11.48 ± 0.16 e34.12 ± 0.06 d
N235.00 ± 0.02 f10.47 ± 0.02 h33.84 ± 0.05 de
N134.77 ± 0.04 g10.35 ± 0.01 h32.21 ± 0.03 f
D3N437.62 ± 0.03 a13.39 ± 0.01 a37.29 ± 0.09 a
N337.47 ± 0.06 a12.80 ± 0.03 b36.93 ± 0.00 a
N236.75 ± 0.16 b12.43 ± 0.02 c36.24 ± 0.20 b
N135.28 ± 0.04 e11.46 ± 0.05 e35.27 ± 0.03 c
D2444.54 **882.69 **957.09 **
F ValueN1205.65 **287.35 **185.60 **
D × N224.53 **11.26 **10.27 **
2023–2024D1N437.44 ± 0.37 cde11.08 ± 0.13 e32.42 ± 0.25 g
N336.39 ± 0.17 de10.77 ± 0.04 ef30.08 ± 0.41 h
N235.08 ± 0.48 e10.35 ± 0.10 gh28.00 ± 0.25 i
N130.79 ± 0.02 f9.51 ± 0.06 i25.12 ± 0.11 j
D2N439.58 ± 0.57 bc12.08 ± 0.11 bc36.78 ± 0.12 cd
N337.39 ± 0.41 cde7.39 ± 0.03 d36.59 ± 0.19 de
N237.52 ± 0.62 cde10.75 ± 0.08 ef35.77 ± 0.41 e
N136.62 ± 0.10 de10.16 ± 0.08 h34.27 ± 0.14 f
D3N443.04 ± 2.47 a12.80 ± 0.14 a38.55 ± 0.02 a
N341.04 ± 0.88 ab12.17 ± 0.07 b38.05 ± 0.08 ab
N239.70 ± 1.00 bc11.76 ± 0.09 cd37.61 ± 0.12 bc
N138.77 ± 0.16 bcd10.55 ± 0.33 fg36.42 ± 0.53 de
D39.24 **145.20 **1121.82 **
F ValueN13.35 **151.35 **114.87 **
D × N1.50 **2.6520.01 **
Note: N1, N2, N3 and N4 indicate the N rate of 37.8, 43.2, 48.6 and 54 kg N ha−1, respectively. D1, D2 and D3 indicate the plant density of 180, 240 and 300 × 104 plants ha−1, respectively. FN and FD represent the main effects of nitrogen application rate and planting density. FN×D, the interaction between nitrogen topdressing amount and density. The different lowercase letters in the table indicate that the LSD test was significantly different at the 0.05 probability level. **: p < 0.01. All data in the table are expressed as mean ± standard error.
Table 6. Nitrogen agronomic efficiency of wheat under different density and nitrogen topdressing levels.
YearDensityNitrogen TopdressingNitrogen Fertilizer Production Efficiency/(kg·kg−1)Nitrogen Use Efficiency/%
2022–2023D1N442.42 ± 0.46 de31.78 ± 0.05 g
N342.19 ± 0.08 de31.34 ± 0.02 h
N238.44 ± 0.42 fg30.33 ± 0.07 i
N137.51 ± 0.26 g28.45 ± 0.03 j
D2N447.77 ± 0.34 c34.81 ± 0.05 e
N353.69 ± 0.17 a34.38 ± 0.04 f
N240.14 ± 1.08 ef34.54 ± 0.05 ef
N138.27 ± 1.60 fg34.52 ± 0.07 ef
D3N450.89 ± 0.57 b38.03 ± 0.04 b
N355.36 ± 2.05 a36.27 ± 0.09 d
N249.53 ± 1.15 bc37.70 ± 0.05 c
N143.72 ± 1.35 d39.21 ± 0.27 a
D137.18 **5938.47 **
F ValueN94.64 **53.70 **
D × N10.69 **176.09 **
2023–2024D1N436.17 ± 0.46 d35.11 ± 0.13 d
N335.75 ± 0.08 de33.05 ± 0.31 e
N231.80 ± 0.42 fg30.47 ± 0.28 f
N130.67 ± 0.26 g27.34 ± 0.15 g
D2N440.90 ± 0.28 c35.84 ± 0.52 d
N344.89 ± 0.48 ab35.10 ± 0.15 d
N233.50 ± 1.08 ef33.70 ± 0.12 e
N131.42 ± 1.60 fg31.12 ± 0.21 f
D3N443.81 ± 0.27 b43.01 ± 0.09 ab
N346.35 ± 0.53 a43.56 ± 0.06 a
N242.89 ± 1.15 bc42.26 ± 1.01 b
N136.87 ± 1.35 d37.60 ± 0.44 c
D128.59 **941.60 **
F ValueN85.98 **178.86 **
D × N8.63 **7.73 **
Note: N1, N2, N3 and N4 indicate the N rate of 37.8, 43.2, 48.6 and 54 kg N ha−1, respectively. D1, D2 and D3 indicate the plant density of 180, 240 and 300 × 104 plants ha−1, respectively. FN and FD represent the main effects of nitrogen application rate and planting density. FN×D, the interaction between nitrogen topdressing amount and density. The different lowercase letters in the table indicate that the LSD test was significantly different at the 0.05 probability level. **: p < 0.01. All data in the table are expressed as mean ± standard error.
Table 7. Grain quality traits of wheat under different density and nitrogen topdressing levels.
YearDensityNitrogenProtein Content/%Wet Gluten Content/%
2022–2023D1N413.40 ± 0.29 a27.43 ± 1.11 a
N312.53 ± 0.21 bc26.23 ± 0.42 b
N212.03 ± 0.37 cd25.43 ± 0.21 bc
N111.13 ± 0.21 efg24.70 ± 1.07 cde
D2N413.17 ± 0.29 ab26.50 ± 0.86 ab
N312.17 ± 0.61 cd26.17 ± 0.33 b
N211.53 ± 0.21 def24.77 ± 0.25 cde
N110.77 ± 0.48 fg24.07 ± 0.17 e
D3N412.77 ± 0.37 abc25.33 ± 0.26 bcd
N312.17 ± 0.52 cd24.90 ± 0.14 cde
N211.63 ± 0.12 de24.20 ± 0.41 de
N110.67 ± 0.26 g23.83 ± 0.17 e
D3.52 *11.90 **
F ValueN39.38 **18.09 **
D × N0.180.66
2023–2024D1N414.30 ± 0.24 a26.53 ± 0.29 a
N313.57 ± 0.41 ab25.83 ± 0.26 abc
N212.30 ± 0.14 cd24.83 ± 0.26 cdef
N112.17 ± 0.19 cd24.23 ± 0.42 efg
D2N413.80 ± 0.08 ab26.27 ± 0.45 ab
N313.23 ± 0.37 b25.20 ± 0.37 cde
N212.30 ± 0.43 cd24.5 ± 0.75 defg
N111.60 ± 0.54 d23.77 ± 0.46 g
D3N413.23 ± 0.37 b25.83 ± 0.69 abc
N312.40 ± 0.24 c25.33 ± 0.41 bcd
N212.23 ± 0.29 cd24.13 ± 0.33 fg
N111.57 ± 0.57 d23.60 ± 0.37 g
D7.79 **3.83 *
F ValueN34.41 **29.59 **
D × N1.160.15
Note: N1, N2, N3 and N4 indicate the N rate of 37.8, 43.2, 48.6 and 54 kg N ha−1, respectively. D1, D2 and D3 indicate the plant density of 180, 240 and 300 × 104 plants ha−1, respectively. FN and FD represent the main effects of nitrogen application rate and planting density. FN×D, the interaction between nitrogen topdressing amount and density. The different lowercase letters in the table indicate that the LSD test was significantly different at the 0.05 probability level. *: p < 0.05; **: p < 0.01. All data in the table are expressed as mean ± standard error.
Disclaimer/Publisher’s Note: The statements, opinions and data contained in all publications are solely those of the individual author(s) and contributor(s) and not of MDPI and/or the editor(s). MDPI and/or the editor(s) disclaim responsibility for any injury to people or property resulting from any ideas, methods, instructions or products referred to in the content.

