Article

Strategy for Monitoring the Blast Incidence in Crops of Bomba Rice Variety Using Remote Sensing Data

1
Department of Plant Production, Universitat Politècnica de València, 46022 Valencia, Spain
2
Physics Technologies Research Centre, Universitat Politècnica de València, 46022 Valencia, Spain
3
Global Change Unit, Image Processing Laboratory, Universitat de València, 46980 Valencia, Spain
4
Department of Geographical Sciences, University of Maryland, College Park, MD 20742, USA
5
Rice Department, Genomic Centre, Instituto Valenciano de Investigaciones Agrarias (IVIA), Carretera CV-315. km 10.7, 46113 Moncada, Spain
*
Author to whom correspondence should be addressed.
These authors contributed equally to this work.
Agriculture 2024, 14(8), 1385; https://doi.org/10.3390/agriculture14081385
Submission received: 12 June 2024 / Revised: 19 July 2024 / Accepted: 14 August 2024 / Published: 16 August 2024
(This article belongs to the Special Issue Smart Agriculture Sensors and Monitoring Systems for Field Detection)

Abstract

:
In this paper, we investigated the monitoring and characterization of the pest Magnaporthe oryzae, known as rice blast, in the Bomba rice variety at the Albufera Natural Park, located in Valencia, Spain during the 2022 and 2023 seasons. Using reflectance data from different Sentinel-2 satellite bands, various vegetative indices were calculated for each year. Significant differences in reflectance in the visible (B4), infrared (B8), red-edge (B6 and B7), and SWIR (B11) bands were detected between healthy and unhealthy fields. Additionally, variations were observed in the vegetation indices, with RVI and IRECI standing out for their higher accuracy in identifying blast-affected plots compared to NDVI and NDRE. Early differences in band values, vegetative indices, and spectral signatures were observed between the unhealthy and healthy plots, allowing for the anticipation of control treatments, whose effectiveness relies on timely intervention.

1. Introduction

Rice is a fundamental and essential food for global food security [1], especially in developing countries [2]. It is one of the three most relevant crops in the world [3] and serves as one of the main sources of energy in the diets of more than half of the population [4]. Since the 12th century, rice has been grown in L’Albufera de Valencia, making it the first place in Spain where rice was cultivated and from which it expanded to other areas in the country [5]. Among all the cultivated varieties, Bomba is a well-recognized landrace that has been cultivated since the end of the 19th century [6]. The Bomba plants show an old morphological aspect; they are tall plants with few and weak stems and low yields. Today, Bomba rice is highly valued in the Spanish market for its grain, cooking, and eating qualities.
Fungal infections are one of the most worrying diseases of the crop, because in addition to causing reductions in yield [7] and losses in the quality of rice [8], they can generate compounds that become toxic for consumption [9]. The disease caused by Magnaporthe oryzae is considered the most important fungal disease in rice cultivation worldwide due to its distribution and high destructive power [10]. Furthermore, the pathogen is highly contagious and can spread rapidly, affecting nearby plants. It can be found throughout the field and causes significant yield losses [11], with estimates of up to a 30% yield loss worldwide [12]. Additionally, the fungus is responsible for a reduction in the surface area of the plant, which in turn results in a significant reduction in yield. This is due to the fungus affecting the weight of the grain as well as the percentage of mature spikelets and mature grains [13]. The fungus affects the entire aerial part of the plant, including the leaves, stems, panicle neck, and the panicle itself [14]. M. oryzae, along with other varieties of this fungus, has been and is currently a serious threat to rice production around the world [15], with reports indicating yield losses up to 35% [16]. Even under favorable crop growth conditions, the fungus tends to destroy the entire rice plant within 20 days, which can lead to a 100% yield loss [17].
A 2005 study concluded that M. oryzae destroyed enough rice each year to feed 60 million people and that 50% of the production could be lost in infested plots [18]. The impact that the fungus has on the crop highlights the need to look for effective and environmentally friendly solutions. The traditional method is chemical control, i.e., the use of pesticides, especially fungicides [19]. Their effectiveness depends on several factors, such as the substance itself, the application method, the degree of development of the infestation, the forecasting system and, above all, the time at which the treatment is applied [20]. It should be considered that, in spite of its effectiveness, chemical control must be used correctly, since improper use, such as human exposure, can cause intoxication and harmful side effects in people [21]. Good work practices are essential when applying products such as fungicides in order to guarantee the safety of exposed workers during the application of these types of chemical products [22]. The extent of the disease, as well as the level of infestation, is traditionally assessed visually on symptomatic plants, which is time-consuming and labor-intensive [23]. Integrated pest management (IPM), i.e., knowing the pathogen and monitoring its appearance, is a tool to apply control measures before yield losses exceed the cost of control [12].
Remote sensing data provide the possibility of detecting changes in plant biophysical properties caused by pathogens [24,25], since reflectance is determined by the chemical and morphological characteristics of the plant surface [26]. The study of the unique spectral signature of the crop makes it possible to recognize its coverage and condition, facilitating assessments and analysis using remote sensing techniques [27]. Plant responses to initial crop infestation are difficult to quantify visually, however, these infestations usually affect the quantity and quality of electromagnetic radiation reflected in the spectral signature of the crop [28,29]. Previous studies have reported on the relationship between spectral reflectance and satellite sensors regarding the biophysical parameters of the crop [30]. The application of remote sensing technology for early detection of infested plants is being extensively investigated [31]. However, the effectiveness of this method may vary depending on the type of pest and crop. Therefore, it is essential to evaluate the sensitivity of remote sensing characteristics to ensure successful monitoring.
Early detection of M. oryzae is crucial in rice farming to prevent significant damage and production losses. Traditional field monitoring of crop damage caused by diseases and pests can be time-consuming and labor-intensive [32]. Furthermore, the reliability of the assessments carried out by individual field advisors, who carry out visual surveys of symptomatic plants, is questionable, leading to considerable discrepancies in the outcomes obtained [29]. Remote sensing can be used as a tool to objectively characterize infected crops [28], providing more accurate and consistent measurements than those obtained by field assessors [32,33,34,35,36,37]. This monitoring and classification are possible because diseases cause chemical and biological changes in plants, which can be detected using remote sensing technology. The interaction of leaf tissue with light is determined by its structural and chemical properties. During pathogenesis, leaf pathogens alter these properties, which in turn affects the leaf optics. As a result, the spectral reflectance of vegetation is determined by the morphological and chemical characteristics of the leaf surface or organ. This was previously reported by Mahlein [28] and also discussed by Zhang et al. [26]. Reflectance data can detect changes in the pathogen-related biophysical properties of plants and canopy [24,25,38,39,40].
Therefore, the use of remote sensing techniques can provide a record of the severity of the disease and allows the level of infestation to be assessed more objectively [37,38] before it becomes visibly evident. The results obtained in the study by San Bautista et al. [32] demonstrated the importance and need to evaluate all reflectance regions to study the sensitivity of any change in any of the bands as a new index.
Based on the critical moment for initiating an Integrated Pest Management program in rice and with the beginning of the appearance of differences between affected and unaffected canopies, the spectral signature is unique to each crop and is fundamental for the recognition of plant canopies. Therefore, in order to carry out crop studies with remote sensing techniques, it is essential to start by obtaining spectral signatures [27]. The dynamics between reflectance in the visible and NIR bands follow the crop dynamics proposed by San Bautista et al. [32]. Other previous studies in other species, such as wheat stripe rust [41], wheat powdery mildew [42], kiwi gray mold [43], tomato late blight [44], and leafroll of vine [45] demonstrated that the analysis and representation of the spectral signature could anticipate the detection of the disease due to changes in the reflectance spectrum of some of the bands studied.
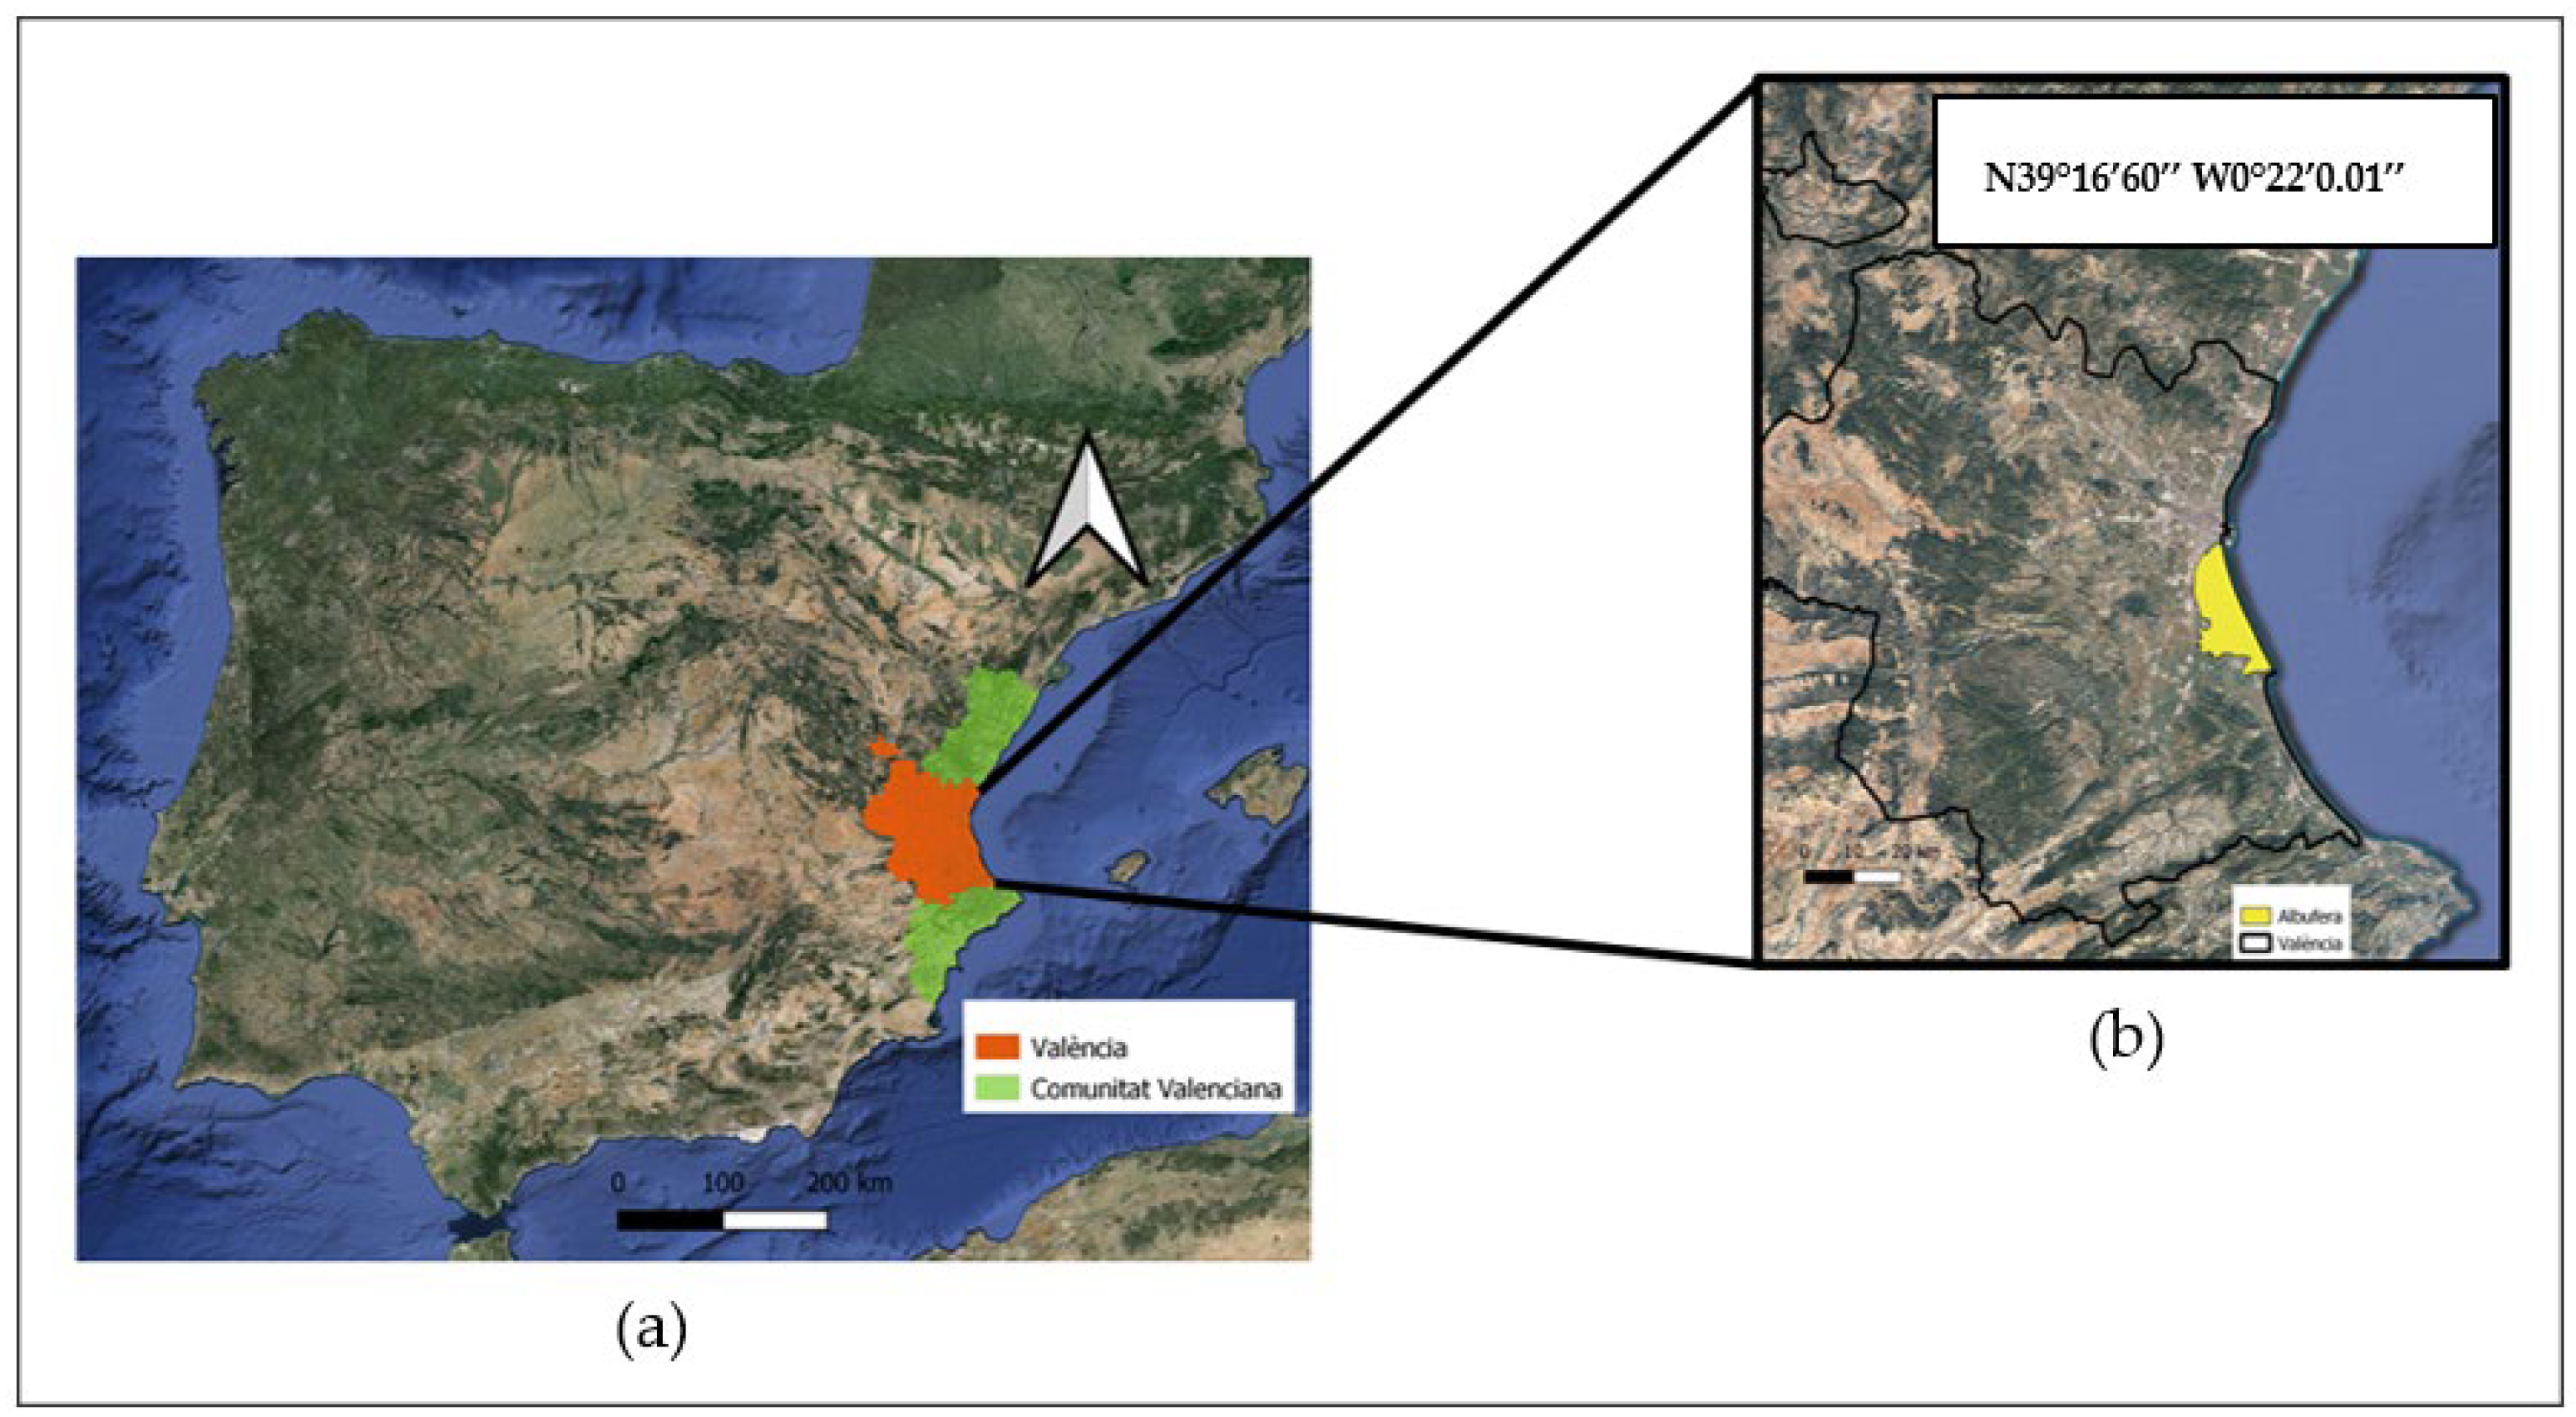
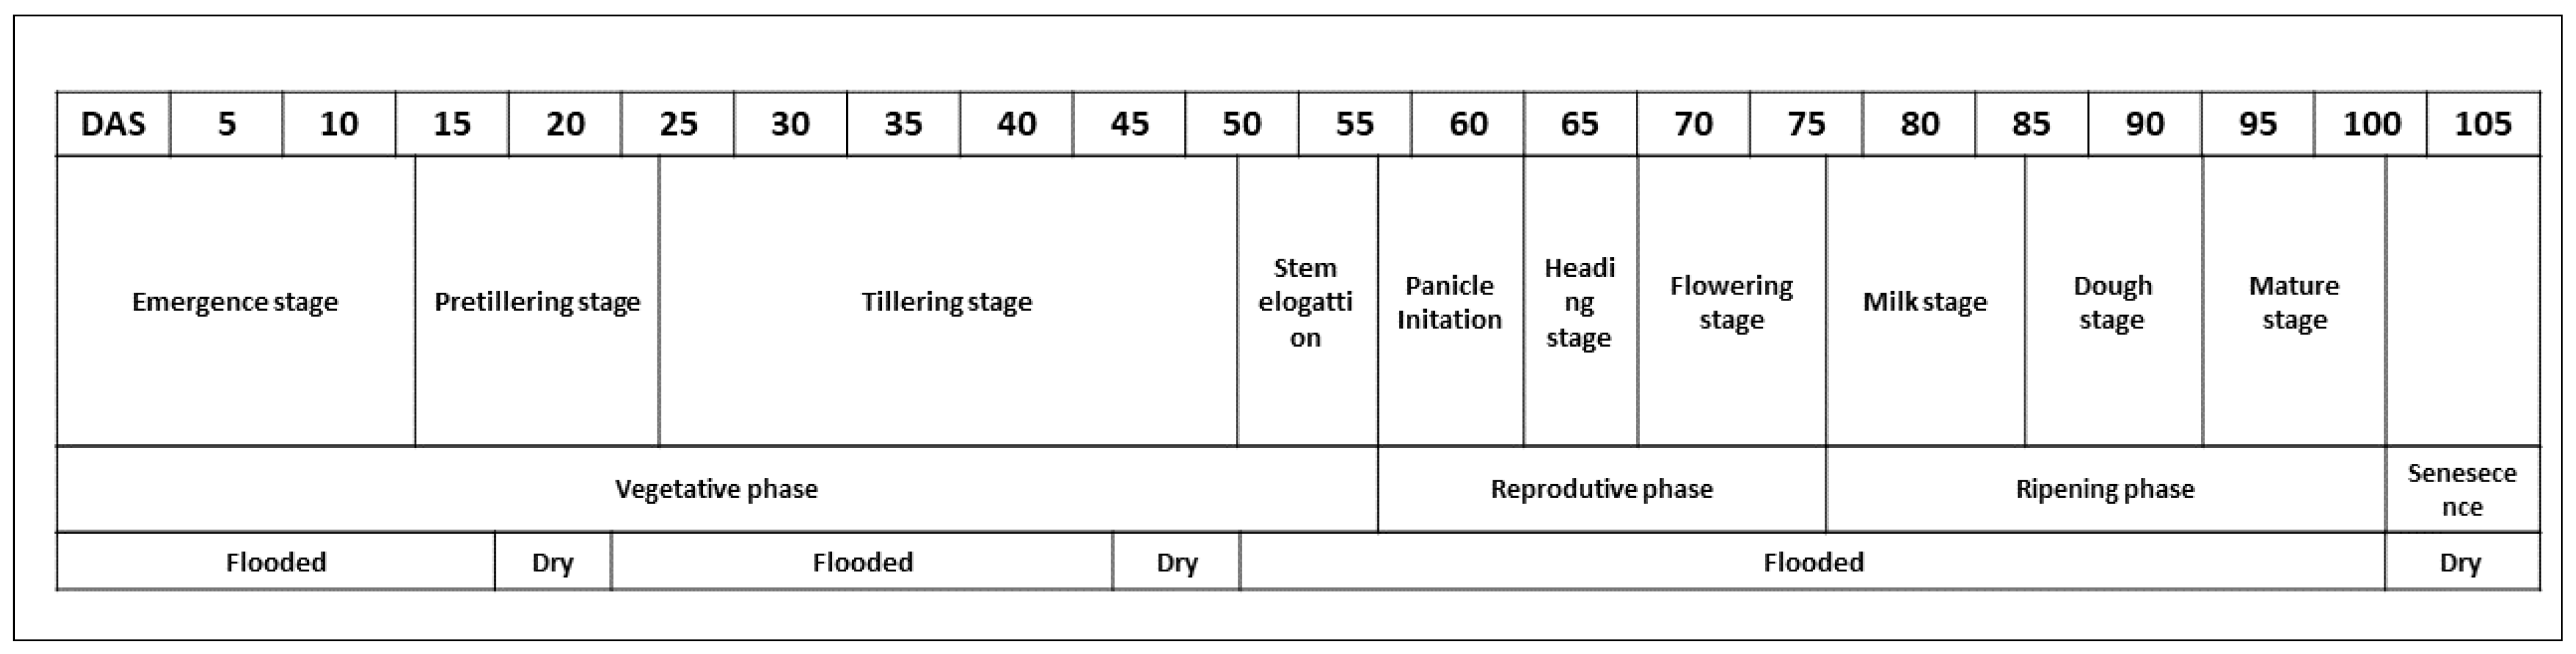
The objective of this work is to study the monitoring of M. oryzae infection in the Bomba variety at L’Albufera Natural Park (Valencia, Spain) in the years 2022 and 2023. For this, the reflectance values of different bands obtained from the Sentinel-2 satellite were used and, from these values, different vegetative indices used in rice cultivation were obtained for each year. From the results obtained, it is possible to quantify the degree of infestation before it is visually evident, which is of utmost importance in pest control. The crop response to M. oryzae infestation is also characterized by relating the evolution of reflectance and the different vegetative indices with field sampling. The results obtained in the early detection of the incidence of blast in rice crops could be the basis for advancements in the detection of the disease at the intra-field level. In this way, the proposed monitoring during the process of rice cultivation could be considered a digital tool capable of generating objective information to achieve Precision Agriculture.

2. Materials and Methods

2.1. Study Area

The present study was performed during the years 2022 and 2023 in the Natural Park of Albufera in the region of Valencia, Spain (39°16′ N, 0°22′ W), a traditional rice crop-producing area at sea level. The expansive Albufera lake extends over an area of more than 211 km2 and is flanked by the Jucar River to the south and the Turia River to the north. This region is characterized by its large surrounding fields dedicated to rice cultivation, with a rice planting area of approximately 200 km2. Figure 1 shows the location of the experiment region.
The climate is classified as subtropical Mediterranean [46], with dry and hot summers. Table 1 shows the temperatures (T), relative humidity (RH), and rainfall (mm) during 2022 and 2023.
Figure 2 shows the mean temperatures and relative humidity for the 2022 and 2023 seasons. Graphically indicated temperatures between 17 °C and 28 °C and a relative humidity higher than 93% are optimal for the growth of rice blast [47].
The soil in the area is characterized as sandy loam with a pH of 7.8, 3% organic matter, and an electrical conductivity (EC) of 3.2 ds/m. At a depth of up to 15 cm, it encompasses approximately 0.15% N, 30 parts per million (ppm) P, and 234 ppm K [48]. The irrigation water comes from the Albufera lake and has no restrictions on the salinity of the rice field (pH: 7.5; EC: 3.2 ds/m) [49]. Water management is carried out by continuous flooding (to depth of 10–15 cm) during the whole season (direct water-seeing), except for three periods, when the fields are traditionally dried for treatments such as herbicide top-dress fertilization, pesticides, and harvest, over an entire irrigation sector.

2.2. Experimental Design

Rice was sown on 8 June 2022 and 4 May 2023 (0, DAS, Day After Sowing), with a sowing rate of 190 kg/ha, and harvests took place on 27 September 2022 and on 28 August 2023 (110 DAS). Phenological stages were classified according to the BBCH scale (Biologische Bundesanstalt, Bundessortenamt und Chemische Industrie) [50]. Figure 3 shows the phenological cycle of the crop in the experimental plot and the periods when the fields are dried. Nitrogen, phosphorus, and potassium were applied as described by Osca [51].
The experiment consisted of 21 plots of the Bomba rice variety over a total surface area of 777,000 m2 for 2022 and 16 plots with a total surface area of 525,000 m2 for 2023, which are shown in the Table 2. The availability of study plots fluctuates depending on the growing activities of producers each season (Figure 4), as these plots are not designated as experimental. The current count of fields available for the experiment is 37. Therefore, different plots were studied both for the year 2022 and the year 2023, independently, which represents a study of a total of 1,292,000 m2. Growers followed the same crop management practices (plant nutrition, water requirement, and cultural practice), following the recommendations described by Osca [51].

2.3. Field Parameters: Determination of M. oryzae Effects

To evaluate M. oryzae infestation, disease symptoms were evaluated according to the Standard Evaluation System for rice (SES) from the IRRI (International Rice Research Institute) [52] every two weeks during July, August, and September. The following parameters were recorded: leaf incidence, leaf severity (affected area in percentage), percentage of panicle infestation, panicle collar in percentage, percentage of affected nodes, and the presence of Brown Spot (Helminthosporium). The dates of the field evaluation are presented in Table 3.

2.4. Remote Sensing Data

Satellite images obtained by the Multi-Spectral Instrument (MSI) on board the Sentinel-2A/B constellation of the T30SYJ tile were used [53]. Sentinel-2 level 2A provides atmospherically corrected surface reflectance images with 13 different spectral bands:
  • 10 m spatial resolution bands: B2-Blue (490 nm), B3-Green (560 nm), B4-Red (665 nm), and B8-NIR (842 nm).
  • 20 m spatial resolution bands: B5-Vegetation Red Edge (705 nm), B6-Vegetation Red Edge (740 nm), B7-Vegetation Red Edge (783 nm), B8a-Vegetation Red Edge (865 nm), B11-SWIR (1610 nm), and B12-SWIR (2190 nm).
In this study, both the bands with the highest spatial resolution (10 m) and quality, as well as those with the lowest resolution (20 m), were considered, although the small size of rice fields in Spain makes it difficult to take advantage of the latter.
The study used cloud-free images from sowing to harvest in the 2022 and 2023 seasons. Dates in both years were carefully selected based on days after sowing and phenology (Table 4). The downloadable product offers surface reflectance [53]. The obtained values were combined for the different fields that were previously identified as Bomba rice.
The analysis focused on examining band values obtained from Sentinel-2 and derived plant indices (Table 5). These test results were used to investigate the evolution of the crop cycle and the spectral signature on dates identified as critical for blast infestation in the crop.

2.5. Statistics

The statistical analysis carried out was a simple ANOVA (analysis of variance) analysis performed to compare both groups based on the classification and the seasons under study (2022 and 2023), according to the F-Snedecor test with a p-value < 0.05. A mean separation table was made using the LSD test (Least significant difference), with a p-value < 0.05, based on the mean values of the plots according to their classification in the field, healthy or unhealthy, in order to relate the values obtained from samplings and satellite data.

2.6. Software

Statistical analyses were performed with Matlab software 7.10.0 [58]. The processing of satellite images obtained from the Sentinel-2 GEE (Google Earth Engine) [59] was carried out with the QGIS 3.10.14 software [60].

3. Results

3.1. Classification of the Plots According to M. oryzar Affectation

During the field sampling process using SES, all Bomba plots in this study were classified into two groups—healthy and unhealthy. Classification was based on specific conditions: plots with a value lower than 5 on the leaf (typical blast lesions infecting between 4 and 10% of the leaf area) and panicle (lesion partially around the node or the uppermost internode or the lower part of panicle axis near the base) severity scales were classified as healthy, while plots with a value higher than 5 were classified as unhealthy. In each plot, during field work, 27 control points were taken, regularly distributed throughout the plot (each plot was divided into three blocks with three repetitions in each block and three control points in each block). The criterion we adopted is that if the 27 points are healthy, the plot is healthy. Otherwise, it is unhealthy. The resulting classification with the number of plots and total area for the 2022 and 2023 seasons is presented in Table 6.

3.2. Spectral Reflectance

3.2.1. Sentinel Bands

From 30 DAS until the day of harvest (110 DAS), the evolution of the bands at 10 and 20 m of spectral resolution were analyzed by averaging the mean value of each group of plots for 2022 and 2023.
Figure 5 displays the progression of the plots classified as healthy and unhealthy in the visible RED (B4) and NIR (B8) bands, both at 10 m spectral resolution. From the beginning to 60 DAS, the reflectance in the red band decreased slightly due to plants becoming greener (Figure 5A). Reflectance stabilized up to 75 DAS but then increased due to the loss of green color, accelerating after 90 days. According to the scientific literature [33,34], the increased reflectance and loss of green color would indicate a reduction in chlorophyll content. Figure 6 shows the evolution of band B4 and the differences between two fields with different classifications. Variations in the highest level of crop greenness may be an early sign of blast disease. However, the study did not find any statistically significant differences between the healthy and unhealthy plots.
The pattern observed in both years was similar. However, the red reflectance values recorded in 2022 were higher than in 2023. As seen in the results, both healthy and unhealthy groups of plants wilted earlier and more severely in 2022.
Regarding the temporal evolution of B8-NIR, an opposite trend to red, increasing the reflectance value up to 70 DAS, was observed in both healthy and unhealthy plots (Figure 5B). Thereafter, the reflectance values in B8-NIR, in 2022 and 2023, decreased until reaching values close to 0.2. According to the agronomic interpretation of this band, the rice crop increased its coverage as the phenological stages progressed. With the arrival of the gleaning and flowering stages, a loss of reflectance began.
As in the case of red reflectance evolution, the B8-NIR values reached in 2022 were higher than those recorded in 2023. According to the results of the scientific literature, the crop showed higher vigour and canopy in 2022. However, contrary to what was observed for red reflectance, in the case of B8-NIR statistically significant differences were found for B8-NIR between healthy and unhealthy plots (p < 0.05). Clearly, a lower plant biomass was evident in the blast-affected plots, from the early tillering stage.
Figure 7 shows bands B6 (Figure 7A) and B7 (Figure 7B), both with a spectral resolution of 20 m. The reflectance of B6 and B7 bands followed a similar evolution to the B8-NIR band, showing significant differences throughout the cycle. Although the spectral resolution is lower, both bands could be used to separate healthy and infected plots. Therefore, they could also help us study both groups, with vegetative indices calculated by combining these bands. Differences between years and between varieties were maintained, as was the case for reflectance in B8-NIR at 10 m spectral resolution.

3.2.2. Vegetative Indices

The indices analyzed allow us to study the performance of healthy and unhealthy rice plots. Vegetation indices are widely studied and applied to assess the health of different crops. Figure 8 shows the evolution of the NDVI, RVI, NDRE, and IRECI of all the plots according to their disease classification.
NDVI is the most commonly employed index in the scientific literature [61], as it combines the red and NIR bands to yield a value ranging from −1 to 1. This index is highly useful for correcting and improving crop management. As shown in Figure 6, in general terms, NDVI saturation was observed from 45 to 80 DAS (end of tillering to the flowering stage) in 2022 and 2023. These results did not change the limitations of using this vegetation index in agriculture due to saturation as the crop grows. Thus, no statistically significant differences were found between healthy and unhealthy plots during most days of the growth season. Similar results were obtained with the NRDE vegetation index, calculated from the reflectance in B7 instead of the value recorded in B8-NIR. Saturation was reached up to 60–80 DAS, in both years, and the differences were reduced in most of the growing season, except for the last days (dough and mature stage).
Different results were obtained with the vegetation indices RVI and IRECI, as they did not follow the degree of saturation of the previous indices. The values recorded with these new indices reached maximum values between 60–80 DAS (from the end of tillering to flowering) in 2022 and 2023. Therefore, they could be used as good leading indicators for the separation of plots into healthy or unhealthy. Figure 9 shows the evolution of the RVI index in two different fields that were studied. At 60 DAS the differences are visible. However, it should be noted that during most of the growing season statistically significant differences, p < 0.05, were found between healthy and unhealthy plots. Only at the end of the growing session were no differences detected. The values recorded for all vegetation indices were higher in 2022 compared to those obtained in 2023, a trend followed by the values recorded in the bands.

3.2.3. Analysis of Spectral Signature

In the analysis of the evolution of the spectral bands and the most important vegetation indices, it should be noted that the most significant differences appear at the tillering stage, which represents a critical moment for the design of blast control strategies for the season. For this reason, it may be interesting to know the spectral signature at 45 DAS to confirm the main bands that can register differences in the reflectance of healthy and unhealthy plots. The results of this spectral signature analysis are shown in Figure 10 for both 2022 and 2023. From the spectral signature study, it was found that in the visible bands (B2, B3, and B4), no statistically significant differences were detected between healthy and unhealthy plots. On the other hand, in the infrared bands (B5, B6, B7, and B8-NIR), statistically significant differences (p < 0.05) were found in the two years analyzed. Finally, in the bands with the longest wavelength in reflectance, significant differences were found only in B11 band. However, there is a lower proportion of reflectance between healthy and unhealthy plots with respect to the proportions reached in the infrared bands. Finally, no significant differences were found in B12 band.
Finally, the analysis of covariance was used to study the influence of year and disease incidence on reflectance. The analysis included reflectance in the bands studied at 20 m, as well as the main vegetation indices related to disease incidence. The study factors were year and disease, as presented in Table 7 and Table 8. In this statistical analysis, a statistically significant influence of the year was detected in the reflectance recorded in bands B2, B4, B7, and B8-NIR at 45 DAS (p < 0.05), with higher values in 2023 with respect to 2022. In contrast, the analysis of the disease factor indicated that it was only statistically significant in the reflectance data for B2, B4, B6, B7, B8-NIR, B8A, and B11 bands (p < 0.05). This revealed that reflectance values were higher in the healthy plots for these infrared bands, as well as in the unhealthy plots for B2 and B4 bands. In relation to the influence of the studied factors, the total variability explained by the year in B2 and B4 bands was remarkable, representing 38.12% and 33.32%, respectively, indicating the high influence of the year on the visible reflectance. However, the significant effect of the explained variability over the total was that obtained by the disease factor, reaching values between 41.68% and 49.33% in the infrared bands. Finally, the most outstanding result of the ANOVA was the absence of interaction between year and disease factor for any of the bands studied. Therefore, the statistically significant differences between healthy and unhealthy plots are not conditioned by the variability associated with the year factor.
The analysis of variance performed on the values determined in the vegetation indices studied to determine the statistical influence of year and disease is shown in Table 8. The results obtained in this ANOVA confirmed the absence of interaction between the year and the disease factor, as occurred with the bands. The variability explained by year was high, reaching maximum values of 24% of the total NDVI. However, the disease factor obtained the highest values of explained variability over the total, with values between 46.78% and 51%. These results confirm the relevance of the study carried out in this work because the set of factors studied reached values close to 75% of the total variability to characterize the incidence of blast on the rice crop. The highest values for the four indices studied were recorded in the healthy plots with statistically significant differences (p < 0.05). The four indices, NDVI, RVI, NDRE, and IRECI, are also significant, reaching values of more than 60%, explaining the variance of the system. The NDVI and NDRE values obtained are similar, so each of them would be valid for the study of the evolution of the crop, as well as the RVI and IRECI, of which the resulting values are different, but they also reach high values in the calculation of the factor (df), demonstrating that these indices are valid for the study of the impact of blast infestation on the crop. The RVI and IRECI indices, although different in their calculation, follow a similar evolution. For both indices, the largest significant differences between the two groups are obtained throughout the crop cycle. These are very useful indices for monitoring and detecting diseases. NIR bands and indices combining visible and NIR spectra could be of great interest for disease monitoring.

4. Discussion

The analysis of the results presented in this work on how the frames have evolved across the different Sentinel-2 bands has proven to be helpful in categorizing them based on their health status, especially in the B8-NIR and Red Edge (B6 and B7) bands. This categorization was carried out throughout the growing season in the two years analyzed (2022 and 2023). These findings are in agreement with those reported by Zhang et al. [31], who stated that VIS-NIR sensors are the most commonly used remote sensing systems for tracking diseases and pests in plants.
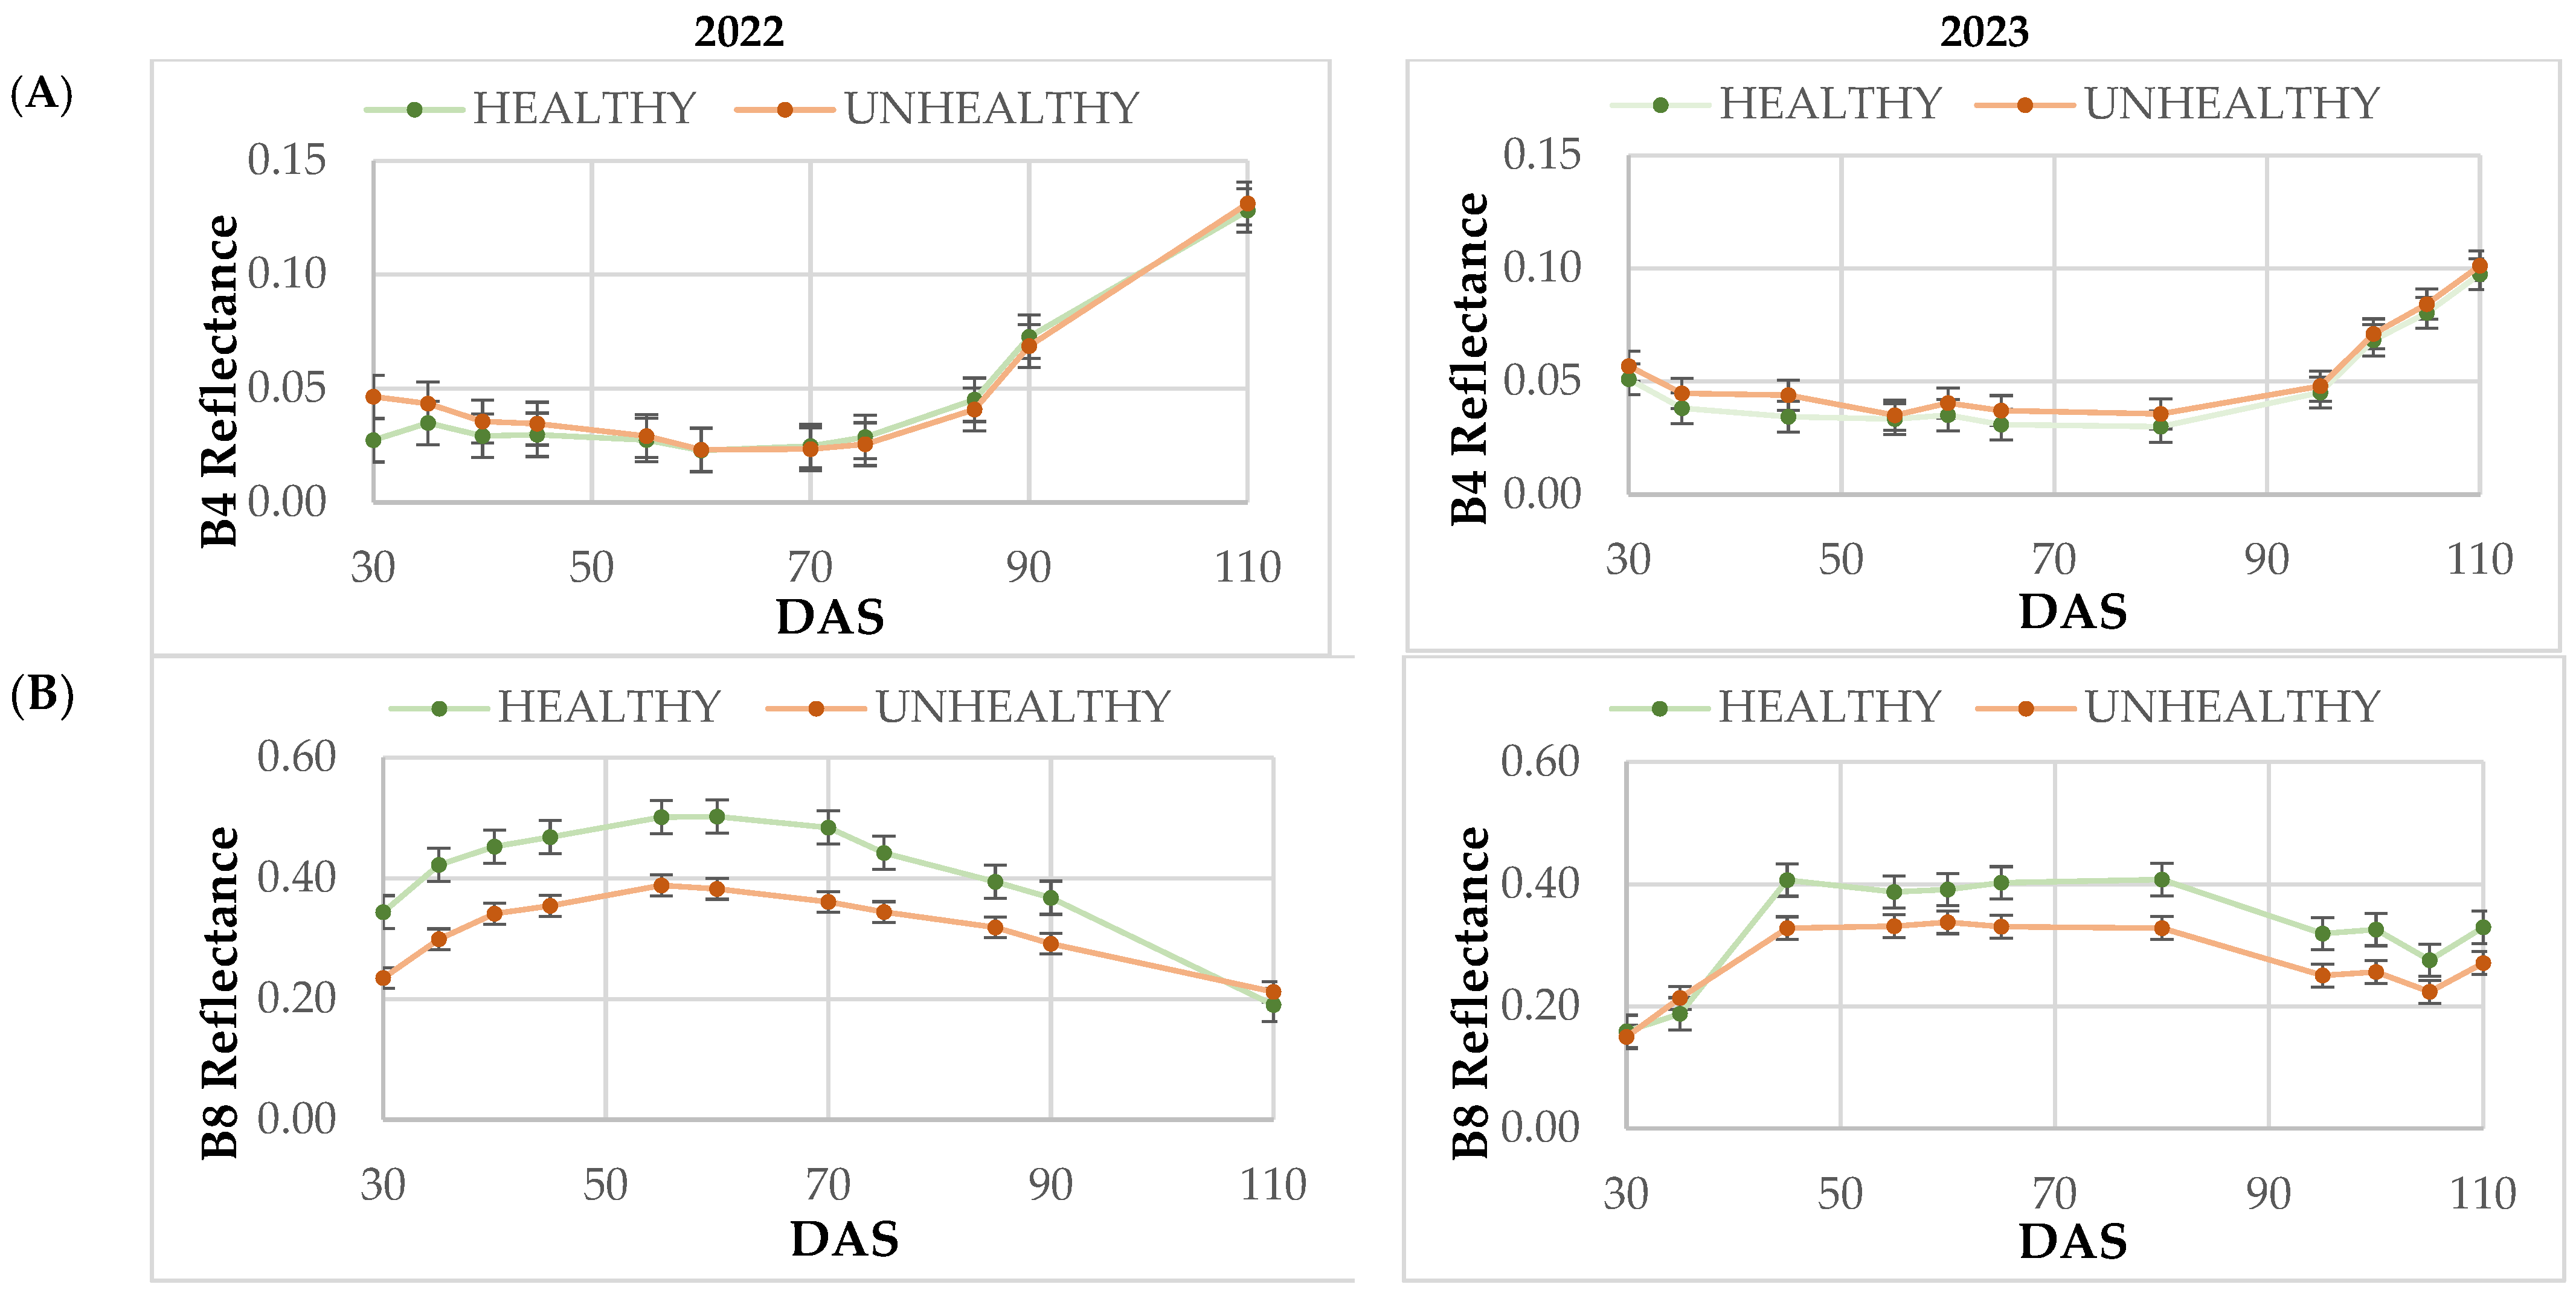
Several studies have found that the green, red, and near-infrared (NIR) spectral regions are sensitive to various plant diseases and pests [62,63]. In our study, there were statistical differences in reflectance in the B8-NIR band throughout the entire cycle for both years (2022 and 2023). The plants affected by blast showed a loss of biomass and plant cover, as was shown by the lowest values in the reflectance of B8-NIR band. The relationship between radiation in the red band and green biomass has an inverse nonlinear relationship, whereas in the near-infrared, the nonlinear relationship is directly due to the strong absorption of incident radiation by chlorophyll [64]. The near-infrared (NIR) spectral region does not absorb much solar radiation and does not have a significant correlation with vegetation pigments [32]. However, it is highly correlated with crop biomass and leaf area index (LAI) [65]. This means that a higher biomass results in greater reflectance in B8-NIR and therefore in plants free of M. oryzae.
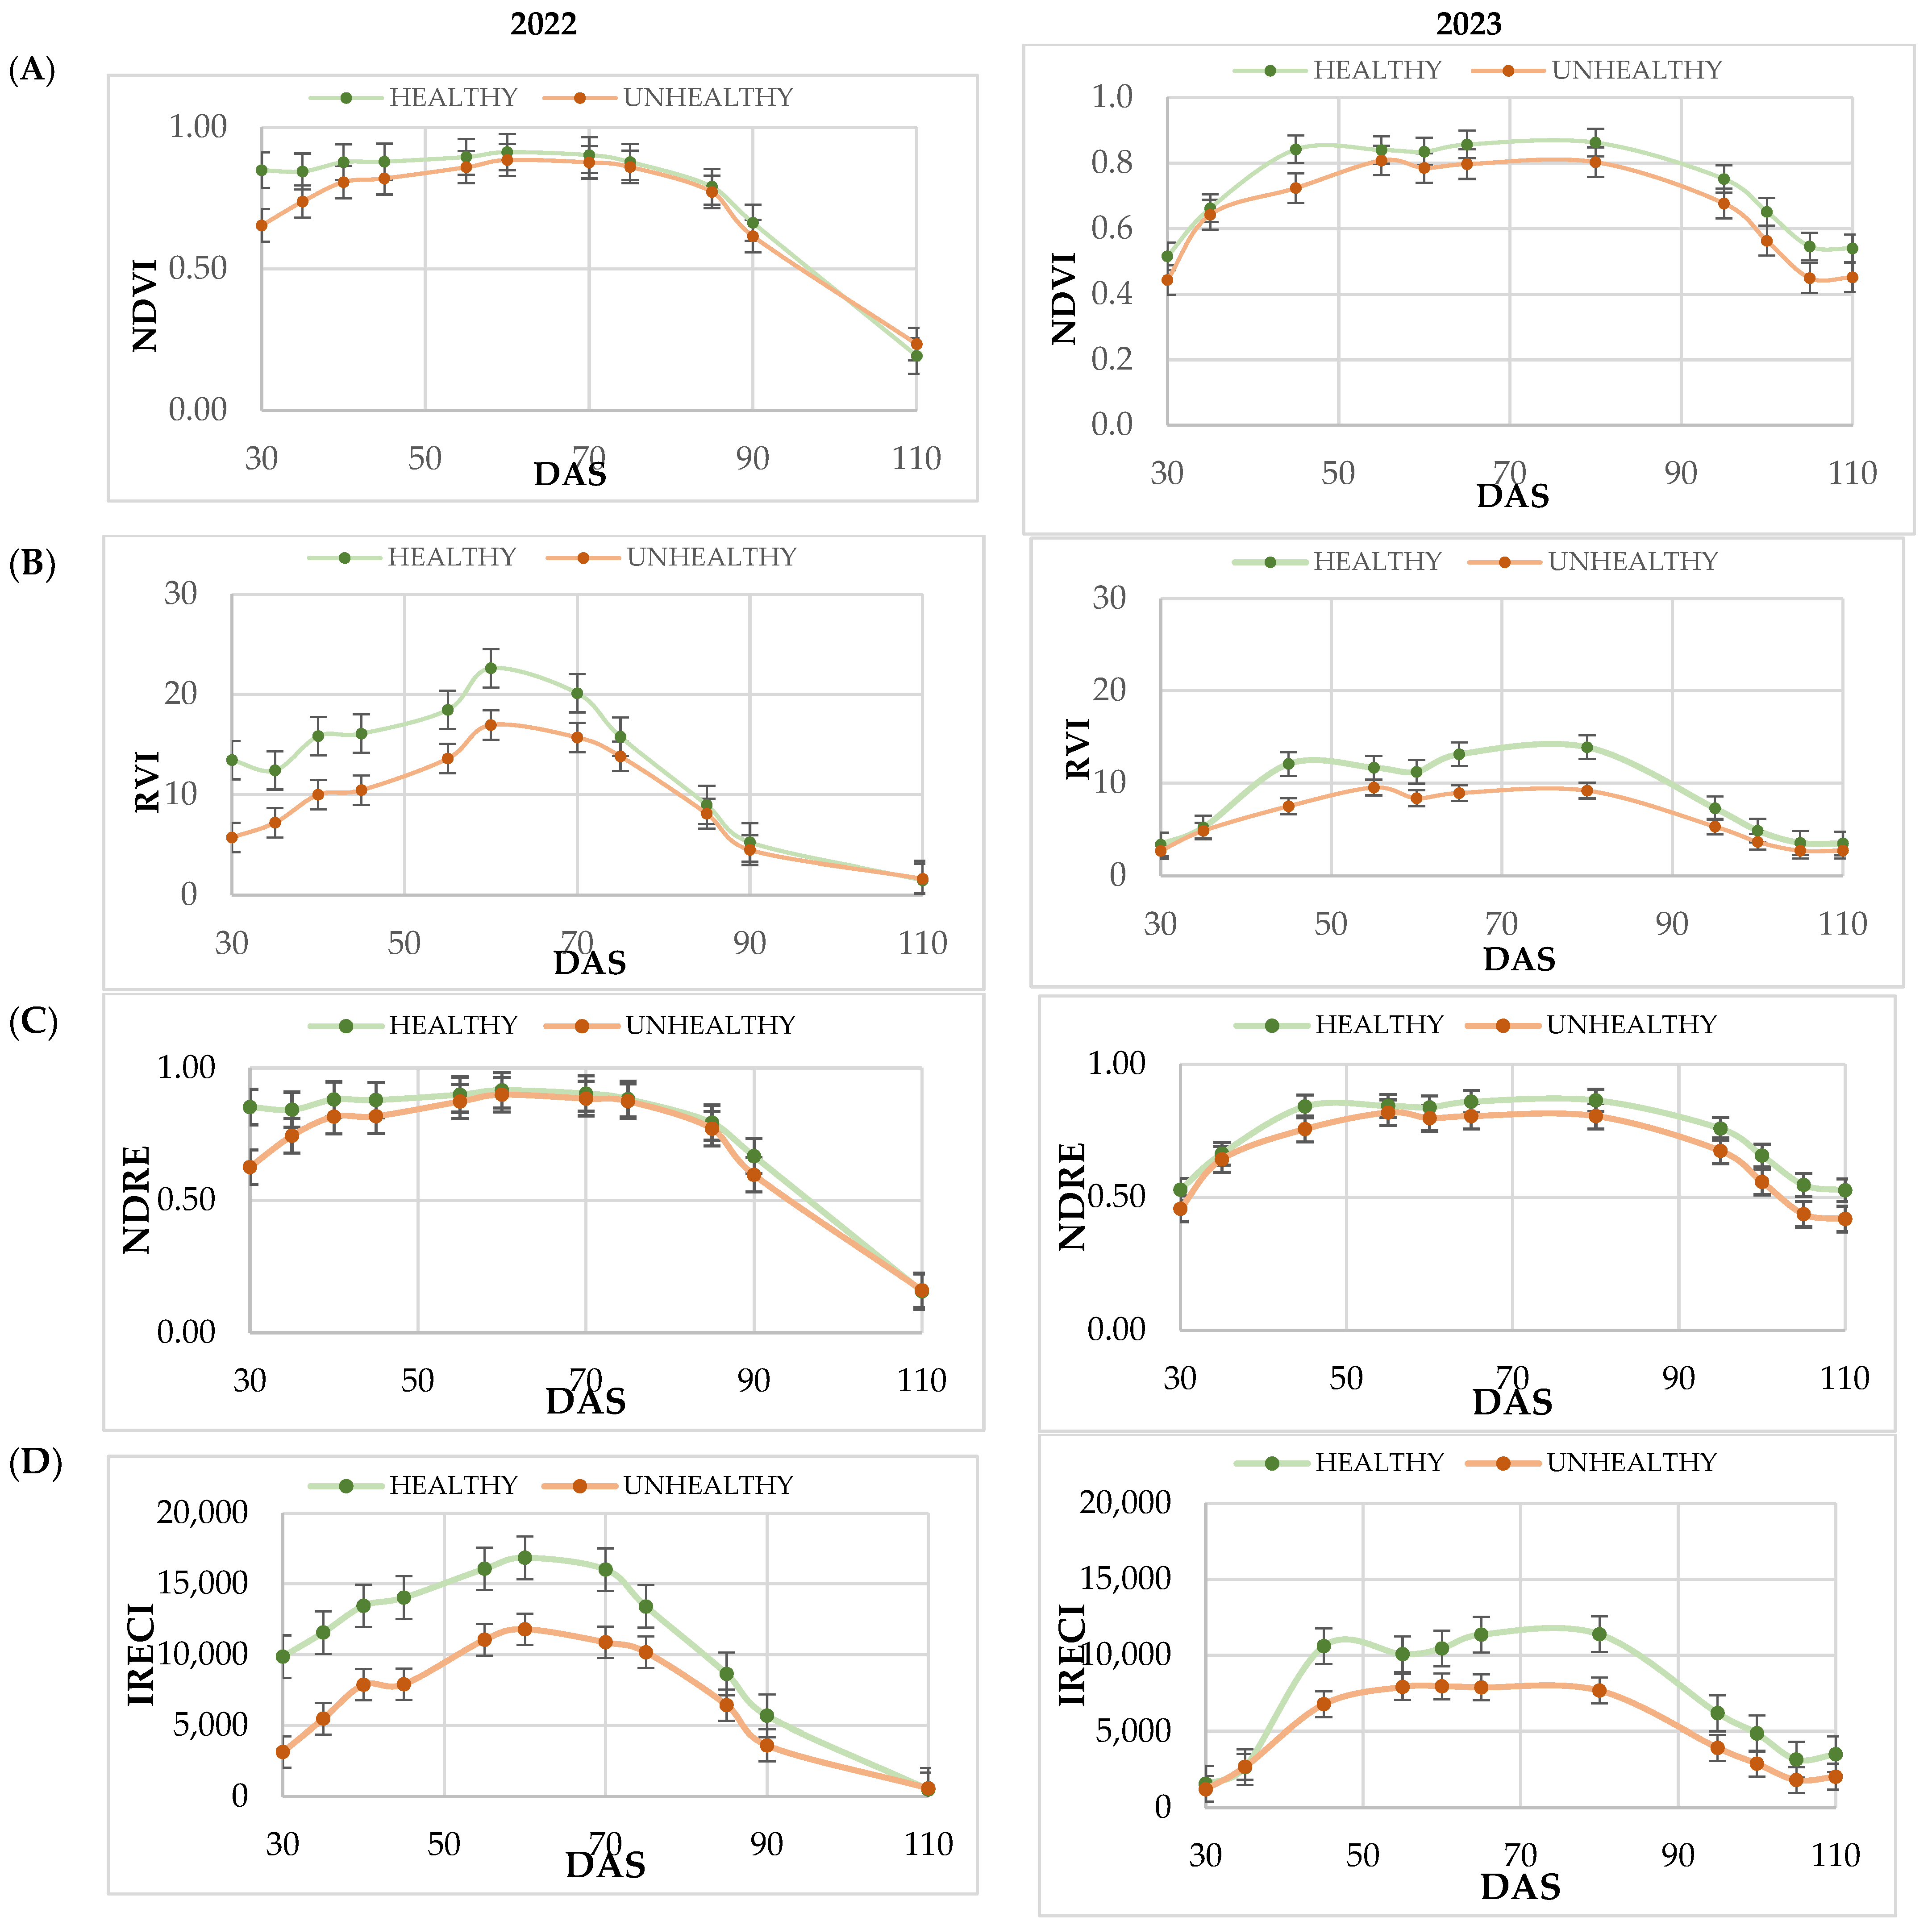
Vegetation indices were used to track the evolution according to the classification of plots according to disease incidence. VIs combining visible and NIR bands improve the sensitivity of green vegetation detection [66]. Therefore, several indices have been studied: NDVI, RVI, NDRE, and IRECI. NDVI, despite being widely used due to its positive correlation with LAI (Leaf Area Index), has a saturation issue. NDVI is not very sensitive to high vegetation densities. However, NDRE improved the discretization of healthy vegetation, coinciding with the results reported by Frampton et al. [41]. The RVI, calculated with the NIR and Red region as NDVI, allows for the study of disease stress [32]. The results obtained in this work show that it could be considered as a VI amplifier of the differences between fields affected and not affected by blast. This ratio, used for monitoring crop growth and development, is highly sensitive to any changes in vegetation that may occur during the peak growth period [67]. Finally, IRECI, compared to the rest of the indices, showed more significant differences between healthy and unhealthy fields, as reported in other works [68]. Since its calculation consists of the three red edge bands, it decreases the saturation with respect to NDVI on high-density crops, such as rice. Moreover, it should be remembered that the red edge reflectance was already an excellent indicator to separate healthy and unhealthy plots. Based on the study of the VIs, the results indicate that NDVI is not a reliable indicator for distinguishing plots affected by blast, even though it is the most commonly used VI for studying agronomic conditions, developmental stages, and crop biomass [69].
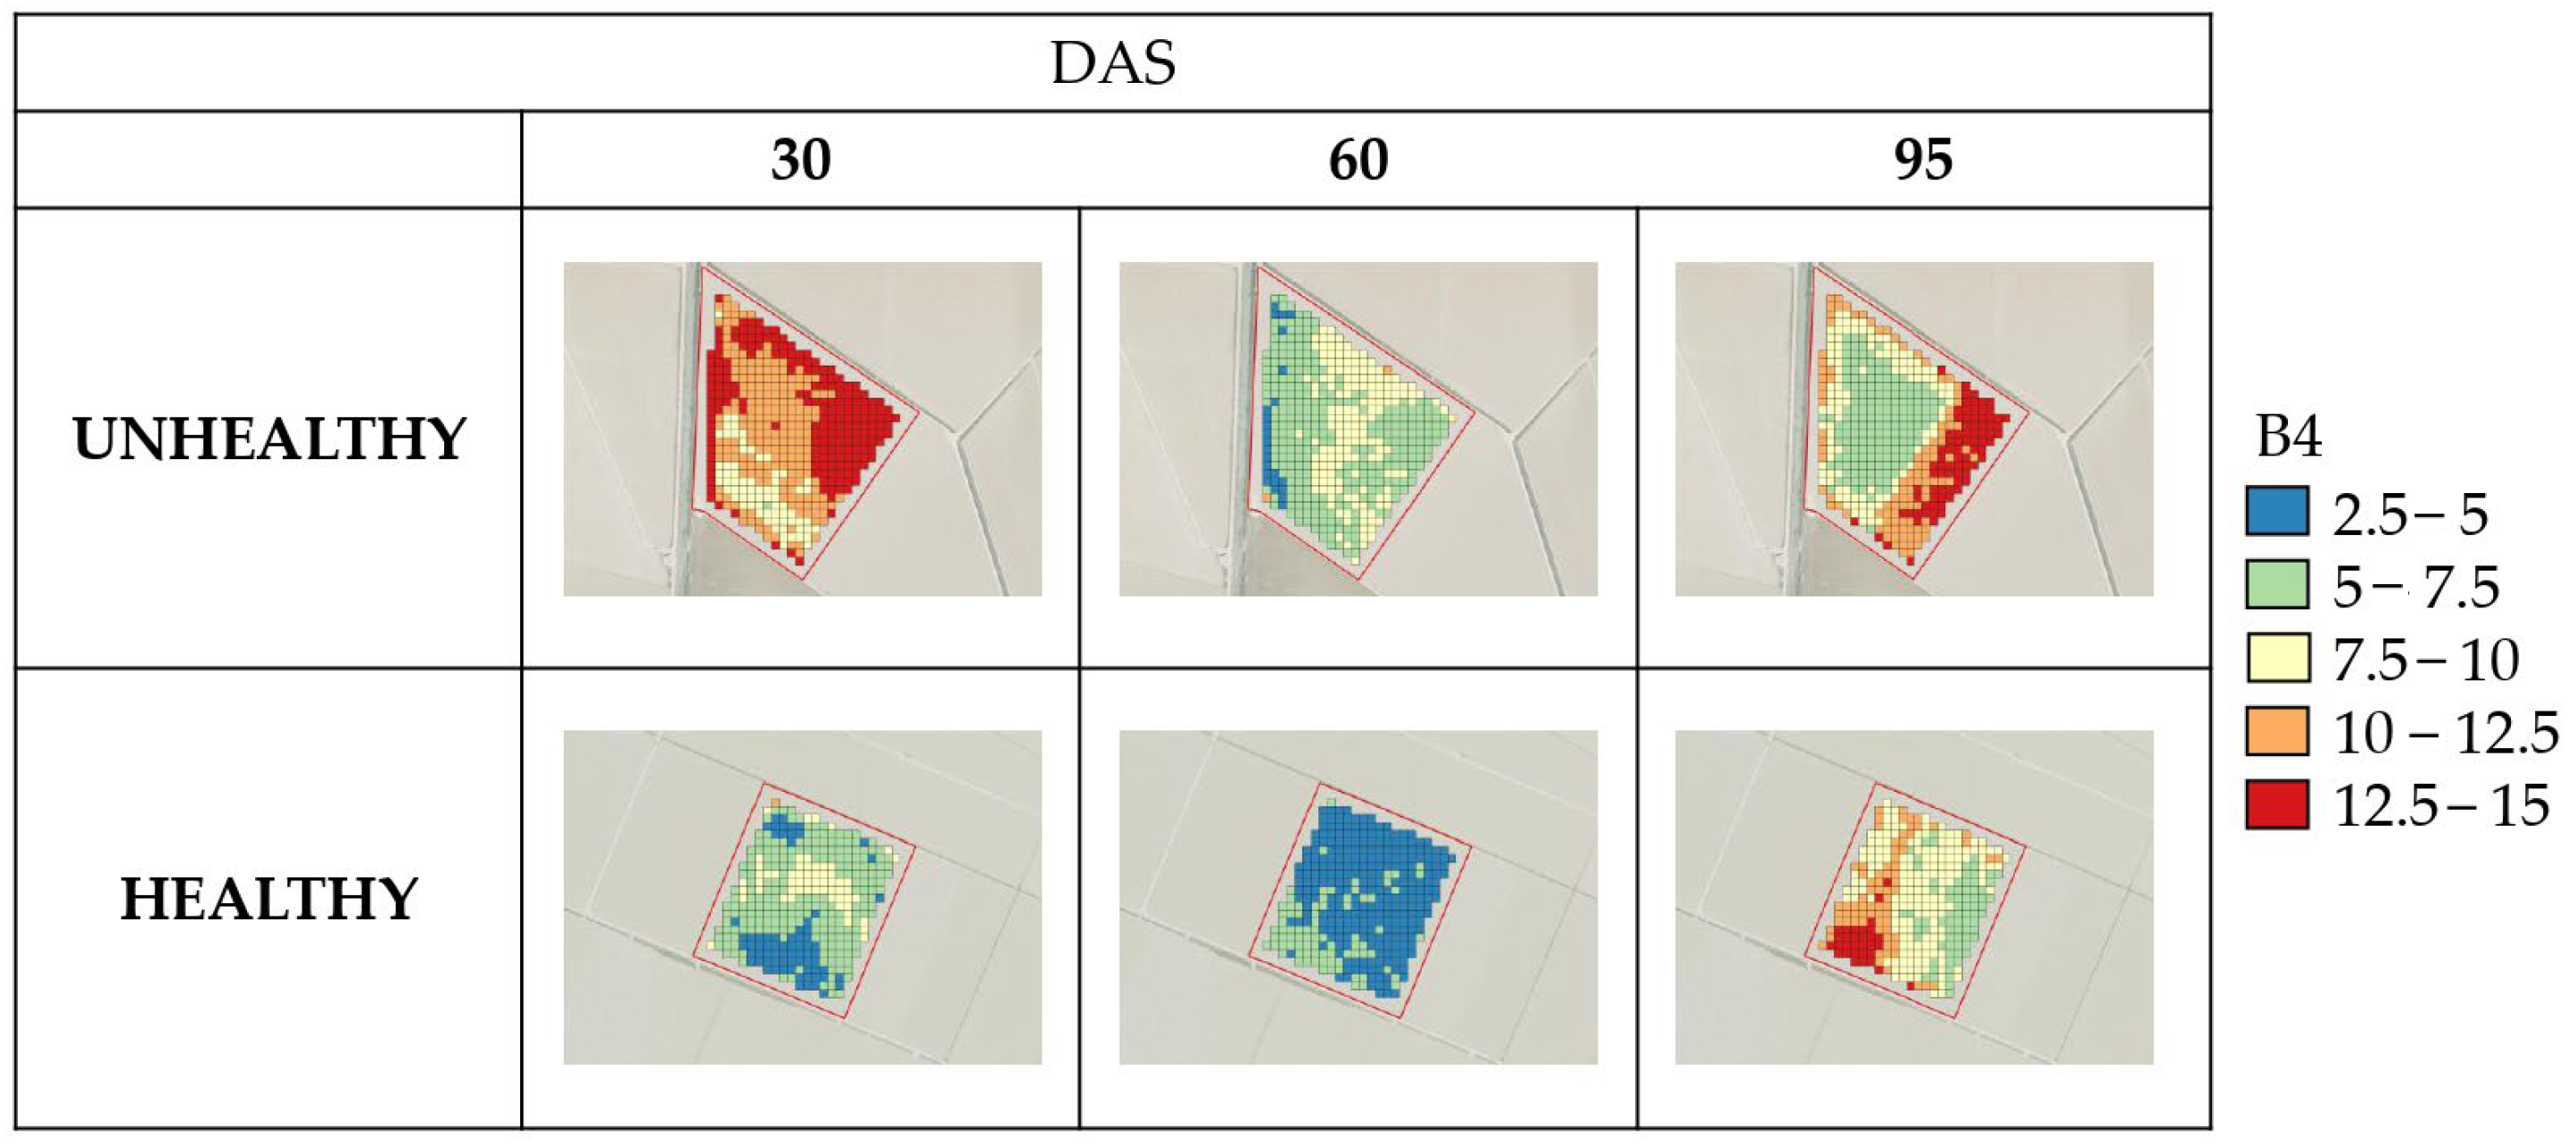
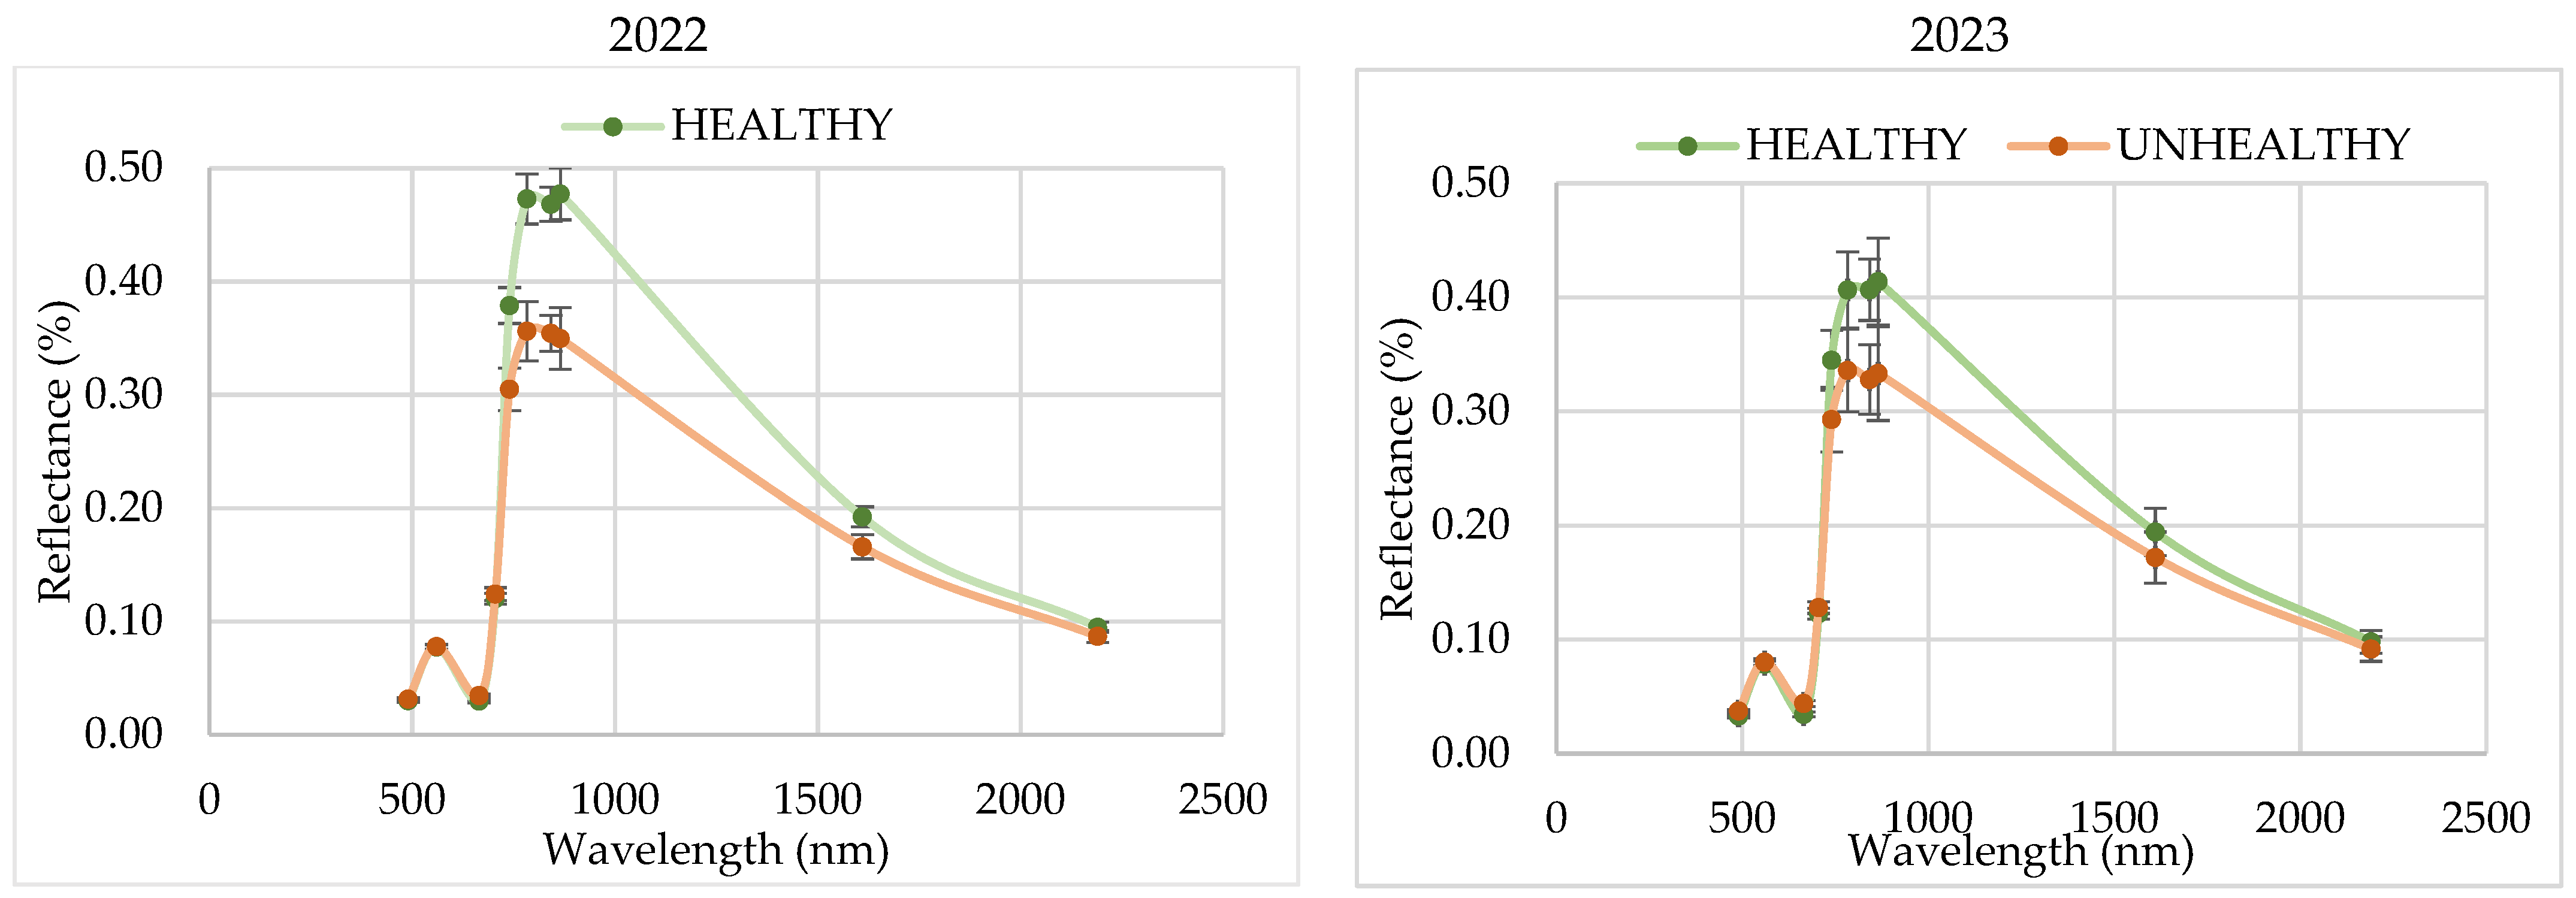
The spectral signature analysis at 45 DAS showed significant differences in reflectance in the visible (B4), infrared (B8), Red Edge (B6 and B7), and SWIR (B11) bands. The highlight of the results is the separation of the reflectance between blast-affected and unaffected fields, regardless of the year. Likewise, this separation can be evidenced with the RVI and IRECI vegetation indices, reaching a total variability close to 70% between the two factors considered in the statistical analysis (year and disease). These results in band reflectance coincide with those obtained by Zhang et al. [31] in the study of powdery mildew in wheat. In this study, higher values were recorded in the visible region and lower values in the NIR region in infested areas at the canopy level.

5. Conclusions

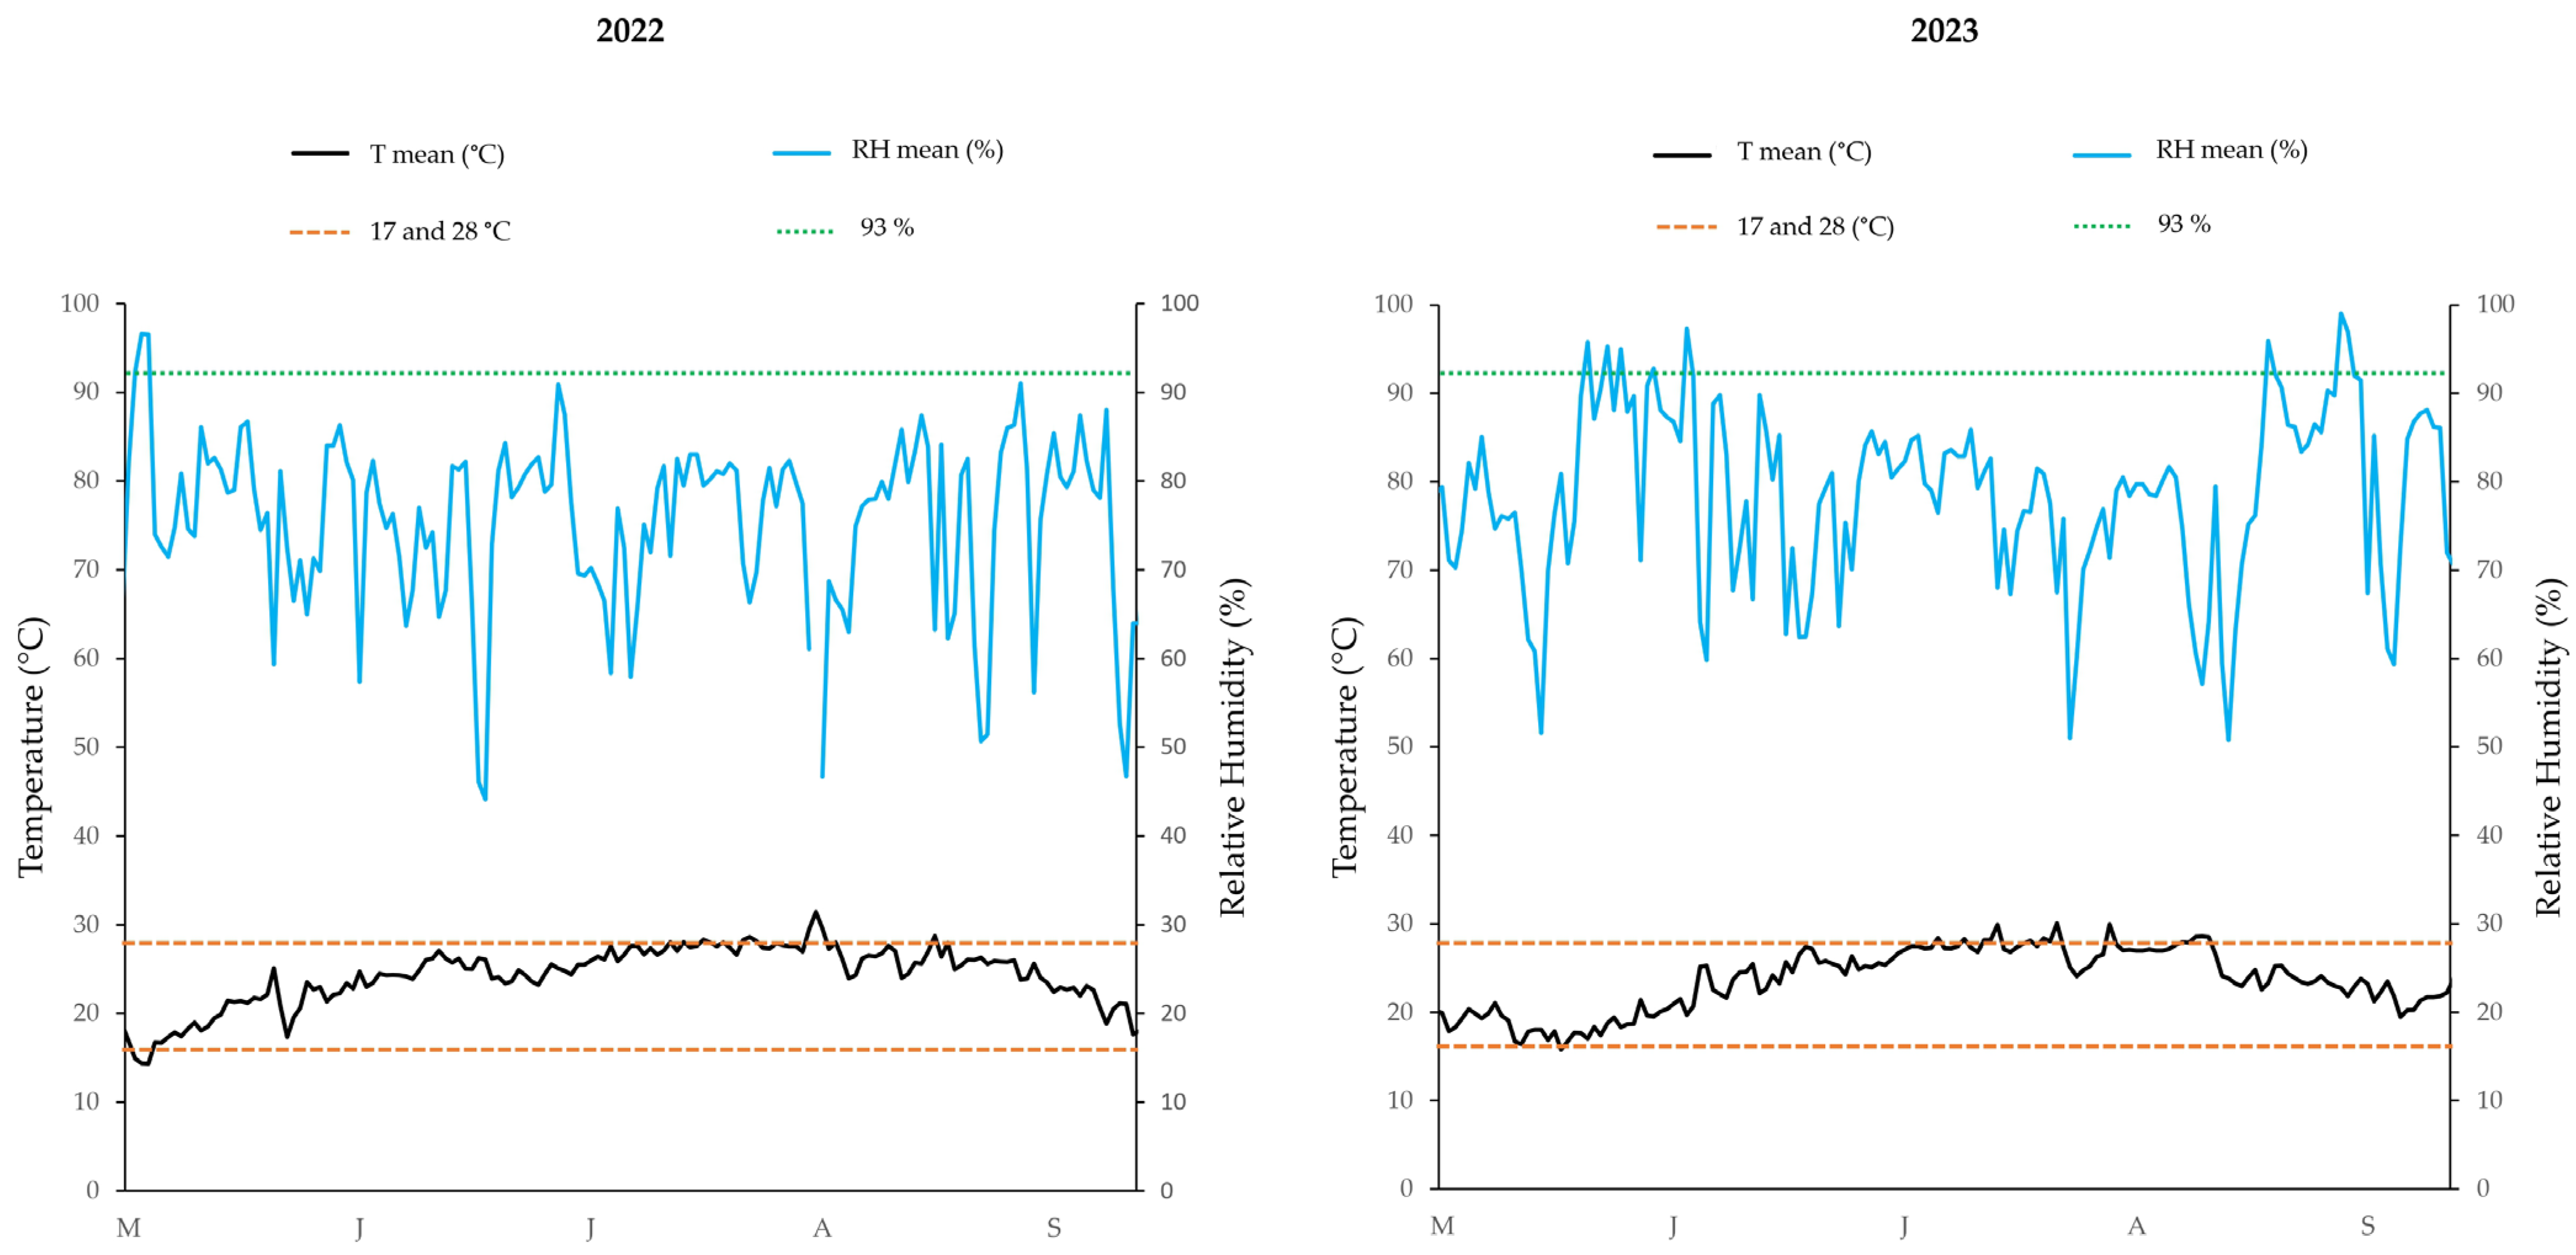
The results obtained in this study demonstrate the great usefulness of remote sensing and the data it provides for monitoring disease in rice crops. M. oryzae is a fungus that affects the crop worldwide and it is considered one of the major concerns affecting yield, however, other factors such as climatic factors greatly condition the crop.
From the study of VIs, the results obtained indicate that the NDVI, despite being the most commonly used VI for the study of development stages and crop biomass, is not a reliable indicator to distinguish affected plots by blast. The highlight of the observed results is that the spectral signature at 45 DAS showed significant differences in reflectance in the visible (B4), infrared (B8), Red Edge (B6 and B7), and SWIR (B11) bands between fields affected and non-affected by blast. Likewise, these differences are observed with the RVI and IRECI vegetation indices, reaching a total variability close to 70% between the two factors considered in the statistical analysis (year and disease). This is why the RVI and the IRECI are more reliable than the NDVI or the NDRE for the purpose of distinguishing plots affected by blast.
The early difference in the values of bands, indices, and spectral signatures between infected plots with respect to healthy ones constitutes a promising result in the agronomic management of rice crops to anticipate and solve the problem. Consequently, the proposed monitoring during rice cultivation could be regarded as a tool in IPM, with the objective of enhancing the effectiveness of fungicide treatments. This is because it is not dependent only on the active substances, but also on the timing of application, which conditions the development and progression of the infestation in rice cultivation. The analysis of reflectance bands and VIs should be studied in other areas and in additional plots, to carry out a more exhaustive study. Furthermore, it would be interesting to study the evolution of the fungus and the band values in smaller areas within the same plot in order to be able to compare smaller plots.

Author Contributions

Conceptualization, A.S.B., A.U. and C.R.; methodology, A.S.B., A.U., C.R. and A.A.-M.; software, A.A.-M., B.F., A.U., R.S. and C.R.; validation, A.S.B., A.A.-M., B.F., C.R. and A.U.; formal analysis, A.S.B., A.A.-M., A.U., R.S., B.F., C.D. and C.R.; investigation, A.S.B., A.A.-M., A.U., B.F., C.D. and C.R.; resources, A.S.B., B.F. and C.R.; data curation, A.S.B., A.A.-M., B.F., A.U., R.S., C.D. and C.R.; writing—original draft preparation, A.S.B., A.A.-M., A.U., R.S. and C.R.; writing—review and editing, A.S.B., A.A.-M., B.F., A.U., R.S., C.D. and C.R.; visualization, A.S.B., A.A.-M., B.F., A.U., C.D., R.S. and C.R.; supervision, A.S.B., A.A.-M., R.S., B.F., A.U., C.D. and C.R.; project administration, A.S.B.; funding acquisition, A.S.B., B.F. and C.R. All authors have read and agreed to the published version of the manuscript.

Funding

This research has been funded by the DETECTORYZA project INNEST/2022/227, INNEST/2022/319 and INNEST/2022/361 Regional Operational Programme, FEDER Comunitat Valenciana de la Innovació, Generalitat Valenciana.

Institutional Review Board Statement

Not applicable.

Data Availability Statement

Data are contained within the article.

Conflicts of Interest

The authors declare no conflicts of interest. The funders had no role in the design of the study; in the collection, analyses, or interpretation of data; in the writing of the manuscript; or in the decision to publish the results.

References

  1. Awika, J.M. Major cereal grains production and use around the world. In Advances in Cereal Science: Implications to Food Processing and Health Promotion; Awika, J.M., Piironen, V., Bean, S., Eds.; American Chemical Society: Washington, DC, USA, 2011; pp. 1–13. [Google Scholar]
  2. Farahzadi, F.; Ebrahimi, A.; Zarrinnia, V.; Azizinezhad, R. Evaluation of Genetic Diversity in Iranian Rice (Oryza sativa) Cultivars for Resistance to Blast Disease Using Microsatellite (SSR) Markers. Agric. Res. 2020, 9, 460–468. [Google Scholar] [CrossRef]
  3. FAOSTAT. 2022. Available online: https://www.fao.org/3/y4690s/y4690s05.htm#TopOfPage (accessed on 5 January 2024).
  4. Zahra, N.; Hafeez, M.B.; Nawaz, A.; Farooq, M. Rice production systems and grain quality. J. Cereal Sci. 2022, 105, 103463. [Google Scholar] [CrossRef]
  5. Ferrando, J.S.; Jambrino, B.D. El parc natural de l’Albufera. Un paisaje cultural cargado de historia. PH Bol. Inst. Andal. Patrim. Hist. 2014, 22, 54–77. [Google Scholar] [CrossRef]
  6. Ballesteros, R. El Departamento del Arroz del IVIA. Comunitat Valencia. Agrar. 2003, 21, 65–69. [Google Scholar]
  7. Chaiharn, M.; Chunhaleuchanon, S.; Lumyong, S. Screening siderophore producing bacteria as potential biological control agent for fungal rice pathogens in Thailand. World J. Microbiol. Biotechnol. 2009, 25, 1919–1928. [Google Scholar] [CrossRef]
  8. Feng, S.; Zhao, D.; Guan, Q.; Li, J.; Liu, Z.; Jin, Z.; Li, G.; Xu, T. A deep convolutional neural network-based wavelength selection method for spectral characteristics of rice blast disease. Comput. Electron. Agric. 2022, 199, 107199. [Google Scholar] [CrossRef]
  9. Suprapta, D.N. Potential of microbial antagonists as biocontrol agents against plant fungal pathogens. J. ISSAAS 2012, 18, 1–8. [Google Scholar]
  10. Couch, B.C.; Kohn, L.M.A. Multilocus gene genealogy concordant with host preference indicates segregation of a new species, Magnaporthe oryzae, from M. grisea. Mycologia 1985, 94, 683–693. [Google Scholar] [CrossRef] [PubMed]
  11. Chuwa, C.J.; Mabagala, R.B.; Reuben, M.S.O.W. Assessment of grain yield losses caused by rice blast disease in major rice growing areas in Tanzania. Int. J. Sci. Res. 2015, 4, 2211–2218. [Google Scholar]
  12. Asibi, A.E.; Chai, Q.; Coulter, J.A. Rice Blast: A Disease with Implications for Global Food Security. Agronomy 2019, 9, 451. [Google Scholar] [CrossRef]
  13. Teng, P.S.; Torres, C.Q.; Nuque, F.L.; Calvera, S.B. Current knowledge on crop losses in tropical rice. In Crop Loss Assessment in Rice; International Rice Research Institute: Los Banos, Phillipines, 1990; pp. 39–54. [Google Scholar]
  14. Pla, E.; Català, M.M.; Tomàs, N. Ficha Numero 9 La Pyriculariosis del Arroz. In Fichas Técnicas IRTA de las Mejores Prácticas de Cultivo del Arroz; IRTA Amposta: Amposta, Spain, 2020. [Google Scholar]
  15. Koutroubas, S.D.; Katsantonis, D.; Ntanos, D.A.; Lupotto, E. Blast disease influence on agronomic and quality traits of rice varieties under Mediterranean conditions. Turk. J. Agric. 2009, 33, 487–494. [Google Scholar] [CrossRef]
  16. Shamim, M.; Kumar, M.; Kumar, S.; Srivastava, D.; Ranjan, T.; Kesari, R.; Husain, R.; Kumar, V.; Abu Nayyer, M.; Jha, V.D. Economical and Environmental Impact of Rice Fungal Diseases on Global Food Security. In Fungal Diseases of Rice and Their Management; Srivastava, D., Shamim, M., Ahmad, M.M., Upadhyay, R.S., Eds.; Apple Academic Press: New York, NY, USA, 2024; Chapter 1. [Google Scholar]
  17. Kihoro, J.; Bosco, N.J.; Murage, H.; Ateka, E.; Makihara, D. Investigating the impact of rice blast disease on the livelihood of the local farmers in greater Mwea region of Kenya. Springer Plus 2013, 2, 308. [Google Scholar] [CrossRef] [PubMed]
  18. Barman, R.S.; Chattoo, B.B. Rice blast fungus sequenced. Curr. Sci. 2005, 89, 930–931. [Google Scholar]
  19. Skamnioti, P.; Gurr, S.J. Against the grain: Safeguarding rice from rice blast disease. Trends Biotechnol. 2009, 27, 141–150. [Google Scholar] [CrossRef] [PubMed]
  20. Kato, H. Rice blast disease. Pestic. Outlook 2001, 12, 23–25. [Google Scholar] [CrossRef]
  21. Fattahi, E.; Mousavi Moghadam, M.; Khanbabaei, R. The effect of fricyclazole on testosterone changes and testicular structure in mice. J. Babol. Univ. Med. Sci. 2015, 17, 43–49. [Google Scholar]
  22. Kesavachandran, C.N.; Fareed, M.; Pathak, M.K.; Bihari, V.; Mathur, N.; Srivastava, A.K. Adverse health effects of pesticides in agrarian populations of developing countries. In Reviews of Environmental Contamination and Toxicology; Whitacre, D.M., Ed.; Springer: New York, NY, USA, 2009; Volume 200, pp. 33–52. [Google Scholar]
  23. Mandal, N.; Das, D.K.; Sahoo, R.N.; Adak, S.; Kumar, A.; Viswanathan, C.; Mukherjee, J.; Rajashekara, H.; Ranjan, R.; Das, B. Assessing Rice Blast Disease Severity through Hyperspectral Remote Sensing. J. Agrometeorol. 2022, 24, 241–248. [Google Scholar] [CrossRef]
  24. Ranjan, R.; Chopra, U.K.; Sahoo, R.N.; Singh, A.K.; Pradhan, S. Assessment of plant nitrogen stress in wheat (Triticum aestivum L.) through hyperspectral indices. Int. J. Remote Sens. 2012, 33, 6342–6360. [Google Scholar] [CrossRef]
  25. Sahoo, R.N.; Ray, S.S.; Manjunath, K.R. Hyperspectral remote sensing of agriculture. Curr. Sci. 2015, 108, 848–859. [Google Scholar]
  26. Zhang, C.; Kovacs, J.M. The application of small unmanned aerial systems for precision agriculture: A review. Precis Agric. 2012, 13, 693–712. [Google Scholar] [CrossRef]
  27. Chuvieco, E. Teledetección Ambiental: La Observación de la Tierra Desde el Espacio; Ariel Ciencias: Barcelona, Spain; Editorial Ariel: Barcelona, Spain, 2010. [Google Scholar]
  28. Mahlein, A.K. Plant disease detection by imaging sensors–parallels and specific demands for precision agriculture and plant phenotyping. Plant Dis. 2016, 100, 241–251. [Google Scholar] [CrossRef] [PubMed]
  29. Nutter, F.W., Jr.; Guan, J.; Gotlieb, A.R.; Rhodes, L.H.; Grau, C.R.; Sulc, R.M. Quantifying alfalfa yield losses caused by foliar diseases in Iowa, Ohio, Wisconsin, and Vermont. Plant Dis. 2002, 86, 269–277. [Google Scholar] [CrossRef] [PubMed]
  30. Hatfield, J.L.; Gitelson, A.A.; Schepers, J.S.; Walthall, C.L. Application of Spectral Remote Sensing for Agronomic Decisions. Agron. J. 2008, 100, 117–131. [Google Scholar] [CrossRef]
  31. Zhang, J.; Huang, Y.; Pu, R.; González-Moreno, P.; Yuan, L.; Wu, K.; Huang, W. Monitoring plant diseases and pests through remote sensing technology: A review. Comput. Electron. Agric. 2019, 165, 104943. [Google Scholar] [CrossRef]
  32. San Bautista, A.; Fita, D.; Franch, B.; Castineira-Ibánez, S.; Arizo, P.; Sánchez-Torres, M.J.; Becker-Reshef, I.; Uris, A.; Rubio, C. Crop monitoring strategy based on remote sensing data (Sentinel-2 and Planet), Study case in a rice field after applying Glycinebetaine. Agronomy 2022, 12, 708. [Google Scholar] [CrossRef]
  33. Zheng, Q.; Huang, W.; Xia, Q.; Dong, Y.; Ye, H.; Jiang, H.; Chen, S.; Huang, S. Remote Sensing Monitoring of Rice Diseases and Pests from Different Data Sources: A Review. Agronomy 2023, 13, 1851. [Google Scholar] [CrossRef]
  34. Tian, L.; Wang, Z.; Xue, B.; Li, D.; Zheng, H.; Yao, X.; Zhu, Y.; Cao, W.; Cheng, T. A disease-specific spectral index tracks Magnaporthe oryzae infection in paddy rice from ground to space. Remote Sens. Environ. 2023, 285, 113384. [Google Scholar]
  35. Coops, N.; Stanford, M.; Old, K.; Dudzinski, M.; Culvenor, D.; Stone, C. Assessment of Dothistroma needle blight of Pinus radiata using airborne hyperspectral imagery. Phytopatholology 2003, 93, 1524–1532. [Google Scholar] [CrossRef] [PubMed]
  36. Apan, A.; Held, A.; Phinn, S.; Marley, J. Detecting sugarcane ‘orange rust’ disease using EO-1 Hyperion hyperspectral imagery. Int. J. Remote Sens. 2004, 25, 489–498. [Google Scholar] [CrossRef]
  37. Sankaran, S.; Ehsani, R.; Inch, S.A.; Ploetz, R.C. Evaluation of visible-near infrared reflectance spectra of avocado leaves as a non-destructive sensing tool for detection of laurel wilt. Plant Dis. 2012, 96, 1683–1689. [Google Scholar] [CrossRef]
  38. Moran, S.; Inoues, Y.; Barnes, E.M. Opportunities and limitation for image-based remote sensing in precision farming. Remote Sens. Environ. 1997, 61, 319–346. [Google Scholar] [CrossRef]
  39. Moshou, D.; Bravo, C.; Oberti, R.; West, J.; Bodria, L.; McCartney, A.; Ramon, H. Plant disease detection based on data fusion of hyper-spectral and multi-spectral fluorescence imaging using Kohonen maps. Real-Time Imaging 2005, 11, 75–83. [Google Scholar] [CrossRef]
  40. Jensen, J.R. Remote Sensing of the Environment: An Earth Resources Perspective, 2nd ed.; Pearson Education, Inc.: Saddle River, NJ, USA, 2007; pp. 12–56. [Google Scholar]
  41. Frampton, W.J.; Dash, J.; Watmough, G.; Milton, E.J. Evaluating the capabilities of Sentinel-2 for quantitative estimation of biophysical variables in vegetation. ISPRS J. Photogram. 2013, 82, 83–92. [Google Scholar] [CrossRef]
  42. Graeff, S.; Link, J.; Claupein, W. Identification of powdery mildew (Erysiphe graminis sp. tritici) and takeall disease (Gaeumannomyces graminis sp. tritici) in wheat (Triticum aestivum L.) by means of leaf reflectance measurements. Open Life Sci. 2006, 1, 275–288. [Google Scholar] [CrossRef]
  43. Costa, G.; Noferini, M.; Fiori, G.; Spinelli, F. Innovative application of non-destructive techniques for fruit quality and disease diagnosis. Acta Hortic. 2007, 753, 275. [Google Scholar] [CrossRef]
  44. Wang, X.; Zhang, M.; Zhu, J.; Geng, S. Spectral prediction of Phytophthora infestans infection on tomatoes using artificial neural network (ANN). Int. J. Remote Sens. 2008, 29, 1693–1706. [Google Scholar] [CrossRef]
  45. Naidu, R.A.; Perry, E.M.; Pierce, F.J.; Mekuria, T. The potential of spectral reflectance technique for the detection of Grapevine leafroll-associated virus-3 in two red-berried wine grape cultivars. Comput Electron Agric. 2009, 66, 38–45. [Google Scholar] [CrossRef]
  46. Elías Castillo, F.; Ruiz Beltrán, L. Agroclimatología de España; INIA: Cuaderno, Spain, 1997; p. 7. [Google Scholar]
  47. Montes Delgado, F. Caracterización Agronómica y Monitoreo de la Pyriculariosis de una Selección de Variedades de arroz. Apoyo para el aviso y Control en el Cultivo bajo Producción Integrada en el sur de España. Ph.D. Thesis, Universidad de Sevilla, Seville, Spain, 8 March 2016. [Google Scholar]
  48. Ribo, M.; Albiach, R.; Pomares, F.; Canet, R. Alternativas de Gestión de la Paja de Arroz en la Albufera de Valencia; Nota Técnica; IVIA: Valencia, Spain, 2017; pp. 1–9. [Google Scholar]
  49. Ayers, R.S.; Westcot, D.W. Water Quality for Agriculture; Food and Agriculture Organization of the United Nations: Rome, Italy, 1985; p. 174. [Google Scholar]
  50. Lancashire, P.D.; Bleiholder, H.; Boom, T.V.D.; Langelüddeke, P.; Stauss, R.; Weber, E.; Witzenberger, A. A uniform decimal code for growth stages of crops and weeds. Ann. Appl. Biol. 1991, 119, 561–601. [Google Scholar] [CrossRef]
  51. Osca Lluch, J.M. Cultivos Herbáceos Extensivos: Cereales; Editorial de la Universidad Politécnica de València: Valencia, Spain, 2013. [Google Scholar]
  52. SES; IRRI. Standard Evaluation System for Rice; International Rice Research Institute: Los Banos, Philippines, 2013. [Google Scholar]
  53. Sentinel-2—Missions—Sentinel Online. Available online: https://sentinels.copernicus.eu/web/sentinel/missions/sentinel-2 (accessed on 12 January 2023).
  54. Rouse, J.W.; Hasas, R.H.; Schell, J.A.; Deerino, D.W.; Harlan, J.C. Monitoring the Vernal Advancement of Retrogradation of Natural Vegetation. Type III. Final Report; NASA/OSFC: Oreenbello, MD, USA, 1974; p. 371.
  55. Pearson, R.L.; Miller, L.D. Remote mapping of standing crop biomass for estimating the productivity of the short grass prairie. In Proceedings of the 8th International Symposium on Remote Sensing of Environment (ERIM), Ann Arbor, MI, USA, 2–6 October 1972; pp. 1357–1381. [Google Scholar]
  56. Barnes, E.M.; Clarke, T.R.; Richards, S.E.; Colaizzi, P.D.; Haberland, J.; Kostrzewski, M.; Waller, P.; Choi, C.; Riley, E.; Thompson, T.; et al. Coincident detection of crop water stress, nitrogen status and canopy density using ground based multispectral data. In Proceedings of the 5th International Conference on Precision Agriculture, Bloomington, MN, USA, 16–19 July 2000; pp. 1–15. [Google Scholar]
  57. Guyot, G.; Baret, F. Utilisation de la haute resolution spectrale pour suivre l’etat des couverts vegetaux. In Proceedings of the 4th International Colloquium on Spectral Signatures of Objects in Remote Sensing, Aussios, France, 18–22 January 1988; pp. 279–286. [Google Scholar]
  58. Matlab, version 7.10.0 (R2022b); The MathWorks Inc.: Natick, MA, USA, 2022.
  59. Gorelick, N.; Hancher, M.; Dixon, M.; Ilyushchenko, S.; Thau, D.; Moore, R. Google Earth Engine: Planetary-scale geospatial analysis for everyone. Remote Sens. Environ. 2017, 202, 18–27. [Google Scholar] [CrossRef]
  60. Welcome to the QGIS Project! Available online: https://www.qgis.org/en/site/ (accessed on 14 January 2023).
  61. Calvao, T.; Palmeirim, J.M. Mapping Mediterranean scrub with satellite imagery: Biomass estimation and spectral behaviour. Int. J. Remote Sens. 2004, 25, 3113–3126. [Google Scholar] [CrossRef]
  62. Prabhakar, M.; Prasad, Y.G.; Thirupathi, M.; Sreedevi, G.; Dharajothi, B.; Venkateswarlu, B. Use of ground based hyperspectral remote sensing for detection of stress in cotton caused by leafhopper (Hemiptera: Cicadellidae). Comput. Electron. Agric. 2011, 79, 189–198. [Google Scholar] [CrossRef]
  63. Garcia-Ruiz, F.; Sankaran, S.; Maja, J.M.; Lee, W.S.; Rasmussen, J.; Ehsani, R. Comparison of two aerial imaging platforms for identification of Huanglongbing-infected citrus trees. Comput. Electron. Agric. 2013, 91, 106–115. [Google Scholar] [CrossRef]
  64. Tucker, C.J. Red and Photographic Infrared Linear Combinations for Monitoring Vegetation. Remote Sens. Environ. 1979, 8, 127–150. [Google Scholar] [CrossRef]
  65. Yoder, B.J.; Waring, R.H. The Normalized Difference Vegetation Index of Small Douglas-Fir Canopies with Varying Chlorophyll Concentrations. Remote Sens. Environ. 1994, 49, 81–91. [Google Scholar] [CrossRef]
  66. Xue, J.; Su, B. Significant remote sensing vegetation indices: A review of developments and applications. J. Sens. 2017, 1353691. [Google Scholar] [CrossRef]
  67. Jordan, C.F. Derivation of Leaf Area Index from Quality of Light on the Forest Floor. Ecology 1969, 50, 663–666. [Google Scholar] [CrossRef]
  68. Mercier, A.; Betbeder, J.; Rumiano, F.; Baudry, J.; Gond, V.; Blanc, L.; Bourgoin, C.; Cornu, G.; Ciudad, C.; Marchamalo, M.; et al. Evaluation of Sentinel-1 and 2 Time Series for Land Cover Classification of Forest–Agriculture Mosaics in Temperate and Tropical Landscapes. Remote Sens. 2019, 11, 979. [Google Scholar] [CrossRef]
  69. Wallace, J.F.; Caccetta, P.A.; Kiiveri, H.T. Recent developments in analysis of spatial and temporal data for landscape qualities and monitoring. Austral. Ecol. 2004, 29, 100–107. [Google Scholar] [CrossRef]
Figure 1. Location of the experiment and the study area. (a) Location of Valencia in Comunitat Valenciana, Spain. (b) Location of Albufera in the area of Valencia.
Agriculture 14 01385 g001
Figure 2. Mean daily temperature (T mean) and humidity (HR meand) from March to September in the experimental area for 2022 and 2023 and optimal conditions for the development of rice blast.
Agriculture 14 01385 g002
Figure 3. Phenological cycle of the Bomba variety rice crop in days after sowing.
Agriculture 14 01385 g003
Figure 4. Study plots of the 2022 and 2023 seasons (red) situated at the studied area (yellow).
Agriculture 14 01385 g004
Figure 5. Evolution of healthy and unhealthy plots in the 10 m spectral resolution bands: B4 (A) and B8-NIR (B) in days after sowing (DAS). Vertical bars indicate standard error interval.
Agriculture 14 01385 g005
Figure 6. Evolution of B4 band of healthy and unhealthy fields over the course of a season.
Agriculture 14 01385 g006
Figure 7. Evolution of the healthy and unhealthy plots in the 20 m spectral resolution bands: B6 (A) and B7 (B) in days after sowing (DAS). The vertical bars indicate standard error interval.
Agriculture 14 01385 g007
Figure 8. Evolution of the VI NDVI (A), RVI (B), NDRE (C), and IRECI (D) of the healthy and unhealthy plots in DAS of the 2022 and 2023 seasons. Vertical bars indicate the standard error interval.
Agriculture 14 01385 g008
Figure 9. Evolution of RVI index over the course of a season for healthy and unhealthy fields.
Agriculture 14 01385 g009
Figure 10. Spectral signature at 45 DAS during the 2022 and 2023 seasons.
Agriculture 14 01385 g010
Table 1. Average values of maximum daily temperature (T max), mean daily temperature (T mean), and minimum daily temperature (T min); maximum daily relative humidity (RH max), mean daily relative humidity (RH mean), and minimum daily relative humidity (RH min); and maximum daily rainfall (Rainfall max), mean daily rainfall (Rainfall mean), and minimum daily rainfall (Rainfall min) for the years 2022 and 2023.
Years of the Study
Climatic Variable20222023
T mean (°C)18.0218.21
T max (°C)24.0224.48
T min (°C)13.1512.62
RH mean (%)77.5873.63
RH max (%)97.3395.24
RH min (%)49.7945.04
Rainfall mean (mm)64.2827.32
Rainfall max (mm)354.75135.87
Rainfall min (mm)1.220.41
Table 2. Total plots, areas, and dates of sowing and harvest for 2022 and 2023.
Year20222023Total
Number of plots211637
Area (m2)777,000525,0001,292,000
Sowing8 June9 May-
Harvest27 Septemeber28 August-
Table 3. Evaluating dates of the pest infestation.
DASDates
309 July 2022
9 June 2023
4524 July 2022
24 June 2023
608 August 2022
9 July 2023
907 September 2022
8 August 2023
Table 4. Dates of Sentinel-2 cloud-free images for the 2022 and 2023 seasons.
20222023
DASDateDASDate
309 July309 June
3514 July3514 June
4019 July4524 June
4524 July554 July
553 August609 July
608 August6514 July
7018 August8029 July
7523 August9513 August
852 September10018 August
907 September10523 August
11027 September11028 August
Table 5. Vegetative indices and equations used for the analysis of the evolution of the rice cycle.
IndexEquationReference
NDVI: Normalized Difference Vegetation Index B 8 B 4 B 8 + B 4 [54]
RVI: Ratio Vegetation Index B 8 B 4 [55]
NDRE: Normalized Difference Red Edge Index B 7 B 4 B 7 + B 4 [56]
IRECI: Inverted Red-Edge Chlorophyll Index B 7 B 4 B 5 B 6 [57]
Table 6. Number of healthy and unhealthy plots and areas under cultivation for the years 2022 and 2023.
20222023
HealthyUnhealthyHealthyUnhealthy
Plots number111097
Area (m2)374,000403,000287,000238,000
Table 7. Mean reflectance values in bands B2, B3, B4, B5, B6, B7, B8, B8A, B11, and B12 at 45 DAS, and analysis of variance. Significance level: ** p ≤ 0.01, * p < 0.05 and ns not significant. Mean ± SE followed by different letters are statistically different at p < 0.05 (LSD test).
FactorB2B3B4B5B6B7B8B8AB11B12
Year
2022307.74 b775.77321.41 b1221.263419.504145.94 b4113.98 b4135.741790.74908.64
2023351.51 a793.54391.90 a1253.743188.513711.57 a3672.64 a3735.201830.86948.35
Disease
Healthy314.36 b778.43320.52 b1213.933618.50 a4397.21 b4374.23 b4455.93 b1933.02 a964.07
Unhealthy343.89 a790.88392.79 a1261.072989.56 b3460.30 a3411.39 a3415.02 a1688.61 b892.92
ANOVA
Factor
Year (Y)38.12 **3.5133.32 **4.185.629.54 *10.32 **6.840.502.36
Disease (D)16.58 **1.7235.02 **8.8041.68 **44.37 **49.33 **46.23 **18.64 *7.59
Y × D4.050.423.570.151.272.721.652.380.130.10
Table 8. Mean reflectance values in NDVI, RVI, NDRE, and IRECI at 45 DAS, and analysis of variance. Significance level: * p ≤ 0.05 and ns not significant. Mean ± SE followed by different letters are statistically different at p ≤ 0.05 (LSD test).
FactorNDVIRVINDREIRECI
Year
20220.85 a13.27 a0.85 a10,965.20 a
20230.80 b9.78 b0.80 b8694.37 b
Disease
Healthy0.86 a14.08 a0.86 a12,317.70 a
Unhealthy0.79 b8.97 b0.79 b7341.83 b
ANOVA
Factor
Year (Y)24.00 *23.38 *20.02 *10.73 *
Disease (D)48.72 *50.39 *46.78 *51.51 *
Y × D1.340.540.7932.13
Disclaimer/Publisher’s Note: The statements, opinions and data contained in all publications are solely those of the individual author(s) and contributor(s) and not of MDPI and/or the editor(s). MDPI and/or the editor(s) disclaim responsibility for any injury to people or property resulting from any ideas, methods, instructions or products referred to in the content.

