Article

Effects of Catch Crops Cultivated for Green Manure on Soil C and N Content and Associated Enzyme Activities

by
Anna Piotrowska-Długosz
1 and
Edward Wilczewski
2,*
1
Department of Biogeochemistry and Soil Science, Faculty of Agriculture and Biotechnology, Bydgoszcz University of Science and Technology, Bernardyńska 6, 85-029 Bydgoszcz, Poland
2
Department of Agronomy, Faculty of Agriculture and Biotechnology, Bydgoszcz University of Science and Technology, 7 Prof. S. Kaliskiego St., 85-796 Bydgoszcz, Poland
*
Author to whom correspondence should be addressed.
Agriculture 2024, 14(6), 898; https://doi.org/10.3390/agriculture14060898
Submission received: 9 May 2024 / Revised: 29 May 2024 / Accepted: 4 June 2024 / Published: 6 June 2024
(This article belongs to the Section Agricultural Soils)

Abstract

:
The influence of catch crop (field pea) management and the time of its application [plots with autumn (A.I.) or spring (S.I.) biomass incorporation vs. treatments without catch crop (C) use] on the activity of five soil enzymes associated with C- (CMC-cellulase—CEL, β-glucosidase—βG, invertase—INV) and N-cycling (urease—UR, nitrate reductase—NR), the content of mineral N, and the content of microbial biomass C and N (MBC, MBN) were evaluated in a 3-year experiment (2009–2011). Field pea was sown in the first half of August and the biomass was incorporated into the soil in the second half of October in 2008, 2009, and 2010 or left as a mulch during the winter and mixed with the soil in spring. The enzymatic and microbial properties were determined in soil samples collected from spring barley experimental plots four times a year (2009, 2010, and 2011): in March (before sowing of barley), in May (during the tillering phase), in June (during the shooting phase), and in August (after barley harvesting). Neither the catch crop management nor the sampling date had any effect on the content of total organic carbon (CORG) or total nitrogen (Nt). The incorporation of filed pea biomass significantly enhanced the soil mineral N content (up to 30%), as well as the microbial and enzymatic variables, compared to the control soil. The spring use of field pea biomass significantly increased the content of microbial biomass C (2009 and 2011) in contrast to autumn incorporation. On the other hand, the biomass-N and the activity of the studied enzymes did not reveal statistically significant changes (or the results were inconsistent) as regards the time of catch crop biomass incorporation. The assessed variables (except for CORG, Nt, microbial biomass N) showed significant seasonal variability, but the changes were not clear or associated with a specific property. However, we found one similarity; the majority of the determined variables were the highest in May and/or June. Our data confirmed that catch crops play a key function in the management of agroecosystems. Plant biomass incorporated into soil is a source of organic matter, which increases nutrient concentrations and enhances soil biological activity. Because the time of catch crop application did not reveal consistent changes in the studied properties, both spring and autumn applications can be recommended as a suitable practice in modern agriculture.

1. Introduction

Green manures are an important source of organic matter for the soil and a factor shaping its biological activity [1,2]. Their importance in regions with low farm animal numbers and, as a result, a shortage of manure is crucial for maintaining soil fertility. In many regions of the world, soils are characterized by a low organic matter content [3]. As the share of plant products in human nutrition increases, we can expect a decrease in the stocking rate of farm animals and thus a deepening deficit of organic matter in agricultural soils. Green manures can be an important element in maintaining soil fertility, which will become more and more important in the coming years.
The cultivation of catch crops in arable soils improves soil quality through incorporation of their residues into the soil. Decomposition of fresh organic materials recently incorporated into the soil provides a carbon and nitrogen source to the soil, which is crucial for enriching soil with organic matter and therefore for improving soil quality and fertility [4]. Catch cropping has shown beneficial effects for soil microbial communities and thus revealed a great impact on the functioning of soil systems through the activity of the enzymes they release. This enzymatic activity is engaged in many chemical reactions associated with the early decomposition of litter and soil organic matter transformation, as well as the cycling of nutrients before they are assimilated by soil microbial populations [5,6].
Particular attention in the field of soil enzymology has been given to the C- and N-cycle enzymes that drive the transformation of C and N substrates and provide nutrients to soil microbes and plants [7]. The complex of cellulolytic enzymes, e.g., cellulases and β-glucosidase, is associated with the breakdown of the most abundant plant polysaccharide such as cellulose, resulting in the release of glucose, which can be readily utilized by soil microbial communities as a main carbon source [8]. Soil invertase activity is in turn associated with sucrose hydrolysis (into glucose and fructose), which is the most common soluble disaccharide in plants [9]. Along with cellulases, sucrose activity contributes notably to the decomposition of plant residues in the soil [10]. Particular interest has also been paid to enzyme activities associated with transformations of N-containing compounds such as urease (significance in ammonium formation), proteases (related to the hydrolysis of proteins), nitrate reductase (denitrification process), and nitrogenase (N fixation) [11,12,13]. Thus, determination of enzymatic activity can help to evaluate the rate of biochemical processes of C and N cycling in arable soils as affected by different management practices such as crop rotation, fertilization, tillage, and catch crop application, and they are therefore recognized as a timely and easily implemented index of any changes within the soil system [14]. From the agricultural perspective, enzymes that respond clearly to soil management practices are of special importance [15,16]. They often respond faster to soil agricultural practices than other soil quality indicators such as physical and chemical attributes [17].
The effectiveness of catch crop use depends, among other things, on the incorporation time of plant biomass. Previously, authors have compared the effect of catch crops (ryegrass, fields pea), applied either in the autumn or the spring, to find the most suitable time of plant residue application [18,19]. Mulching is one of the agriculture practices important for sustainable crop cultivation, not only for protecting soil against erosion and minimizing changes in soil moisture and temperature, but also for gradient decomposition of soil organic materials [20]. Winter catch cropping is also important, since plant biomass is a crucial source of organic C for soil microorganisms, which have the ability to immobilize the most important nutrients like P and N, thereby reducing their loss [21]. Nitrogen that is kept in catch crop residues (ryegrass, chicory, mixtures of ryegrass and chicory, white clover, mixtures of ryegrass and various clover species) is further available for the succeeding plants after decomposition of the plant biomass [22]. In an earlier study conducted by Piotrowska-Długosz and Wilczewski [19], most of the determined properties of Luvisol revealed an ambiguous response as regards the effect of the application time of field pea cultivated as a catch crop. Thus, the authors recommended both spring and autumn incorporations of the catch crop as a suitable management practice to ameliorate the conditions of soil features during the course of the growth of the subsequently cultivated plant.
In the last decade, both the long-term benefits and short-term advantages of catch crop application (e.g., rye, legume–rye mixture, ryegrass, chicory, winter rye, summer sorghum) have been studied [22,23,24,25,26]. Therefore, the present study did not consider the cumulative multi-year impact, but assessed the effect of one-year impact, typical in agricultural practice, whereas subsequent years were only repetitions. We hypothesized that (1) the microbial biomass C and N, mineral N forms, and the activities of C and N cycle enzymes would be significantly enhanced by catch crop application (Pisum sativum L.) as compared to the control; (2) the catch crop management (time of application of the catch crop biomass) would modify the status of the studied properties; (3) we anticipated that spring use of field pea biomass would reveal a stronger impact on most soil properties than autumn application. In view of the above, the goal of this contribution was to evaluate the content of microbial biomass C (MBC) and N (MBN), the concentration of ammonium and nitrate N, as well as the activity of certain enzymes associated with C- and N cycling that would be affected by catch crop management versus control objects (plots without field pea application).

2. Materials and Methods

2.1. Field Experiment Description

Field studies and laboratory analysis were conducted between 2008 and 2011 in the area of Szadłowice (52°50′ N, 18°20′ E), in typical Phaeozem formed of sandy loam [27]. In the following years, field experiments were carried out in a randomized block design, with four repetitions. Cv ‘Wiato’ (Poznańska Hodowla Roślin sp. Z o.o., Tulce, Poland) field pea was sown as a summer catch crop, after winter wheat harvest, in 8 plots with an area of 250 m2 each. In addition, 4 plots with the same area were created and left unsown, as a control. To avoid deterioration of phytosanitary conditions, the field experiment was carried out in different parts of the field in particular years. After harvesting the wheat, tillage consisted of plowing to a depth of approx. 15 cm and leveling and compacting the soil, performed with an aggregate consisting of a cultivator and a crushing roller. Pea seeds were sown in the first half of August at an amount of 150 kg ha−1. No fertilization or pesticides were used in the cultivation of the catch crops. In the second half of October, after the pea vegetation had ended, the biomass in four plots with the catch crop was shredded and plowed to a depth of approx. 27 cm, and the other four plots were left uncut. The plants were damaged by frost in December and the soil was covered with mulch biomass through the winter. In these plots, the catch crop biomass was mixed with the soil in the spring of the following year using a disc harrow. In the spring of subsequent years (2009–2011), spring barley was sown on plots with catch crops (both plowed in autumn and mixed with the soil in spring) and on control plots (without catch crops) as a plant testing for the effect of the catch crops. The results regarding the impact of catch crops on the physical properties of the soil and barley yield are presented in the paper by Wilczewski et al. [28].

2.2. Soil Sampling and Sample Preparation

In order to evaluate the total organic carbon (CORG) and total nitrogen (Nt), we collected soil samples twice a year in 2009, 2010, and 2011: in March (before the sowing of spring barley) and in August (after the harvest of spring barley). Soil samples for determination of mineral N content, microbial biomass content, and enzymatic activity were taken four times a year. The seasonal variations in these properties were assessed during the growth period of spring barley: in March—before sowing, in May—during the tillering phase, in June—during the shooting phase, and in August—after the harvest. Soil samples were collected from the uppermost 30 cm soil of each plot. Ten samples were collected from each plot and mixed together to obtain one complex sample per plot. Further, each soil sample was split into two subsamples. One was refrigerated (4 °C) for immediate determination of mineral N, as well as microbial and enzymatic variables. Another subsample was dried at room temperature and sieved (<2 mm) prior to the analysis of total organic carbon content and total N.

2.3. Soil Carbon and Nitrogen Content

The content of Nt was quantified by the Kjeldahl protocol [29], while the CORG content was estimated based on the dichromate oxidation procedure [30].
The amount of microbial biomass C and N was evaluated using the chloroform fumigation–extraction methodology, as proposed by Vance et al. [31]. Soil samples (25 g oven-dry) were adjusted to 50% of their water-holding capacity (WHC) and fumigated with ethanol-free chloroform at 25 °C for 24 h. After removing the residual chloroform, both the fumigated and control samples were extracted using 0.5 M of K2SO4, and the concentration of soluble C and total N was assessed according to Vance et al. [31] and Bremner and Mulvaney [29], respectively. To calculate any incomplete recoveries of MBC and MBN content, the difference between the fumigated and control soils was divided using correction factors of 0.38 (kEC) and 0.54 (kEN), respectively [31,32].
Field-moist soil samples were extracted with KCl to determine ammonium-N and with K2SO4 to assess the nitrate-N concentration. The N-NH4+ concentration was evaluated according to an indophenol blue method, which consisted in the formation of indophenol blue complex during the reaction of ammonia with phenol and hypochlorite. The N-NO3 concentration was in turn quantified based on the phenoldisulphonic acid method [33].

2.4. Determination of Enzymatic Activity and Soil Respiration

The assessment of enzyme activities consisted in the spectrophotometric measurement of the product that was released by the enzyme during the incubation of the samples with a suitable substrate under standard reaction conditions. The absorbance was measured using a spectrophotometer UV Vis Evolution 220 (Thermo Scientific, Waltham, MA, USA) with a cuvette of 10 mm. The activity of all enzymes was evaluated on 1 g of fresh, moist, and sieved (<2 mm) soil and evaluated on the basis of dry soil (105 °C).
The β-glucosidase (βG) activity was estimated using the method proposed by Eivazi and Tabatabai [34], which refers to the release of p-nitrophenol, which is the end product of the reaction, following the incubation of soil samples with substrate (1 mL of 25 mM p-nitrophenyl-β-D-glucopyranoside) and 4 mL of TRIS buffer (pH 6.0) within 60 min at 37 °C. The reaction was terminated by the addition of 4 mL of Tris/NaOH buffer (100 mM, pH 12.0) and 1 mL of 0.5 M CaCl2. Finally, the reaction mixture was centrifuged and absorbance was measured at 400 nm.
The activity of endo-cellulase (EC 3.2.1.4) and invertase (EC 3.2.1.26) was assayed based on reducing sugars as the end product [35]. The soil samples were incubated for 24 h (for endo-cellulase) and 3 h (for invertase) at 50 °C with the acetate buffer (2 M, pH 5.5) and substrate (0.7% carboxymethyl cellulose sodium salt for endo-cellulase and 10% sucrose for invertase). The concentration of reducing sugars (glucose and the mixture of glucose and fructose) released during the incubation time was evaluated by use of the Prussian blue method, based on the development of Prussian blue (ferric ferrocyanide) produced as a result of the reduction in ferricyanide ions in an alkaline environment, and absorbance was measured at 690 nm.
For determination of the soil urease activity (UR), we used the method elaborated by Kandeler and Gerber [36]. This method consists in incubation of soil samples with borate buffer (pH 10.0) and urea solution (as substrate) at 37 °C for 2 h. After this time, all samples were treated with 1 M KCl and left at room temperature for 0.5 h. To evaluate the concentration of ammonium, we mixed the filtrate with water, sodium salicylate, and sodium dichloroisocyanide. The mixture was left for 30 min and the absorbance was determined at 690 nm.
Soil nitrate reductase activity (NR) was evaluated as described in Kandeler [37]. Incubation of soil samples with a 2,4 DNP (dinitrophenol) and substrate (25 mM KNO3) was performed under waterlogged conditions for 24 h at 25 °C. After incubation, all samples were treated with a 4 M KCl, well mixed, and filtered directly. To assess the nitrite ion concentration, filtrate, NH4Cl buffer (pH 8.5), and a color reagent prepared with sulfanilamide, N-(1-naphthyl)-ethylenediamine hydrochloride and concentrated phosphoric acid were added to all samples and mixed thoroughly. Finally, the absorbance was assessed at 520 nm.
The measurement of soil respiration in a laboratory was carried out for 3 days (72 h) according a modified version of the method of Isermeyer [38]. A moist soil sample (25 g, 60% of WHC) was weighed in a small beaker and inserted into a 1.5 L laboratory glass bottle. A second beaker with 20 mL 0.05 M NaOH and the another one with 20 mL of distilled water were also put in the bottle. Controls samples (5 replications) were prepared with sodium hydroxide but without soil. The produced CO2 was adsorbed in 0.05 M sodium hydroxide, and the remaining NaOH was titrated with 0.05 M HCl. Prior to titration, 1 mL of 0.5 M BaCl2 was added to precipitate the adsorbed CO2 as barium carbonate. The titration was performed after 72 h of incubation. The soil respiration was quantified as the amount of CO2 released from the soil.

2.5. Statistical Analysis

All results were subjected to statistical analysis using Statistica 13.1 for Windows 10 software. A two-way analysis of variance (ANOVA) was conducted to evaluate the impact of catch crop management (autumn use, spring application, and control without a catch crop) and the date of sampling (seasonal variability) on the variables determined. If we found a significant F-test, differences between the group means were calculated with a Tukey test (p < 0.05). Simple and multiple regressions were carried out to show the relationships among the properties studied. The differences between the soil samples were analyzed using principal component analysis (PCA) based on the mean data values of all studied properties. The first two principal components (PC1 and PC2) were selected for the ordination of the cases.

3. Results

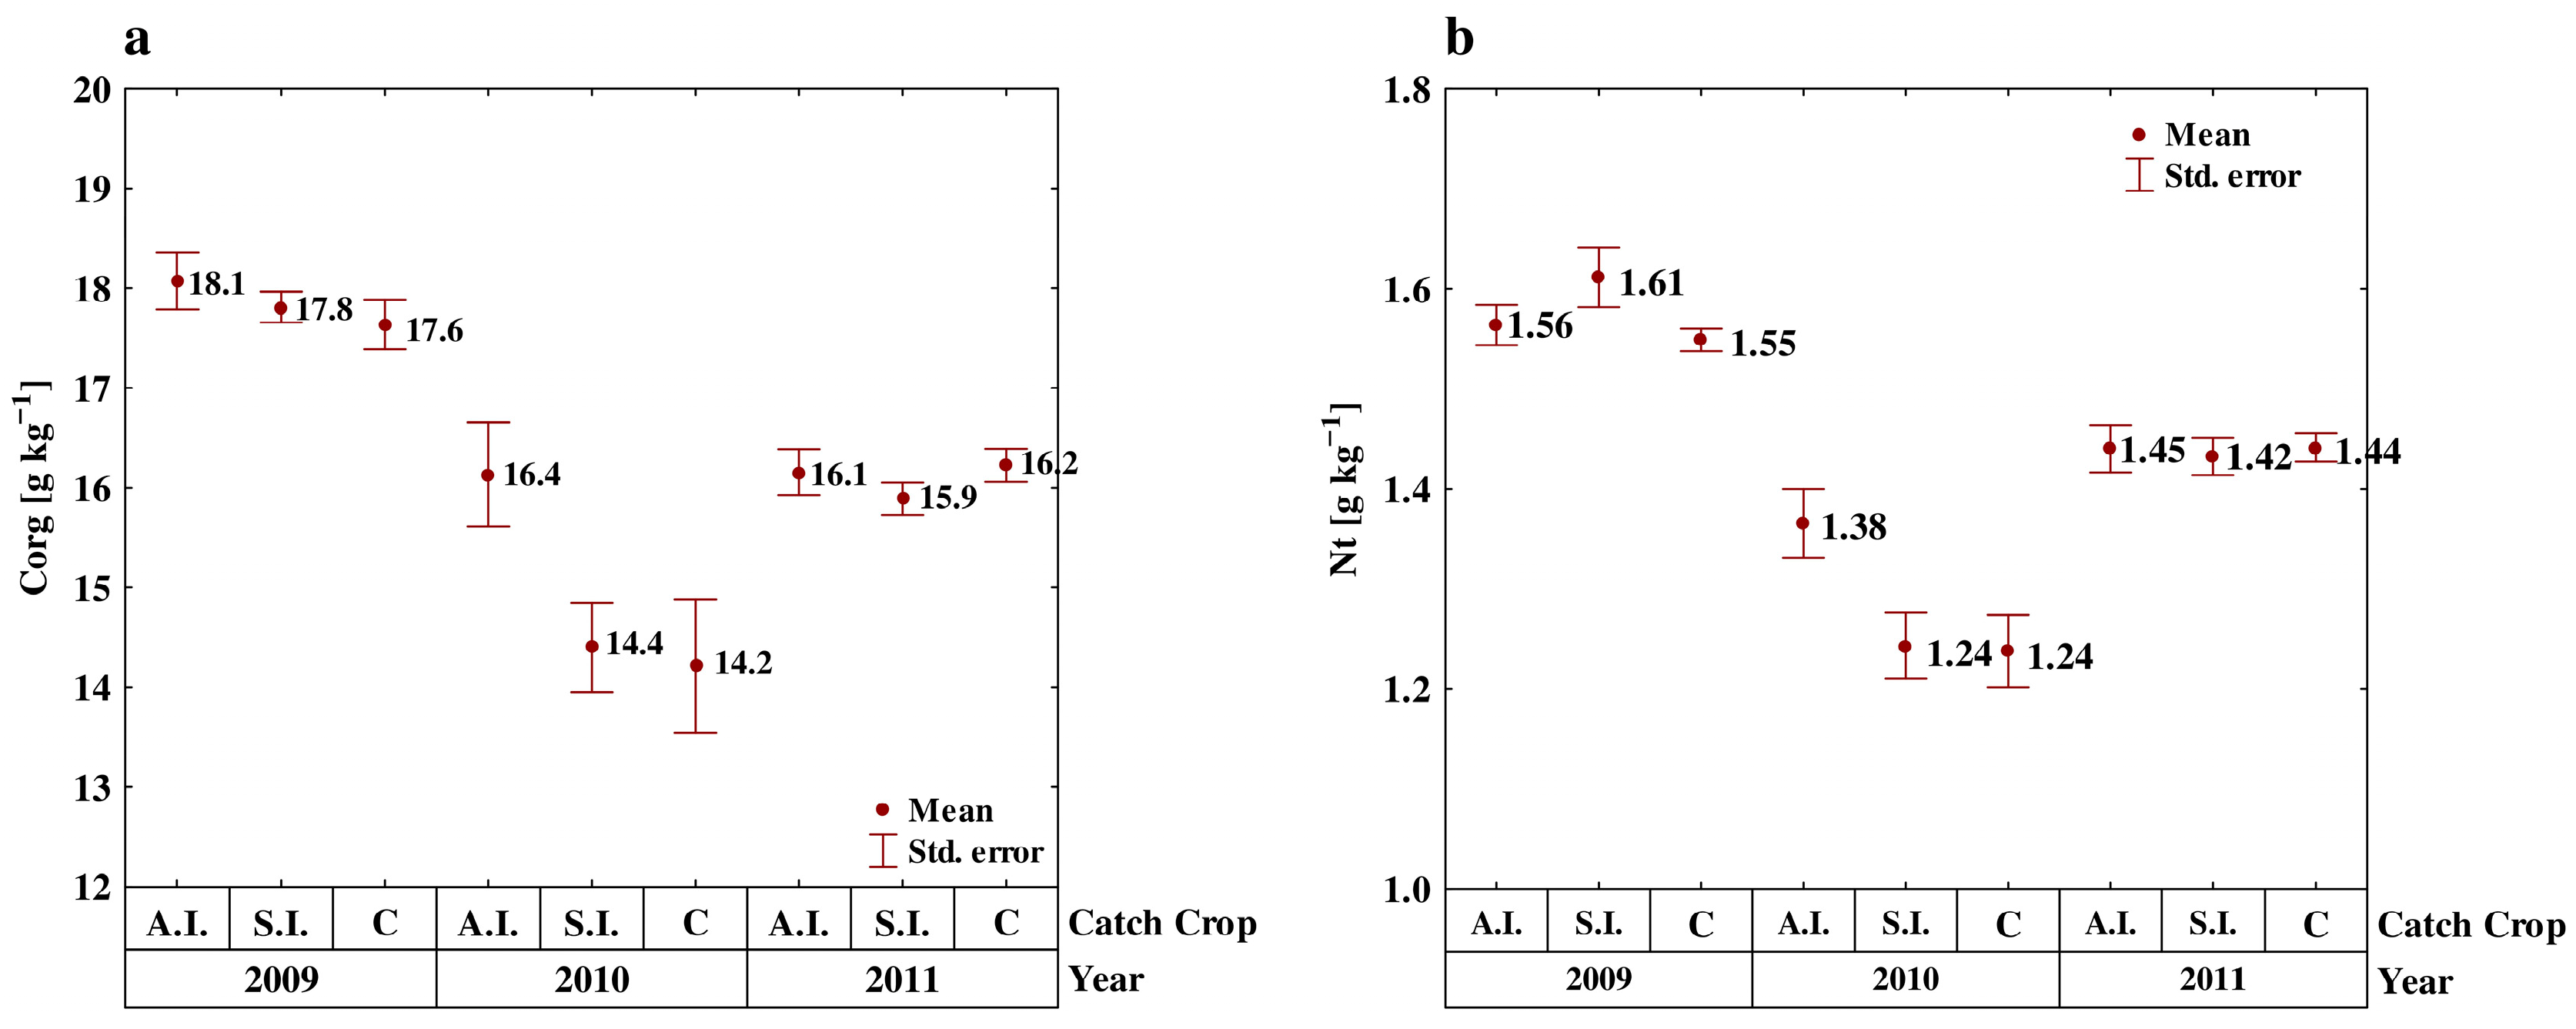
3.1. Soil Carbon and Nitrogen

The CORG content ranged from 14.2 to 18.1 g kg−1, while the soil Nt content was in the range of 1.24–1.61 g kg−1 (Figure 1). The content of CORG and Nt was the highest in 2009 and lower in 2011 and 2010. In general, neither catch crop management nor the sampling season had a significant effect on the content of CORG and Nt.
The MBC content ranged 197.5–424.2 mg kg−1 during the experiment years (Table 1). The highest MBC content was found in 2009, followed by 2011 and 2010. Generally, in comparison to the control, the use of field pea biomass significantly impacted the MBC content. Most often, the amount of MBC was unaffected by the catch crop management, although in some months (e.g., June and August 2009), this property was more affected by spring application of the catch crop compared to autumn application. The opposite trend was also found (e.g., March and August 2010). There was no consistent trend in the MBC activity in individual years as affected by sampling date. The only one clear trend was that the MBC content was highest in May in each study year. We found that between 1.33% and 2.28% of CORG was in the form of microbial biomass (Figure 2). A notably higher MBC/CORG ratio was calculated when the field pea biomass was used than in the control, while there was no marked changeability in this ratio between the autumn and spring incorporation of field pea in 2010 and 2011. Only in 2009 did field pea applied after winter significantly enhance the contribution of MBC in CORG compared to field pea applied in autumn.
Similarly to the previously described properties, the MBN amount was significantly greater in the soil with applied catch crop biomass (mean 68.2 mg kg−1) in comparison to that determined in the control treatment (50.6 mg kg−1) (Table 2). Spring application of field pea significantly enhanced the MBN content, compared to the autumn incorporation, in March and May, while the opposite situation was found for two last sampling dates (June and August). Considering mean values for all catch crop management variants, the sampling times did significantly not affect the MBN content.
The ammonium-N concentration ranged between 0.17 and 2.34 mg kg−1, with an average of 1.03 mg kg−1 (Table 3). In general, the greatest N-NH4+ content was obtained in soil collected in May or/and June (during the tillering and shooting of spring barley), while a lower concentration was found before sowing of spring barley (in March), except for in 2011. Generally, soil collected in March and May revealed a clear positive impact of catch crop application on ammonium-N content, while the content of this form of N was unaffected by the catch crop management (e.g., June 2010 and August 2011), or spring incorporation of plant residues significantly decreased its content compared to the control (e.g., August 2010 and June 2011).
The content of nitrate-N was higher in the third year of the study than in 2009 and 2010 (Table 4). For the whole period of the study (2009–2011), the highest concentration of nitrate-N (30.5 mg kg−1) was evaluated during the tillering growth stage of spring barley (May), and the lowest (8.57 mg kg−1) was observed after barley harvesting (August). The results obtained in the following study years and months showed no consistent trends as regards the influence of the method of catch crop use on the nitrate-N content. Both a positive effect (e.g., March, May 2009) as well as a lack of significant changes (e.g., June 2010) were noted. In turn, the averaged data (2009–2011) indicated that the N-NO3 content was clearly increased by field pea application in comparison with the control only in March and May, while a lower impact was found in June and August.

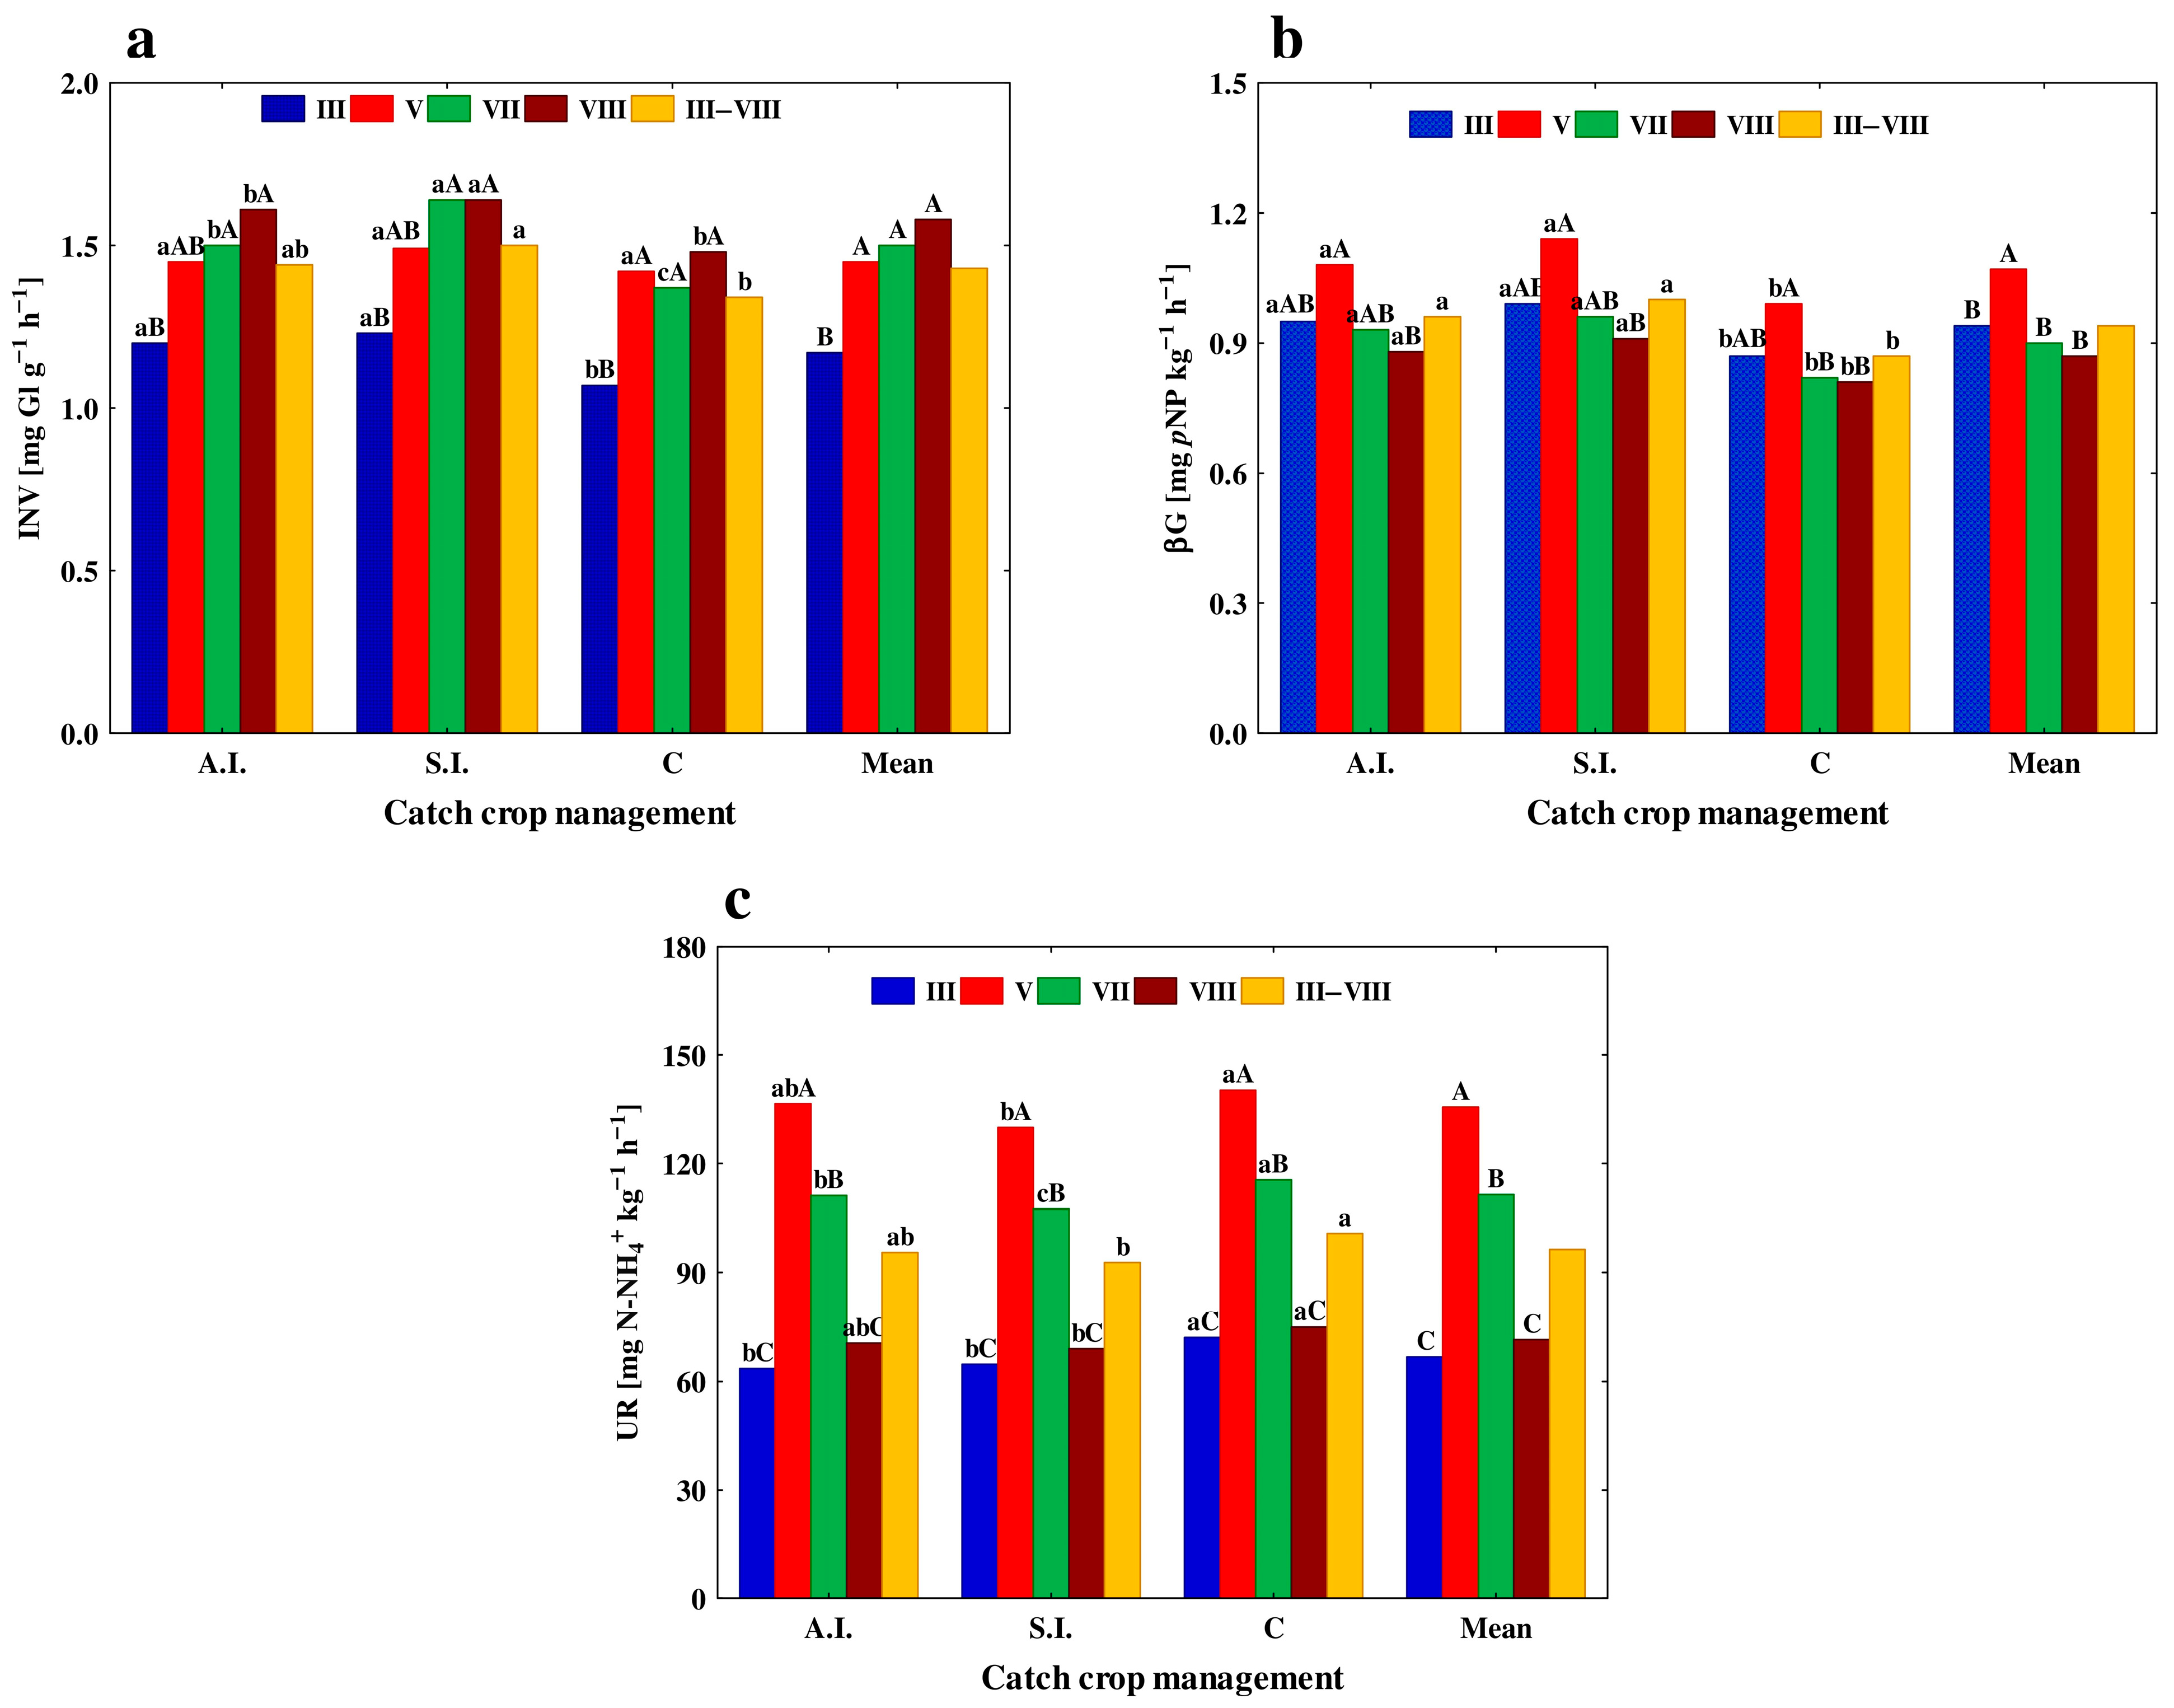
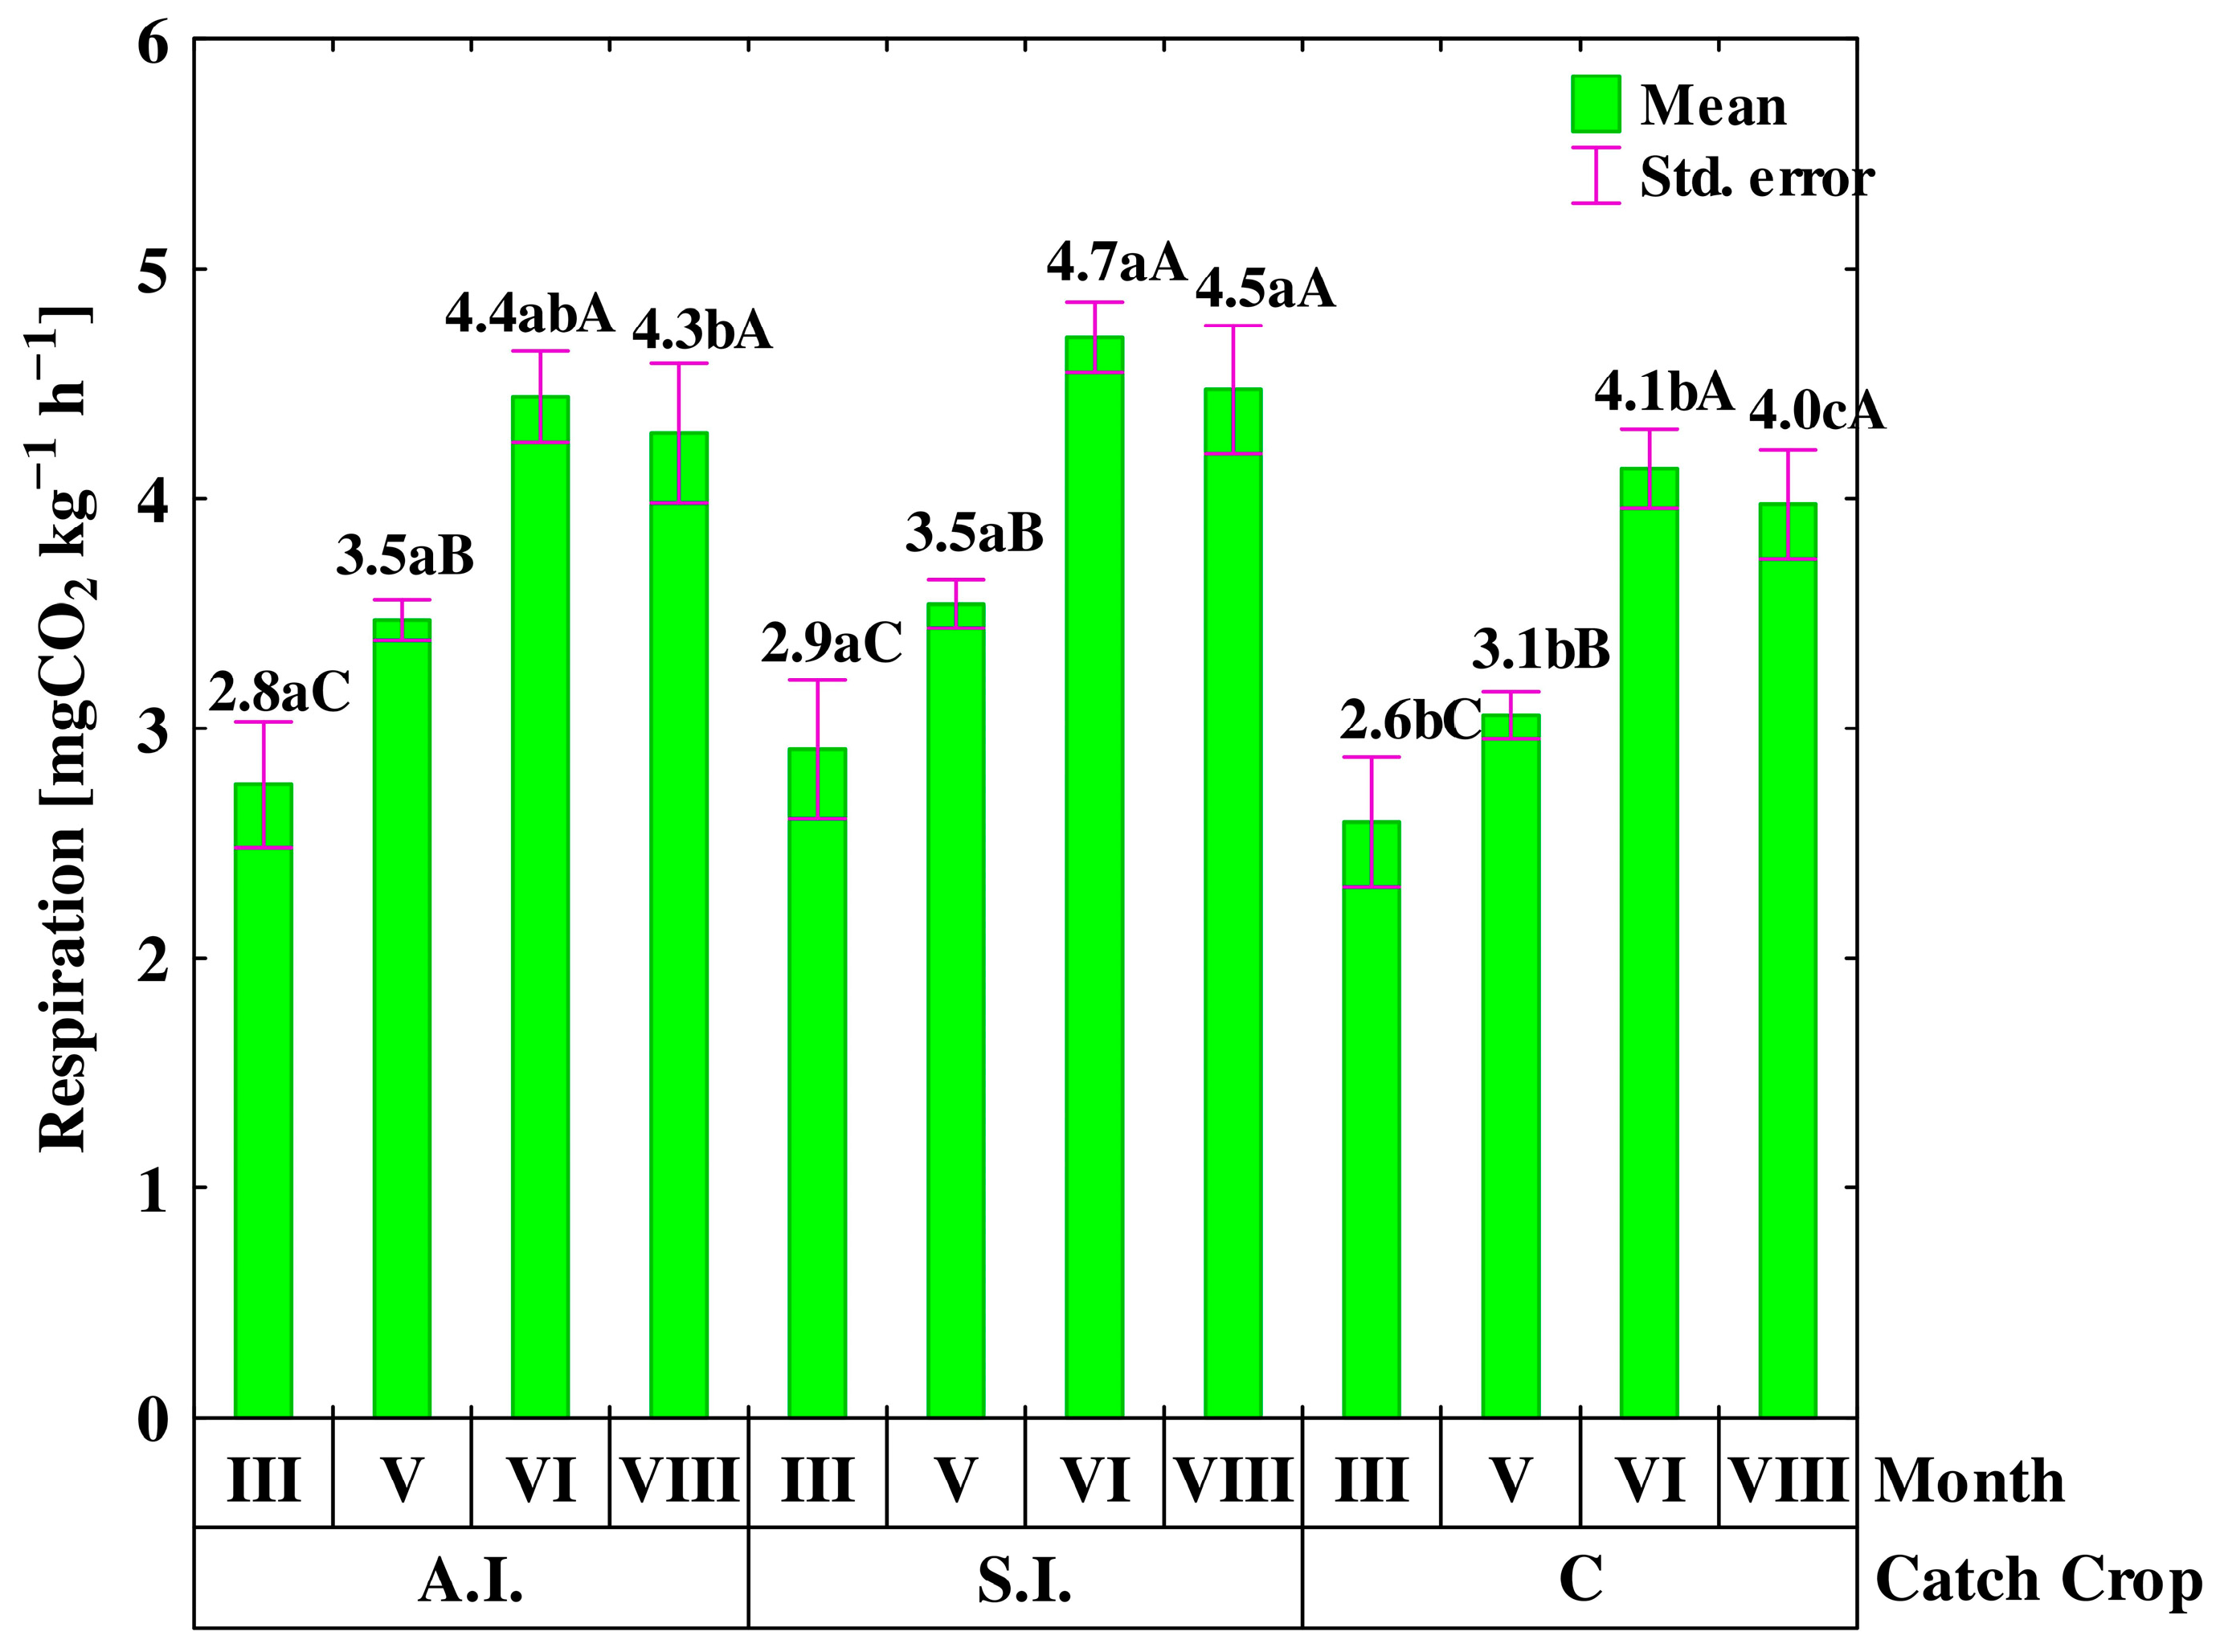
3.2. C- and N-Cycling Enzyme Activities and Soil Respiration

Since the activity of invertase, β-glucosidase, and urease was not significantly affected by the method of catch crop use in the subsequent years of the experiment, only the results for the entire study period are presented (Figure 3a–c). The invertase (INV) activity ranged from 1.07 to 1.64 mg Gl g−1 h−1 with an average of 1.43 mg Gl g−1 h−1. In general, the INV activity was higher when the catch crop was applied, in contrast to the control plots, except for the activity determined in soil samples taken in May. The enzyme activity was significantly lower in March than for other sampling dates (Figure 3a).
Generally, the βG activity was significantly higher in soil treated with catch crop in comparison to the control, except for May. Further, there was no statistically significant variability between the incorporation times of the plant biomass, except for June. During the whole research period (2009–2011), the activity of βG was the highest in May and significantly less active for the other sampling dates (Figure 3b). The UR activity was significantly greater in soil collected from the control plots compared to the activity determined in samples from the objects with catch crop application, while there were no significant dissimilarities between the catch crop managements (autumn and spring incorporation). The activity of UR was affected by the sampling time, in following the order: May > June > August > March (Figure 3c).
Over the whole experiment period, there were considerable differences in the NR activity, which ranged from 1.55 to 10.2 mg N-NO2 kg−1 24 h−1 (Table 5). The greatest NR activity occurred in 2009 (average 5.41 mg N-NO2 kg−1 24 h−1) followed by 2010 and 2011 (average 2.72 and 4.80 mg N-NO2 kg−1 24 h−1, respectively). Catch crop application significantly affected the NR activity in comparison to the control. The exception was the activity evaluated in March (in each year) and in August 2009. The enzyme activity was unaffected by the month of catch crop application to the soil, with the exception of August 2011. For this sampling time, the NR activity was significantly greater in the plots with field pea residues applied after rather than before the winter. No clear direction was noted in the NR activity as regards the sampling dates.
The CEL activity varied between the years of the study in the order 2011 > 2010 > 2009 (Table 6). The enzyme activity was significantly influenced by the field pea biomass in 2010 and 2011 (with the exception of August) in comparison to the control. However, the time of plant biomass application did not significantly affect the enzyme activity. The CEL activity revealed significant seasonal variation, but there were no clear trends in the activity between the sampling dates.
Soil respiration, which ranged from 2.6 to 4.7 mg CO2 kg−1 h−1, was significantly influenced by catch crop management (Figure 4). It was higher in plots after field pea application in comparison to the control soils, while the time of catch crop use differentiated soil respiration only in August. For this sampling time, the spring incorporation turned out to have a greater effect on soil respiration than the autumn application. Soil respiration was significantly increased during the growing season (August and June > May > March).

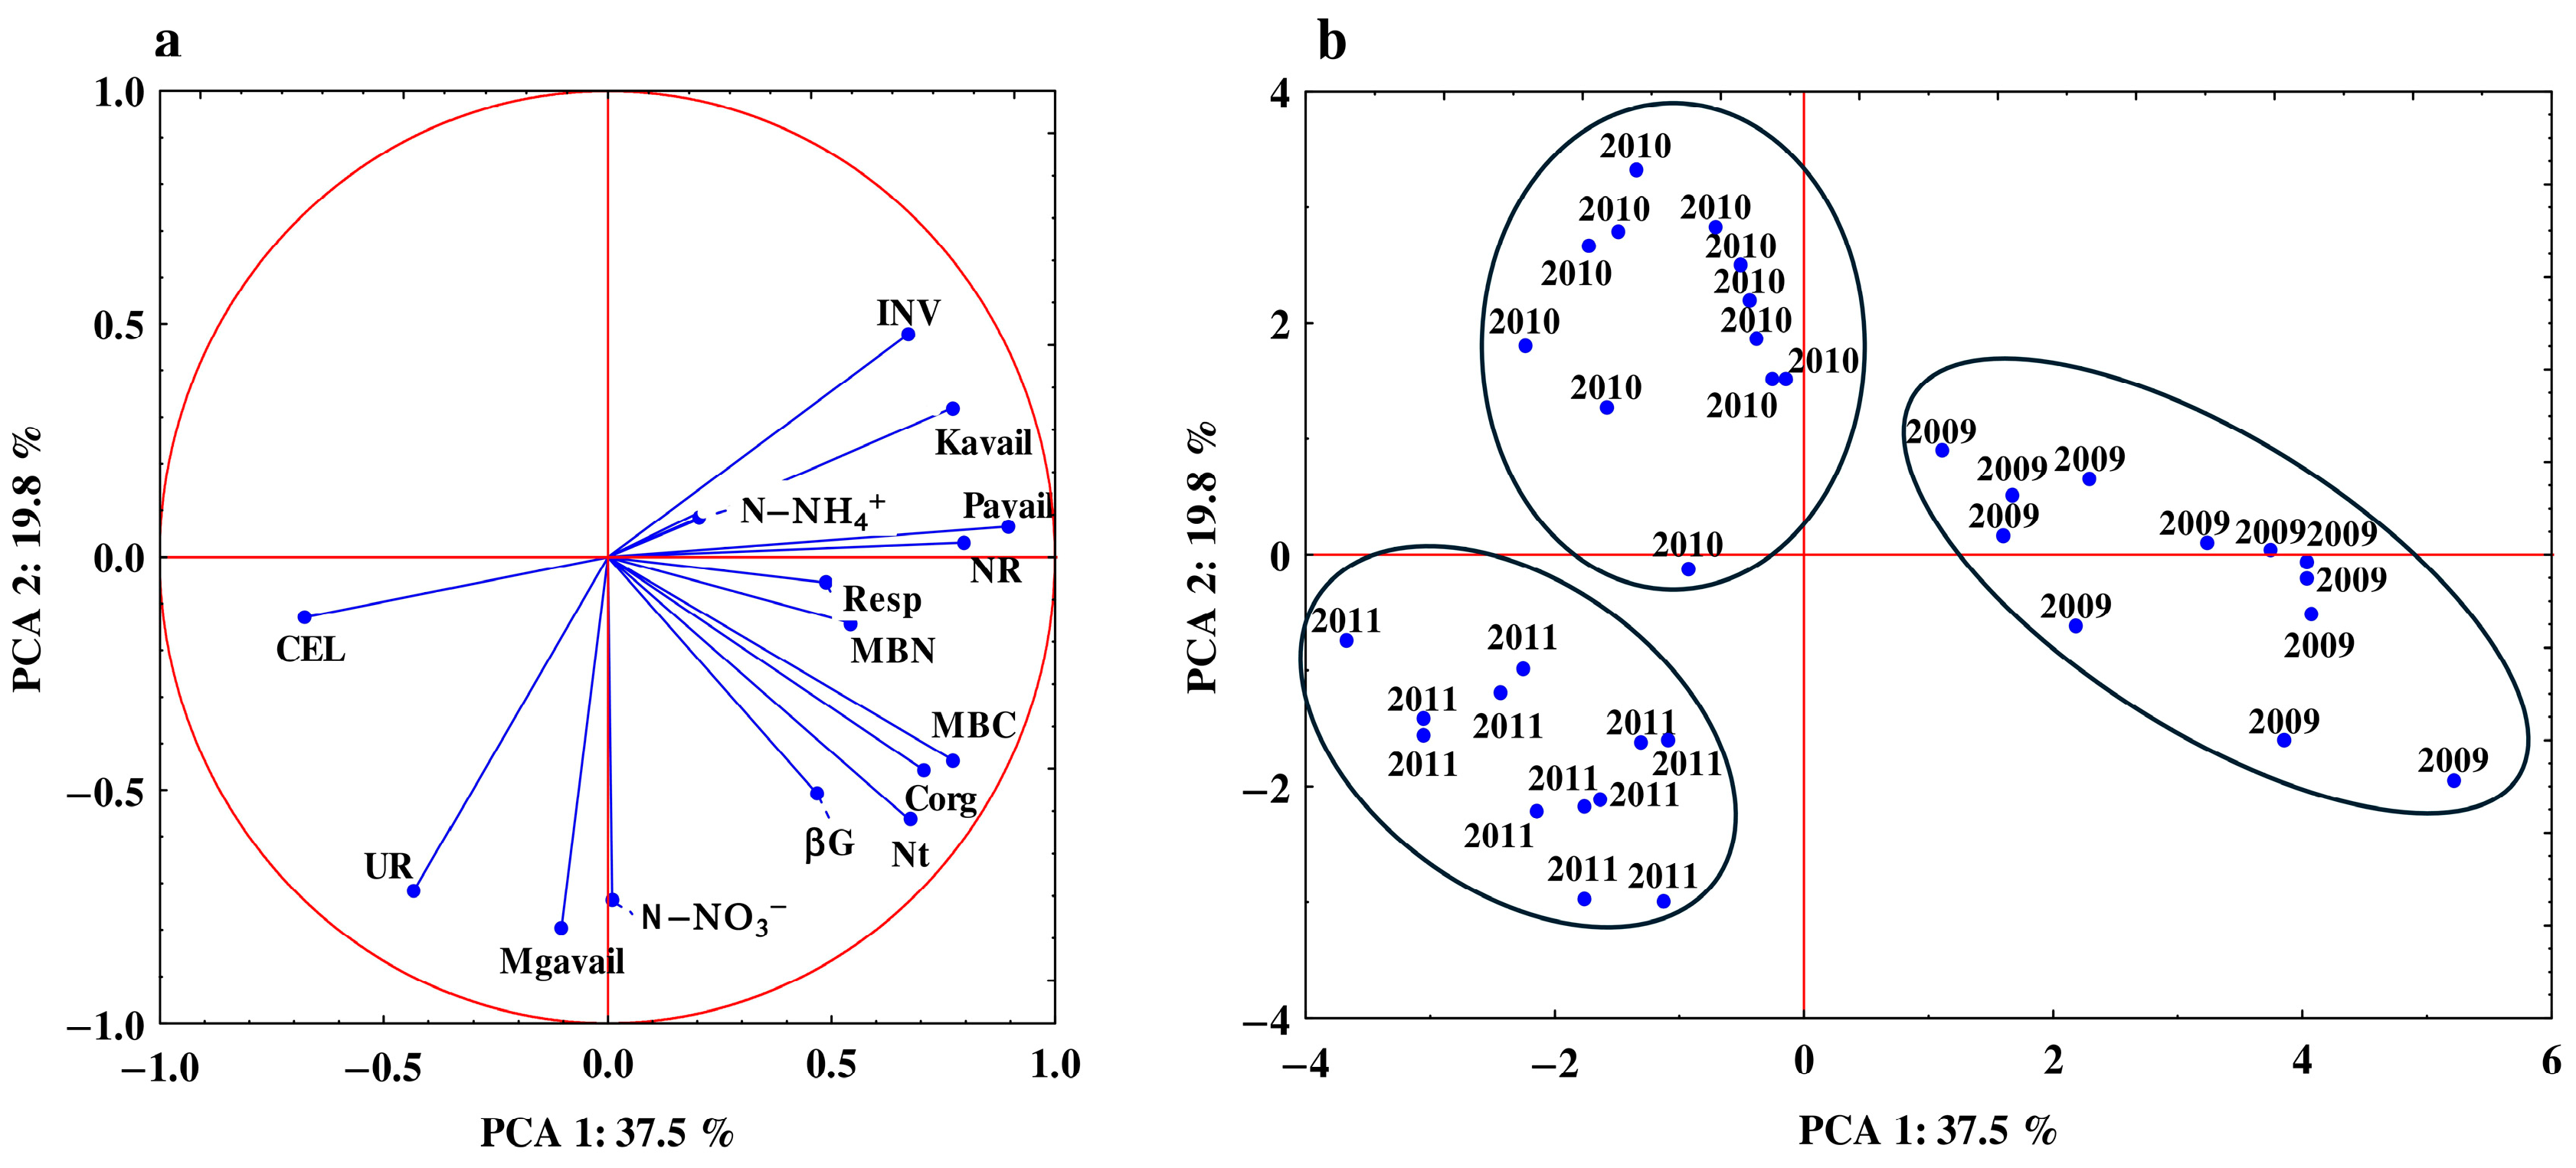
3.3. Relationship between the Studied Properties

A PCA analysis recognized four components that accounted for 77% of the total variance, most of which could be described by PC1 and PC2 (Figure 5). Almost all of the evaluated variables were strongly and positively related (scores > 0.600) to PCA 1 and between each other. The highest scores (>0.700) were found for NR activity, MBC, TOC, pH (Figure 5a). The CEL activity was strongly and negatively related to PCA1 (−0.675), which means that this component accounted for more than 50% of the variation in this activity. It was also observed that PCA2 was closely and negatively correlated (scores > −0.700) with two variables (UR activity, N-NO3 content). This implied that PCA 2 accounted for more than 50% of their variance. The PCA of the cases revealed the significant differences in soil variables in the individual study years (Figure 5b). It was observed that variables for soil samples collected in 2009 were positively correlated with PCA1, while variables for soil samples taken in 2010 and 2011 were negatively related to this component. In turn, PCA2 distinguished variables determined in soil samples collected in 2010 (positively correlated) from those evaluated in 2011 (negatively correlated). Additionally, the PCA of the cases did not show differences between variables in soil samples in the various sampling months and between the options of the catch crop management.

4. Discussion

4.1. Soil Carbon and Nitrogen

Despite the fact that different plants can be used as green manure, leguminous are the most used for this purpose, because of their ability to symbiose with rhizobium bacteria and, as a result, to use atmospheric nitrogen. During the mineralization of catch crop biomass in soil, immobilized nitrogen is gradually decomposed to mineral forms, which are subsequently available to successive plants [39,40]. Leguminous catch crops like field pea usually have a lower C/N ratio in comparison with other plants used as green manure. Therefore, due to a fast mineralization process, they release organic substances to soil such as organic acids, amino acids, carbohydrates, and vitamins, which increase the content of microbial populations and stimulate their activities [41]. Sanaullah et al. [39] found that application of leguminous catch crops as green manure can supply approximately 50% of the total N that is needed by the successively cultivated plants.
In this study, however, both application of green manure and the time of its incorporation (spring vs. autumn) during the entire study period did not significantly affect the content of soil CORG and Nt. These findings may have been the result of the relatively short period of the experiment, which was carried out on various parts of a productive field in the following years. The mixing of the catch crop with soil did not markedly affect the total N content in the soil taken prior to spring barley sowing. This was probably a consequence of the rather low content of this nutrient (mean for the 3 years of the study was 77.1 kg ha−1) concentrated in the field pea biomass [42]. As stated by the same authors, the mixing of the catch crop with soil contributed to a slight increase (by 1.1%) in the total amount of N that had been concentrated in arable soil. Accordingly, the quantity of nitrogen that was incorporated to the soil with field pea biomass was insufficient to give a considerable increase in this element in the soil. In the global literature, the data associated with the influence of catch crops on the content of CORG and Nt in various studies are inconsistent and certain data indicate their increase, but other researchers did not find any changes. Similarly to our results, Calderón et al. [43], in a 2-year experiment with cover cropping and irrigation, did not observe a measurable increase in the content of C and N. In addition, Bini et al. [44] observed no influence of winter catch crops on total organic C in a 5-year experiment, while in the long term (10 years), a positive effect on soil carbon content was observed. On the basis of the above finding, it can be assumed that evaluation of the effects of catch crops on soil properties should be carried over the long term in the same site [45,46]. Contrary to the above results, Song et al. [47] noted that incorporation of leguminous catch crop biomass as green manure over the period of two years notably enhanced the soil organic carbon content and nitrogen availability. In addition, Navas et al. [48], after 3 years of catch crop application, indicated an increase in total N content from 0.1 to 0.6 g kg−1.
Although the catch crop application in this experiment did not significantly enhance the total N content, the mineral-N content (both ammonium and nitrate) was increased by almost 30% compared to the control (average for 2009–2011), suggesting the positive influence of catch crop application on mineral-N accumulation. Contrary to our expectations, in two years of the study, a higher content of nitrate-N was determined after autumn incorporation compared to the spring application. Although partial mineralization of organic matter might have taken place during autumn and winter (because of the favorable weather conditions), the intensity of this process, as well as the leaching of nitrate-N, was probably slowed down due to the properties of the studied soil. Phaeozems are characterized by a relatively high clay content, which increases the soil compaction and decreases the nitrate-N leaching. Higher soil compaction results in a reduction in macropores content and consequently in decreased soil air and increased soil water retention and content. This in turn, as was indicated by Das et al. [49], may cause an increase in soil nitrate-N content. The specific air–water conditions of the studied Phaeozem might also have slowed down the rate of organic matter transformation, e.g., owing to insufficient available C sources for soil denitrifying microorganisms [50]. It can therefore be concluded that the higher content of nitrate-N after autumn catch crop incorporation compared to the spring application was probably the result of its accumulation in soil during autumn, winter, and spring.
No clear seasonal changes in nitrate and ammonium N concentration were found in this experiment; however, the greatest amount of mineral N was most often evaluated in May and/or June. This was probably due to fact that the most intensive decomposition of the applied plant residues took place in the spring months, due to having the most active enzymes in this time. The reduction in nitrate-N content after spring barley harvesting (August) could have been caused by the fact that part of the mineral N was accumulated in the yield of barley and the rate of mineralization in soil decreased because the growth of plants had finished. What is more, the relatively high precipitation in July and August (2009–2011) in the experiment area could have contributed to the partial leaching of the soil nitrate-N and its lower concentration in soil material collected in August. Due to the highest precipitation being noted in 2010, the lowest amount of nitrate-N content was found in this year. Finally, in our study, the influence of the field pea biomass on soil mineral N concentration might have been disguised by the influence of the applied mineral N fertilization (ammonium sulfate), which was added in an application every year before the sowing of spring barley and during its shooting. Accordingly, the enhanced concentration of nitrate-N assessed in May could also have been due to the application of the first portion of ammonium sulfate.

4.2. The Effect of Catch Crops on Soil Microbial and Enzymatic Properties

Although there was no an impact of the catch crop biomass on the content of total nitrogen and organic carbon, they did have a significant effect on the soil microbial biomass and enzymatic activity throughout the growing period of the subsequent plants. This finding is in agreement with the previously presented results, which suggested that soil microbial abundance and diversity, as well as soil enzymatic activity, responded positively to the application of various green manures [19,51,52,53,54,55]. Fresh plant biomass used as a green manure can enrich the soil with organic matter and nutrients such as N and P, which are easily available for soil microorganisms and promote their growth and activity. This was confirmed in this study by the values of the MBC/CORG ratio (Figure 2), which increased significantly with catch crop management compared to the control soil, indicating the greater amount of organic substrates that were available for soil microorganisms [56]. Statistically similar values for the MBC/CORG ratio, which was found irrespective of the catch crop incorporation time, suggested that field pea biomass used as catch crop may have a similar effect on soil quality status. In fact, the contribution of MBC to the organic C pool is a useful indicator of substrate availability and soil organic matter quality and changes [57]. This ratio is often used to compare soils with various organic matter contents [58]. According to Anderson and Domsch [59], a process of C accumulation occurs in soils having values of MBC/CORG ratio similar to those found in this study.
The enzymatic activity (except of urease), soil respiration, and microbial biomass C and N content determined in this study revealed statistically higher values in the catch crop treatment in comparison to the control soil, due to the input of green manure biomass. The fresh plant biomass mixed with the soil supplied easily available substrates for the soil microbial populations and their enzymes, resulting in a significant increase in their activity [60]. In this experiment, the fresh field pea biomass was almost 50% higher in 2008 than in the subsequent years (2009 and 2010) [55], which probably caused a greater NR activity and MBC content in 2009, followed by 2010 and 2011. No such relationship was however found for the other evaluated soil properties. In addition, it was suggested that the applied green mass not only enhanced the soil microbial activity but also may have contained enzymatic proteins [23]. The higher UR activity in the control soil in contrast to the activity found in the soil after the catch crop application was possibly due to the fact that the activity of soil enzymes engaged in the transformation of a related nutrient are frequently inversely dependent on the concentration and availability of that nutrient in the soil [61]. An explanation for this finding might be that the synthesis of some enzymes is inhibited in the environment with the presence of their product, like ammonium-N for the urease activity [62]. In fact, the activity of soil urease in our experiment was inversely associated with the ammonium-N content.
Catch crops may influence soil basal respiration through a positive effect on microbial biomass status, as most microbial populations produce carbon dioxide through aerobic respiration. Khan et al. [63] proposed substrate availability as a tool for regulating soil respiration, because this process increases when C is more available in soil for microorganisms. In fact, a recent study found that soil respiration was more intensive in plots with a mixture of different catch crops (rye, oat, Austrian winter pea, crimson clover, hairy vetch) compared to the intensity found in plots under a chemical fallow [64].

4.3. Autumn vs. Spring Incorporation of Field Pea

Since the amount of the produced biomass is crucial to realize the short-term benefits of catch crops application [65,66], we expected that the catch crop incorporated in spring would demonstrate a better impact on the soil variables (enhance microbial biomass and enzymatic activity, as well as protect nutrients against loss from the soil surface into the deeper soil layers) than plant biomass applied in autumn. We supposed that the biomass of field pea applied in the spring would likely be higher, due to longer growth time than that incorporated before the winter. The application of a higher biomass of the field pea after winter started the intensive processes of its decomposition, which were caused by the higher temperature values that were noted in the spring months and at the beginning of spring barley growth, which could have promoted the growth of indigenous microbial populations [19]. Keeping plant biomass on the surface soil in the winter months not only enhances catch crop biomass but also helps temporarily immobilize nutrients such as N and P, thereby reducing their loss [21]. In our study, only the content of MBC (2009 and 2011) and partially MBN was markedly greater after the catch crop was used in spring in comparison to autumn incorporation. On the other hand, the studied enzymatic activity did not reveal statistically significant variability as regards the incorporation time of the plant residues or no consistent trends was observed. Contrary to our data, Berntsen at al. [67] showed that plant biomass mixed with the soil after winter contributed to a notable increase in the soil nitrogen content. In turn, Wilczewski et al. [68] found that both spring and autumn applications of catch crop biomass significantly affected the soil mineral nitrogen content. One observation resulting from our study suggests that the weak effect of field pea biomass and the time of its mixing with soil variables could have been related to the relatively high natural fertility of the studied soil, which is well stocked with nutrients from soil resources. The content of soil inorganic N in the studied soil was approximately 60% higher during the tillering and stem elongation of barley than in the study conducted at the same time in Luvisol [69]. In these conditions, both acid and alkaline phosphomonoesterase activities were remarkably impacted by the field pea biomass application, while the time of the field pea incorporation affected only the acid phosphatase activity [19]. This activity was increased with spring incorporation of the catch crop green mass compared to indirect application in the autumn.
Seasonal fluctuations in soil microbial and enzymatic variables may have been associated with the rate of field pea biomass decomposition and some environmental factors such as temperature and soil moisture [70]. The properties determined in this study revealed significant seasonal fluctuations, but the direction of the changes was not clear and diverse for each property. Often, however, the highest values of the studied properties were noted in May and/or June, which could have been associated with increased microbial populations during the period of most intensive plant growth associated with the high input of easily available root exudates, nutrients, and substrates, depending on the rate of soil organic matter input and transformation [71]. Some studies found a strong effect of weather conditions, mainly temperature and precipitation (and consequently soil water content), on the abundance, diversity, and activity of soil microbial populations over the course of a study period [72,73]. However, the seasonal dynamics of the properties studied in this experiment did not exhibit any substantial relationship with the values of temperature and precipitation over the years of the study. An explanation for this might be that the seasonal fluctuations in microbial properties reflect a combined effect of different possible drivers that can lead to unforeseen results and frequently act contrarily to each other [74]. Together with these seasonal dynamics, the status of the studied properties was probably affected by other drivers associated with catch crop management and previous agricultural practices that masked potential seasonal effects associated with the changing weather parameters.

5. Conclusions

Our findings show that the application of field pea as a green manure, in comparison to the control, can be suggested in order to increase soil mineral N content, as well as the soil microbial content and activity during growth, of the successively cultivated plants. The reason for the opposite trend in urease activity could be explained by the fact that the soil urease activity in this study was inversely related to the ammonium-N content, which is known to be an urease inhibitor.
Since among the studied properties only the content of MBC and mineral-N significantly differed in soil treated with the catch crop in spring compared to autumn application, this suggests that these variables are more sensitive toward soil catch crop management than, e.g., soil enzymatic activity, and are suitable for assessing changes in the short term.
Most of the studied properties (except for CORG, Nt, MBN) revealed significant seasonal variability, but the direction of the changes was not clear or related to a specific property. The only regularity observed was that the highest values of the studied properties were noted in May and/or June, which could have been associated with the most intensive plant growth and enhanced soil organic matter transformation, resulting in a higher availability of nutrients and substrates. The interactions and complex seasonal changes in individual enzymes associated with different biochemical reactions, together with the catch crop management, made it difficult to predict clear trends in their seasonal activity or over the course of the study years.
Our results indicate that the use of catch crops is an important agriculture practice for increasing the effectiveness of soil nutrient cycling and can be recommended as a tool for enhancing soil microbiological activity and improving soil status. Since no consistent trend in changes in the studied properties was observed in relation to the time of catch crop incorporation, both spring and autumn application can be suggested as a tool for better management of agroecosystems.

Author Contributions

Conceptualization, A.P.-D. and E.W.; methodology, A.P.-D. and E.W.; investigation, A.P.-D. and E.W.; data curation—compiled and analyzed the results, A.P.-D. and E.W.; writing—original draft preparation, A.P.-D.; review and editing E.W. All authors have read and agreed to the published version of the manuscript.

Funding

This research was funded by the Ministry of Science and Higher Education of Poland, grant number N N310144135.

Institutional Review Board Statement

Not applicable.

Data Availability Statement

The data used to support the findings of this study are available from the authors upon request.

Conflicts of Interest

The authors declare no conflicts of interest.

References

  1. Sharma, P.; Laor, Y.; Raviv, M.; Medina, S.; Saadi, I.; Kransnovsky, A.; Vager, M.; Levy, G.J.; Bar-Tal, A.; Borisover, M. Green manure as part of organic management cycle: Effects on changes in organic matter characteristics across the soil profile. Geoderma 2017, 305, 197–207. [Google Scholar] [CrossRef]
  2. Su, G.; Zhao, R.; Wang, Y.; Yang, Y.; Wu, X.; Wang, J.; Ge, J. Green Manure Return Strategies to Improve Soil Properties and Spring Maize Productivity under Nitrogen Reduction in the North China Plain. Agronomy 2022, 12, 2734. [Google Scholar] [CrossRef]
  3. Brahim, N.; Karbout, N.; Dhaouadi, L.; Bouajila, A. Global Landscape of Organic Carbon and Total Nitrogen in the Soils of Oasis Ecosystems in Southern Tunisia. Agronomy 2021, 11, 1903. [Google Scholar] [CrossRef]
  4. Barel, J.M.; Kuyper, T.W.; Paul, J.; de Boer, W.; Cornelissen, J.H.C.; De Deyn, G.B. Winter cover crop legacy effects on litter decomposition act through litter quality and microbial community changes. J. Appl. Ecol. 2019, 56, 132–143. [Google Scholar] [CrossRef]
  5. Baldrian, P. Distribution of extracellular enzymes in soils: Spatial heterogeneity and determining factors at various scales. Soil Sci. Soc. Am. J. 2014, 78, 11–18. [Google Scholar] [CrossRef]
  6. Nannipieri, P.; Trasar-Cepeda, C.; Dick, R.P. Soil enzyme activity: A brief history and biochemistry as a basis for appropriate interpretations and meta-analysis. Biol. Fertil. Soils 2018, 54, 11–19. [Google Scholar] [CrossRef]
  7. Piotrowska-Długosz, A. Significance of the enzymes associated with soil C and N transformation. In Carbon and Nitrogen Cycling in Soil; Datta, R., Meena, R.S., Pathan, S.I., Ceccherini, M.T., Eds.; Springer Nature: Singapore, 2020; pp. 339–437. [Google Scholar]
  8. Gunina, A.; Kuzyakov, Y. Sugars in soil and sweets for microorganisms: Review of origin, content, composition and fate. Soil Biol. Biochem. 2015, 90, 87–100. [Google Scholar] [CrossRef]
  9. Lase, E.R.K.; Giyanto Santosa, D.A. Isolation, identification, and analysis of the invertase-producing bacteria abundance in sugarcane rhizosphere soil with different plant productivity levels. Biodiversitas 2021, 22, 3156–3162. [Google Scholar] [CrossRef]
  10. Datta, R.; Kelkar, A.; Baraniya, D.; Molaei, A.; Moulick, A.; Meena, R.; Formanek, P. Enzymatic degradation of lignin in soil: A review. Sustainability 2017, 9, 1163. [Google Scholar] [CrossRef]
  11. Tabatabai, M.A.; Ekenler, M.; Senwo, Z.N. Significance of Enzyme Activities in Soil Nitrogen Mineralization. Commun. Soil Sci. Plant Anal. 2010, 41, 595–605. [Google Scholar] [CrossRef]
  12. Zhang, Q.; Zhang, D.; Wu, J.; Li, J.; Feng, J.; Cheng, X. Soil nitrogen-hydrolyzing enzyme activity and stoichiometry following a subtropical land use change. Land Degrad. Dev. 2021, 32, 4277–4287. [Google Scholar] [CrossRef]
  13. Piotrowska-Długosz, A.; Długosz, J.; Gryta, A.; Frąc, M. Responses of N-Cycling Enzyme Activities and Functional Diversity of Soil Microorganisms to Soil Depth, Pedogenic Processes and Cultivated Plants. Agronomy 2022, 12, 264. [Google Scholar] [CrossRef]
  14. Utobo, E.B.; Tewari, L. Soil enzymes as bioindicators of soil ecosystem status. Appl. Ecol. Environ. Res. 2015, 13, 147–169. [Google Scholar] [CrossRef]
  15. Zhang, S.; Li, H.; Yang, X.; Sun, B. Effects of soil management regimes on biochemical properties of a loess soil. J. Soil Sci. Plant Nutr. 2015, 15, 711–725. [Google Scholar] [CrossRef]
  16. Chen, Y.P.; Tsai, C.F.; Rekha, P.D.; Ghate, S.D.; Huang, H.Y.; Hsu, Y.H.; Liaw, L.L.; Young, C.C. Agricultural management practices influence the soil enzyme activity and bacterial community structure in tea plantations. Bot. Stud. 2021, 62, 8. [Google Scholar] [CrossRef]
  17. Wang, S.; Zang, H.; Yang, Y.; Zeng, Z.; Razavi, B. Spatio-temporal distribution of enzyme activities with covered and mixed straw incorporation. In Proceedings of the EGU General Assembly 2024, Vienna, Austria, 14–19 April 2024. EGU24-1800. [Google Scholar] [CrossRef]
  18. Thomsen, I.K. Nitrate leaching under spring barley is influenced by the presence of a ryegrass catch crop: Results from a lysimeter experiment. Agric. Ecosyst. Environ. 2005, 111, 21–29. [Google Scholar] [CrossRef]
  19. Piotrowska-Długosz, A.; Wilczewski, E. Assessment of soil nitrogen and related enzymes as influenced by the incorporation time of field pea cultivated as a catch crop in Alfisol. Environ. Monit. Assess. 2014, 186, 8425–8441. [Google Scholar] [CrossRef]
  20. Hungria, M.; Franchini, J.; Brandao-Junior, C.; Kaschuk, G.; Souza, A.R. Soil microbial activity and crop sustainability in a long-term experiment with three soil-tillage and two crop-rotation systems. Appl. Soil Ecol. 2009, 42, 288–296. [Google Scholar] [CrossRef]
  21. Kaschuk, G.; Alberton, O.; Hungria, M. Three decades of soil microbial biomass studies in Brazilian ecosystems: Lessons learned about soil quality and indications for improving sustainability. Soil Biol. Biochem. 2010, 42, 1–13. [Google Scholar] [CrossRef]
  22. Doltra, J.; Olesen, J.E. The role of catch crops in the ecological intensification of spring cereals in organic farming under Nordic climate. Eur. J. Agron. 2013, 44, 98–108. [Google Scholar] [CrossRef]
  23. Brennan, E.B.; Acosta-Martinez, V. Cover Crops and Compost Influence Soil Enzymes during Six Years of Tillage-Intensive, Organic Vegetable Production. Soil Sci. Soc. Am. J. 2019, 83, 624–637. [Google Scholar] [CrossRef]
  24. Olson, K.; Ebelhar, S.A.; Lang, J.M. Long-term effects of cover crops on crop yields, soil organic carbon stocks and sequestration. Open J. Soil Sci. 2014, 4, 284–292. [Google Scholar] [CrossRef]
  25. Austin, E.E.; Wickings, K.; McDaniel, M.D.; Robertson, G.P.; Grandy, A.S. Cover crop root contributions to soil carbon in a no-till corn bioenergy cropping system. GCB Bioenergy 2017, 9, 1252–1263. [Google Scholar] [CrossRef]
  26. Zhang, H.; Ghahramani, A.; Ali, A.; Erbacher, A. Cover cropping impacts on soil water and carbon in dryland cropping system. PLoS ONE 2023, 18, e0286748. [Google Scholar] [CrossRef] [PubMed]
  27. IUSS Working Group WRB. World Reference Base for Soil Resources 2014; Update 2015; International Soil Classification System for Naming Soils and Creating Legends for Soil Maps; FAO: Rome, Italy, 2015; p. 106. [Google Scholar]
  28. Wilczewski, E.; Piotrowska-Długosz, A.; Lemańczyk, G. Influence of catch crop on soil properties and yield of spring barley. Int. J. Plant Prod. 2014, 8, 391–408. [Google Scholar]
  29. Bremner, J.M.; Mulvaney, C.S. Nitrogen—Total. In Methods of Soil Analysis Part 2; Page, A.L., Miller, R.H., Keeny, D.R., Eds.; American Society of Agronomy: Madison, WI, USA, 1982; pp. 594–624. [Google Scholar]
  30. Jackson, M.L. Soil Chemical Analysis—Advanced Course: A Manual of Methods Useful for Instruction and Research in Soil Chemistry, Physical Chemistry of Soils, Soil Fertility, and Soil Genesis, 2nd ed.; UW-Madison Libraries Parallel Press: Madison, WI, USA, 1979. [Google Scholar]
  31. Vance, E.D.; Brookes, P.C.; Jenkinsen, D.S. An extraction method for measuring soil microbial biomass C. Soil Biol. Biochem. 1987, 19, 703–707. [Google Scholar] [CrossRef]
  32. Joergensen, R.G.; Mueller, T. The fumigation-extraction method to estimate soil microbial biomass: Calibration of the kEN value. Soil Biol. Biochem. 1996, 28, 33–37. [Google Scholar] [CrossRef]
  33. Bashour, I.I.; Sayegh, A.H. Methods of Analysis for Soils of Arid and Semi-Arid Regions; Food and Agriculture Organization of the United States: Rome, Italy, 2007; 128p. [Google Scholar]
  34. Eivazi, F.; Tabatabai, M.A. Glucosidases and galactosidases in soils. Soil Biol. Biochem. 1988, 20, 601–606. [Google Scholar] [CrossRef]
  35. Schinner, F.; von Mersi, W. Xylanase-, CM-cellulase- and invertase activity in soil: An improved method. Soil Biol. Biochem. 1990, 22, 511–515. [Google Scholar] [CrossRef]
  36. Kandeler, E.; Gerber, H. Short-term assay of soil urease activity using colorimetric determination of ammonia. Biol. Fertil. Soils 1988, 6, 68–72. [Google Scholar] [CrossRef]
  37. Kandeler, E. Enzymes Involved in Nitrogen Metabolism. In Methods in Soil Biology; Scinner, F., Ohlinger, R., Kandeler, E., Margesin, R., Eds.; Springer: Berlin/Heidelberg, Germany, 1995; pp. 163–184. [Google Scholar]
  38. Isermeyer, H. Eine einfache Methode zur Bestimmung der Bodenatmung und der Karbonate im Boden. Z. Pflanzenernährung Düngung Bodenkd. 1952, 56, 26–38. (In German) [Google Scholar] [CrossRef]
  39. Sanaullah, M.; Mujtaba, A.; Haider, G.; ur Rehman, H.; Mubeen, F. Mitigation and actions toward nitrogen losses in Pakistan. In Nitrogen Assessment; Pakistan as a Case-Study; Academic Press: Cambridge, MA, USA, 2022; Volume 8, pp. 149–175. [Google Scholar] [CrossRef]
  40. Pirhofer-Walzl, K.; Rasmussen, J.; Høgh-Jensen, H.; Eriksen, J.; Søegaard, K.; Rasmussen, J. Nitrogen transfer from forage legumes to nine neighbouring plants in a multi-species grassland. Plant Soil 2012, 3350, 71–84. [Google Scholar] [CrossRef]
  41. Cárceles Rodríguez, B.; Durán Zuazo, V.H.; Soriano Rodríguez, M.; García-Tejero, I.F.; Gálvez Ruiz, B.; Repullo-Ruibérriz de Torres, M.A.; Ordóñez-Fernández, R.; Carbonell-Bojollo, R.M.; Cuadros Tavira, S. Legumes protect the soil erosion and ecosystem. Adv. Legumes Sustain. Intensif. 2022, 13, 247–266. [Google Scholar] [CrossRef]
  42. Wilczewski, E.; Sadkiewicz, J.; Piotrowska-Długosz, A.; Gałęzewski, L. Change of Plant Nutrients in Soil and Spring Barley Depending on the Field Pea Management as a Catch Crop. Agriculture 2021, 11, 394. [Google Scholar] [CrossRef]
  43. Calderón, F.J.; Nielsen, D.; Acosta-Martinez, V.; Vigil, M.F.; Lyon, D. Cover Crop and Irrigation Effects on Soil Microbial Communities and Enzymes in Semiarid Agroecosystems of the Central Great Plains of North America. Pedosphere 2016, 26, 192–205. [Google Scholar] [CrossRef]
  44. Bini, D.; Alcantara dos Santos, C.; Toledo Bernel, L.P.; Andrade, G.; Nogueira, M.A. Identifying indicators of C and N cycling in a clayey Ultisol under different tillage and uses in winter. Appl. Soil Ecol. 2014, 76, 95–101. [Google Scholar] [CrossRef]
  45. Diacomo, M.; Montemuro, F. Long-term effects of organic amendments on soil fertility. A review. Agron. Sustain. Dev. 2010, 30, 401–422. [Google Scholar] [CrossRef]
  46. Jaskulska, I.; Romaneckas, K.; Jaskulski, D.; Gałęzewski, L.; Breza-Boruta, B.; Dębska, B.; Lemanowicz, J. Soil properties after eight years of the use of strip-till one-pass technology. Agronomy 2020, 10, 1596. [Google Scholar] [CrossRef]
  47. Song, S.; Li, L.; Yin, Q.; Nie, L. Effect of in situ incorporation of three types of green manure on soil quality, grain yield and 2-acetyl-1-pyrrolline content in tropical region. Crop Environ. 2022, 1, 189–197. [Google Scholar] [CrossRef]
  48. Navas, M.; Benito, M.; Rodriguez, I.; Masaguer, A. Effect of five forage legume covers on soil quality at the Eastern plains of Venezuela. Appl. Soil Ecol. 2011, 49, 242–249. [Google Scholar] [CrossRef]
  49. Das, S.; Mohapatra, A.; Sahu, K.; Panday, D.; Ghimire, D.; Maharjan, B. Nitrogen dynamics as a function of soil types, compaction, and moisture. PLoS ONE 2024, 19, e0301296. [Google Scholar] [CrossRef]
  50. Remya, N.; Kumar, M.; Mohan, S.; Azzam, R. Influence of organic matter and solute concentration on nitrate sorption in batch and diffusion-cell experiments. Bioresour. Technol. 2011, 102, 5283–5289. [Google Scholar] [CrossRef]
  51. Marinari, S.; Mancinelli, R.; Campiglia, E.; Grego, S. Chemical and biological indicators of soil quality in organic and conventional farming systems in Central Italy. Ecol. Indic. 2006, 6, 701–711. [Google Scholar] [CrossRef]
  52. Stark, C.; Condron, L.M.; Stewart, A.; Di, H.J.; O’Callaghan, M. Influence of organic and mineral amendments on microbial soil properties and processes. Appl. Soil Ecol. 2007, 35, 79–93. [Google Scholar] [CrossRef]
  53. Stegarescu, G.; Reintam, E.; Tõnutare, T. Cover crop residues effect on soil structural stability and phosphatase activity. Acta Agric. Scand. B Soil Plant Sci. 2021, 71, 992–1005. [Google Scholar] [CrossRef]
  54. Erdel, E. Soil Enzyme Activities Affecting by Different Tillage Systems and Cover Crops Following Corn Cultivation. J. Inst. Sci. Technol. 2022, 12, 1134–1142. [Google Scholar] [CrossRef]
  55. Piotrowska-Długosz, A.; Wilczewski, E. Influence of field pea (Pisum sativum L.) as catch crop cultivated for green manure on soil phosphorus and P-cycling enzyme activity. Arch. Agron. Soil Sci. 2020, 66, 1570–1582. [Google Scholar] [CrossRef]
  56. Anderson, T.H. Microbial Eco-Physiological Indicators to Assess Soil Quality. Agric. Ecosyst. Environ. 2003, 98, 285–293. [Google Scholar] [CrossRef]
  57. Liu, C.; Tian, J.; Cheng, K.; Xu, X.; Wang, Y.; Liu, X.; Liu, Z.; Bian, R.; Zang, X.; Xia, S.; et al. Topsoil microbial biomass carbon pool and the microbial quotient under distinct land-use types across China: A data synthesis. Soil Sci. Environ. 2023, 2, 1–5. [Google Scholar] [CrossRef]
  58. Yusuf, A.A.; Abaidoo, R.C.; Iwuafor, E.N.O.; Olufajo, O.O.; Sanginga, N. Rotation effects of grain legumes and fallow on maize yield, microbial biomass and chemical properties of an Alfisol in the Nigerian savanna. Agric. Ecosyst. Environ. 2009, 129, 325–331. [Google Scholar] [CrossRef]
  59. Anderson, T.; Domsch, K.H. Application of eco-physiological quotients (qCO2 and qD) on microbial biomasses from soils of different cropping histories. Soil Biol. Biochem. 1990, 22, 251–255. [Google Scholar] [CrossRef]
  60. Arlauskiené, A.; Maikšténiené, S. The effect of cover crop and straw applied for manuring on spring barley yield and agrochemical soil properties. Zemdirbyste-Agric. 2010, 97, 61–72. [Google Scholar]
  61. Dick, R.P. A review: Long-term effects of agricultural systems on soil biochemical and microbial parameters. Agric. Ecosyst. Environ. 1992, 40, 25–60. [Google Scholar] [CrossRef]
  62. Geisseler, D.; Horwath, W.R.; Joergensen, R.G.; Ludwig, B. Pathways of nitrogen utilization by soil microorganisms—A review. Soil Biol. Biochem. 2010, 42, 2058–2067. [Google Scholar] [CrossRef]
  63. Khan, M.I.; Hwang, H.Y.; Kim, G.W.; Kim, P.J.; Das, S. Microbial responses to temperature sensitivity of soil respiration in a dry fallow cover cropping and submerged rice mono-cropping system. Appl. Soil Ecol. 2018, 128, 98–108. [Google Scholar] [CrossRef]
  64. Aime, S.R.; Bridges, W.C., Jr.; Narayanan, S. Fall–winter cover crops promote soil health and weed control in the southeastern clayey soils. Agron. J. 2023, 115, 242–260. [Google Scholar] [CrossRef]
  65. Mirsky, S.B.; Ryan, M.R.; Teasdale, J.R.; Curran, W.S.; Reberg-Horton, C.S.; Spargo, J.T.; Wells, M.S.; Keene, C.L.; Moyer, J.W. Overcoming weed management challenges in cover crop–based organic rotational no-till soybean production in the east-ern United States. Weed Technol. 2013, 27, 193–203. [Google Scholar] [CrossRef]
  66. Vann, R.A.; Reberg-Horton, S.C.; Edmisten, K.L.; York, A.C. Implications of cereal rye/crimson clover management for conventional and organic cotton producers. Agron. J. 2018, 110, 621–631. [Google Scholar] [CrossRef]
  67. Berntsen, J.; Olsen, J.E.; Petersen, B.M.; Hansen, E.M. Long-term fate of nitrogen uptake in catch crops. Eur. J. Agron. 2006, 25, 383–390. [Google Scholar] [CrossRef]
  68. Wilczewski, E.; Piotrowska-Długosz, A.; Lemańczyk, G. Properties of Alfisol and yield of spring barley as affected by catch crop. Zemdirbyste-Agric. 2015, 102, 23–30. [Google Scholar] [CrossRef]
  69. Wilczewski, E. The efficiency of nitrogen fertilization of spring wheat depending on seasonal rainfall. Am. J. Exp. Agric. 2013, 3, 579–594. [Google Scholar] [CrossRef]
  70. Schnecker, J.; Baldoszti, L.; Gündler, P.; Pleitner, M.; Sandén, T.; Simon, E.; Spiegel, F.; Spiegel, H.; Urbina Malo, C.; Zechmeister-Boltenstern, S.; et al. Seasonal dynamics of soil microbial growth, respiration, biomass, and carbon use efficiency in temperate soils. Geoderma 2023, 440, 116693. [Google Scholar] [CrossRef]
  71. Richardson, A.E.; Barea, J.M.; McNeill, A.M.; Prigent-Combaret, C. Acquisition of phosphorus and nitrogen in the rhizosphere and plant growth promotion by microorganisms. Plant Soil 2009, 321, 305–339. [Google Scholar] [CrossRef]
  72. Classen, A.T.; Sundqvist, M.K.; Henning, J.A.; Newman, G.S.; Moore, J.A.M.; Cregger, M.A.; Moorhead, L.C.; Patterson, C.M. Direct and indirect effects of climate change on soil microbial and soil microbial-plant interactions: What lies ahead? Ecosphere 2015, 6, 130. [Google Scholar] [CrossRef]
  73. Delttedesco, E.; Keiblinger, K.M.; Piepho, H.-P.; Antonielli, L.; Potsch, E.M. Soil microbial community structure and function mainly respond to indirect effects in a multifactorial climate manipulation experiment. Soil Biol. Biochem. 2020, 142, 107704. [Google Scholar] [CrossRef]
  74. Steinweg, J.M.; Dukes, J.S.; Paul, E.A.; Wallenstein, M.D. Microbial responses to multi-factor climate change: Effects on soil enzymes. Front. Microbiol. 2013, 4, 146. [Google Scholar] [CrossRef]
Figure 1. The content of total organic carbon, CORG (a), and total nitrogen, Nt (b), as affected by the catch crop management (mean values for the dates of sampling). A.I.—autumn incorporation of the catch crop, S.I.—spring incorporation of the catch crop, C—control (without the catch crop).
Agriculture 14 00898 g001
Figure 2. The MBC/CORG ratio in relation to catch crop management (mean values for sample collection times). We have used various lowercase letters to compare the catch crops treatments. Values followed by the same lowercase letter in the same year are not significantly different at p < 0.05. A.I.—autumn incorporation of the catch crop, S.I.—spring incorporation of the catch crop, C—control (without the catch crop).
Agriculture 14 00898 g002
Figure 3. The activity of invertase (INV) (a), β-glucosidase (βG) (b), and urease (UR) (c) in relation to the catch crop management and sample collection month (mean values for 2009–2011). We have used various lowercase letters to compare the catch crop treatments (in the same sampling date), and values followed by the same lowercase letter are not significantly different at p < 0.05. We have used various uppercase letters to show the differences between sampling months (within the same catch crop treatments), and values followed by the same uppercase letter are not significantly different at p < 0.05. Months: III—March, V—May, VI—June, VIII—August; A.I.—autumn incorporation of the catch crop, S.I.—spring incorporation of the catch crop, C—control (without the catch crop).
Agriculture 14 00898 g003
Figure 4. Soil respiration in relation to the catch management and sample collection month (mean values for the study years). We have used various lowercase letters to compare the catch crop treatments (for the same sampling date), and values followed by the same lowercase letter are not significantly different at p < 0.05. We have used various uppercase letters to show the differences between sampling months (within the same catch crop treatments), and values followed by the same uppercase letter are not significantly different at p < 0.05. Months: III—March, V—May, VI—June, VIII—August; A.I.—autumn incorporation of the catch crop, S.I.—spring incorporation of the catch crop, C—control (without the catch crop).
Agriculture 14 00898 g004
Figure 5. Principal component analysis of the studied soil properties; (a) plot of the first two principal components (PC) for the evaluated soil variables; TOC—total organic carbon, Nt—total nitrogen, soil respiration—Resp, CMC-cellulase—CEL, β-glucosidase—βG, invertase—INV, urease—UR, nitrate reductase—NR, ammonium-N—NH4, nitrate-N—NO3, as well as the content of microbial biomass C and N (MBC, MBN); (b) principal component analysis of the properties determined in the individual study years (2009, 2010, 2011).
Agriculture 14 00898 g005
Table 1. Microbial biomass carbon content (mg kg−1) in relation to the catch crop management and sample collection month.
YearsSampling
Month
& Autumn
Incorporation
Spring
Incorporation
ControlMean
2009^ March350.0 #ab*B424.2 aA338.7 bB371.0 AB
May387.0 abA409.6 aA361.9 bA386.2 A
June358.8 bB413.7 aA330.8 bB367.8 B
August357.6 bB389.1 aB322.3 cB356.3 B
Mean363.3 b409.1 a338.4 c370.3
2010March306.8 aB274.3 bC232.5 cC271.2 B
May303.9 aB305.9 aA266.5 bA291.8 A
June326.3 aA290.9 abB229.8 bC282.3 AB
August301.3 aB286.0 bB241.3 cB276.2 B
Mean309.6 a289.3 a242.5 b280.4
2011March269.3 aB274.6 aB199.0 bC247.6 C
May314.0 abA362.3 aA294.5 bA323.6 A
June271.7 abB266.5 aB197.5 bC245.2 C
August324.1 aA380.5 aA234.3 bB313.0 B
Mean294.8 b321.0 a231.3 c282.4
2009–2011March308.7 aB324.3 aB255.4 bB296.1 B
May335.0 bA359.0 aA307.6 cA333.9 A
June318.9 aAB323.7 aB252.7 bB298.4 B
August327.7 aA351.9 aA266.0 bB315.2 AB
Mean322.6 a339.7 a270.4 b310.9
^—sampling months, &—time of catch crop incorporation, # We have used various lowercase letters to compare the catch crop treatments (in the same sampling date). Values followed by the same lowercase letter within each row are not significantly different at p < 0.05. * We have used various uppercase letters to show differences between sampling months within the same catch crop treatments. Values followed by the same uppercase letter within each column are not significantly different at p < 0.05.
Table 2. Microbial biomass nitrogen content (mg kg−1) in relation to the catch crop management and sample collection month (means for 2009–2011).
Sampling
Month
& Autumn
Incorporation
Spring
Incorporation
ControlMean
^ March68.4 #b*A80.0 aA45.3 cB64.6 A
May66.9 bA74.0 aB52.3 cA64.4 A
June67.2 aA60.0 bC51.4 cA59.5 A
August68.7 aA60.2 bC53.4 cA60.8 A
Mean67.8 a68.6 a50.6 b62.3
^—sampling months, &—time of catch crop incorporation, # We have used various lowercase letters to compare the catch crops treatments (in the same sampling date). Values followed by the same lowercase letter within each row are not significantly different at p < 0.05. * We have used various uppercase letters to show a differences between sampling months within the same catch crop treatments. Values followed by the same uppercase letter within each column are not significantly different at p < 0.05.
Table 3. Soil ammonium-N content (mg kg−1) in relation to the catch crop management and sample collection month.
YearsSampling
Month
& Autumn
Incorporation
Spring
Incorporation
ControlMean
2009^ March0.91 #a*B1.04 aB0.68 bA0.88 B
May1.31 aA1.13 aB0.66 bA1.03 B
June1.45 bA2.62 aA0.67 cA1.58 A
August----
Mean1.22 b1.60 a0.67 c1.16
2010March0.61 aC0.65 aC0.35 bC0.54 C
May1.65 abA2.03 aA1.16 bB1.61 B
June1.35 aAB1.40 aB1.32 aA1.36 A
August1.16 aB0.87 bC1.49 aA1.17 BC
Mean1.19 a1.24 a1.08 b1.17
2011March0.62 aB0.31 bC0.40 bC0.44 BC
May1.67 abA2.34 aA1.02 bA1.68 A
June0.21 bC0.17 bC0.30 aC0.23 C
August0.88 aB0.82 aB0.86 aB0.85 B
Mean0.85 a0.91 a0.65 b0.80
2009–2011March0.71 aC0.67 aC0.48 bC0.62 C
May1.54 abA1.83 aA0.95 bAB1.44 A
June1.00 abB1.40 aB0.76 bB1.05 B
August1.02 abB0.85 bC1.18 aA1.02 B
Mean1.07 a1.19 a0.84 b1.03
^—sampling months, &—time of catch crop incorporation, # We have used various lowercase letters to compare the catch crop treatments (in the same sampling date). Values followed by the same lowercase letter within each row are not significantly different at p < 0.05. * We have used various uppercase letters to show a differences between sampling months within the same catch crop treatments. Values followed by the same uppercase letter within each column are not significantly different at p < 0.05.
Table 4. Soil nitrate-N content (mg kg−1) in relation to the time of catch crop incorporation and sample collection month.
YearsSampling
Month
& Autumn
Incorporation
Spring
Incorporation
ControlMean
2009^ March13.6 #a*B13.3 aB7.77 bB11.6 B
May47.4 aA32.2 bA26.6 cA35.5 A
June12.1 aB9.33 bB10.4 bB10.6 B
August----
Mean24.4 a18.3 b14.9 c19.2
2010^ March8.43 aAB9.92 aA7.42 bB8.59 A
May9.47 aA6.91 bB8.29 abA8.22 A
June8.18 aAB8.29 aAB8.32 aA8.26 A
August6.62 aB6.13 bB5.95 bB 6.23 B
Mean8.18 a7.81 b7.50 b7.83
2011March12.8 bC17.7 aC11.5 bC14.0 C
May58.7 aA54.6.aA31.0 bA48.1 A
June24.6 bB37.1 aB20.7 bB27.5 B
August14.0 aC14.7 aC10.9 bC13.2 C
Mean27.5 a31.0 a18.5 b25.7
2009–2011March11.6 aBC13.6 aC8.88 bC11.4 BC
May38.5 aA31.2 bA21.9 cAB30.5 A
June15.0 abB18.2 aB13.1 bB15.4 B
August6.87 bC10.4 aC8.44 abA8.57 C
Mean18.0 a18.4 a13.1 b16.5
^—sampling months, &—time of catch crop incorporation, # We have used various lowercase letters to compare the catch crop treatments (in the same sampling date). Values followed by the same lowercase letter within each row are not significantly different at p < 0.05. * We have used various uppercase letters to show a differences between sampling months within the same catch crop treatments. Values followed by the same uppercase letter within each column are not significantly different at p < 0.05.
Table 5. Nitrate reductase activity (mg N-NO2 kg−1 24 h−1) in relation to the catch crop management and sample collection month.
YearsSampling
Month
& Autumn
Incorporation
Spring
Incorporation
ControlMean
2009^ March2.69 #a*B2.52 aB2.25 bC2.49 B
May9.30 aA10.2 aA6.78 bA8.76 A
June8.63 aA8.06 aA5.10 bB7.26 A
August3.29 aB3.09 aB2.94 aC3.11 B
Mean5.98 a5.97 a4.27 b5.41
2010March2.54 aB2.74 aB2.24 aB2.50 B
May3.82 abA4.03 aA3.62 bA3.82 A
June3.11 aA3.05 aB2.26 bB2.81 B
August1.83 aB1.94 aC1.55 bC1.77 C
Mean2.83 a2.94 a2.41 a2.73
2011March4.14 aC4.42 aBC4.09 aB4.22 BC
May5.05 aB5.04 aB4.29 bB4.80 B
June3.84 aC3.76 aC2.78 bC3.46 C
August6.41 bA7.41 aA6.34 bA6.72 A
Mean4.86 ab5.16 a4.38 b4.80
2009–2011^ March3.12 aC3.23 aC2.86 aC3.07 C
May6.06 aA6.42 aA4.90 bA5.79 A
June5.19 aB4.96 ab3.38 bBc4.51 B
August3.84 abC4.15 aB3.61 bB3.87 BC
Mean4.55 a4.69 a3.69 b4.31
^—sampling months, &—time of catch crop incorporation, # We have used various lowercase letters to compare the catch crop treatments (in the same sampling date). Values followed by the same lowercase letter within each row are not significantly different at p < 0.05. * We have used various uppercase letters to show differences between sampling months within the same catch crop treatments. Values followed by the same uppercase letter within each column are not significantly different at p < 0.05.
Table 6. Cellulase activity (mg Gl g−1 h−1) in relation to the catch crop management and sample collection month.
YearsSampling
Month
& Autumn
Incorporation
Spring
Incorporation
ControlMean
2009^ March2.60 #a*B2.28 aC2.53 aB2.47 C
May5.84 aA6.90 aA5.70 aA6.15 A
June4.99 aA5.34 aB4.66 aA5.00 B
August4.84 aA4.59 aB4.21 aAB4.55 B
Mean4.57 a4.78 a4.28 a4.54
2010March7.38 abB8.22 Ba6.10 bB7.23 B
May7.61 abB8.37 aB6.94 bB7.64 B
June13.2 aA13.5 aA10.7 bA12.5 A
August13.1 aA13.3 aA10.6 bA12.3 A
Mean10.3 a10.9 a8.58 b9.92
2011March23.1 aA22.9 aA18.2 bA21.7 A
May7.64 aC7.59 aC6.65 bC7.30 C
June13.2 aB13.5 aB10.7 bB12.4 B
August8.44 aC8.21 aC8.33 aC8.33 C
Mean13.1 a13.1 a11.0 b12.4
2009–2011March11.3 aA11.1 aA8.94 bA10.4 A
May7.03 aB7.62 aB6.43 aB7.03 B
June10.4 aA10.76 aA8.64 bA10.0 A
August8.81 aAB8.76 aAB7.74 aAB8.44 AB
Mean9.39 a9.57 a7.94 b8.97
^—sampling months, &—time of catch crop incorporation, # We have used various lowercase letters to compare the catch crop treatments (in the same sampling date). Values followed by the same lowercase letter within each row are not significantly different at p < 0.05. * We have used various uppercase letters to show differences between sampling months within the same catch crop treatments. Values followed by the same uppercase letter within each column are not significantly different at p < 0.05.
Disclaimer/Publisher’s Note: The statements, opinions and data contained in all publications are solely those of the individual author(s) and contributor(s) and not of MDPI and/or the editor(s). MDPI and/or the editor(s) disclaim responsibility for any injury to people or property resulting from any ideas, methods, instructions or products referred to in the content.

