1. Introduction
In the contemporary world, the sustainability and efficiency of agricultural production have become a global focus [
1]. With the continuous growth of the population [
2] and the limited nature of land resources [
3], improving crop yield and quality, particularly in the domain of disease management, has emerged as a crucial direction for agricultural technological innovation [
4]. As a significant economic crop, peach trees and their fruits find extensive applications in food, medicine, and cosmetics, among other fields. However, peach trees are susceptible to various diseases during their growth. These diseases not only affect the yield and quality of the fruits but also lead to severe economic losses [
5]. Thus, the timely and accurate identification and management of peach tree diseases are of significant importance for ensuring agricultural production.
Johnson Kendall A. et al. [
6] discovered that the identification of phony peach disease (PPD) in the United States primarily relies on visual assessment. However, other diseases with symptoms similar to PPD can easily be misidentified as PPD, making identification challenging; Lou et al. [
7] detailed the major peach diseases in China, Spain, and the United States and employed LAMP-based methods to test peach disease pathogens. However, this approach requires stringent environmental conditions and incurs high costs; therefore, El-Kahlout, Mohammed I. et al. [
8] proposed a machine-learning-based method for identifying peach tree varieties. They collected a dataset of over two thousand images, which was split into a training set and a test set in a 7:3 ratio, ultimately achieving a 100% accuracy rate on the test set, but the tiny dataset size limits the model’s applicability. Gadade Haridas D. et al. [
9] introduced a machine-learning-based method for classifying diseases on tomato leaves. They compared methods such as Support Vector Machine (SVM) and Random Forest, demonstrating their model’s robustness, though this approach is not highly efficient.
Traditional disease identification methods largely rely on the experience and knowledge of agricultural experts, which is not only time-consuming and labor-intensive but also inefficient, hardly meeting the demands of large-scale agricultural production [
10]. With the rapid development of computer vision and deep learning technologies [
11], image-based disease identification methods offer new solutions for agricultural disease management. These technologies can automatically analyze crop images to identify and classify different types of diseases [
12], significantly enhancing the efficiency and accuracy of disease identification.
Alosaimi, Wael et al. [
13] utilized Visual Geometry Group (VGG-19) and Mask R-CNN structures for peach tree disease detection. To help farmers increase peach yield, they proposed the PeachNet network architecture, achieving a 94% accuracy rate, but the model’s accuracy in real-world conditions cannot be guaranteed. Zhang et al. [
14] integrated a convolutional neural network (CNN) with different models such as ResNet-34, AlexNet, VGG16, and ResNet-50 for peach tree disease detection. The experimental results showed that the integration with ResNet-34 was the most effective, reaching a 94.12% accuracy rate; Sun et al. [
15] proposed a dual-channel algorithm based on decoupled representation and classifiers. This algorithm uses transfer learning to enhance feature representation capabilities and utilizes two channels to separately focus on head and tail classes. The final classification results are obtained through a residual fusion mechanism. The experimental results show that the algorithm achieved a 94.27% accuracy rate on the test set. Yadav Saumya et al. [
16] proposed a convolutional neural network model to detect bacterial disease from peach leaf images, ultimately reaching a 98.75% accuracy rate on both laboratory and real cultivation field images. However, their dataset was small, compromising the model’s robustness.
Akbar Muneer et al. [
17] proposed a lightweight (WLNet) CNN model based on the VGG-19, trained on a dataset of 10,000 images. The experimental results showed their model outperformed four other CNN models, reaching 99%. Farman Haleem et al. [
18] introduced a robust disease detection method based on CNN, utilizing its powerful feature extraction capability for disease detection in fruit and leaf images. For better testing, they collected the dataset for this experiment from peach orchards and performed data augmentation and enhancement. By fine-tuning the EfficientNet model, they obtained the optimal model for peach tree disease detection, with an average accuracy rate of 96.6% on the test image set. Huang et al. [
19] proposed a peach disease detection method based on the aymptotic non-local mean (ANLM) image algorithm to address issues such as noise, background interference, and low detection rates in peach disease images. Their experiments showed this method to be an effective peach disease detection approach. Nabi Firasath et al. [
20] applied a wireless sensor network (WSN) to an apple disease detection system. Its flexibility has vast potential in apple farms, but the deployment cost and size of sensors remain significant challenges. Additionally, expert intervention is necessary in certain operations of the system.
Despite the significant achievements of deep learning in the field of image recognition [
21,
22,
23,
24,
25], challenges still exist in the identification and segmentation of peach tree diseases. Firstly, the appearance features of peach tree diseases are diverse, and the differences from normal leaves are sometimes not significant, increasing the difficulty of identification. Secondly, existing deep learning models still lack sufficient precision when dealing with highly similar disease images. Furthermore, due to the lack of high-quality annotated data, overfitting and other issues may arise during the model training process. In response to these challenges, this paper proposes a framework for peach tree disease identification and lesion segmentation based on deep learning and sensor systems. The main contributions and innovations of this study include the following.
Dataset construction and optimization: A large-scale dataset of peach tree disease images was collected and organized, including images from the West Campus of China Agricultural University, Zhuozhou Botanical Garden, and the Internet. Through a carefully designed collection process and high-standard data annotation strategy, the quality and diversity of the dataset were ensured, providing a solid foundation for the training of deep learning models.
Tiny feature attention mechanism: To enhance the model’s ability to recognize subtle features of peach tree diseases, a novel tiny feature attention mechanism was proposed. This mechanism can effectively capture the subtle differences between disease features, improving the model’s identification precision.
Aligned-head module: To address the issue of missing sensor information in web-crawled image data, the aligned-head module was designed to align sensor data with image data. Through this approach, the model can fully utilize sensor data, enhancing the accuracy and robustness of disease identification.
Transformer-based semantic segmentation network: An advanced Transformer architecture was adopted to build the semantic segmentation network. This network can more accurately segment lesion areas, providing a reliable basis for further analysis of diseases.
By applying these innovative techniques, this paper not only significantly improves the accuracy of peach tree disease identification and lesion segmentation but also provides an efficient, automated solution for agricultural disease management. It is believed that the findings of this study will have a significant impact on advancing the development of intelligent agriculture and improving the level of crop disease management.
3. Materials and Method
3.1. Dataset Collection
In this study, a comprehensive and in-depth peach tree disease image dataset was constructed with the aim of achieving the high-precision identification and segmentation of diseases through deep learning technologies. The construction of this dataset spanned from the autumn of 2023 to the spring of 2024, during which extensive use was made of on-site resources at the West Campus of China Agricultural University and Zhuozhou Experimental Garden, supplemented by images collected via Internet crawling. A variety of devices ranging from traditional high-definition digital cameras to modern drones equipped with multispectral cameras were utilized, ensuring images captured from different angles and resolutions comprehensively reflected the characteristics of the diseases. Specifically, image resolutions ranged from 1920 × 1080 to 4096 × 2160, with the intention of meeting the requirements of subsequent deep learning model processing. Through these devices, approximately 10,000 images were collected, covering 10 common types of peach tree diseases, including leaf spot and rust, with the number of images for each disease ranging from 600 to 1300, as shown in
Table 1 and
Figure 3.
Furthermore, to ensure the collected data could be directly applied to the training of deep learning models, the images underwent standardization processes, including resizing and format conversion, to meet the input requirements of the models. Considering the demand for a large volume of data by deep learning models, image augmentation techniques such as rotation and flipping were also employed to expand the dataset. Based on the data preprocessing, a thorough analysis was conducted on the collected data. Let the image set be denoted as
I, where each image
is associated with a series of labels and parameters, including disease type
T, collection time
t, and environmental parameters
. A function
f was defined to describe the distribution of various disease images in the dataset:
where
T represents the set of disease types, and
represents the set of natural numbers, indicating the number of images corresponding to each disease type. For the analysis of environmental parameters, an environmental parameter vector
was defined for each image
i, represented as
where
denotes the value of the
jth environmental parameter. To clarify further, these environmental parameters include, but are not limited to, temperature, humidity, light intensity, and CO
2 concentration, all of which are crucial factors affecting the growth and disease development of peach trees. Through the definitions and analysis of these mathematical models, not only can the structure and characteristics of the dataset be clearly understood, but a robust mathematical foundation was also provided for subsequent model training. Overall, the peach tree disease image dataset constructed in this study meets the demands of deep learning model training in terms of both quantity and quality, laying a solid foundation for the high-precision automatic identification and segmentation of peach tree diseases.
3.2. Dataset Annotation
In the research domains of deep learning and computer vision, dataset annotation constitutes a pivotal step in constructing high-quality datasets, directly influencing the effectiveness of model training and the performance of final applications. In this project, within the domain of peach tree disease identification, two principal annotation tasks were implemented: disease classification and the semantic segmentation of lesions. To ensure accuracy and consistency in the annotation process, a series of mathematical principles were employed to define, guide, and validate the annotation tasks.
The disease classification task required annotators to identify the type of disease present in an image. Assuming a set of images
I, each image
was to be labeled with a specific disease category
, where
T represents the set of all disease categories. This process is represented by a mapping function
f:
where
indicates that image
i has been labeled as belonging to disease category
t. To quantify the consistency of annotation, a consistency verification function
C was introduced, which, for any two annotation results
, is defined as
Here, if the two annotations agree; otherwise, it is 0. This approach provided a quantitative tool to assess the consistency between different annotators.
The task of semantic segmentation was more complex, requiring the precise outlining of diseased portions within an image. For each pixel
p in an image
i, an annotation function
g was defined:
where
P represents the set of pixels in image
i, and
indicates that pixel
p is part of a diseased area, whereas
indicates it is not. To evaluate the consistency of semantic segmentation annotations, a pixel-level consistency verification function
was defined for each image, calculating the proportion of pixel-level agreement between two annotations:
where
and
represent two independent annotation functions, and
is the total number of pixels in the image.
provided a score between 0 and 1, quantifying the pixel-level consistency between two independent annotations.
To ensure accuracy and consistency in annotation, beyond the mathematical models described, a series of standardization procedures were also implemented. Firstly, all annotators underwent specialized training to learn theoretical knowledge about disease identification and the use of annotation software. Secondly, to eliminate differences in subjective judgment, detailed annotation guidelines were developed for each disease, which were further elucidated with example images illustrating the typical features of each disease. Moreover, the annotation results for each image were subject to independent review by at least two annotators. In cases of discrepancy between two annotations, a final judgment was made by a third expert. This three-level review mechanism, combined with the aforementioned consistency verification functions, significantly enhanced the accuracy and consistency of the annotation results. In summary, through meticulous training, clear annotation guidelines, strict review mechanisms, and the application of mathematical principles, this project ensured high standards and quality in dataset annotation work, laying a solid foundation for subsequent deep learning model training and validation.
3.3. Data Augmentation
In the realm of deep learning, data augmentation is an effective technique for enhancing the generalization capability of models, especially in image processing tasks. In this study, three common data augmentation techniques were utilized—CutOut [
52], CutMix [
53], and Mixup [
54]—as shown in
Figure 4. These techniques aim to improve the model’s robustness and performance by increasing the diversity of training data without significantly enlarging the dataset size.
3.3.1. CutOut
CutOut is an effective data augmentation method that enhances a model’s generalization ability and robustness by randomly occluding parts of an image, thereby forcing the model to focus on other parts of the image. This method can be seen as a way to simulate occlusion, compelling deep learning models not to rely on localized features within an image, thereby enhancing the model’s ability to process occluded or incomplete images. Mathematically, given a training image
I with dimensions
(height × width), the CutOut operation can be defined as a function
, where
r is the center of the occlusion area,
l is the side length of the occlusion area (assuming the occlusion area is square), and
v is the pixel value used to fill the occluded area. The occluded image
can be calculated using the following formula:
where
represents the pixel location in the image, and
are the coordinates of the occlusion area’s center. This formula indicates that if a pixel lies within the occluded area, its value is set to
v; otherwise, the original pixel value remains unchanged. During the application of CutOut, the center of the occlusion area
r is usually randomly selected, meaning the occlusion’s location varies with each application. The size of the occlusion area
l and the fill value
v are also determined based on the specific task and experimental setup. Typically,
v can be set to 0 (black occlusion) or the global average value of the image to reduce the artificial noise introduced by the occlusion.
3.3.2. CutMix
CutMix, as an innovative data augmentation method, has attracted widespread attention since its introduction due to its unique way of enhancing diversity and the significant improvements in performance it brings. Unlike traditional data augmentation methods such as rotation, scaling, or flipping, CutMix increases training sample diversity by mixing regions between different images, aiming to create more diverse training samples and thereby improve model generalization and robustness. Specifically, a region from the first image is randomly selected and replaced with a region of the same size and location from a second image. This approach not only increases image data diversity but also requires the model to consider global information during training, rather than solely relying on localized features. Mathematically, given two images
and
, along with their corresponding labels
and
, the CutMix technique first randomly selects a region
R, defined by its top-left corner coordinates
and dimensions width
w and height
h. The new training sample
is then generated by swapping the region
R in
with the same location in
using the following mathematical formula:
where
denotes the pixel location within the image. Moreover, the label of the new sample is mixed based on the proportion
of area
R in image
:
The key to implementing CutMix lies in how to select the region R and calculate the mixing proportion . The selection of region R often relies on a random process to ensure diversity in the training data. The mixing proportion not only depends on the size of region R but also influences the degree of label mixing, thereby indirectly affecting the focus of model learning. The CutMix technique, through operations on both the input data and labels, not only significantly increases the diversity of training data but also enhances the model’s adaptability to complex data distributions.
3.3.3. Mixup
Mixup is a data augmentation technique widely used in deep learning training processes, based on the mathematical principle of assuming a linear data distribution. Specifically, if a model can effectively learn new samples generated through linear interpolation, it is also expected to perform well on the original data distribution. This assumption encourages the model to learn smoother decision boundaries, thus enhancing robustness to variations in input. Mathematically, the Mixup process is viewed as performing convex combinations in feature and label spaces, with the new samples introduced encouraging the model to consider a broader range of data distributions during training. Given two random training samples
and
, where
and
are image data, and
and
are the respective labels, Mixup defines a new training sample
through the following mathematical formulas:
where
is a mixing coefficient determining the proportion of the two original samples in the new sample.
is typically drawn from a distribution (such as the Beta distribution) to ensure diversity and randomness in the training process. Selecting an appropriate distribution to draw the mixing coefficient
is crucial in practice. Theoretically, Mixup, by encouraging the model to consider more virtual samples between classes during training, helps reduce the model’s tendency to overfit to noisy data, improving generalization to unseen samples. Moreover, Mixup encourages the learning of smoother decision boundaries, which can be interpreted as enhancing model robustness to a certain extent.
3.4. Proposed Method
3.4.1. Overview
An innovative framework for peach tree disease recognition and lesion segmentation is proposed in this paper, aiming to enhance recognition accuracy and segmentation performance in complex agricultural scenarios through deep learning techniques and data fusion strategies. The framework’s core components include a tiny feature attention mechanism backbone network, an aligned-head module, a Transformer-based semantic segmentation network, and an alignment loss function. These components work in synergy to optimize the model’s capability to capture subtle disease features, integrate sensor and image data, and enhance segmentation task performance. The tiny feature attention mechanism enhances the model’s ability to recognize disease details by emphasizing key features in images; the aligned-head module addresses missing sensor data issues by generating the missing sensor information to make full use of the web-crawled image data; the Transformer-based semantic segmentation network effectively processes the contextual information of images through a self-attention mechanism, improving segmentation precision; and the alignment loss function focuses on optimizing the consistency between image and sensor data, further enhancing the model’s overall performance. The introduction of this framework offers an effective technical path for agricultural disease detection and segmentation, with the potential for widespread application in actual agricultural production.
3.4.2. Tiny Feature Attention Mechanism Backbone Network
In this study, a tiny feature attention mechanism backbone network (tiny feature attention, TFA) is proposed to enhance the accuracy of peach tree disease detection, as illustrated in
Figure 5.
Compared to traditional deep learning model backbones, the TFA network places more emphasis on extracting and utilizing subtle features in images, especially effective in handling tiny lesions common in agricultural images, thereby significantly enhancing the model’s perceptual capabilities. The core idea of the TFA network is to introduce an attention mechanism for subtle features, which can automatically learn and emphasize features important for classification or segmentation tasks while suppressing irrelevant information. Specifically, the TFA network comprises the following key parts:
Feature extraction layer: Multiple convolutional and pooling layers are utilized to extract basic features from images. To ensure the capture of more detailed image features, smaller convolutional kernels (e.g., ) and deeper network structures are adopted.
Tiny feature attention module (TFAM): This module is the core of the TFA network, designed to weigh the extracted feature maps to highlight those subtle features critical for the current task. TFAM’s implementation is based on a self-attention mechanism, allocating attention weights by learning the dependencies between different positions in the feature map. The mathematical expression is as follows:
where
F represents the input feature map,
and
are the weight matrix and bias term, respectively, and
A is the computed attention map.
Feature fusion and classification (or segmentation): Features processed by the TFAM module are further fused and processed, and the final results are output through a fully connected layer (for classification tasks) or convolutional layer (for segmentation tasks).
The optimization goal of the TFA network is to maximize the model’s response to key features while minimizing the response to background or non-critical features. This can be achieved through the following loss function:
where
is the loss function for the primary task (classification or segmentation),
is the regularization term for the attention mechanism, and
is a balancing coefficient. Through this approach, the model automatically learns during training which features are more important for the task, subsequently assigning higher attention weights during prediction. Compared to other deep learning model backbones, the design of the TFA network focuses more on capturing subtle differences in images, which is particularly important for agricultural image processing. In tasks such as peach tree disease detection, diseases often manifest as minor changes in images, and traditional network models might struggle to effectively recognize these subtle changes due to limitations in their receptive fields. By introducing a subtle feature attention mechanism, the TFA network can automatically identify and emphasize these key subtle differences at the feature level, thereby enhancing model recognition accuracy. Furthermore, another advantage of the TFA network is its generalization ability. Through the in-depth learning of subtle features, the model adapts better to minor variations in images, allowing the TFA network to maintain high recognition accuracy across images of peach trees taken in different environments, significantly improving the model’s stability and reliability in practical applications.
3.4.3. Aligned-Head Module
In the task of agricultural disease recognition, sensor data (such as temperature, humidity, light intensity, etc.) along with image data serve as important components of the model input, providing essential information about the crop growth environment, and significantly impacting disease recognition. However, especially when utilizing Internet-crawled image data in practical applications, these images often lack corresponding sensor data. To overcome this issue, an aligned-head module can be designed that is capable not only of aligning image and sensor data but also generating missing sensor data when necessary, thereby enhancing the model’s recognition accuracy and generalization capability.
Assuming there is an image dataset I and a corresponding sensor data set S, where a portion of the images lack corresponding sensor data , the objective of the aligned-head module is to generate a mapping , predicting the corresponding sensor data for any given image i. The input to this module includes the image data i and available sensor data s (if present), while its output is the aligned or generated sensor data . The specific processing flow is as follows:
Feature extraction: Deep features are extracted from the image i, using a pretrained CNN model (such as ResNet) for feature extraction.
Sensor data prediction: If the image i lacks sensor data s, a regression model (fully connected network) is used to predict the sensor data based on the image features.
Data alignment: If the image i has corresponding sensor data s, a direct data alignment operation is performed to ensure that the image data and sensor data are matched before being input into the model.
Assume that the features of image
i are
, the regression model is
f, and the generated sensor data are
, where
f can be represented as
Here, W and b are, respectively, the weight and bias of the regression model. The rationale behind designing this module includes:
Data integrity: By generating missing sensor data, the aligned-head module ensures the model can utilize the completeness of environmental and image information, improving recognition accuracy.
Model generalization capability: through aligning and generating sensor data, the model can better generalize to new, unseen image data, enhancing the model’s application capability in different environments.
Flexibility: This module provides a flexible solution for processing Internet-crawled images, enabling effective disease recognition even in the absence of sensor data.
3.4.4. Transformer-Based Semantic Segmentation Network
In the task addressed in this paper, a Transformer-based semantic segmentation network is designed, as shown in
Figure 6.
This mechanism enables the network to calculate the impact of each position on every other position, thereby capturing global information. By introducing a Transformer-based network into the semantic segmentation task, its capability to process long-distance dependencies enhances the model’s understanding of the context in images, thereby improving the accuracy and efficiency of segmentation. This is particularly important in handling complex peach tree disease images, as the disease features often depend on global information for accurate identification and segmentation. The network primarily consists of two parts: encoder and decoder. The encoder is responsible for extracting feature representations of the image, while the decoder classifies pixels based on these features, achieving precise lesion segmentation. A multi-layer Transformer structure is used as the encoder, each layer containing multi-head self-attention mechanisms and feed-forward neural networks. Setting the number of layers in the encoder as
and the dimension of each layer as
and stacking multiple Transformer layers gradually enhances the model’s ability to abstract image features. Specifically, the output of the
lth layer Transformer can be represented as
where
is the result of the initial linear projection of the input image, and
is the output feature of the
lth layer. The decoder part adopts a structure similar to the encoder but introduces skip connections from the encoder to each Transformer layer in the decoder to retain rich feature information extracted from the input image. We set the number of layers in the decoder as
, and the dimension of each layer as
. Each layer of the decoder receives features from the corresponding layer of the encoder, thereby utilizing global and local information captured by the encoder to improve the precision and efficiency of segmentation. The output of the
lth layer decoder can be represented as
where
represents features from the
lth layer of the encoder and
is the final feature passed from the encoder. Compared to traditional semantic segmentation networks such as UNet, the Transformer-based network has the following advantages:
Capturing long-distance dependencies: The Transformer, through its self-attention mechanism, can capture the relationship between any two points in an image, which is crucial for understanding the global structure of the image, thereby improving segmentation accuracy.
Parallel computing: Another advantage of the Transformer structure is its parallel computing capability, which is especially important for processing large-scale image datasets, significantly improving training and inference efficiency.
Flexibility and scalability: The flexibility and scalability of the Transformer structure allow for easy adaptation to different task requirements by adjusting the number of layers and dimensions or by introducing new modules, providing convenience for subsequent model optimization and improvement.
3.4.5. Alignment Loss
In this paper, for the task of peach tree disease recognition and segmentation, a novel loss function—alignment loss function—is proposed. This loss function is designed to address the deficiencies of traditional Transformer network loss functions in processing the fusion of image data and sensor data, aiming to achieve higher accuracy in disease recognition and segmentation. The core idea of the alignment loss function is to minimize the distance between the features of image data and sensor data in the embedding space. Specifically, its mathematical formula can be expressed as
where
N is the number of samples in the batch;
and
represent the image data and corresponding sensor data of the
ith sample, respectively;
and
are the feature extraction functions for image data and sensor data, respectively; and
denotes the squared Euclidean distance.
In the task of peach tree disease recognition and segmentation, image data provide visual information about the disease, while sensor data provide auxiliary information related to the disease occurrence environment. These two types of information are inherently complementary, but in traditional deep learning models, they are often processed separately, preventing the model from fully utilizing these complementary information. The alignment loss function, by minimizing the distance between the features of image data and sensor data in the embedding space, encourages the model to learn a feature representation that effectively integrates both types of information, thereby improving the accuracy of disease recognition and segmentation. Traditional Transformer models typically employ the cross-entropy loss function as the optimization objective, which has been proven effective in many tasks. However, the cross-entropy loss mainly focuses on the match between the model output and the true labels, neglecting the efficiency of the model in utilizing the features of the input data; especially when the task involves the fusion of multimodal data, the cross-entropy loss cannot directly promote the alignment and fusion of features from different modalities. The introduction of the alignment loss function has the aim of solving this issue. Unlike the cross-entropy loss, which relies solely on the model output, the alignment loss function directly acts at the feature level, compelling the model to learn a feature representation that effectively integrates image and sensor data. This design gives the alignment loss function a clear advantage in tasks involving the fusion of multimodal data.
3.5. Experimental Setup
3.5.1. Hardware and Software Configuration
The experiments in this study were primarily conducted on a high-performance computing server equipped with an NVIDIA Tesla V100 GPU (Beijing, China). This GPU, featuring 32 GB of GDDR5 memory, provides the computational power necessary for training complex deep learning models. The V100 GPU, widely used in deep learning research, is particularly suited for handling large datasets and models, significantly accelerating the training and inference process. The server’s CPU, an Intel Xeon Gold 6154, has 18 cores and 36 threads, operating at 3.0 GHz, offering robust support for data processing and model training. With 256 GB of system memory, ample memory space is ensured for processing large datasets. Such hardware configuration not only reduces model training time but also enhances the efficiency of the experiments.
Ubuntu 18.04 LTS was selected as the operating system, a stable and widely supported Linux distribution suitable for scientific research and deep learning applications. Built upon this foundation, PyTorch 1.8 was chosen as the deep learning framework, with Python version 3.8. PyTorch being widely applied in both academia and industry for its dynamic computation graph and user-friendly interface, offering a rich set of APIs and tools for model design, training, and evaluation. Within the PyTorch framework, several key library functions were primarily utilized for building and training models:
“torch.nn”: This module contains all components required for constructing neural networks, including various types of layers (convolutional layers, pooling layers, fully connected layers, etc.), activation functions, and loss functions.
“torch.optim”: This module provides various optimization algorithms to update network weights, such as SGD and Adam. In this study, the Adam optimizer [
55] was predominantly used for model training.
“torchvision”: An extension of PyTorch, torchvision offers tools for loading and processing image datasets, pre-trained models, and common data transformation operations.
Moreover, to implement data augmentation, the “torchvision.transforms” module was used for various data preprocessing and augmentation techniques, such as random cropping, rotation, normalization, etc. These techniques effectively enhance the model’s robustness to image transformations and increase the diversity of training data.
3.5.2. Training Parameters
In this study, to address the problem of peach tree disease identification and segmentation, deep learning models were employed. A series of meticulous parameter configuration strategies were adopted to ensure the effectiveness and accuracy of model training. The batch size, a crucial hyperparameter in deep learning training, directly affects the stability and efficiency of model training. In our experiments, the batch size was set to 32. This choice is based on considerations of fully utilizing the GPU’s parallel computing capabilities to accelerate the training process and balancing the search between global and local optima, also considering the limitations of GPU memory capacity. Through comparative experiments, it was found that setting the batch size to 32 under the current hardware configuration allowed for optimal stability and convergence speed of model training. To comprehensively evaluate the model’s generalization ability, the five-fold cross-validation method was employed. Specifically, the entire dataset was randomly divided into five equally sized subsets, with each experiment using four subsets as the training set and the remaining one as the test set. This process was repeated five times, each time with a different subset used as the test set, ensuring every subset had the opportunity to be used as the test set. Five-fold cross-validation not only improves the reliability of model evaluation but also effectively reduces the impact of data partitioning on experimental results, making model performance assessment more objective and accurate.
The Adam optimizer was chosen for parameter optimization during model training, combining the advantages of Momentum and RMSprop optimizers. It adapts the learning rate across different parameter space dimensions, thereby accelerating model convergence. The initial learning rate was set to 1 × 10, chosen to balance stability and efficiency at the beginning of model training. Given the significant impact of the learning rate on training outcomes, strategies for learning-rate warm-up and dynamic adjustment were also applied. Learning-rate warm-up involves gradually increasing the learning rate at the start of training, stabilizing the model in the early stages, and avoiding instability due to a high learning rate. After the warm-up phase, the learning rate was dynamically adjusted based on changes in training loss, decreasing the learning rate during plateaus to fine-tune model parameters and seek optimal solutions.
3.5.3. Evaluation Metric
In the realm of deep learning models, especially within image processing, selecting appropriate evaluation metrics is crucial for assessing and comparing model performance. This study, aimed at classifying peach tree diseases and segmenting lesions, employs precision, recall, accuracy, and mean intersection over union (mIoU) as evaluation metrics.
Precision reflects the proportion of samples correctly predicted as positive by the model among all samples predicted as positive. It illustrates the model’s accuracy in positive class prediction. Precision is calculated as
where
(True Positive) represents the number of true positive samples, and
(False Positives) denotes the number of false positive samples. As a critical metric, precision focuses on the model’s ability to accurately identify positive samples. In practical applications, high precision, indicating a low False Positive rate, is essential for tasks where accurate prediction of the positive class is paramount.
Recall indicates the ratio of samples correctly predicted as positive by the model to all actual positive samples, measuring the model’s capability to capture positive samples. The formula for recall is
with
(False Negative) being the number of false negative samples. Recall assesses the model’s performance from another perspective: its ability to identify all positive samples. For tasks demanding minimal missed detections, missing any positive sample could have severe implications, making recall a vital performance metric.
Accuracy, the most intuitive performance metric, represents the proportion of samples correctly predicted by the model among all samples. Its formula is
where
(True Negative) is the number of true negative samples. Accuracy provides an overview of the model’s overall performance by comparing the number of correctly predicted samples (regardless of class) to the total number of samples. Although it is a useful tool under balanced sample distribution, its reliability may be overly optimistic in cases of class imbalance.
For semantic segmentation tasks, mIoU serves as a common metric, quantifying the similarity between model-predicted segmentation masks and actual masks. It averages the intersection over union across all categories:
where
N denotes the number of categories, and
,
, and
are the quantities of True Positives, False Positives, and False Negatives for the
category, respectively. mIoU measures the accuracy of model segmentation, considering the impact of false positives and negatives at the pixel level.
In summary, by utilizing a combination of precision, recall, accuracy, and mIoU, the performance of peach tree disease identification and segmentation models can be thoroughly evaluated. These metrics reflect model performance from various angles, identifying strengths and weaknesses and providing guidance for further optimization. The thoughtful selection and consideration of these metrics during model development and evaluation are crucial for enhancing model utility and reliability.
3.6. Baseline Model
In the field of deep learning, especially for specific image processing tasks, selecting an appropriate model architecture is crucial. To comprehensively assess the effectiveness of the proposed method for peach tree disease identification and segmentation, a series of deep learning models known for their broad representativeness and excellent performance in image classification and segmentation tasks were selected as baselines. The baseline models chosen for this study include AlexNet [
56], VGGNet [
57], ResNet [
58], and EfficientNet [
59] for disease detection, as well as UNet [
60], UNet++ [
61], and SegNet [
62] for lesion segmentation, each demonstrating outstanding performance and wide applicability in their respective application scenarios.
3.6.1. Baseline Model for Disease Detection
For disease detection, AlexNet, one of the pioneering works in deep learning for image classification, comprises five convolutional layers and three fully connected layers. It introduced the ReLU activation function to effectively address the vanishing gradient problem and employed Dropout and data augmentation techniques to mitigate overfitting. Its mathematical representation can be simplified as
where
and
represent the network weights and biases, respectively;
x is the input image; and
denotes the model output.
VGGNet significantly increased network depth and enhanced the model’s ability to capture image details by replacing large convolutional kernels with multiple successive tiny (
) kernels. A typical representative of VGGNet is VGG-16, consisting of 13 convolutional layers and three fully connected layers. Its simplified mathematical representation is
where
represents features after 13 convolutional layers and
denote operations of the three fully connected layers.
GoogLeNet introduced the Inception module, which captures image information at various scales through parallel convolutional and pooling operations of different sizes, effectively increasing the network’s width and depth. It balances depth and computational efficiency. The core idea of the Inception module can be expressed as
where
x is the input feature and Conv and Pool represent convolutional and pooling operations, respectively, with
indicating the concatenation of features.
ResNet addresses the vanishing gradient problem in deep neural networks by introducing residual blocks, allowing the network to achieve unprecedented depth. The basic idea of a residual block is that the input is not only directly passed to the next layer but also added to the output of subsequent layers via a skip connection. The mathematical representation of a residual block is
where
x and
y are the input and output of the residual block, respectively, and
represents the residual mapping, with
denoting the weights of the convolutional layers.
EfficientNet, through a systematic model scaling method, balances the network’s depth, width, and input image resolution, achieving significant performance improvements while maintaining computational efficiency. The core of EfficientNet is to uniformly scale dimensions of depth, width, and resolution using a compound coefficient, optimizing the use of additional computational resources, though its specific mathematical formulas are complex. The core idea is to efficiently utilize additional computational resources by optimizing scaling dimensions.
3.6.2. Baseline Model for Lesion Segmentation
Designed specifically for medical image segmentation, the UNet model, with its U-shaped structure consisting of symmetric contraction and expansion paths, excels at capturing fine details within images. This is achieved by incorporating skip connections from the contraction path into the up-sampling part of the model. The core mathematical model of UNet encapsulates the encoding of features through successive convolutional and pooling layers, followed by decoding through up-sampling layers and convolutional layers, culminating in the fusion of features via skip connections. UNet++ further refines the architecture of UNet by introducing nested residual pathways within the skip connections, enhancing the transmission and fusion of features. This modification improves the model’s ability to capture image details, especially in segmenting image edges. SegNet focuses on pixel-wise image classification, distinguished by its encoder–decoder architecture. The encoder utilizes the first 13 convolutional layers of the VGG16 model for feature extraction, while the decoder up-samples the feature maps to restore them to their original resolution. In the decoder, SegNet employs max-pooling indices for non-linear up-sampling, effectively reducing the model’s parameter count while preserving essential feature information.
From the perspective of application breadth and model adaptability, these models have demonstrated commendable performance across various domains and tasks. Their application extends beyond traditional image classification and semantic segmentation tasks, successfully encompassing more complex visual tasks such as object detection and instance segmentation. This wide range of applications indicates the models’ strong generalization capabilities and adaptability, providing robust support for addressing the challenges of peach tree disease detection and lesion segmentation presented in this study. Moreover, evaluating and comparing the proposed method against these classic and cutting-edge models allows for a more comprehensive and impartial assessment of the method’s performance. Such comparisons not only validate the advantages of the proposed method against the backdrop of existing technologies but also reveal potential areas for improvement and application prospects. Through meticulous mathematical analysis and experimental validation, it is anticipated that a deeper understanding of the advantages and potential of the proposed method in peach tree disease identification and segmentation tasks will be gained, further advancing the application and development of deep learning technologies in the agricultural sector.
4. Results and Discussion
4.1. Disease Detection Results
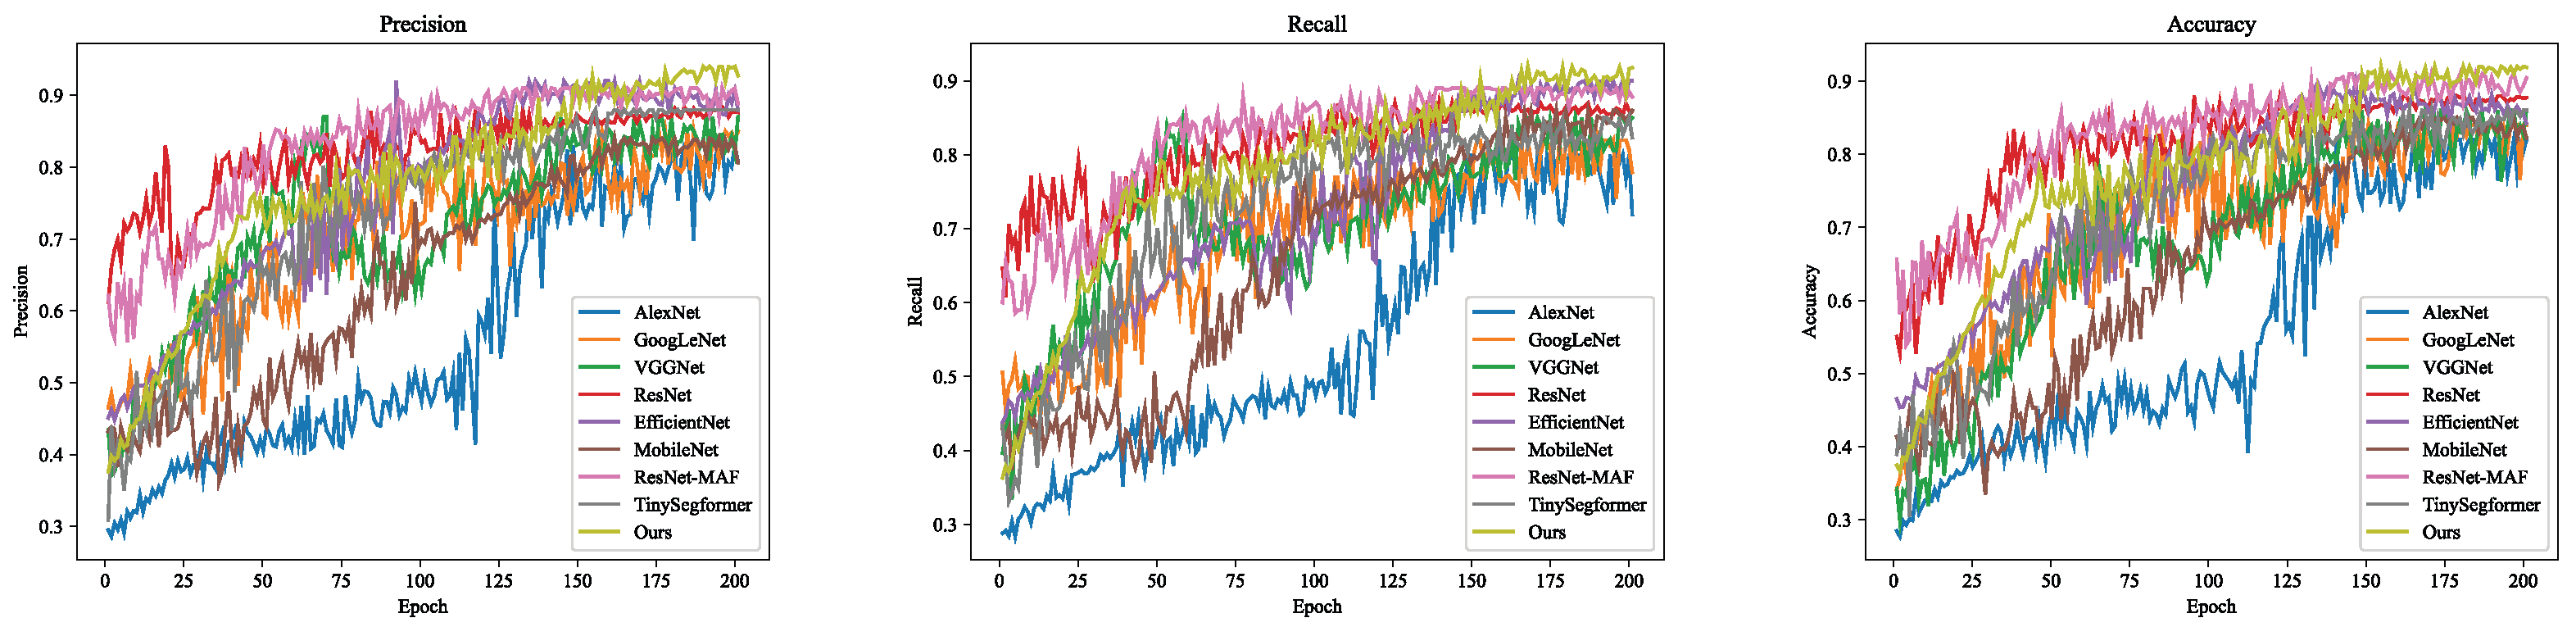
In this section, the efficacy and superiority of the proposed method are demonstrated by comparing the performance of various deep learning models in the task of detecting diseases in peach trees. The core purpose of the experimental design is to show that by integrating advanced deep learning architectures and optimization algorithms, the precision, recall, and accuracy of disease detection can be significantly improved. By comparing the proposed method with other mainstream models and models specifically developed for agricultural disease detection, this paper not only showcases the performance of each model but also delves into the reasons behind these performance differences, as shown in
Table 2 and
Figure 7.
The experimental results indicate that the proposed method achieved the highest performance in terms of precision, recall, and accuracy, with values of
,
, and
, respectively, and also demonstrated good performance in processing speed (FPS, frames per second). This result significantly outperforms mainstream deep learning models. including AlexNet, GoogLeNet, VGGNet, ResNet, EfficientNet, and MobileNet, as well as two methods specifically designed for agricultural disease detection: [
63,
64]. Analyzing from the design of the models, AlexNet, as an earlier deep learning model with a structure of five convolutional layers and three fully connected layers, often underperforms on complex or diverse agricultural image data due to its relatively shallow model. Its precision, recall, and accuracy are
,
, and
, respectively, reflecting the limitations in feature extraction and generalization capabilities. GoogLeNet, by introducing the Inception module, allows the model to capture image features at different scales, slightly outperforming AlexNet with a precision of
and an accuracy of
. VGGNet enhances the capture of image details through the use of multiple consecutive small convolution kernels, increasing the network depth, which further boosts the precision, recall, and accuracy to
,
, and
, respectively. ResNet addresses the issue of gradient vanishing in deep network training through residual learning, allowing the network to be built deeper and be able to more effectively learn complex image features, resulting in a precision of
and an accuracy of
. EfficientNet significantly enhances model performance and efficiency by systematically balancing network width, depth, and the scale of input image resolution, achieving a precision of
and an accuracy of
. MobileNet, due to its lightweight features, has a higher FPS on mobile devices but slightly lower precision at
, recall at
, and accuracy at
.
For methods specifically developed for agricultural disease detection, [
63]’s model achieves high levels of precision, recall, and accuracy (
,
, and
respectively), showcasing the advantages of its targeted design. Ref. [
64] employs the newer Transformers architecture to handle more complex backgrounds and subtle features, achieving a precision of
and accuracy of
, demonstrating the potential of Transformers in image processing. Theoretical analysis reveals that the proposed model achieves the best results across all metrics due to the integration of various advanced technologies and customized loss functions, which enhance the model’s sensitivity and recognition capabilities toward disease features. The tiny feature attention (TFA) mechanism enhances recognition precision by focusing on minute features in images; the aligned-head module improves the model’s ability to handle incomplete data by addressing missing sensor data; and the Transformer-based semantic segmentation network effectively processes contextual information within images through its self-attention mechanism, enhancing segmentation accuracy. The alignment loss function further optimizes the consistency between image and sensor data, improving the model’s stability and accuracy under varying environmental conditions. In summary, this research not only theoretically verifies the effectiveness of the proposed method but also demonstrates its superiority in practical applications through experimental results. Future work will continue to optimize the model architecture and data processing strategies to further enhance system performance and application universality, aiming to make a greater impact in the field of agricultural disease management.
4.2. Lesion Segmentation Results
The purpose of this chapter’s experiment was to evaluate and compare the effectiveness of various deep learning models on the task of peach tree lesion segmentation, to determine which model is most suited for this specific application scenario. By comparing the performance of different models, guidance is provided for subsequent research and references for model selection in practical applications. The experimental results are shown in
Table 3 and
Figure 8.
As can be observed from the table, the method proposed in this paper surpasses other models across all evaluation metrics, especially in mIoU, achieving a high score of 0.94. This indicates a significant advantage of this method in terms of segmentation accuracy. SegNet, a typical encoder–decoder architecture, utilizes the first 13 convolutional layers of the VGG16 model to extract image features during the encoding phase and upsamples the image resolution in the decoding phase. A notable characteristic of SegNet is its use of max-pooling indices for upsampling during the decoding process, effectively reducing the number of model parameters. Although SegNet demonstrates certain advantages in preserving edge information, its relatively simple structure may not be precise enough for complex image segmentation tasks, especially in restoring details in disease areas. UNet is characterized by its symmetric “U” shaped design, comprising a downsampling encoder and an upsampling decoder, with skip connections directly transferring features between them. This design makes UNet exceptionally adept at capturing both local and global information in images, achieving impressive performance in image segmentation tasks. Favored especially in the field of medical image segmentation, UNet’s high sensitivity to small regions and details also makes it suitable for agricultural disease segmentation tasks. UNet++ improves upon UNet’s structure by introducing nested and dense skip connections to further enhance feature transmission and fusion. This improved design addresses the shortcomings of traditional UNet in handling multi-scale features, increasing model performance in detail restoration and edge precision. The method presented in this paper, by integrating the tiny feature attention mechanism, aligned-head module, and a Transformer-based semantic segmentation network, proposes an innovative approach for peach tree disease segmentation. The core advantage of this method lies in its more effective capture and utilization of subtle features within images and optimizing the segmentation process through deep feature fusion and attention mechanisms. Consequently, it surpasses traditional deep learning models in precision, recall, and mIoU.
Differences in feature fusion capability: The aligned head, through deep integration of sensor and image data, provides a richer and more detailed feature representation. This deep fusion strategy enables models to better understand and process complex image content, especially in identifying and segmenting small or blurred lesions. The additional information and contextual understanding provided by the aligned head significantly enhance model performance.
Optimization of attention mechanisms: Compared to traditional MLP-head and basic multi-head mechanisms, the aligned head employs a more advanced attention mechanism. This not only strengthens the model’s ability to capture key features but also optimizes the model’s information processing flow. By focusing on key features and effectively suppressing background noise, the aligned head accurately locates and identifies disease features.
Data alignment and generation capability: For images crawled from the Internet that lack sensor data, the aligned head generates the missing sensor information, achieving effective alignment of image and sensor data. This innovative data alignment and generation capability greatly expands the range of data the model can process.
4.3. Analysis of Detection Results
The presentation of the results from the aforementioned experiments was conducted by displaying the average values of each metric to compare the performance of various models, with comparative data between the proposed method and known methods listed in tables. It is believed that this approach provides an intuitive display of the performance of various methods under the same evaluation criteria, facilitating a quick understanding and assessment of the strengths and weaknesses of these methods. Additionally, more comparative methods have been included, such as MobileNet, ResNet-MAF, and TinySegformer. By comparing these methods specifically targeted at agricultural disease detection, it is hoped that the performance characteristics of the proposed method can be demonstrated. Furthermore, as shown in
Table 3, the proposed method achieved an mIoU of
in the disease segmentation task, while UNet++ and UNet reached mIoUs of
and
, respectively. Although these differences might seem small numerically, such improvements are significant in the fields of deep learning and image segmentation. mIoU, an important performance metric in image segmentation tasks, measures the degree of overlap between the model’s predicted segmentation mask and the true mask. Even a few percentage points of improvement can significantly enhance the quality of segmentation, particularly in recognizing complex backgrounds or subtle features. Additionally, in practical agricultural applications, a higher mIoU implies more accurate disease detection and quantitative analysis, which has practical application value for early disease identification and treatment. To further substantiate these conclusions, a statistical significance analysis (ANOVA) was conducted on the experimental results to verify whether the performance differences between the models are statistically significant. The experimental outcomes are depicted in
Figure 9 and
Figure 10.
4.4. Loss Function Ablation Experiment
In this chapter, the main purpose of the experiment is to verify the effectiveness of the proposed alignment loss function in enhancing model performance by comparing the performance of different loss functions in disease detection and lesion segmentation tasks. The design of the loss function, a core part of training deep learning models, directly impacts the efficiency of model learning and final performance. This ablation experiment deepens the understanding of the specific impact of different loss functions on model performance, thereby providing a theoretical basis and practical guidance for selecting the appropriate loss function. Three different loss functions were selected for comparison in the experimental design, including the traditional cross-entropy loss, the focal loss designed for imbalanced data, and the alignment loss proposed in this paper. Each loss function was applied to both disease detection and lesion segmentation tasks, with experimental results shown in
Table 4.
The results from the experiment indicate that, compared to cross-entropy loss and focal loss, alignment loss achieved higher precision, recall, and accuracy/mIoU in both disease detection and lesion segmentation tasks. This is primarily due to alignment loss’s design consideration of the distinctiveness between disease features and background features, as well as the consistency between image and sensor data, enabling the model to more effectively learn disease recognition and segmentation. Specifically, alignment loss emphasizes the difference between disease features and normal features and optimizes model handling of consistency between image and sensor data, enhancing the model’s sensitivity and accuracy in disease feature recognition. Mathematically, this is achieved by introducing additional regularization terms or weighting factors that consider the unique properties of the data and task requirements, thus providing a more effective learning direction for the model.
4.5. Test on Other Dataset without Sensor Data
In this section, the main objective of the experiment is to validate and evaluate the performance of the proposed model in detecting diseases using only image data, without the support of sensor data. This experiment is particularly important because, in many real-world application scenarios, especially in resource-limited or technically constrained agricultural environments, obtaining sensor data can be challenging. Therefore, by testing the model on additional datasets lacking sensor data, a comprehensive understanding of the model’s applicability and flexibility, as well as the potential limitations and challenges during actual deployment, can be obtained. Two different datasets were used for testing: Kaggle’s Wheathead detection dataset and Plantdoc’s plant disease detection dataset.
The experimental results presented in
Table 5 show that in Kaggle’s Wheathead detection task, the model achieved a precision of 0.71, a recall of 0.73, and an accuracy of 0.71. In the Plantdoc plant disease detection task, the model significantly improved, achieving a precision of 0.96, a recall of 0.93, and an accuracy of 0.94. These results reveal differences in model performance across various tasks and data conditions and reflect the model’s ability to process different types of disease image data. Theoretically, the model’s poor performance in the Wheathead detection task might be associated with the characteristics of the dataset and the complexity of the task. Detecting wheat heads involves identifying morphologically similar wheat heads against a variable background, which poses higher demands on the model’s visual recognition and generalization capabilities. Without the support of sensor data, such as environmental parameters like light conditions and humidity, the model must rely entirely on visual information from images, which may limit its recognition accuracy. In contrast, the Plantdoc dataset’s plant disease detection task may feature more visually distinct and distinguishable disease characteristics, allowing the model to achieve high precision in recognition even without sensor data.
Regarding the discussion on the performance of the proposed method without sensor data, while the model demonstrated excellent performance on the Plantdoc dataset, proving its effectiveness under certain conditions, the performance in the Wheathead detection task suggests that the model may require further optimization or adjustment to adapt to complex or variable environmental conditions in agricultural scenarios where sensor data are unavailable. In practical agricultural applications, the availability of sensor data greatly influences the practicality and effectiveness of the model. Sensor data provide crucial information about the crop growing environment, such as temperature, humidity, and light, which helps the model more accurately interpret and classify image data. Therefore, in agricultural applications, the suitability and importance of sensor data depend on the specific task and environmental conditions. Where possible, combining sensor and image data for disease detection can undoubtedly provide more accurate and stable results. However, in resource-limited or technologically under-equipped scenarios, developing and optimizing models that can perform excellently based solely on image data holds significant practical application value. Future research should focus on improving model robustness and accuracy under various conditions, including without sensor data, to ensure its effectiveness and reliability across a broad range of agricultural settings. Additionally, exploring how to enhance image data processing capabilities in the absence of sensor support is another important direction for future research.
4.6. Test on Mobile Platform
In this section, the primary objective of the experiment is to test and demonstrate the operational efficiency and performance of the proposed model on various mobile platforms. This experiment, targeted at real-world application scenarios such as real-time disease detection and segmentation in agricultural fields, emphasizes the practicality of the model on embedded devices and smartphones. By testing the model on different mobile platforms, including Raspberry Pi, HUAWEI P60, and Jetson Nano, this experiment not only showcases the frame rate (FPS, frames per second) performance of the model on each platform but also provides an empirical basis for future application optimization and platform selection.
The experimental results presented in
Table 6 indicate that on the Raspberry Pi platform, the FPS for disease detection is 12.6, while for lesion segmentation, it is 9.5; on the HUAWEI P60 smartphone, the FPS for disease detection increases to 26.3, and for lesion segmentation, it is 15.3; on the Jetson Nano, the FPS for these two tasks reaches 31.5 and 16.1, respectively. These data clearly demonstrate that different hardware platforms directly influence the model’s operational efficiency due to varying processing capabilities. From a theoretical and technical analysis perspective, the differences in FPS are primarily due to the different hardware configurations and processing capabilities of each platform. Raspberry Pi, a cost-effective single-board computer, has relatively limited processing power and memory size, particularly when handling complex deep learning tasks, where resource constraints are a major factor affecting FPS performance. The HUAWEI P60, a high-end smartphone, is equipped with more advanced processors and an optimized GPU, which provides higher computational efficiency and faster data processing capabilities when executing the same deep learning models. The Jetson Nano, designed specifically for AI edge computing, features a GPU that is particularly effective for executing parallel computing tasks, explaining its highest FPS performance observed in the experiments. Additionally, based on the analysis of the mathematical characteristics of the model, the complexity of the deep learning models relied upon for disease detection and lesion segmentation tasks is also a significant factor affecting FPS performance. Generally, the lesion segmentation task is mathematically more complex, requiring the model to perform with more detailed pixel-level processing on the image, thereby increasing the computational load. In contrast, disease detection, although also requiring the model to recognize and classify features in images, involves less granular processing and therefore has a relatively lower computational demand. This explains why, across all testing platforms, the FPS for disease detection is generally higher than that for lesion segmentation. In summary, this experiment not only demonstrates the performance of the proposed model on different mobile platforms but also delves into the underlying factors affecting these performances, including the processing capabilities of the hardware and the computational complexity of the model.
4.7. Limitations and Future Work
In this paper, a deep learning framework for peach tree disease recognition and lesion segmentation was successfully proposed and validated. By integrating a tiny feature attention mechanism, an aligned-head module, a Transformer-based semantic segmentation network, and an alignment loss function, significant progress was made in enhancing recognition accuracy and segmentation effectiveness. However, despite the achievements of this research, there are still some limitations and directions for future work in both practical applications and theoretical research. Firstly, in terms of dataset construction and usage, although the diversity and richness of the dataset were increased through web crawling and sensor data fusion, issues of insufficient data volume and data imbalance still exist. Particularly for some rare disease types, the limited number of samples may affect the model’s ability to recognize these diseases. Moreover, the quality of image data obtained from the Internet varies greatly, and further research is needed to improve the efficiency of utilizing this part of the data. Secondly, in terms of model design, although the introduction of the tiny feature attention mechanism, aligned-head module, and Transformer-based semantic segmentation network effectively improved model performance, and the complexity of these models also increased accordingly. Higher complexity means more computational resources and training time are required, which limits the model’s application in resource-constrained environments to some extent. Reducing model complexity while maintaining model performance is an important direction for future research. Thirdly, regarding model generalization ability, although the design of multimodal data fusion and alignment loss function enhanced the model’s performance on specific datasets, the model’s generalizability to peach tree images under different regional and planting conditions remains to be verified. Future work needs to explore more general feature extraction and data fusion strategies to improve model adaptability and stability in broader application scenarios. Additionally, although the alignment loss function achieved good results in optimizing model performance, selecting the optimal loss function weight ratio and further refining the loss function to address more complex tasks remain open questions. Future research could delve into the design and optimization strategies of loss functions to further enhance model recognition accuracy and segmentation effectiveness. Lastly, with the rapid development of deep learning technology, new model architectures and algorithms continue to emerge. Understanding how to apply these latest research findings to peach tree disease recognition and lesion segmentation tasks and how to combine domain knowledge for model design and optimization are directions worth exploring in future work. Furthermore, considering the specificity of the agricultural field, future research could also strive to improve model interpretability and operability, promoting the application of deep learning technology in actual agricultural production.
5. Conclusions
In this study, a comprehensive framework for peach tree disease recognition and lesion segmentation was developed, achieving technological innovations on multiple levels, including a TFA, an aligned-head module, a Transformer-based semantic segmentation network, and a specially designed alignment loss function. The integration of these components not only improved the accuracy of disease recognition and the effectiveness of segmentation but also demonstrated significant advantages in handling complex image data in real agricultural scenarios.
Experimental results showed that the method proposed in this paper achieved a precision of 94%, a recall of 92%, and an accuracy of 92% in the disease detection task, and a precision of 95%, a recall of 90%, and an mIoU of 94% in the lesion segmentation task. These results significantly outperformed existing mainstream models such as AlexNet, GoogLeNet, VGGNet, ResNet, and EfficientNet in disease detection tasks, as well as SegNet, UNet, and UNet++ in lesion segmentation performance. Particularly in lesion segmentation tasks, the method proposed in this paper, compared to UNet++, improved mIoU by four percentage points, fully demonstrating the outstanding capability of the Transformer-based semantic segmentation network in processing subtle features and complex backgrounds. Additionally, by introducing the aligned-head module and alignment loss function, this study successfully addressed the issue of lacking sensor data in web-crawled image data, effectively utilized existing image resources, and further improved the precision of model recognition and segmentation. Ablation experiments further validated the importance of the aligned-head module and alignment loss function in enhancing model performance. Especially in the attention head ablation experiment, the configuration of the aligned-head module outperformed other attention mechanism configurations in precision, recall, and mIoU, showing its key role in improving the overall performance of the model. Through these experiments, this paper not only verified the feasibility of the proposed method theoretically but also proved its effectiveness and superiority in practical applications. The framework and methods proposed in this research provide a new solution for the automatic recognition and segmentation of peach tree diseases, with clear technical advantages and practical value. Furthermore, these achievements pave new pathways for the application of deep learning technology in the field of agricultural disease management.
In summary, the successful implementation of this study showcases the vast potential of deep learning technology in the field of agricultural disease detection and segmentation, laying a solid foundation for further research and practical applications. Future work will explore further model optimization, data fusion strategies, and new network architectures to continuously improve the system’s performance and applicability, ultimately aiming for broader applications in various agricultural scenarios.


