Spatio-Temporal Evolution of Olive Tree Water Status Using Land Surface Temperature and Vegetation Indices Derived from Landsat 5 and 8 Satellite Imagery in Southern Peru

 ,
,  ,
,  ,
,  ,
,  , and
, and
Abstract
1. Introduction
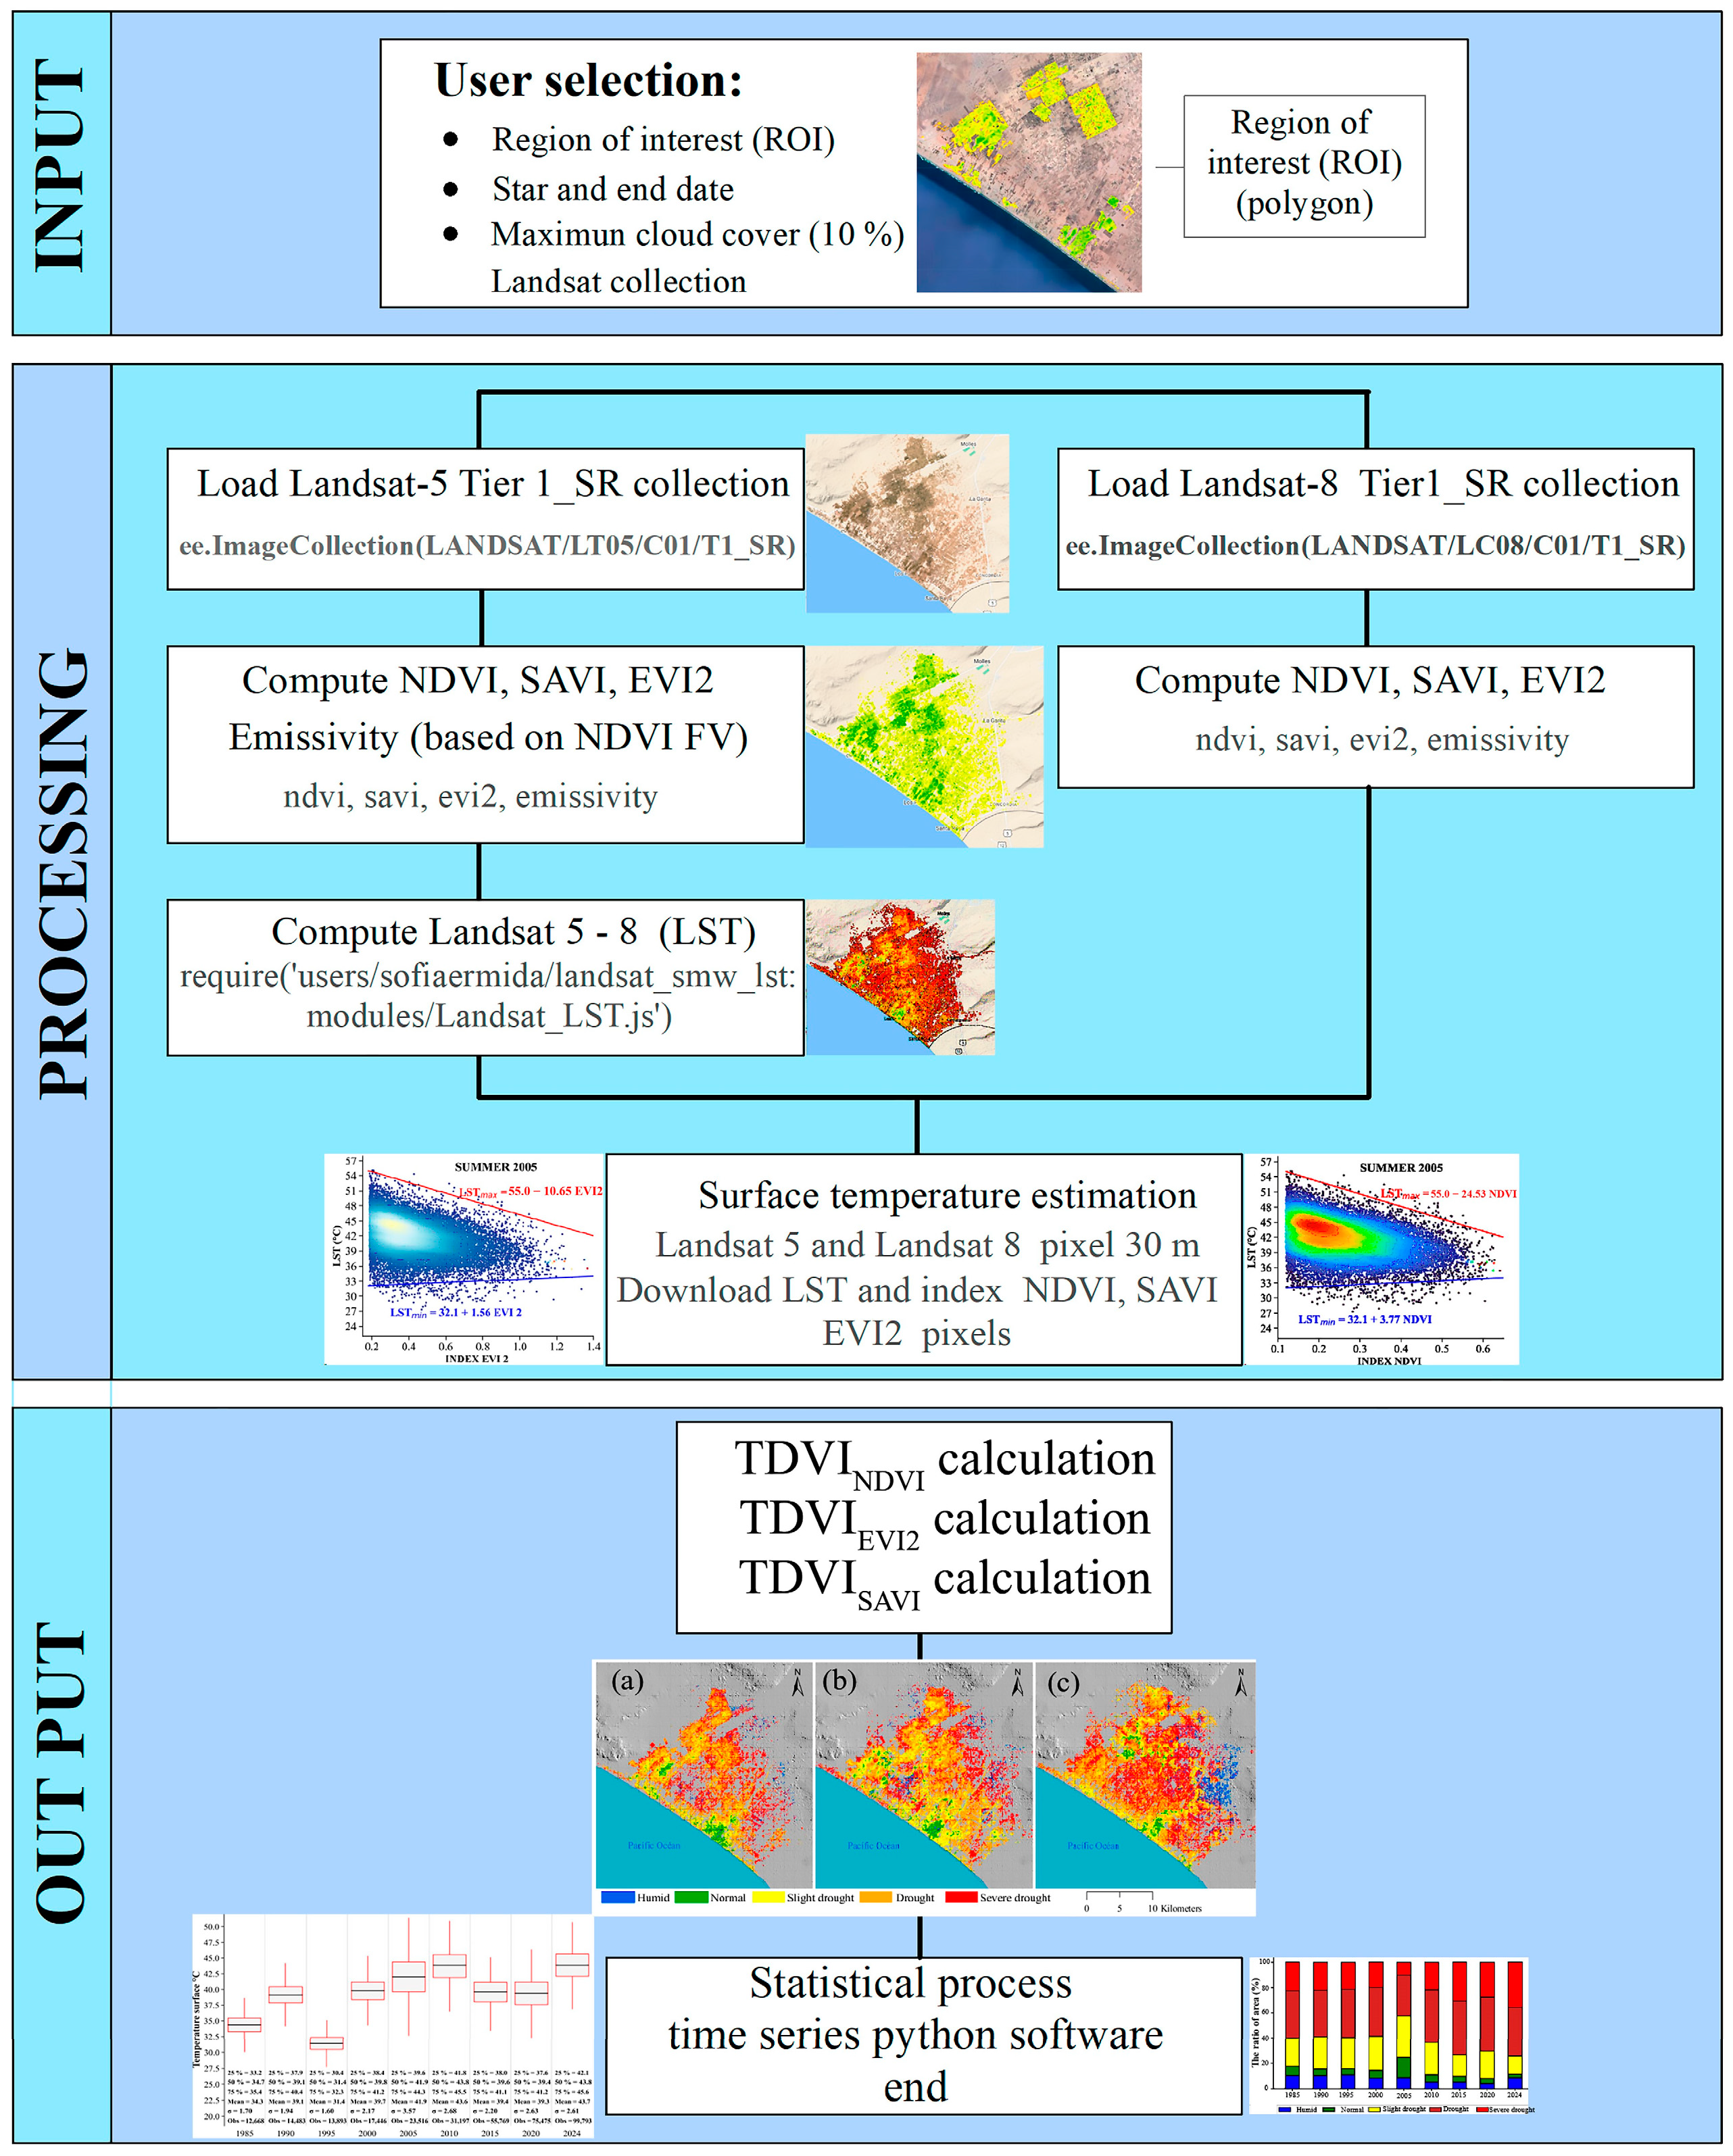
2. Materials and Methods
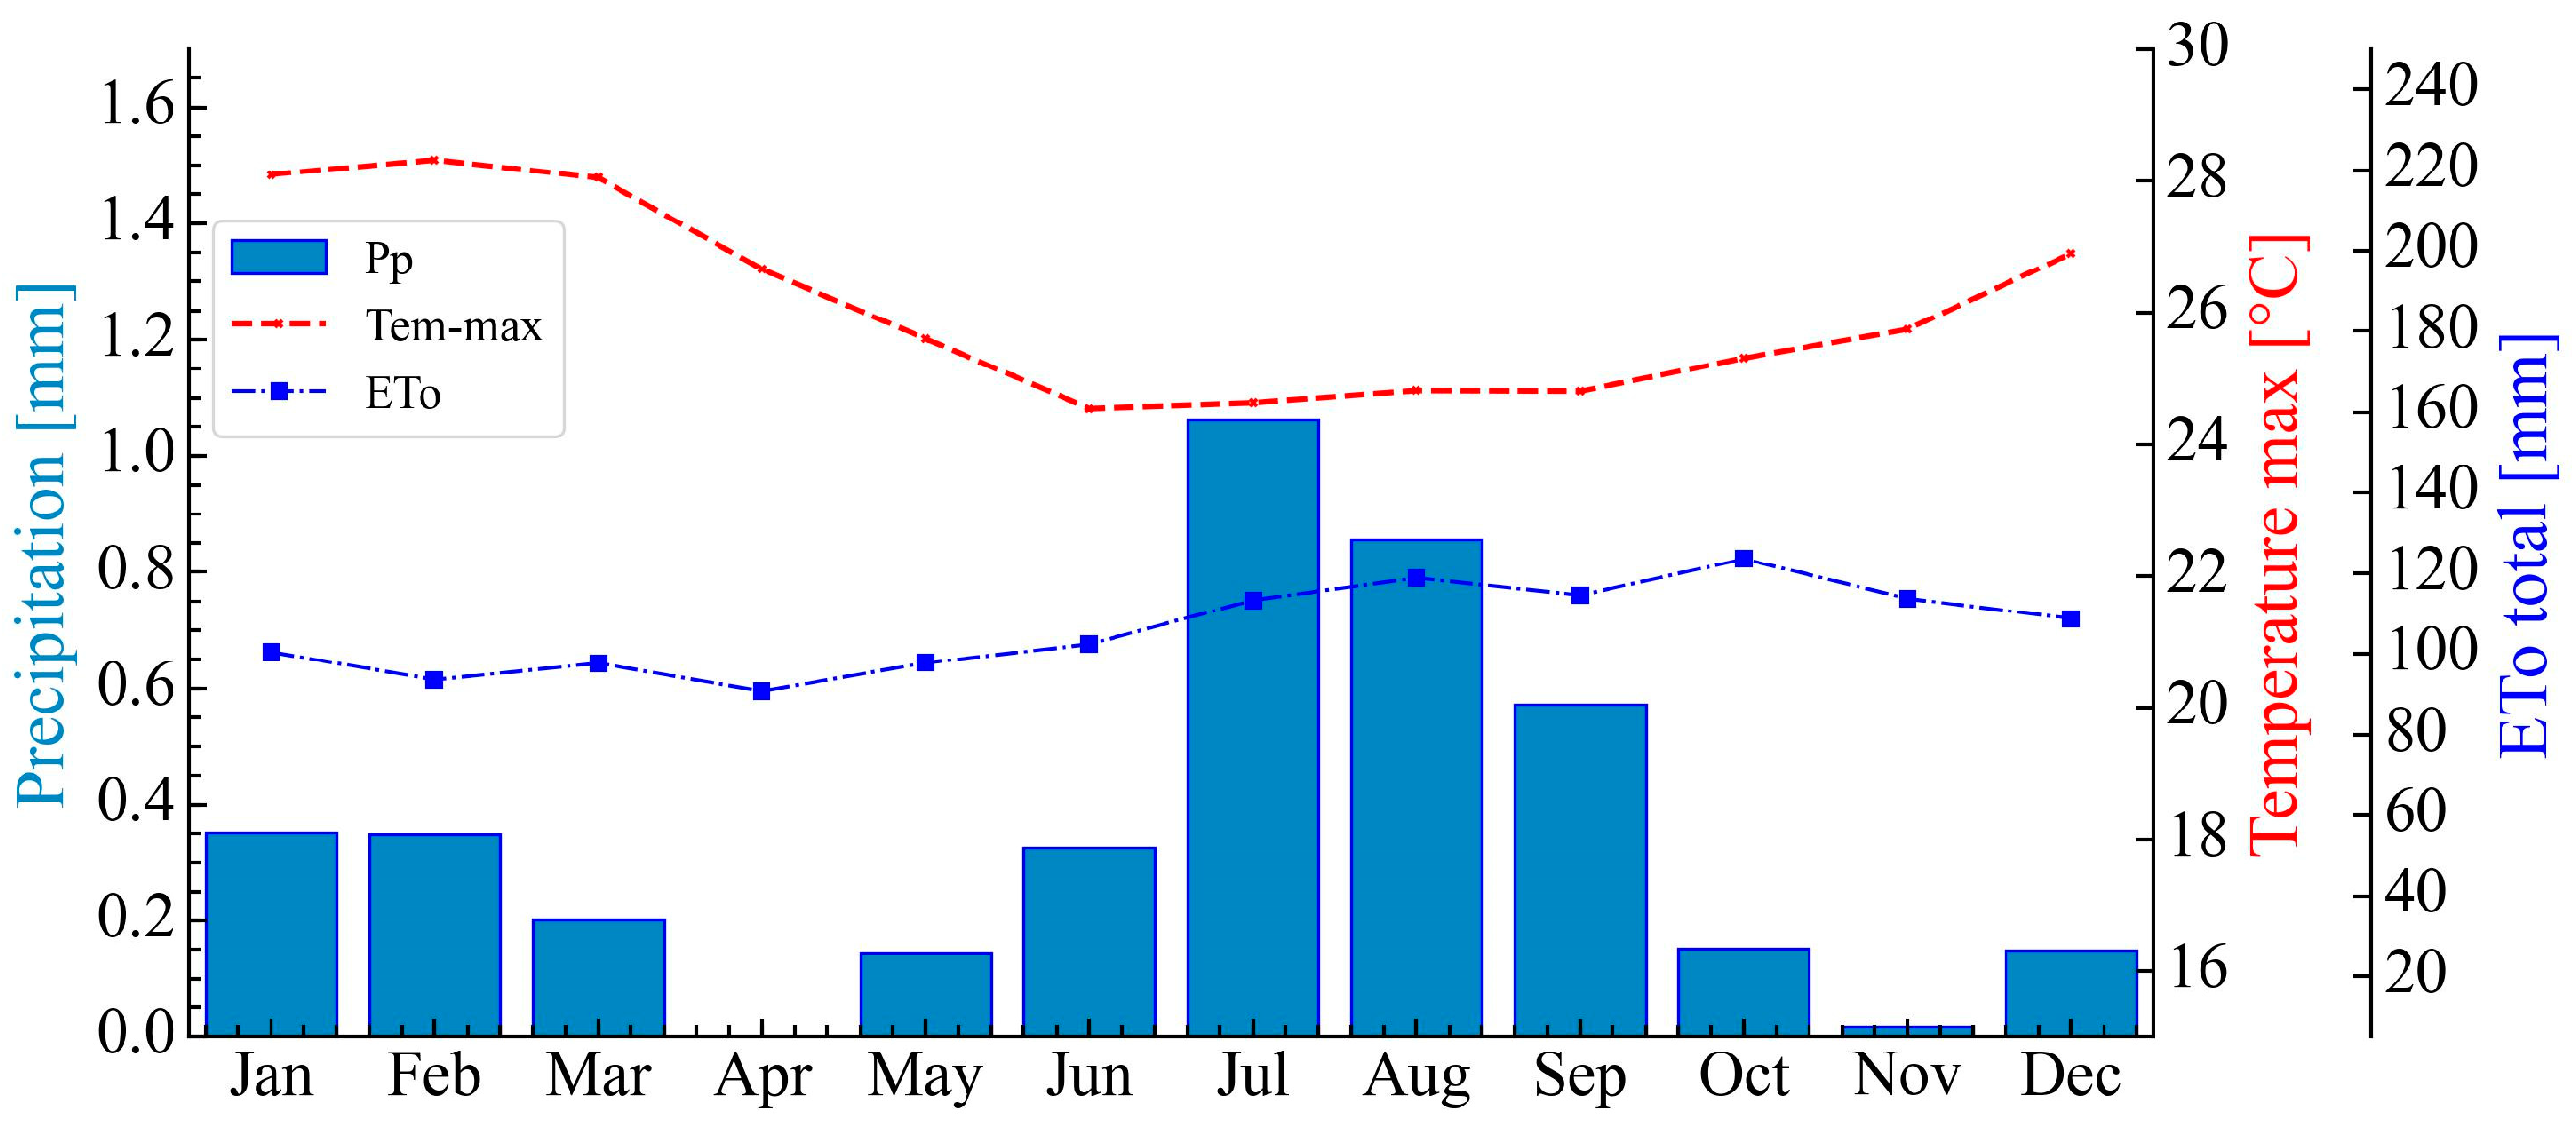
2.1. Study Area
2.2. Landsat Satellite Data Acquisition and Image Preprocessing
2.3. The Region of Interest (ROI) as a Function of Olive Crop Vigour Status
2.4. Vegetation Indices with Red (R) and Near-Infrared (NIR) Bands
2.5. Land Surface Temperature from Landsat 5 and 8
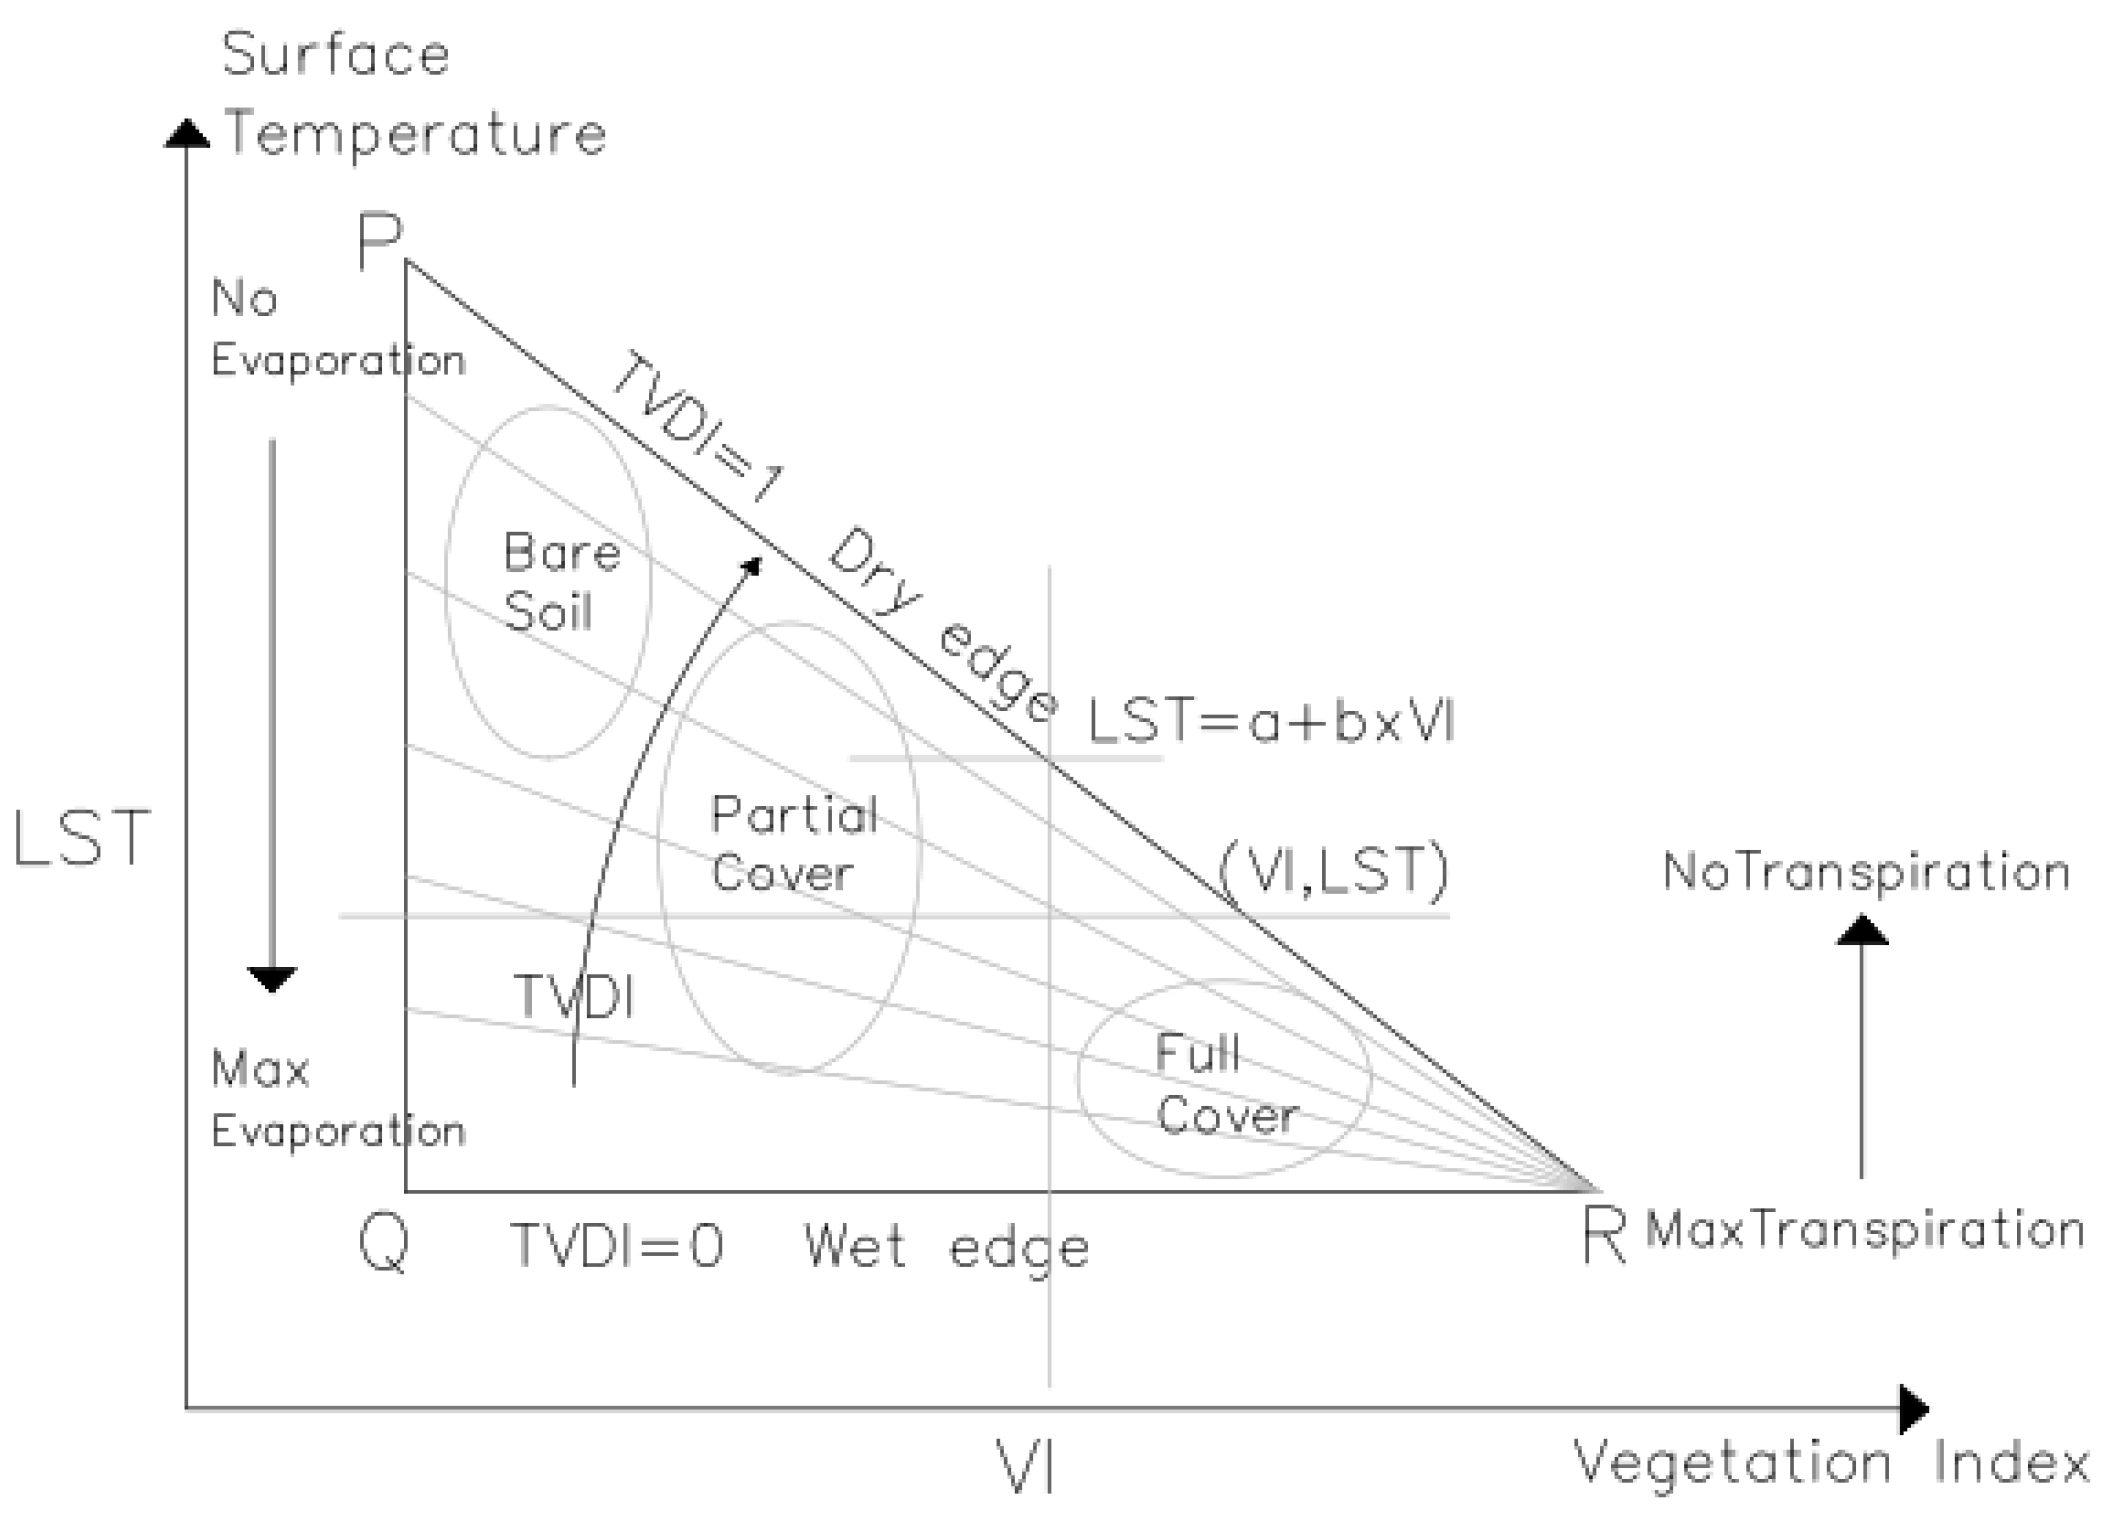
2.6. Temperature Vegetation Dryness Index (TVDI)
3. Results
3.1. Estimation of the Region of Interest (ROI) as a Function of Olive Crop Vigour Status
3.2. Temporal Land Surface Temperature Variability
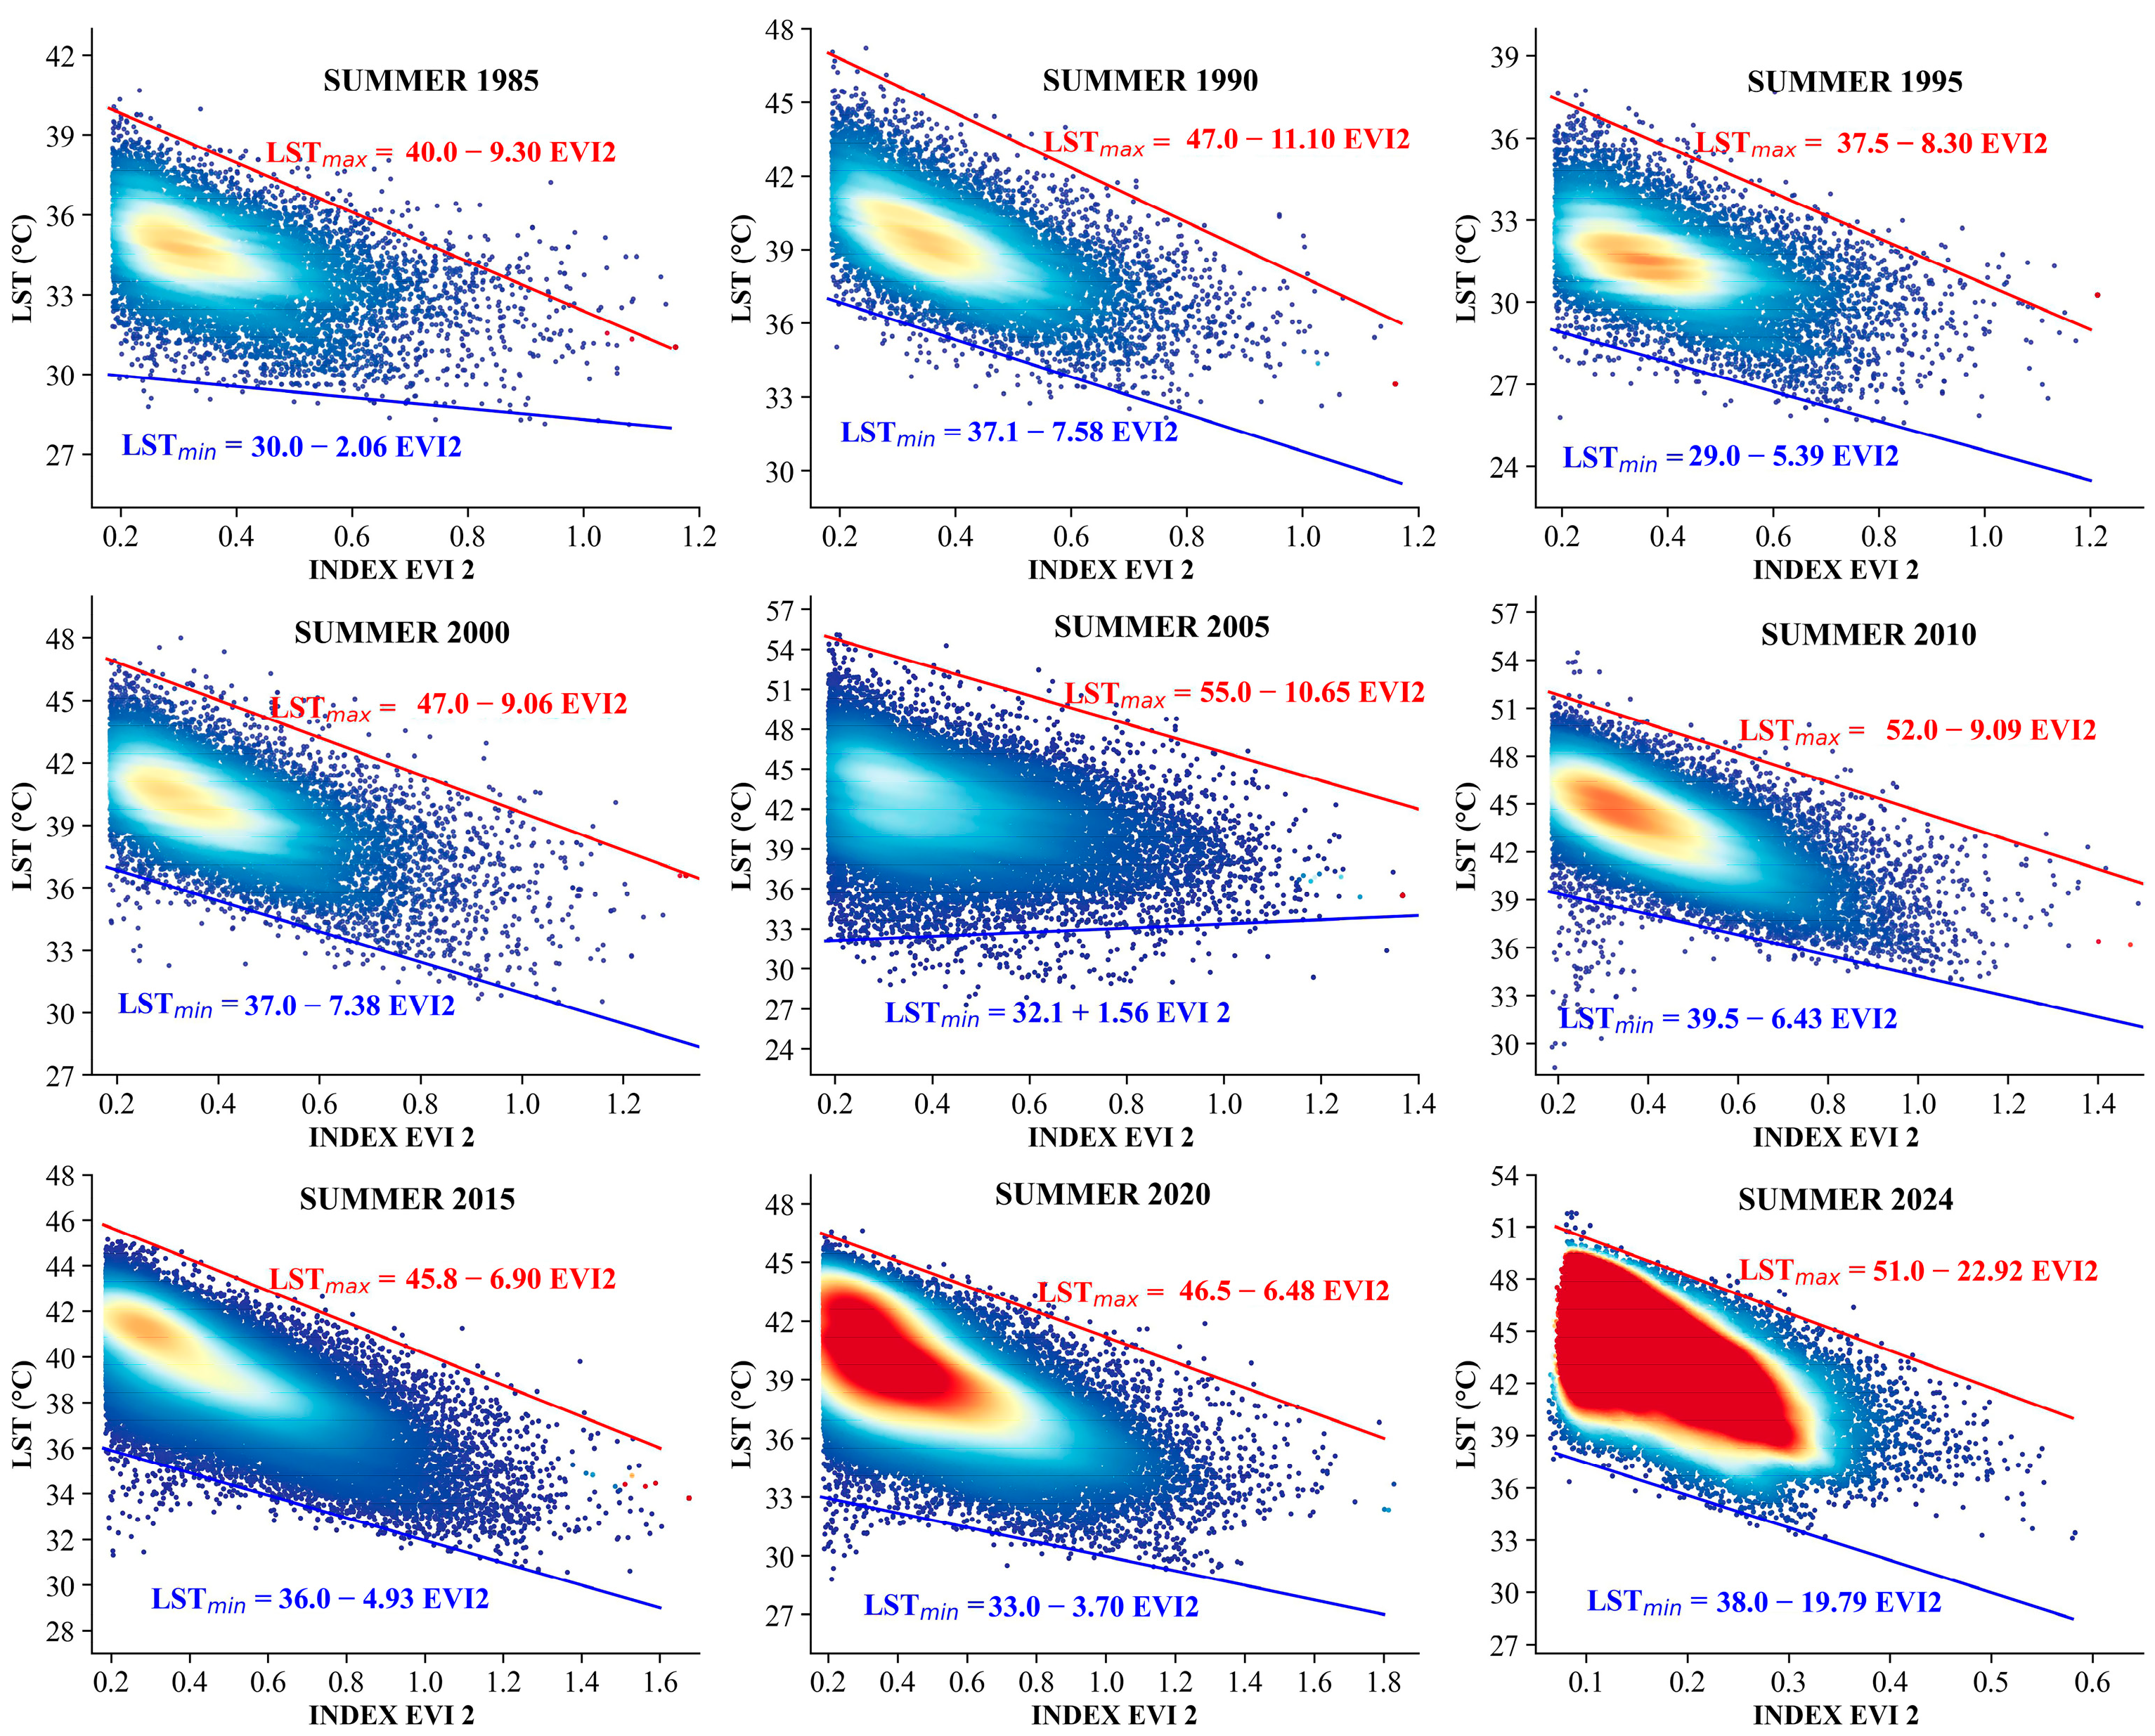
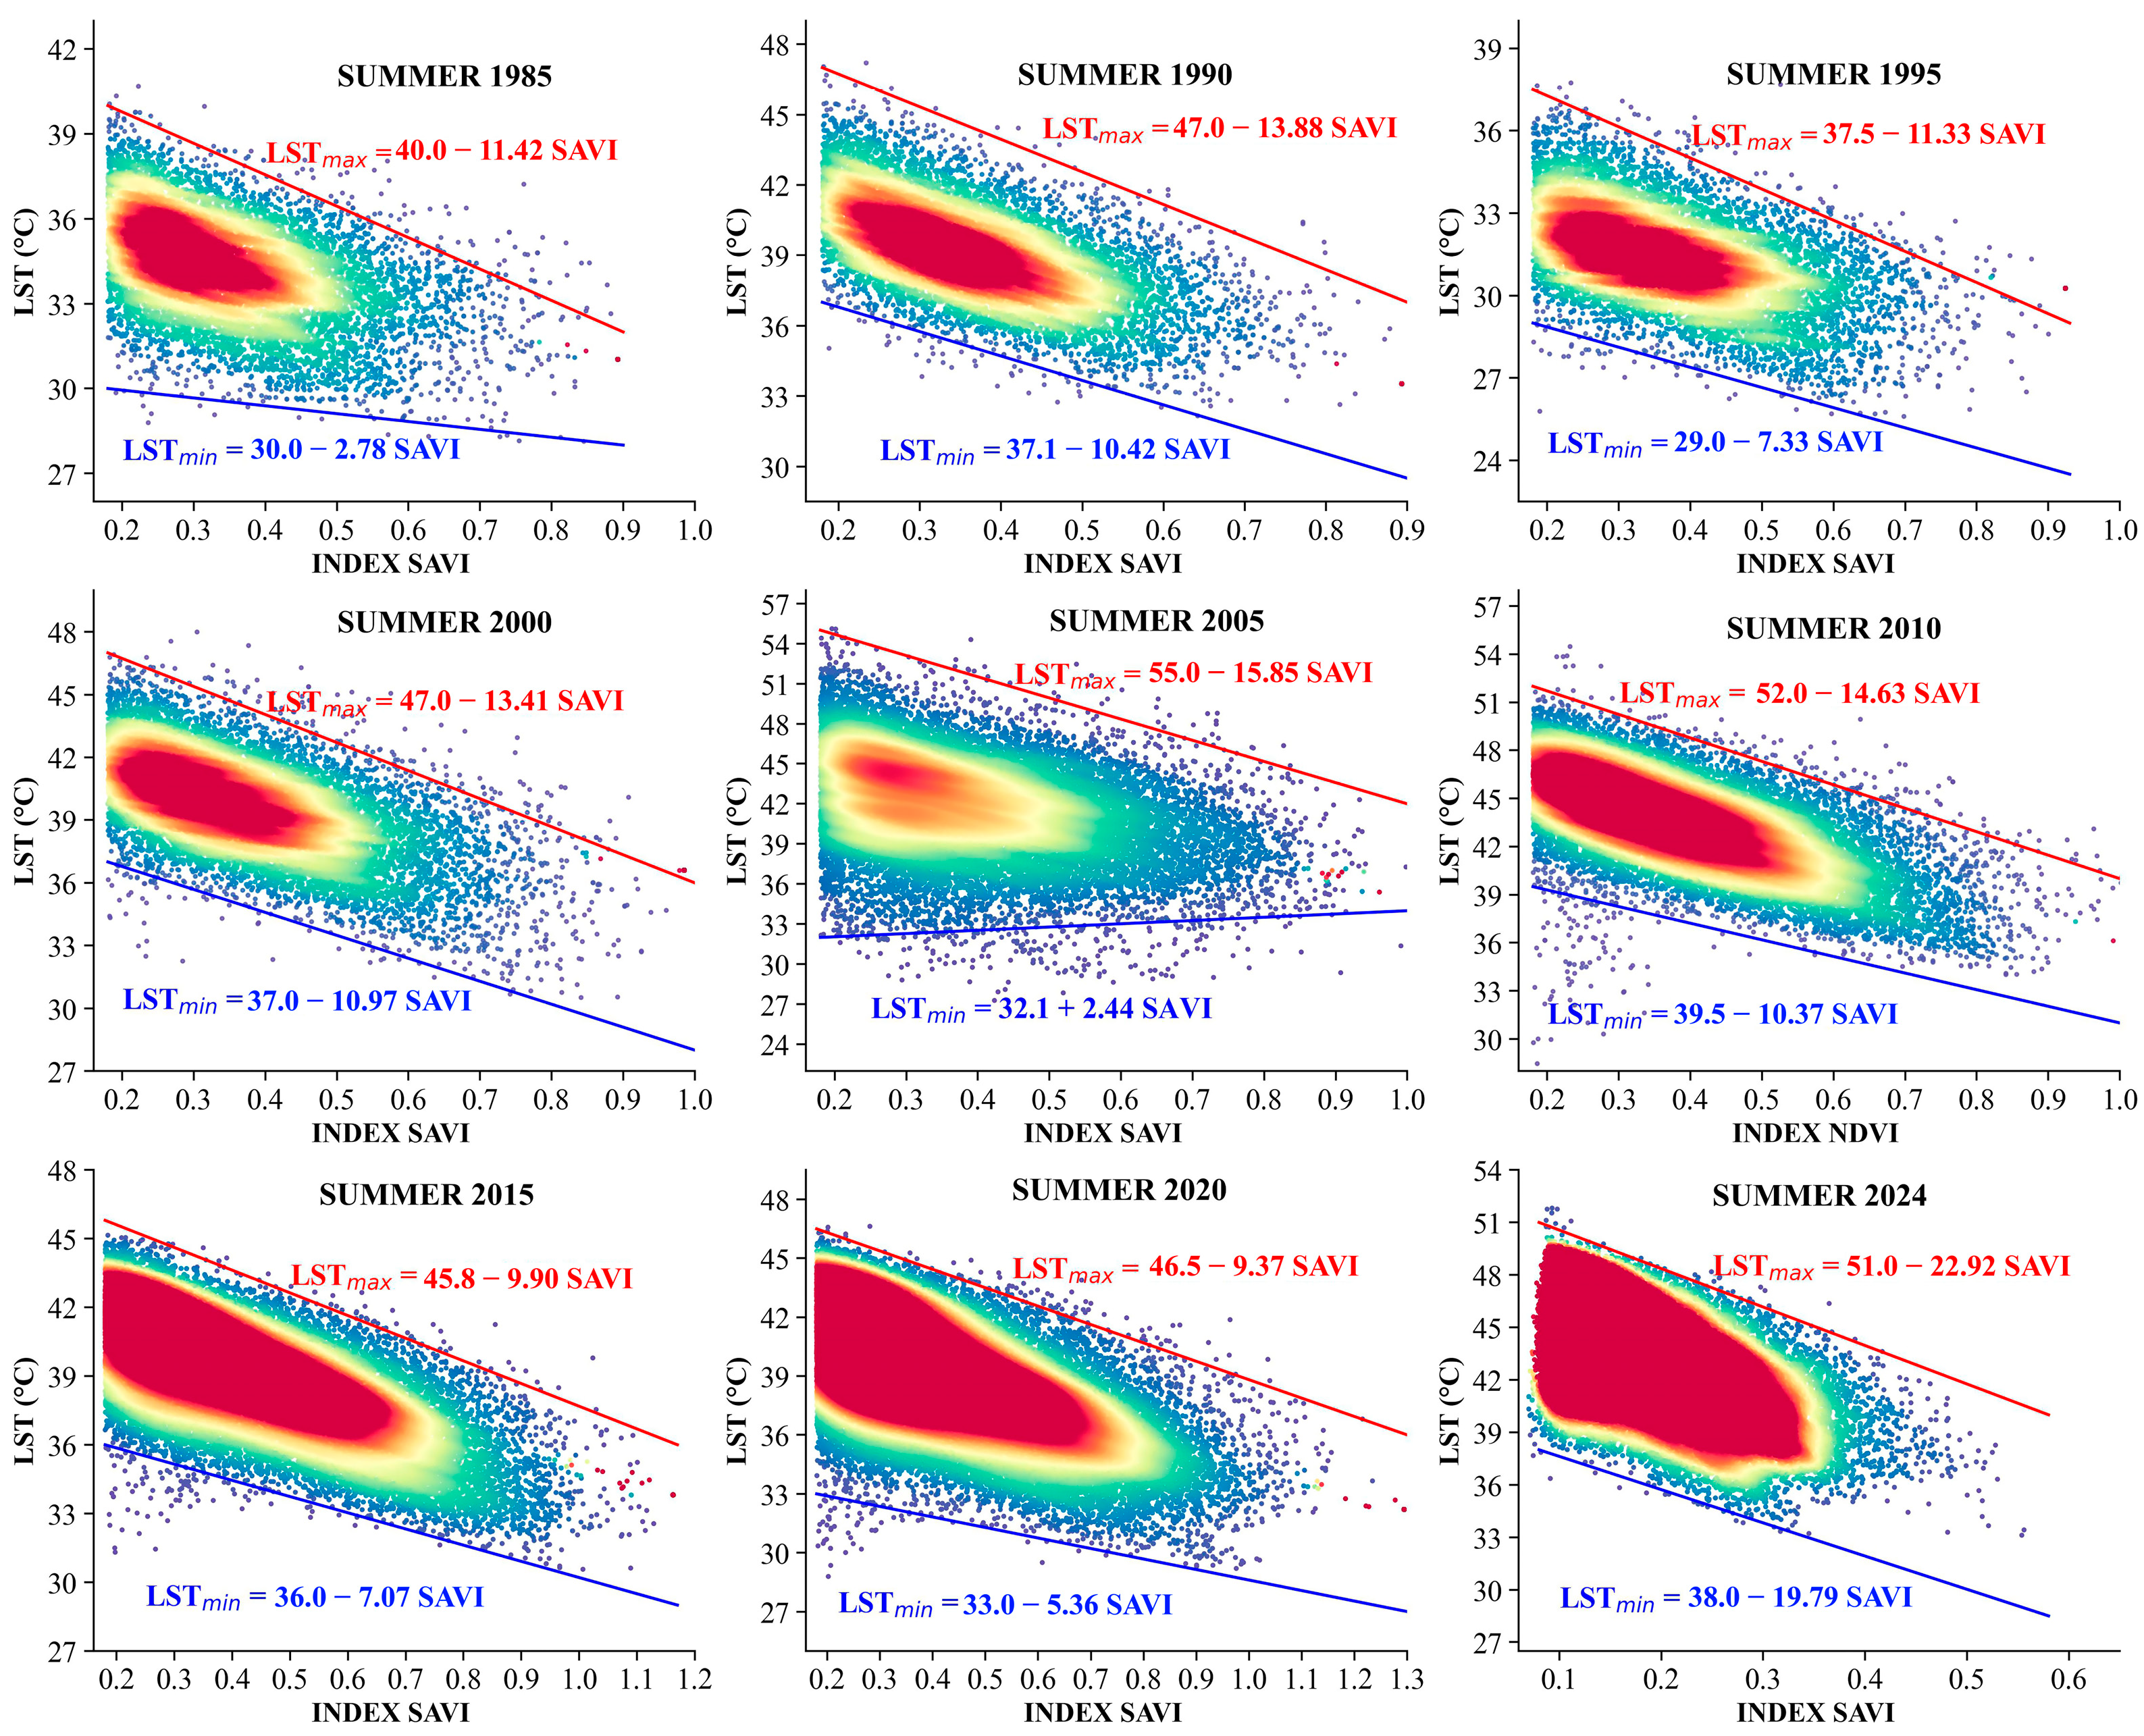
3.3. Calculation of LST-NDVI, EVI2 and SAVI Trapezoidal Thermo Space
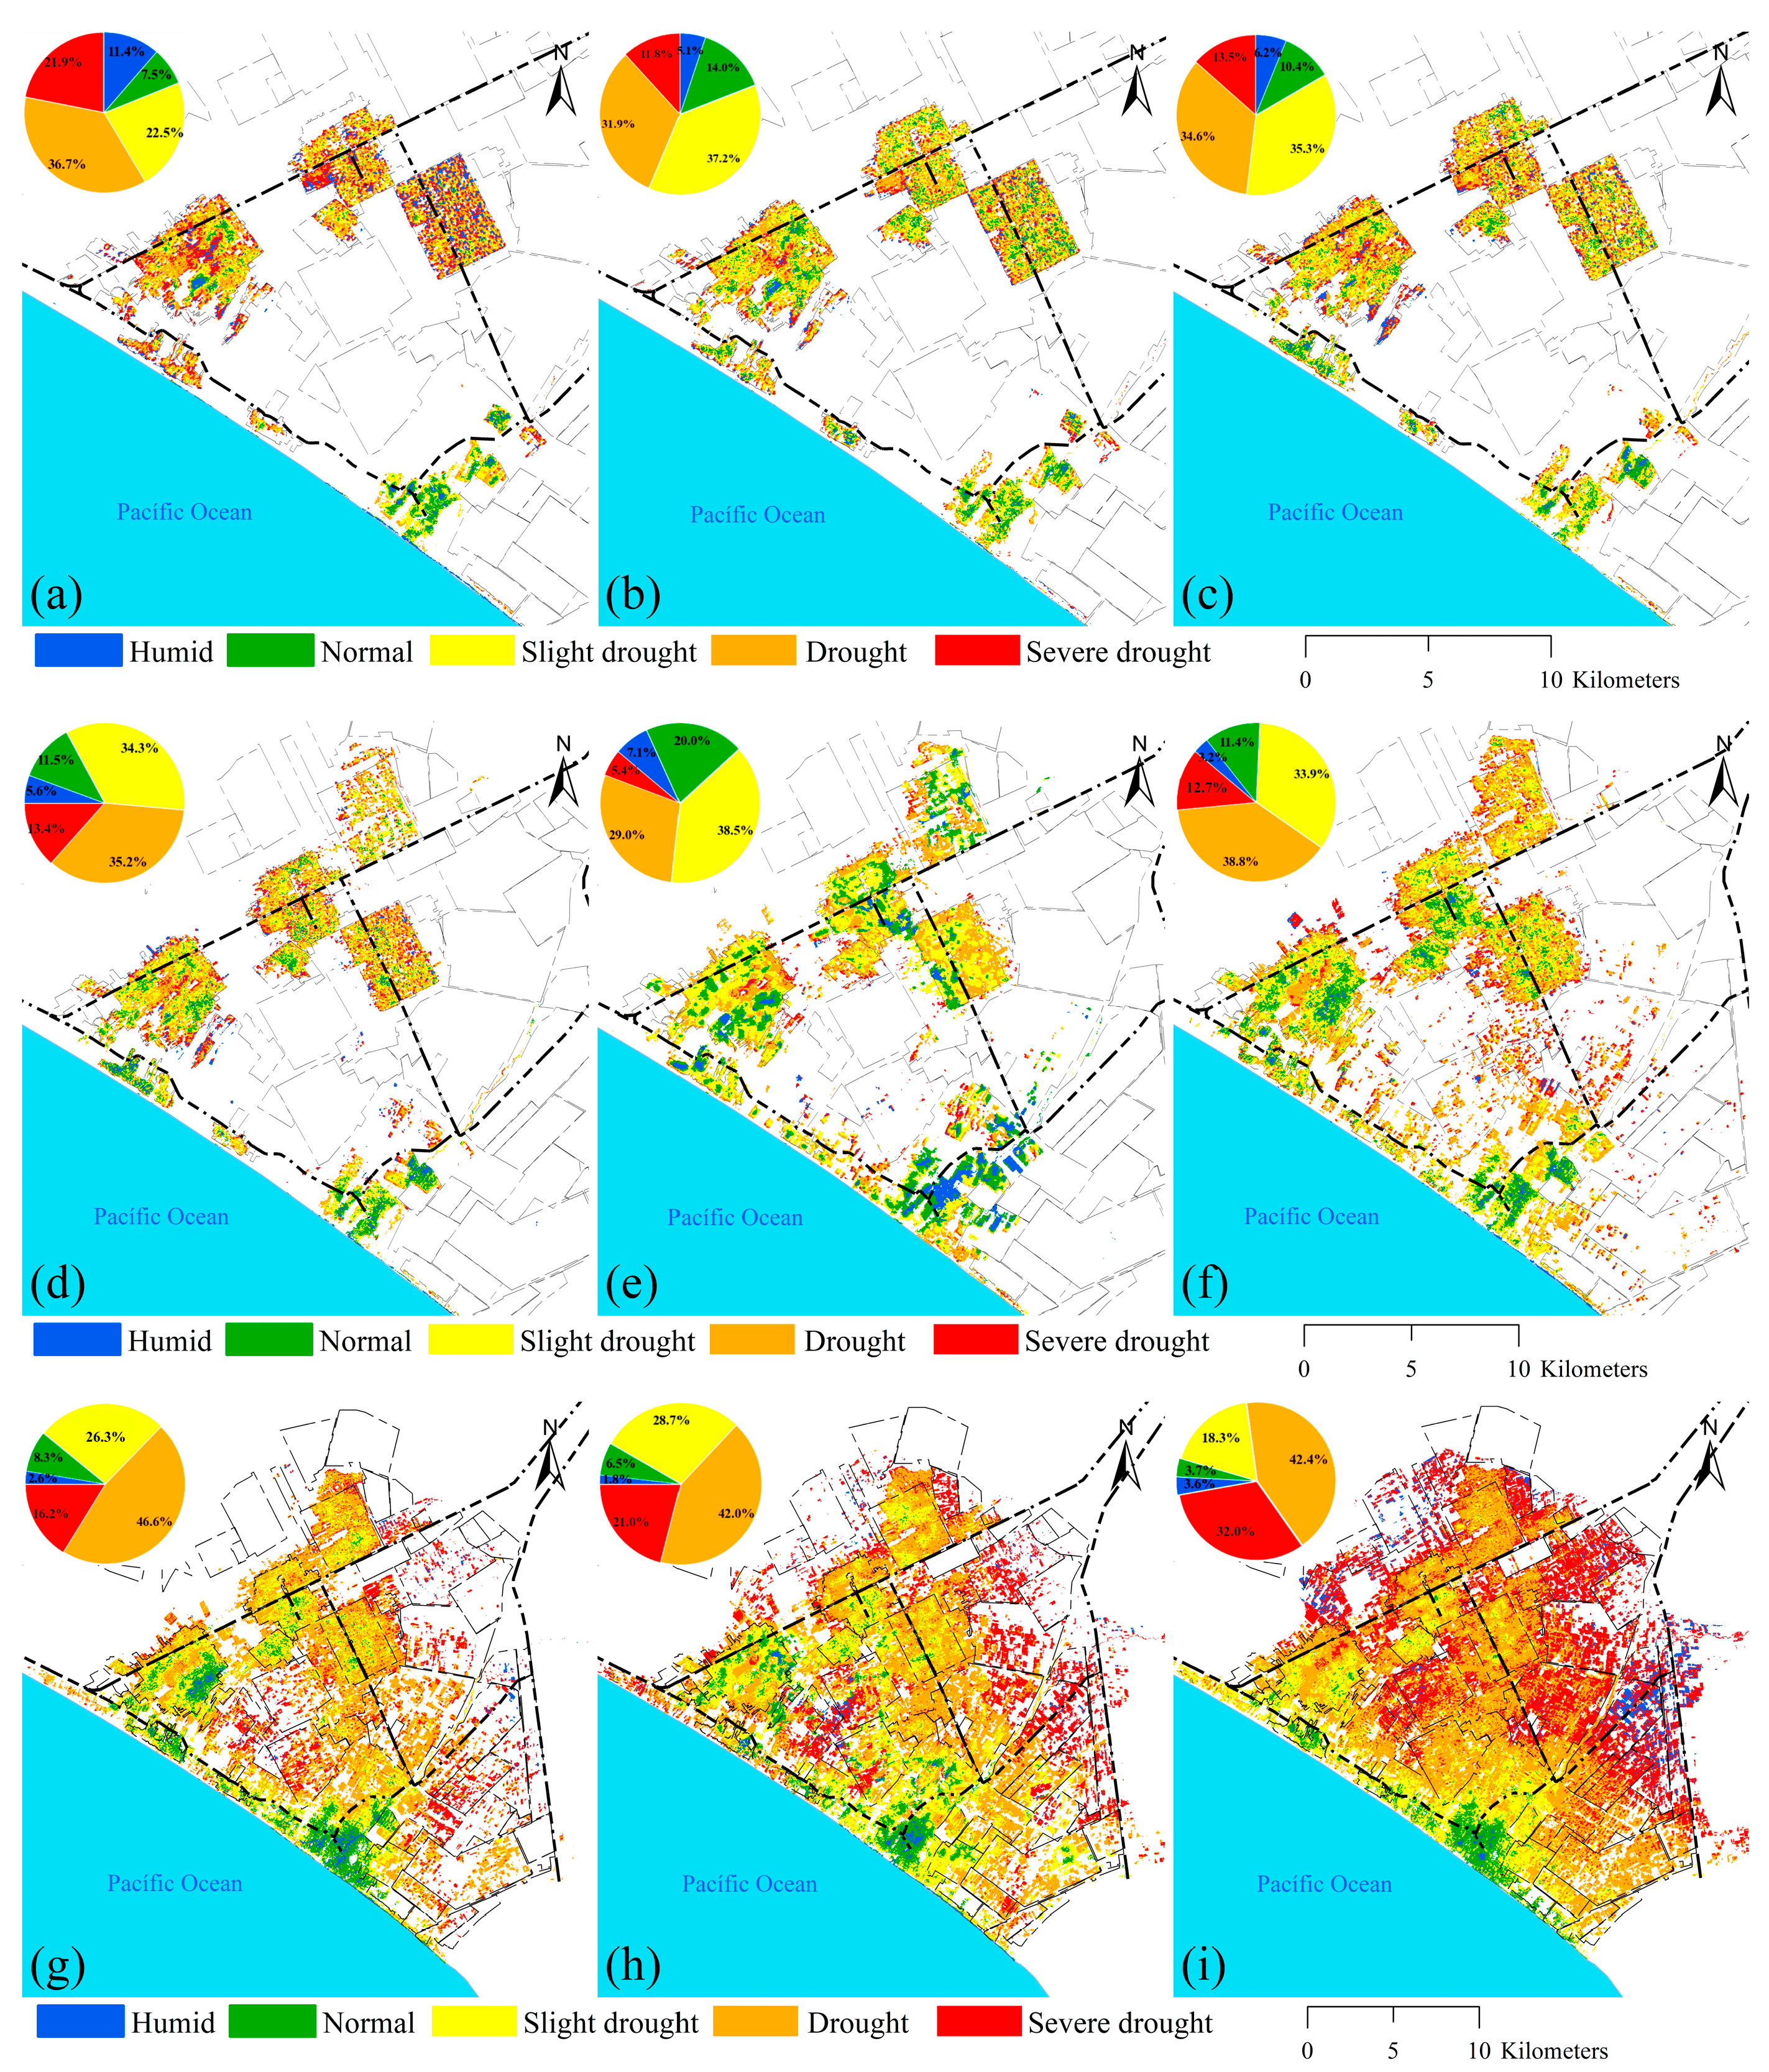
3.4. Spatio-Temporal Evolution of the TVDI with Respect to VI in the Caplina Aquifer
4. Discussion
4.1. Analysis of NDVI Classification for Olive Tree Vigour
4.2. Analysis of the LST-VIs Feature Space
4.3. Analysis of Spatial and Temporal Variation Trend in TVDI
Climatological and Phenological Factor
4.4. Limitations and Future Research
5. Conclusions
Author Contributions
Funding
Institutional Review Board Statement
Data Availability Statement
Conflicts of Interest
References
- Adeyeri, O.E.; Folorunsho, A.H.; Ayegbusi, K.I.; Bobde, V.; Adeliyi, T.E.; Ndehedehe, C.E.; Akinsanola, A.A. Land Surface Dynamics and Meteorological Forcings Modulate Land Surface Temperature Characteristics. Sustain. Cities Soc. 2024, 101, 105072. [Google Scholar] [CrossRef]
- Dimyati, M.; Aginta, F.; Damayanti, A. The Effect of Vegetation Index on the Land Surface Temperature in South Badung Regency, Bali Province the Effect of Vegetation Index on the Land Surface Temperature in South Badung Regency, Bali Province. IOP Conf. Ser. Earth Environ. Sci. 2024, 1291, 012024. [Google Scholar] [CrossRef]
- Przeździecki, K.; Zawadzki, J. Assessing Moisture Content and Its Mitigating Effect in an Urban Area Using the Land Surface Temperature–Vegetation Index Triangle Method. Forests 2023, 14, 578. [Google Scholar] [CrossRef]
- Mohanasundaram, S.; Baghel, T.; Thakur, V.; Udmale, P.; Shrestha, S. Reconstructing NDVI and Land Surface Temperature for Cloud Cover Pixels of Landsat-8 Images for Assessing Vegetation Health Index in the Northeast Region of Thailand; Springer International Publishing: Berlin/Heidelberg, Germany, 2023; Volume 195, ISBN 0123456789. [Google Scholar]
- Torres, M.; Pierantozzi, P.; Searles, P.; Cecilia Rousseaux, M.; García-Inza, G.; Miserere, A.; Bodoira, R.; Contreras, C.; Maestri, D. Olive Cultivation in the Southern Hemisphere: Flowering, Water Requirements and Oil Quality Responses to New Crop Environments. Front. Plant Sci. 2017, 8, 294457. [Google Scholar] [CrossRef] [PubMed]
- Gómez-del-Campo, M.; Pérez-Expósito, M.Á.; Hammami, S.B.M.; Centeno, A.; Rapoport, H.F. Effect of Varied Summer Deficit Irrigation on Components of Olive Fruit Growth and Development. Agric. Water Manag. 2014, 137, 84–91. [Google Scholar] [CrossRef]
- Pino-Vargas, E.; Huayna, G. Spatial and Temporal Evolution of Olive Cultivation Due to Pest Attack, Using Remote Sensing and Satellite Image Processing. Sci. Agropecu. 2022, 13, 149–157. [Google Scholar] [CrossRef]
- Machaca-Pillaca, R.; Pino-Vargas, E.; Ramos-Férnandez, L.; Quille-Mamani, J.; Torres-Rua, A. Estimación de La Evapotranspiración Con Fines de Riego En Tiempo Real de Un Olivar a Partir de Imágenes de Un Drone En Zonas Áridas, Caso La Yarada, Tacna, Perú. Idesia 2022, 40, 55–65. [Google Scholar] [CrossRef]
- Zare, M.; Drastig, K.; Zude-Sasse, M. Tree Water Status in Apple Orchards Measured by Means of Land Surface Temperature and Vegetation Index (LST-NDVI) Trapezoidal Space Derived from Landsat 8 Satellite Images. Sustainability 2020, 12, 70. [Google Scholar] [CrossRef]
- Sepulcre-Cantó, G.; Zarco-Tejada, P.J.; Jiménez-Muñoz, J.C.; Sobrino, J.A.; De Miguel, E.; Villalobos, F.J. Detection of Water Stress in an Olive Orchard with Thermal Remote Sensing Imagery. Agric. For. Meteorol. 2006, 136, 31–44. [Google Scholar] [CrossRef]
- Kefi, M.; Pham, T.D.; Kashiwagi, K.; Yoshino, K. Identification of Irrigated Olive Growing Farms Using Remote Sensing Techniques. Euro-Mediterr. J. Environ. Integr. 2016, 1, 3. [Google Scholar] [CrossRef]
- Du, L.; Song, N.; Liu, K.; Hou, J.; Hu, Y.; Zhu, Y.; Wang, X.; Wang, L.; Guo, Y. Comparison of Two Simulation Methods of the Temperature Vegetation Dryness Index (TVDI) for Drought Monitoring in Semi-Arid Regions of China. Remote Sens. 2017, 9, 177. [Google Scholar] [CrossRef]
- Babaeian, E.; Sadeghi, M.; Franz, T.E.; Jones, S.; Tuller, M. Mapping Soil Moisture with the OPtical TRApezoid Model (OPTRAM) Based on Long-Term MODIS Observations. Remote Sens. Environ. 2018, 211, 425–440. [Google Scholar] [CrossRef]
- Amani, M.; Salehi, B.; Mahdavi, S.; Masjedi, A.; Dehnavi, S. Temperature-Vegetation-Soil Moisture Dryness Index (TVMDI). Remote Sens. Environ. 2017, 197, 1–14. [Google Scholar] [CrossRef]
- Liu, Y.; Ni, Z.; Zhao, Y.; Zhou, G.; Luo, Y.; Li, S.; Wang, D.; Zhang, S. Spatial-Temporal Evolution and Driving Forces of Drying Trends on the Qinghai-Tibet Plateau Based on Geomorphological Division. Int. J. Environ. Res. Public Health 2022, 19, 7909. [Google Scholar] [CrossRef] [PubMed]
- Tirivarombo, S.; Osupile, D.; Eliasson, P. Drought Monitoring and Analysis: Standardised Precipitation Evapotranspiration Index (SPEI) and Standardised Precipitation Index (SPI). Phys. Chem. Earth 2018, 106, 1–10. [Google Scholar] [CrossRef]
- Beguería, S.; Vicente-Serrano, S.M.; Angulo-Martínez, M. A Multiscalar Global Drought Dataset: The SPEI Base: A New Gridded Product for the Analysis of Drought Variability and Impacts. Bull. Am. Meteorol. Soc. 2010, 91, 1351–1356. [Google Scholar] [CrossRef]
- Dai, R.; Chen, S.; Cao, Y.; Zhang, Y.; Xu, X. A Modified Temperature Vegetation Dryness Index (MTVDI) for Agricultural Drought Assessment Based on MODIS Data: A Case Study in Northeast China. Remote Sens. 2023, 15, 1915. [Google Scholar] [CrossRef]
- Huang, S.; Tang, L.; Hupy, J.P.; Wang, Y.; Shao, G. A Commentary Review on the Use of Normalized Difference Vegetation Index (NDVI) in the Era of Popular Remote Sensing. J. For. Res. 2021, 32, 1–6. [Google Scholar] [CrossRef]
- Mondal, P. Quantifying Surface Gradients with a 2-Band Enhanced Vegetation Index (EVI2). Ecol. Indic. 2011, 11, 918–924. [Google Scholar] [CrossRef]
- Huete, A.R. A Soil-Adjusted Vegetation Index (SAVI). Remote Sens. Environ. 1988, 25, 295–309. [Google Scholar] [CrossRef]
- Guha, S.; Govil, H. An Assessment on the Relationship between Land Surface Temperature and Normalized Difference Vegetation Index. Environ. Dev. Sustain. 2021, 23, 1944–1963. [Google Scholar] [CrossRef]
- Chen, J.; Wang, C.; Jiang, H.; Mao, L.; Yu, Z. Estimating Soil Moisture Using Temperature-Vegetation Dryness Index (TVDI) in the Huang-Huai-Hai (HHH) Plain. Int. J. Remote Sens. 2011, 32, 1165–1177. [Google Scholar] [CrossRef]
- Zhen, Z.; Chen, S.; Yin, T.; Gastellu-Etchegorry, J.P. Globally Quantitative Analysis of the Impact of Atmosphere and Spectral Response Function on 2-Band Enhanced Vegetation Index (EVI2) over Sentinel-2 and Landsat-8. ISPRS J. Photogramm. Remote Sens. 2023, 205, 206–226. [Google Scholar] [CrossRef]
- Rahimzadeh-Bajgiran, P.; Omasa, K.; Shimizu, Y. Comparative Evaluation of the Vegetation Dryness Index (VDI), the Temperature Vegetation Dryness Index (TVDI) and the Improved TVDI (ITVDI) for Water Stress Detection in Semi-Arid Regions of Iran. ISPRS J. Photogramm. Remote Sens. 2012, 68, 1–12. [Google Scholar] [CrossRef]
- Singh, P.; Verma, P.; Chaudhuri, A.S.; Singh, V.K.; Rai, P.K. Evaluating the Relationship between Urban Heat Island and Temporal Change in Land Use, NDVI and NDBI: A Case Study of Bhopal City, India. Int. J. Environ. Sci. Technol. 2023, 21, 3061–3072. [Google Scholar] [CrossRef]
- Değermenci, A.S. Estimation of Land Surface Temperature from Landsat-8 OLI: Comparative Analysis of Two Periods for Duzce in Turkey. Int. J. Environ. Sci. Technol. 2024, 21, 6389–6404. [Google Scholar] [CrossRef]
- Ermida, S.L.; Soares, P.; Mantas, V.; Göttsche, F.M.; Trigo, I.F. Google Earth Engine Open-Source Code for Land Surface Temperature Estimation from the Landsat Series. Remote Sens. 2020, 12, 1471. [Google Scholar] [CrossRef]
- Quintana-Molina, J.R.; Sánchez-Cohen, I.; Jiménez-Jiménez, S.I.; de Marcial-Pablo, M.J.; Trejo-Calzada, R.; Quintana-Molina, E. Calibration of Volumetric Soil Moisture Using Landsat-8 and Sentinel-2 Satellite Imagery by Google Earth Engine. Rev. Teledetec. 2023, 2023, 21–38. [Google Scholar] [CrossRef]
- Olmos-Trujillo, E.; González-Trinidad, J.; Júnez-Ferreira, H.; Pacheco-Guerrero, A.; Bautista-Capetillo, C.; Avila-Sandoval, C.; Galván-Tejada, E. Spatio-Temporal Response of Vegetation Indices to Rainfall and Temperature in a Semiarid Region. Sustainability 2020, 12, 1939. [Google Scholar] [CrossRef]
- Edwin Pino, V.; Eduardo Chávarri, V. Evidence of Climate Change in the Hyper-Arid Region of the Southern Coast of Peru, Head of the Atacama Desert. Tecnol. Ciencias Agua 2022, 13, 333–375. [Google Scholar] [CrossRef]
- Pino-Vargas, E.; Espinoza-Molina, J.; Chávarri-Velarde, E.; Quille-Mamani, J.; Ingol-Blanco, E. Impacts of Groundwater Management Policies in the Caplina Aquifer, Atacama Desert. Water 2023, 15, 2610. [Google Scholar] [CrossRef]
- Pino, E.; Ramos, L.; Avalos, O.; Tacora, P.; Chávarri, E.; Angulo, O.; Ascensios, D.; Mejía, J. Factors Affecting Depletion and Pollution by Marine Intrusion in the La Yarada’s Coastal Aquifer, Tacna, Peru. Tecnol. Ciencias Agua 2019, 10, 177–213. [Google Scholar] [CrossRef]
- Pandey, R.; Goswami, S.; Sarup, J.; Matin, S. The Thermal–Optical Trapezoid Model-Based Soil Moisture Estimation Using Landsat-8 Data. Model. Earth Syst. Environ. 2021, 7, 1029–1037. [Google Scholar] [CrossRef]
- Guha, S.; Govil, H. Land Surface Temperature and Normalized Difference Vegetation Index Relationship: A Seasonal Study on a Tropical City. SN Appl. Sci. 2020, 2, 1661. [Google Scholar] [CrossRef]
- Imfeld, N.; Barreto Schuler, C.; Correa Marrou, K.M.; Jacques-Coper, M.; Sedlmeier, K.; Gubler, S.; Huerta, A.; Brönnimann, S. Summertime Precipitation Deficits in the Southern Peruvian Highlands since 1964. Int. J. Climatol. 2019, 39, 4497–4513. [Google Scholar] [CrossRef]
- Mortensen, E.; Wu, S.; Notaro, M.; Vavrus, S.; Montgomery, R.; De Piérola, J.; Sánchez, C.; Block, P. Regression-Based Season-Ahead Drought Prediction for Southern Peru Conditioned on Large-Scale Climate Variables. Hydrol. Earth Syst. Sci. 2018, 22, 287–303. [Google Scholar] [CrossRef]
- Potter, E.R.; Fyffe, C.L.; Orr, A.; Quincey, D.J.; Ross, A.N.; Rangecroft, S.; Medina, K.; Burns, H.; Llacza, A.; Jacome, G.; et al. A Future of Extreme Precipitation and Droughts in the Peruvian Andes. NPJ Clim. Atmos. Sci. 2023, 6, 96. [Google Scholar] [CrossRef]


| Data | Year | Product Identifier | Sensing Time (hh:mm:ss) | Cloud Cover % | Patch/Row |
|---|---|---|---|---|---|
| Landsat 5 | 1985 | LANDSAT/LT05/C01/T1_SR/LT05_002072_19850328 | 14:12:01 | 3 | 02/72 |
| 1985 | LANDSAT/LT05/C01/T1_SR/LT05_002073_19850328 | 14:12:25 | 8 | 02/73 | |
| Landsat 5 | 1990 | LANDSAT/LT05/C01/T1_SR/LT05_002072_19891204 | 14:05:25 | 2 | 02/72 |
| 1990 | LANDSAT/LT05/C01/T1_SR/LT05_002073_19900121 | 14:04:21 | 5 | 02/73 | |
| Landsat 5 | 1995 | LANDSAT/LT05/C01/T1_SR/LT05_002073_19950324 | 13:51:52 | 1 | 02/73 |
| Landsat 5 | 2000 | LANDSAT/LT05/C01/T1_SR/LT05_002073_20000321 | 14:16:05 | 1 | 02/73 |
| Landsat 5 | 2005 | LANDSAT/LT05/C01/T1_SR/LT05_002072_20050319 | 14:28:38 | 2 | 02/72 |
| 2005 | LANDSAT/LT05/C01/T1_SR/LT05_002073_20050319 | 14:29:02 | 0 | 02/73 | |
| Landsat 5 | 2010 | LANDSAT/LT05/C01/T1_SR/LT05_002073_20100213 | 14:32:56 | 9 | 02/73 |
| Landsat 8 | 2015 | LANDSAT/LC08/C01/T1_SR/LC08_002073_20150315 | 14:41:38 | 0.55 | 02/73 |
| Landsat 8 | 2020 | LANDSAT/LC08/C01/T1_SR/LC08_002072_20200328 | 14:41:22 | 5.98 | 02/72 |
| 2020 | LANDSAT/LC08/C01/T1_SR/LC08_002073_20200225 | 14:42:01 | 6.43 | 02/73 | |
| Landsat 8 | 2024 | LANDSAT/LC08/C02/T1_TOA/LC08_002073_20240204 | 14:42:08 | 0.05 | 02/73 |
| VegetationDensity | NDVI | 1985 | 1990 | 1995 | 2000 | 2005 | 2010 | 2015 | 2020 | 2024 | |||||||||
|---|---|---|---|---|---|---|---|---|---|---|---|---|---|---|---|---|---|---|---|
| ha | % | ha | % | ha | % | ha | % | ha | % | ha | % | ha | % | ha | % | ha | % | ||
| Withered | 0.1–0.21 | 2644.1 | 54 | 2389.8 | 43 | 2431.4 | 46 | 3212.1 | 48 | 4278.0 | 45 | 5743.4 | 46 | 10,798.7 | 49 | 13,859.7 | 47 | 18,231.4 | 51 |
| Severe | 0.21–0.25 | 770.8 | 16 | 966.9 | 18 | 854.4 | 16 | 1011.0 | 15 | 1389.6 | 15 | 1771.0 | 14 | 2417.7 | 11 | 3394.3 | 12 | 4638.4 | 13 |
| Moderate | 0.25–0.37 | 1196.4 | 24 | 1761.0 | 32 | 1555.6 | 29 | 1867.2 | 28 | 2659.1 | 28 | 3459.9 | 28 | 5410.6 | 24 | 6841.2 | 23 | 8776.6 | 25 |
| Slight | 0.37–0.42 | 167.9 | 3 | 238.9 | 4 | 256.6 | 5 | 305.4 | 5 | 486.3 | 5 | 694.7 | 6 | 1450.3 | 7 | 1841.1 | 6 | 1968.5 | 6 |
| Healthy | 0.42–1 | 156.4 | 3 | 159.7 | 3 | 227.8 | 4 | 361.7 | 5 | 614.2 | 7 | 702.2 | 6 | 2127.9 | 10 | 3659.8 | 12 | 1944.8 | 5 |
| Total | 4935.5 | 100 | 5516.3 | 100 | 5325.8 | 100 | 6757.4 | 100 | 9427.2 | 100 | 12,371.2 | 100 | 22,205.2 | 100 | 29,596.2 | 100 | 35,559.7 | 100 | |
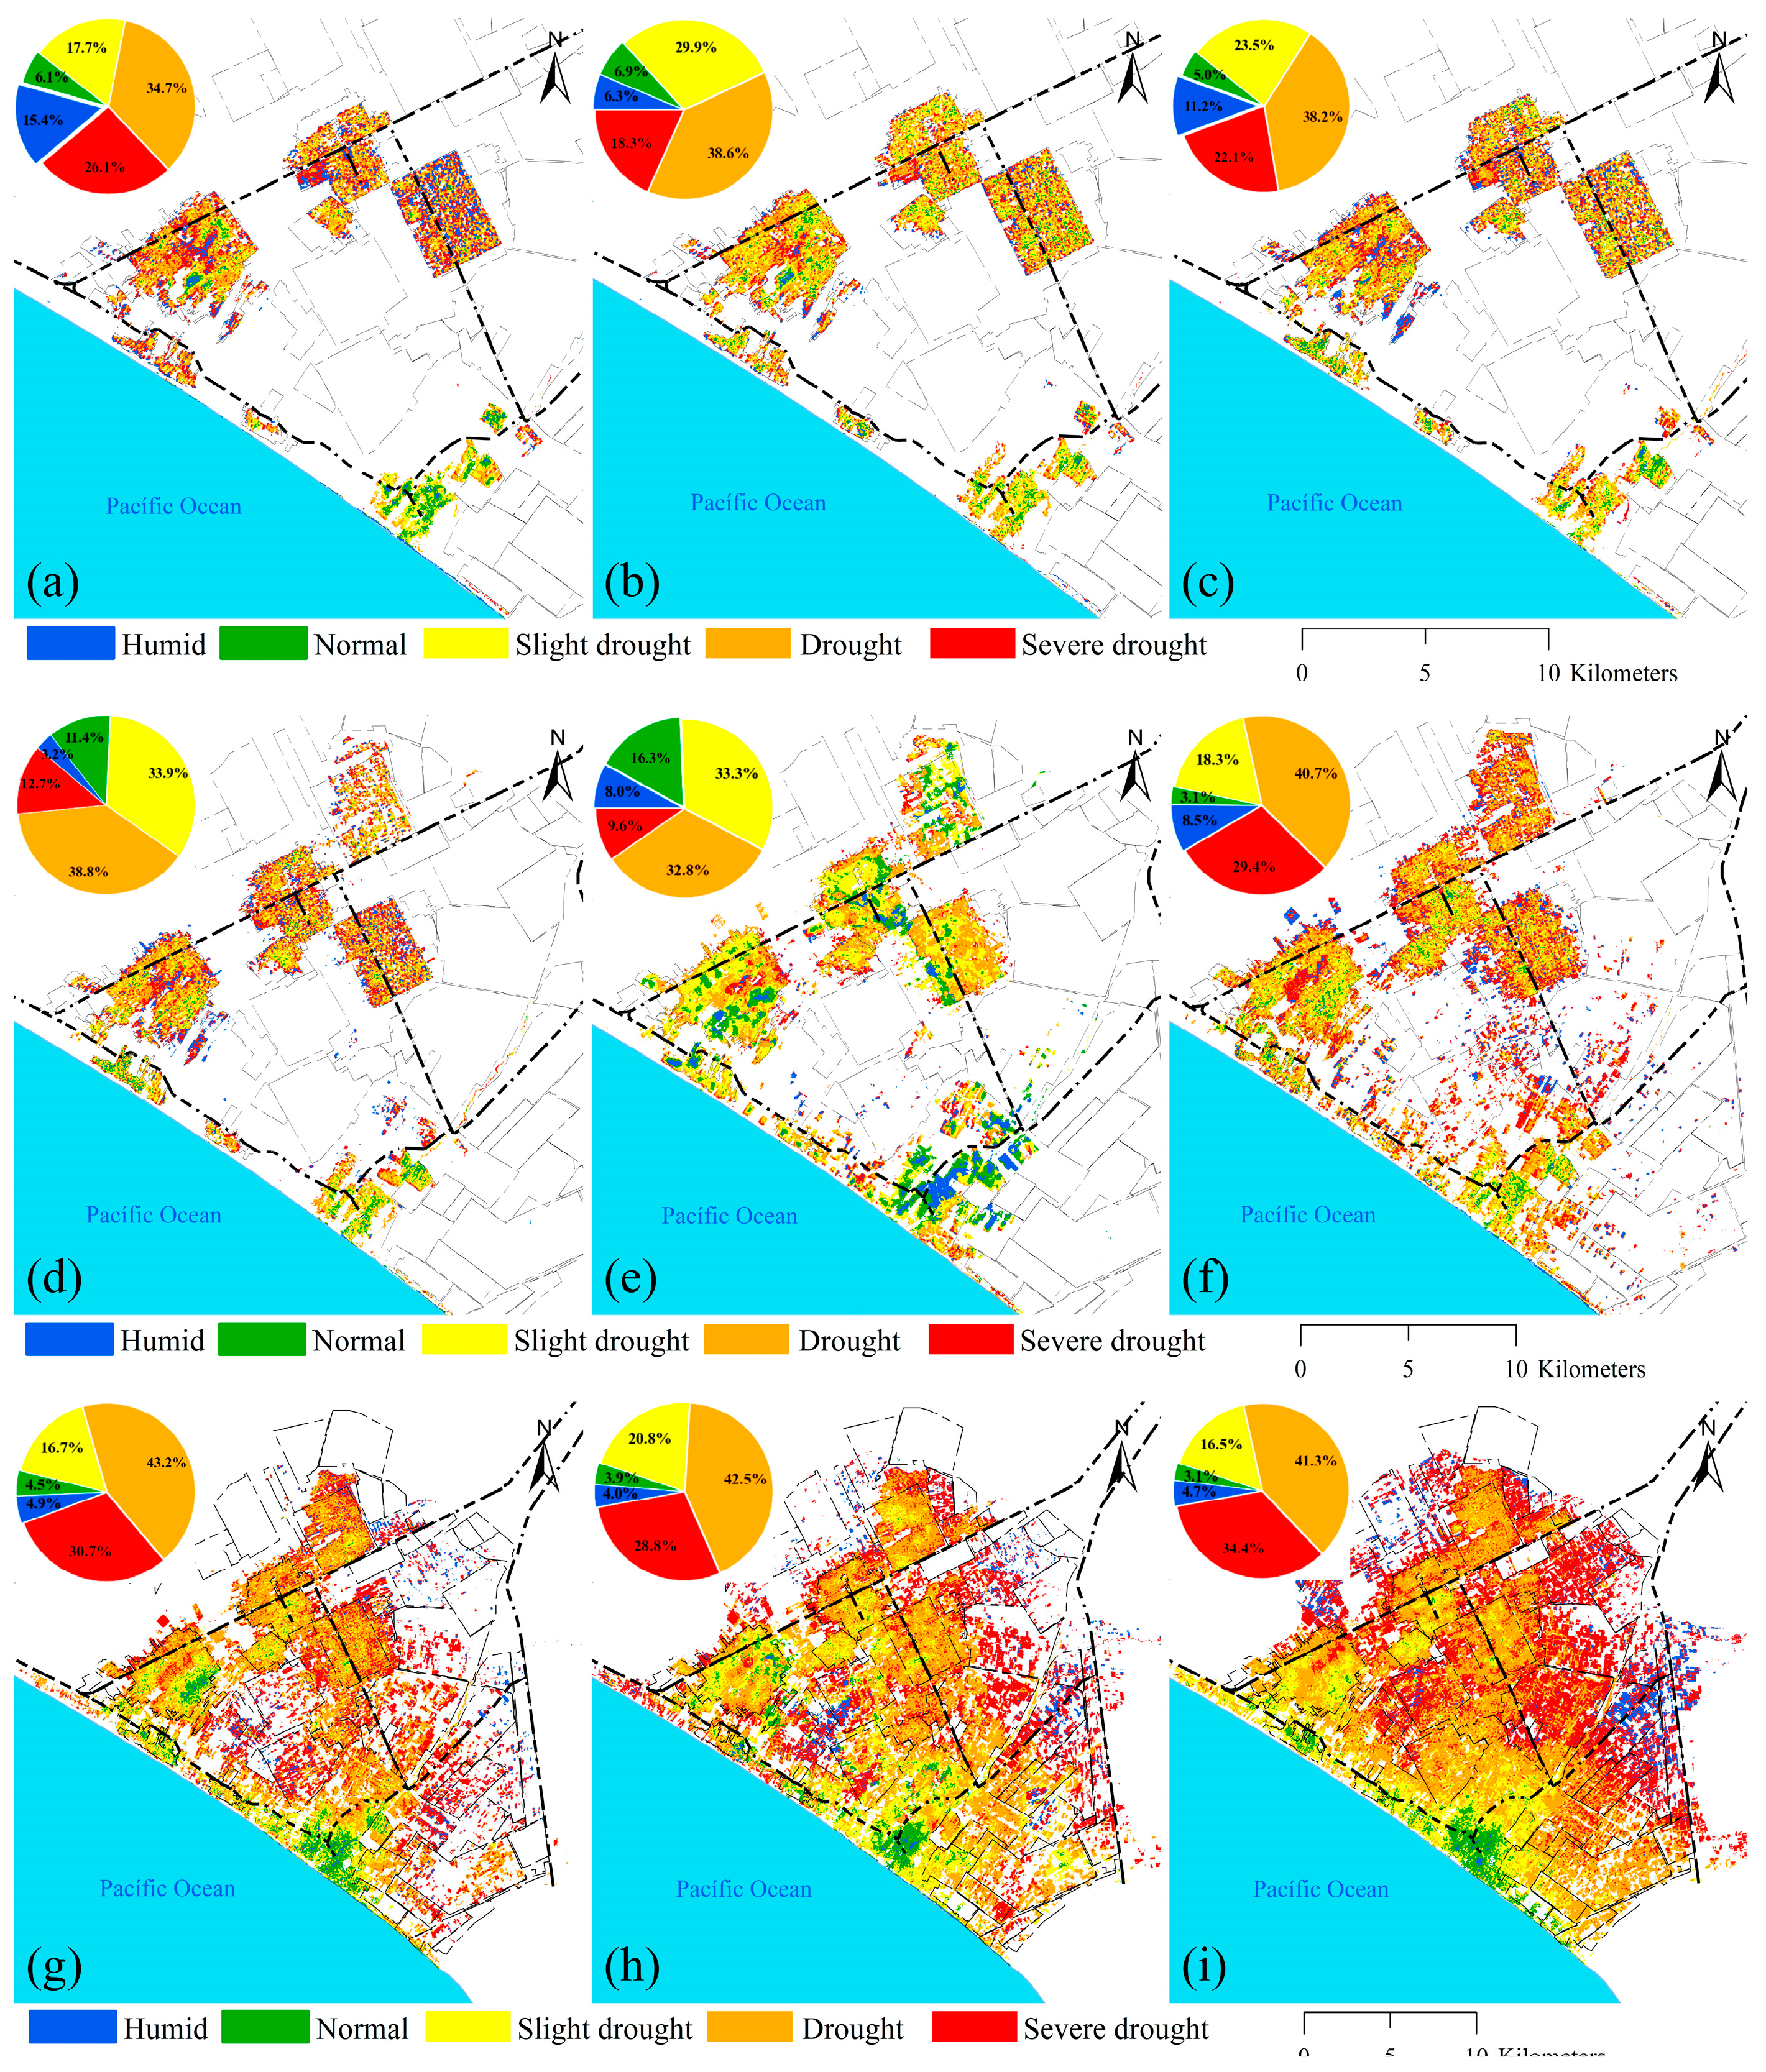
| Vegetation Density | TVDINDVI | 1985 | 1990 | 1995 | 2000 | 2005 | 2010 | 2015 | 2020 | 2024 | |||||||||
|---|---|---|---|---|---|---|---|---|---|---|---|---|---|---|---|---|---|---|---|
| ha | % | ha | % | ha | % | ha | % | ha | % | ha | % | ha | % | ha | % | ha | % | ||
| Humid | 0–0.2 | 498.2 | 10 | 558.7 | 10 | 553.9 | 10 | 535.4 | 8 | 781.1 | 8 | 596.0 | 5 | 1081.9 | 5 | 1112.9 | 4 | 2575.5 | 7 |
| Normal | 0.2–0.4 | 364.8 | 7 | 308.1 | 6 | 283.5 | 5 | 448.5 | 7 | 1501.4 | 16 | 737.7 | 6 | 1000.5 | 5 | 1207.9 | 4 | 1118.7 | 3 |
| Slight drought | 0.4–0.6 | 1093.8 | 22 | 1374.8 | 25 | 1309.2 | 25 | 1748.8 | 26 | 3071.0 | 33 | 3092.9 | 25 | 3710.4 | 17 | 6326.6 | 21 | 5211.0 | 15 |
| Drought | 0.6–0.8 | 1854.9 | 38 | 2064.8 | 37 | 2043.7 | 38 | 2611.4 | 39 | 3112.1 | 33 | 5220.4 | 42 | 9610.0 | 43 | 12602.8 | 43 | 13,552.1 | 38 |
| Severe drought | 0.8–1 | 1123.8 | 23 | 1210.0 | 22 | 1135.3 | 21 | 1413.3 | 21 | 961.6 | 10 | 2724.1 | 22 | 6802.4 | 31 | 8346.0 | 28 | 13,102.4 | 37 |
| Total | 4935.5 | 100 | 5516.3 | 100 | 5325.8 | 100 | 6757.4 | 100 | 9427.2 | 100 | 12,371.2 | 100 | 22,205.2 | 100 | 29,596.2 | 100 | 35,559.7 | 100 | |
| Vegetation Density | TVDIEVI2 | 1985 | 1990 | 1995 | 2000 | 2005 | 2010 | 2015 | 2020 | 2024 | |||||||||
|---|---|---|---|---|---|---|---|---|---|---|---|---|---|---|---|---|---|---|---|
| ha | % | ha | % | ha | % | ha | % | ha | % | ha | % | ha | % | ha | % | ha | % | ||
| Humid | 0–0.2 | 562.1 | 11 | 284.0 | 5 | 332.6 | 6 | 379.0 | 6 | 670.8 | 7 | 399.9 | 3 | 579.9 | 3 | 525.8 | 2 | 1285.8 | 4 |
| Normal | 0.2–0.4 | 371.7 | 8 | 770.4 | 14 | 555.0 | 10 | 779.3 | 12 | 1882.2 | 20 | 1415.9 | 11 | 1833.1 | 8 | 1913.0 | 7 | 1304.5 | 4 |
| Slight drought | 0.4–0.6 | 1111.7 | 23 | 2054.1 | 37 | 1879.4 | 35 | 2317.4 | 34 | 3630.3 | 39 | 4189.2 | 34 | 5851.4 | 26 | 8505.7 | 29 | 6512.7 | 18 |
| Drought | 0.6–0.8 | 1811.4 | 37 | 1758.3 | 32 | 1840.4 | 35 | 2378.2 | 35 | 2732.5 | 29 | 4801.7 | 39 | 10,352.8 | 47 | 12,439.9 | 42 | 15,093.9 | 42 |
| Severe drought | 0.8–1 | 1078.7 | 22 | 649.6 | 12 | 718.5 | 14 | 903.4 | 13 | 511.5 | 5 | 1564.5 | 13 | 3588.0 | 16 | 6211.8 | 21 | 11,362.9 | 32 |
| Total | 4935.5 | 100 | 5516.3 | 100 | 5325.8 | 100 | 6757.4 | 100 | 9427.2 | 100 | 12371.2 | 100 | 22,205.2 | 100 | 29,596.2 | 100 | 35,559.7 | 100 | |
| Vegetation Density | TVDISAVI | 1985 | 1990 | 1995 | 2000 | 2005 | 2010 | 2015 | 2020 | 2024 | |||||||||
|---|---|---|---|---|---|---|---|---|---|---|---|---|---|---|---|---|---|---|---|
| ha | % | ha | % | ha | % | ha | % | ha | % | ha | % | ha | % | ha | % | ha | % | ||
| Humid | 0–0.2 | 744.0 | 15 | 349.8 | 6 | 592.6 | 11 | 758.0 | 11 | 757.7 | 8 | 1045.4 | 9 | 1084.5 | 5 | 1188.6 | 4 | 1671.6 | 5 |
| Normal | 0.2–0.4 | 300.4 | 6 | 382.5 | 7 | 264.5 | 5 | 286.2 | 4 | 3136.1 | 16 | 385.3 | 3 | 998.7 | 5 | 1159.5 | 4 | 1106.7 | 3 |
| Slight drought | 0.4–0.6 | 879.6 | 18 | 1649.4 | 30 | 1252.7 | 24 | 1383.5 | 21 | 1543.8 | 33 | 2261.5 | 18 | 3707.1 | 17 | 6148.8 | 21 | 5854.8 | 16 |
| Drought | 0.6–0.8 | 1720.7 | 35 | 2127.5 | 39 | 2036.4 | 38 | 2606.5 | 39 | 3087.6 | 33 | 5039.0 | 41 | 9605.9 | 43 | 12,569.2 | 43 | 14,692.4 | 41 |
| Severe drought | 0.8–1 | 1290.8 | 26 | 1007.1 | 18 | 1179.5 | 22 | 1723.2 | 26 | 902.1 | 10 | 3640.0 | 29 | 6808.9 | 31 | 8530.0 | 29 | 12,234.2 | 34 |
| Total | 4935.5 | 100 | 5516.3 | 100 | 5325.8 | 100 | 6757.4 | 100 | 9427.2 | 100 | 12,371.2 | 100 | 22,205.2 | 100 | 29,596.2 | 100 | 35,559.7 | 100 | |
Disclaimer/Publisher’s Note: The statements, opinions and data contained in all publications are solely those of the individual author(s) and contributor(s) and not of MDPI and/or the editor(s). MDPI and/or the editor(s) disclaim responsibility for any injury to people or property resulting from any ideas, methods, instructions or products referred to in the content. |
© 2024 by the authors. Licensee MDPI, Basel, Switzerland. This article is an open access article distributed under the terms and conditions of the Creative Commons Attribution (CC BY) license (https://creativecommons.org/licenses/by/4.0/).
Share and Cite
Quille-Mamani, J.A.; Huayna, G.; Pino-Vargas, E.; Chucuya-Mamani, S.; Vera-Barrios, B.; Ramos-Fernandez, L.; Espinoza-Molina, J.; Cabrera-Olivera, F. Spatio-Temporal Evolution of Olive Tree Water Status Using Land Surface Temperature and Vegetation Indices Derived from Landsat 5 and 8 Satellite Imagery in Southern Peru. Agriculture 2024, 14, 662. https://doi.org/10.3390/agriculture14050662
Quille-Mamani JA, Huayna G, Pino-Vargas E, Chucuya-Mamani S, Vera-Barrios B, Ramos-Fernandez L, Espinoza-Molina J, Cabrera-Olivera F. Spatio-Temporal Evolution of Olive Tree Water Status Using Land Surface Temperature and Vegetation Indices Derived from Landsat 5 and 8 Satellite Imagery in Southern Peru. Agriculture. 2024; 14(5):662. https://doi.org/10.3390/agriculture14050662
Chicago/Turabian StyleQuille-Mamani, Javier Alvaro, German Huayna, Edwin Pino-Vargas, Samuel Chucuya-Mamani, Bertha Vera-Barrios, Lia Ramos-Fernandez, Jorge Espinoza-Molina, and Fredy Cabrera-Olivera. 2024. "Spatio-Temporal Evolution of Olive Tree Water Status Using Land Surface Temperature and Vegetation Indices Derived from Landsat 5 and 8 Satellite Imagery in Southern Peru" Agriculture 14, no. 5: 662. https://doi.org/10.3390/agriculture14050662
APA StyleQuille-Mamani, J. A., Huayna, G., Pino-Vargas, E., Chucuya-Mamani, S., Vera-Barrios, B., Ramos-Fernandez, L., Espinoza-Molina, J., & Cabrera-Olivera, F. (2024). Spatio-Temporal Evolution of Olive Tree Water Status Using Land Surface Temperature and Vegetation Indices Derived from Landsat 5 and 8 Satellite Imagery in Southern Peru. Agriculture, 14(5), 662. https://doi.org/10.3390/agriculture14050662