Abstract
Drone multispectral technology enables the real-time monitoring and analysis of soil moisture across vast agricultural lands. overcoming the time-consuming, labor-intensive, and spatial discontinuity constraints of traditional methods. This study establishes a rapid inversion model for deep soil moisture (0–200 cm) in dryland agriculture using data from drone-based multispectral remote sensing. Maize, millet, sorghum, and potatoes were selected for this study, with multispectral data, canopy leaf, and soil moisture content at various depths collected every 3 to 6 days. Vegetation indices highly correlated with crop canopy leaf moisture content (p < 0.01) and were identified using Pearson correlation analysis, leading to the development of linear and nonlinear regression models for predicting moisture content in canopy leaves and soil. The results show a significant linear correlation between the predicted and actual canopy leaf moisture levels for the four crops, according to the chosen vegetation indices. The use of canopy leaf moisture content to predict surface soil moisture (0–20 cm) demonstrated enhanced accuracy. The models designed for the top 20 cm of soil moisture successfully estimated deep soil moisture levels (up to 200 cm) for all four crops. The 20 cm range soil moisture model showed improvements over the 10 cm range model, with increases in Root Mean Square Error (RMSE), Mean Absolute Error (MAE), Coefficient of Determination (R2), and Nash–Sutcliffe Efficiency Coefficient (NSE) by 0.4, 0.8, 0.73, and 0.34, respectively, in the corn area; 0.28, 0.69, 0.48, and 0.25 in the millet area; 0.4, 0.48, 0.22, and 0.52 in the sorghum area; and 1.14, 0.81, 0.73, and 0.56 in the potato area, all with an average Relative Error (RE) of less than 10% across the crops. Using drone-based multispectral technology, this study forecasts leaf water content via vegetation index analysis, facilitating swift and effective soil moisture inversion. This research introduces a novel method for monitoring and managing agricultural water resources, providing a scientific basis for precision farming and moisture variation monitoring in dryland areas.
1. Introduction
Agriculture forms the foundation of global economic and social development. The demand for precision agriculture is on the rise, with soil moisture being a key determinant of crop yield and quality [1,2,3]. The accuracy of soil moisture monitoring directly impacts the study of soil nutrient availability and crop root zone soil moisture (0–1 m) serves as a critical variable in hydrological and weather forecasting models [4,5]. Conventional soil moisture monitoring methods are laborious and time-intensive, making large-scale real-time observation challenging [6]. Consequently, this study, utilizing drone-based multispectral technology for the rapid assessment of soil moisture, is vital for implementing precision agriculture management.
In recent years, the application of multispectral remote sensing technology in monitoring crop growth and analyzing soil characteristics has gradually increased [7,8,9,10,11]. In southern Africa, Ndlovu H S et al. [12] utilized drone-based multispectral imagery to precisely estimate maize leaf water indices for crop monitoring and early warning system development, aiming to optimize agricultural production in smallholder farms. The study revealed that spectral variables derived from near-infrared and red-edge bands are significant indicators of maize moisture. In research conducted in the Netherlands, Ullah S et al. [13] used narrow-band spectral indices and Partial Least Squares Regression (PLSR) to evaluate the intensity of each spectral region. They found that the Mid-Infrared (MIR) and Short-Wave Infrared (SWIR) domains are the most sensitive spectral regions for inversing leaf water content. In another study using continuous wavelet analysis to detect changes in leaf water content, results indicated that leaf water content can be accurately inversed from the mid-thermal infrared domain of electromagnetic radiation, offering a new monitoring tool for crop water management [14]. In China, Yu Xufeng [15] proposed a method to detect water content in fresh potato leaves using near infrared spectroscopy. The partial least squares regression (PLSR) model and the BP neural network model can effectively predict the water content of potato leaves. It was shown that these two models had high accuracy and reliability in predicting the water content of potato leaves, with the BP neural network model having better predictability. In addition, the prediction accuracy of the models can be further improved by the selection of feature wavelengths. BIAN [16] utilized an unmanned aerial vehicle (UAV) equipped with thermal infrared and multispectral sensors to diagnose the water stress condition of cotton through the Crop Water Stress Index (CWSI) and a combination of several vegetation indices; the results showed that there was a strong correlation between the CWSI and soil moisture content and stomatal conductance. Zhou [17] utilized wavelet decomposition to extract the characteristic band and established a partial least squares regression model to quantitatively detect lettuce leaf moisture content. The studies have shown that leaf water content can more directly reflect the actual conditions of crop growth and development and is closely related to soil water content [18].
Determining the interrelationship between crop and soil water content is critical to understanding soil and vegetation dynamic interactions [19]; soil water content must be maintained at adequate levels for optimal productivity [20]. In their research on the relationship between soil and plant leaf moisture during the flag leaf to wax ripening stage of winter wheat, Wang Jihua, Zhao Chunjiang [21], and others observed a positive correlation. Significant progress has been made in deriving large-area soil moisture from remote sensing data. Zhang Zhitao [22] employed a hexacopter drone with Multiple Camera Array (MCA) multispectral imaging systems to accurately invert bare soil moisture content by collecting multispectral data on soil samples prepared at different depths (5 cm and 10 cm), and using partial least squares regression, stepwise regression, and ridge regression methods to establish the regression model of soil water content. The results showed that the stepwise regression method had a higher inversion accuracy with a coefficient of determination above 0.7.
The differences in water storage dynamics with integration depth [23] (the differences in water storage dynamics with integration depth) between the surface layer and the root zone and monitoring soil moisture in the root zone can accurately predict the status of vegetation vigor [24,25,26]. Current remote sensing data inversion techniques for soil moisture are more closely associated with surface soil moisture [27], and further research is needed on how to quickly obtain deep soil moisture. Scholars worldwide have explored inverting deep soil moisture from surface soil moisture using methods like empirical formulas and linear regression [28]. Biswas [29] proposed a nonlinear relational model for surface soil moisture inversion of deep soil moisture. For the same shallow soil moisture to simulate soil moisture at different depths of the soil layer, the linear model is usually more accurate in simulating the shallower soil moisture, and the Biswas deep soil moisture estimation model is more accurate in simulating the deeper soil moisture [30]. Liu Jilong [31] utilized the Biswas moisture estimation model to explore the effects of different growth stages of fruit trees on these relationships by establishing conversion relationships between surface and deep soil moisture in a study of pear orchards at the Yantai Academy of Agricultural Sciences. The results showed that the estimation of deep soil moisture from 0 to 50 cm surface soil moisture had a better effect.
Research on integrating leaf water content into spectral inversion for deep soil moisture is currently limited. This study employs drone-based multispectral technology, building on prior research, to swiftly monitor soil moisture in various crops such as corn, millet, sorghum, and potatoes. The research primarily aims to collect and analyze multispectral data from crop canopies, focusing on their correlation with leaf and soil moisture, to develop an effective model for monitoring soil moisture. This model will serve as a scientific foundation for swiftly monitoring deep soil moisture in dry farming areas, benefiting various crops.
2. Materials and Methods
2.1. Overview of the Study Area
The experiment was carried out in 2023 at the Organic Dry Farming Experimental Base in Yuzi Lifang, Jinzhong City (N 37°51′, E 112°45′) (Figure 1). The region belongs to the Loess Plateau zone and has a semi-arid climate, with an average annual temperature of 9.8 °C, rainfall of 418~483 mm, mainly concentrated in the summer, uneven distribution of precipitation, a frost-free period of 145~184 d, and evapotranspiration of 1600~2000 mm. The soil type of the experimental site was a calcareous brown clay, with a medium loamy texture, and the organic matter of the 0–20 cm tillage layer The soil type of the test site was calcareous brown soil, the texture was medium loam, the organic matter content of the 0–20 cm tillage layer was 16.09 g/kg, the alkaline nitrogen content was 49.19 mg/kg, the quick-acting phosphorus content was 14.73 mg/kg, and the quick-acting potassium content was 169.11 mg/kg. The crop was sown on May 9 to May 10, 2023. The base corn variety is Integrity 16, with a full-life span of 129 d; the grain variety is Changsheng 13, with a full-life span of 120 d; the sorghum is a new hybrid variety, with a full-life span of 103 d; and the potato is Jinyuan 16, with a full-life span of 150 d. The base crop was sown from 9 May 2023 to 10 May 2023, and the base crop was sown from 9 May 2023 to 10 May 2023.
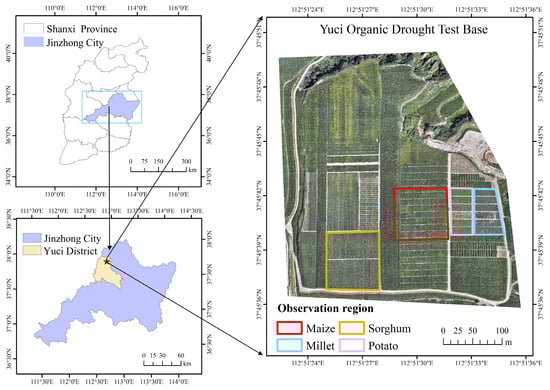
Figure 1.
Location of Study Area in Yuci District, Jinzhong City, Shanxi: A Typical Dry Farming Region.
2.2. Data Acquisition and Processing
2.2.1. Drone-Based Multispectral Data Collection
The study utilized a DJI Mavic 3 multispectral drone, featuring a 4/3 inch visible light CMOS sensor and four monochromatic spectral sensors. These sensors, operating in Red (R), Green (G), Red Edge (RE), and Near-Infrared (NIR) spectra, had central wavelengths of 650 nm, 560 nm, 730 nm, and 860 nm, with bandwidths of 16 nm (except for NIR at 26 nm). High-resolution multispectral remote sensing images were captured at a 65-m altitude. Concurrently, data on canopy leaf moisture and soil moisture were recorded. Flights occurred from 10:00 AM to 12:00 PM, maintaining a 70% flight path overlap and 80% side overlap. Calibration cloth was used to gather data for radiometric corrections. Spectral reflectance data from various bands were extracted through image preprocessing using DJI Terra software.
2.2.2. Above-Ground Environmental Data Collection
In the study area, 45 sampling points were established. Canopy leaves collected at these points were geographically coordinated via Real-Time Kinematic (RTK) systems.
Subsequently, the plant leaves were separated, labeled, and sealed in plastic bags for preservation, then transported to the laboratory for further analysis. The initial step involved measuring the fresh weight of the leaves. This was followed by a kill-green process at 105 °C for 30 min. Finally, the leaves were dried at 80 °C until a constant weight was achieved. The final step involved measuring the dry weight to determine moisture content [32] (Formula (1)).
In the formula, represents the moisture content of the canopy leaves; represents the fresh weight of the leaves; and represents the dry weight of the leaves.
Surface soil volumetric moisture content (0–20 cm) was measured by RS485 temperature and humidity sensors every 3 to 4 days to obtain it. The mass water content of the deep soil (0–200 cm depth) was measured by soil auger sampling, from the top to the bottom of the soil layer, sampling every 10 cm until the depth of 20 cm, and then every 20 cm until the depth of 200 cm, for a total of 15 measurements during the entire growth cycle. Mass water content measurement employed the drying and weighing method (Formula (2)). Soil bulk density (0–200 cm) was determined using the ring knife method, involving three replicates per layer and averaging the results (Formula (3)). Subsequently, mass water content was converted into volumetric water content (Formula (4)).
In the formula, represents the soil’s mass water content (g/g); denotes the weight of the aluminum box (g); is the total weight of the aluminum box and wet soil (g); and signifies the total weight of the aluminum box and dry soil (g).
Converting Mas Water Content into Volumetric Water Content,
In the formula, represents the soil bulk density (g·cm3); is the weight of the ring knife and dry soil (g); is the weight of the ring knife (g); is the volume of the ring knife (cm3); and is the volumetric water content of the soil (%).
2.3. Selection of Vegetation Indices
This experiment established 14 primary vegetation indices using the drone’s multispectral sensor channels, as detailed in Table 1 [33,34,35]. The selection of sensitive vegetation indices aimed to minimize spectral variable redundancy, streamline the inversion model, and enhance its accuracy [36]. Consequently, Pearson correlation analysis was employed to identify crucial sensitive vegetation indices pertinent to the crops.

Table 1.
Formulas for Calculating Vegetation Indices.
2.4. Model Construction and Evaluation
Linear regression primarily examines the linear correlation between two variables, describing the impact of one numerical variable’s changes on another. In this model, x represents the independent variable, y the dependent variable, and a, b, c are constants. The essence of simple linear regression is to estimate unknown parameters a and b based on sample observations of x and y. The study conducts regression analysis on the data and calculates the correlation coefficient to verify the accuracy of the resulting regression model.
The Biswas soil moisture monitoring model is designed for simulating and forecasting soil moisture dynamics, taking into account soil layers at various depths, each with its specific moisture holding capacity. This facilitates more accurate modeling of moisture dynamics across different depths. Using actual measurement data, the model’s ability to estimate soil moisture content from 0 to 200 cm depth is verified and evaluated based on the Biswas soil moisture estimation model. For further details, you might consider reviewing sources that discuss the Biswas model and its applications in soil moisture estimation.
In the formula, denotes the moisture storage within the 0-d cm soil layer, while represents the moisture storage of the soil’s surface layer in cm. , , and are constants that quantify the nonlinear relationship between the moisture storage in the surface and deeper soil layers.
To establish the Biswas model, it IS essential to initially deduce the three coefficients , , and . For the sake of simplifying calculations, Equation (5) is transformed accordingly.
Set ; ; ; with these substitutions, Formula (5) is transformed accordingly.
To investigate the relationships between vegetation indices, leaf water content, surface soil water content, and deep soil moisture (0–200 cm), we employed correlation and regression analysis methods, as well as the Biswas model [37]. For the four crop types, data were partitioned with 80% allocated for model development and 20% for validation purposes [38]. Model evaluation was conducted using five metrics: Root Mean Square Error (RMSE), Mean Absolute Error (MAE), Coefficient of Determination (R2), Relative Error (RE), and Nash–Sutcliffe Efficiency Coefficient (NSE).
3. Results and Analysis
3.1. Modeling Canopy Leaf Moisture Content Using Vegetation Indices
Pearson correlation analysis, involving 14 vegetation indices and canopy leaf moisture content for four crops, indicated highly significant correlations (p < 0.01) across all indices (Table 2). Correlation coefficients varied among crops, ranging from 0.678 to 0.897 for corn, 0.824 to 0.878 for millet, 0.646 to 0.871 for sorghum, and 0.349 to 0.859 for potatoes. To ensure the model’s simplicity and efficiency, for each crop type, the top six vegetation indices were selected in order of their correlation strength, from the highest to the lowest. Specifically, selected indices included WDRVI, RVI, MSR, NDGI, NDVI, and SAVI for corn; OSAVI, RDVI, MSR, NLI, RVI2, and RVI for millet; OSAVI, NLI, MSR, NDVI, SAVI, and GI for sorghum; and TVI, DVI, RDVI, OSAVI, NLI, and GNDVI for potatoes.
Table 2.
Correlation of Spectral Bands and Vegetation Indices with Canopy Leaf Moisture Content.
In this study, linear and nonlinear regression models were constructed to analyze the relationship between canopy leaf moisture content and vegetation indices. The findings (refer to Table 3) reveal that nonlinear regression models significantly correlated with the moisture content in four crops (corn, millet, sorghum, and potato), evidenced by high R2 values (corn: 0.80–0.86, millet: 0.76–0.82, sorghum: 0.74–0.85, potato: 0.67–0.78). These results suggest that nonlinear models more accurately represent this relationship than linear models, highlighting a notable statistical link between vegetation indices and canopy leaf moisture.
Table 3.
Univariate Regression Analysis of Vegetation Indices and Canopy Leaf Moisture Content Across Various Crops.
3.2. Modeling Canopy Leaf Moisture and Surface Soil Moisture Content
A correlation analysis assessed the relationship between canopy leaf moisture content and soil moisture at depths of 0–10 cm and 0–20 cm in corn, millet, sorghum, and potato observation areas. The correlation coefficients were 0.660 for corn, 0.596 for millet, 0.483 for sorghum, and 0.505 for potato, indicating varying degrees of association between canopy leaf moisture and soil moisture at 0–10 cm depth. Additionally, the correlations with soil moisture at 0–20 cm were significantly higher: 0.852 for corn, 0.832 for millet, 0.843 for sorghum, and 0.845 for potato (p < 0.01). This indicates a significant positive correlation between the two, emphasizing the potential impact of leaf moisture status on soil moisture conditions. Linear regression models were established using canopy leaf moisture content of different crops as input variables to predict two distinct soil surface depths (Table 4). The results show that the model’s R2 values for canopy leaf moisture and soil moisture at depths of 0–20 cm are generally higher than those for depths of 0–10 cm, suggesting a stronger predictive capability of canopy leaf moisture for soil surface moisture content at depths of 0–20 cm.
Table 4.
Univariate Regression Models Comparing Canopy Leaf Moisture Content with Surface Soil Layers Across Various Crops.
3.3. The Biswas Model for Soil Moisture Estimation
Experimental data analysis showed variations in soil moisture coefficients at varying depths for corn, millet, sorghum, and potatoes (Table 5). In corn and sorghum, soil moisture variation decreased between 10 and 100 cm depths, rose at 120–140 cm, and stabilized at approximately 12% and 10% beyond 140 cm, respectively. Millet showed a decrease in soil moisture variation from 10 to 60 cm, an increase from 80 to 100 cm, and stabilization at about 12% past 140 cm. In potatoes, the variation decreased from 10 to 60 cm, increased at 80 cm, and then stabilized at approximately 12% beyond 140 cm. These findings suggest a general decrease in soil moisture variation with increasing depth across different crops. Soil moisture variation for all crops was lower in the 0–20 cm range compared to the 0–10 cm range, with minimal changes beyond 140 cm.
Table 5.
Variations in Soil Moisture Across Different Soil Layers for Various Crops.
In the Biswas soil moisture estimation model, the surface soil layer (d0) was analyzed at depths of 0–10 cm and 0–20 cm. Coefficients for estimating soil moisture content at depths up to 200 cm were identified. Subsequently, models for estimating soil moisture in four different crops, tailored to various surface layer depths, were developed (Table 6).
Table 6.
The Biswas Model for Estimating Soil Moisture.
3.4. Model Validation
3.4.1. Validation of the Vegetation Index and Canopy Leaf Moisture Content Model
The model’s reliability was assessed using a nonlinear regression analysis of six vegetation indices across four crop types. Figure 2 illustrates that the R2 values for predicting leaf water content were above 0.6 for all indices. Specifically, in corn, most R2 values were above 0.7, with Root Mean Square Error (RMSE) ranging from 3.14% to 4.73%, and Mean Absolute Error (MAE) between 2.69% and 4.36%. For millet, indices like OSAVI, NLI, and RDVI showed R2 values exceeding 0.8, demonstrating minimal RMSE and MAE fluctuations. In sorghum, R2 values for OSAVI and NLI were above 0.7, with less than 1% fluctuation in RMSE and MAE. In potatoes, all R2 values surpassed 0.7, with RMSE and MAE ranging from 2.3% to 4.1% and 1.9% to 2.7%, respectively. The comparison of inversion results for canopy leaf moisture content under various crop conditions with actual measurements revealed that the selected vegetation indices, determined through Pearson correlation analysis, effectively represent the relationship between leaf moisture content and the indices, thus providing a solid data foundation for soil moisture content inversion.
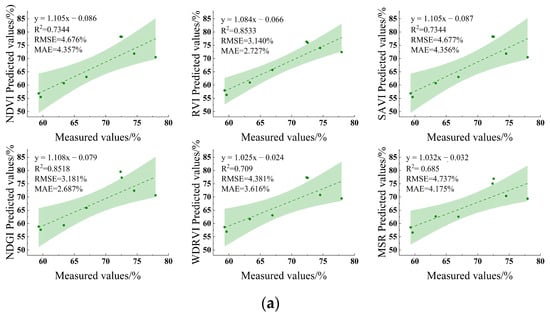
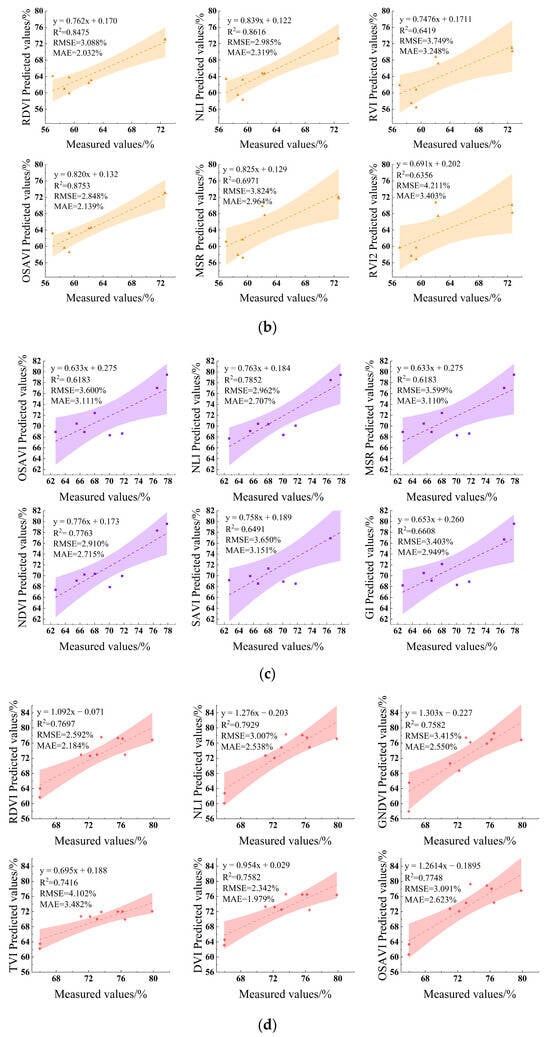
Figure 2.
Comparison between predicted and measured values of canopy leaf moisture content using vegetation index in Maize (a); Millet (b); Sorghum (c); Potato (d).
3.4.2. Validation of a Predictive Model for Assessing Canopy Leaf and Soil Surface Water Content
The models estimating soil surface water content at depths of 0–10 cm and 0–20 cm were validated for corn, millet, sorghum, and potatoes. Validation results reveal that the models’ R2 values for the linear relationships are 0.677 for corn, 0.643 for millet, 0.641 for sorghum, and 0.680 for potatoes, respectively. The models exhibited RMSE values of 2.46% for corn, 1.52% for millet, 1.70% for sorghum, and 1.69% for potatoes, and MAE values of 2.1%, 1.3%, 1.3%, and 1.4%, respectively (Figure 3). This suggests a superior fit of the 0–20 cm models over the 0–10 cm models for all crops in estimating soil water content. The reduced RMSE and MAE values further confirm the models’ accuracy in predicting soil water content at 0~20 cm, supporting the inversion analysis of deeper soil moisture.
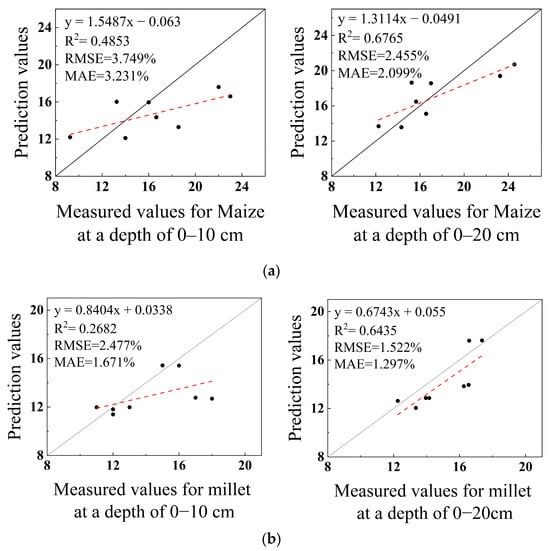
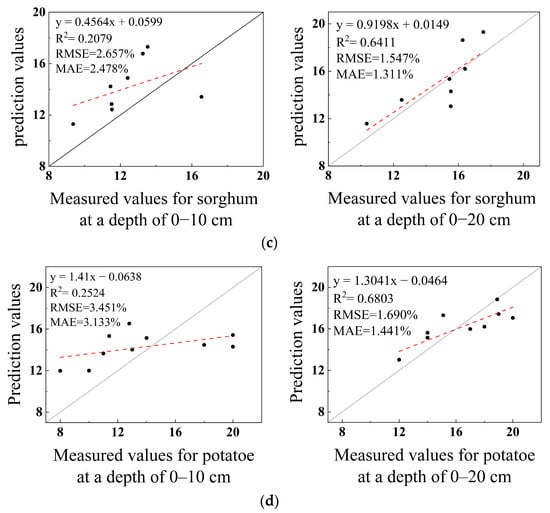
Figure 3.
Comparison between predicted and measured values of surface soil moisture content using canopy leaf water content in Maize (a), Millet (b), Sorghum (c), Potato (d).
3.4.3. Verification of the Biswas Model for Estimating Soil Moisture
The Biswas model predicted deep soil moisture content (20–200 cm) using surface soil moisture data (0–10 cm and 0–20 cm). Model performance was assessed with five metrics: RMSE, MAE, NSE, R2, and RE. Table 7 shows the 0–20 cm data-based model outperforms the 10 cm model in estimating deep soil moisture. Relative to the 10 cm model, the corn area saw improvements in R2 (0.4), RMSE (0.8), MAE (0.73), and NSE (0.34). In the millet area, improvements were R2 (0.28), RMSE (0.69), MAE (0.48), and NSE (0.25). For sorghum, there were improvements in R2 (0.4), RMSE (0.48), MAE (0.22), and NSE (0.52). In the potato area, the model showed improvements in R2 (1.14), RMSE (0.81), MAE (0.73), and NSE (0.56). These findings suggest the 0–20 cm data-based model excels at estimating deep soil moisture content.
Table 7.
Evaluation of the Biswas Inversion Model.
The analysis in Figure 4 indicates that with d0 set to 10 cm, the RE for most crops remains under 10%. However, at certain depths, RE increases. For corn, RE ranges from 13.8% to 25.76% at depths of 20–40 cm, 120 cm, and 200 cm. Millet demonstrates RE values between 12.29% and 26.10% at depths of 20–100 cm. Sorghum shows a significant RE of 29.28% at 40 cm depth. Potatoes exhibit RE ranging from 21.88% to 35.69% at depths of 20–40 cm and 120 cm. With d0 at 20 cm, most crops maintain RE below 10%. Yet, corn’s RE reaches 24.03% at 120 cm. Millet displays RE of 18.40% at 60 cm and 12.75% at 80 cm. Potatoes exhibit a 15.85% RE at 120 cm depth. A comparison of RE values under different d0 settings suggests that a 20 cm setting generally yields better inversion performance than 10 cm. Consequently, this experiment recommends using 0–20 cm soil moisture data to estimate the 200 cm soil moisture content for corn, millet, and sorghum.
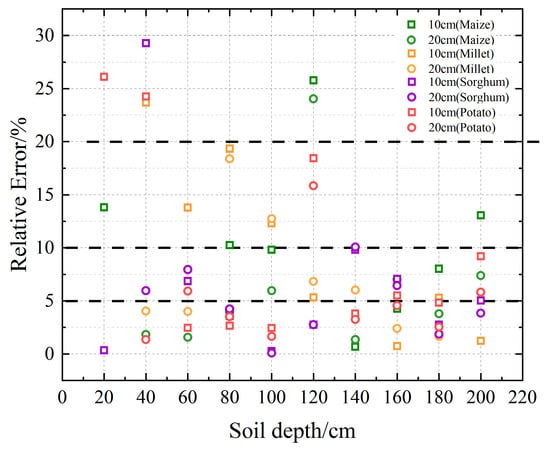
Figure 4.
Error Distribution of Soil Moisture Content Inversion from Different Surface Layers for Depths of 0–200 cm.
4. Discussion
Increased vegetation coverage from growing crops poses challenges for drones in directly capturing soil spectral reflectance. Furthermore, an interaction exists between canopy leaf water content and soil moisture [39]. This study considered canopy leaf water content to enhance understanding of water content dynamics in both vegetation and soil. The results indicate that leaf water content models, developed through Pearson correlation analysis, show high inversion accuracy for all crops, confirming their predictive reliability. This corroborates with prior studies [40,41], validating the feasibility of multispectral data-based models for quantitatively estimating canopy leaf water content [42].
Correlation models were established between soil moisture at depths of 0–10 cm and 0–20 cm and leaf water content for four crops: corn, millet, sorghum and potatoes. The model for 0–20 cm depth showed higher correlation, yielding validation R2 values of 0.677, 0.643, 0.641, and 0.680 for each crop, respectively. This result aligns with Wang Huaishu et al.’s study [43], which also found a strong correlation between soil moisture at 20 cm depth and leaf water content. Soil moisture at 0–10 cm depth is likely affected by surface evaporation, whereas the 0–20 cm depth offers a broader perspective of soil moisture dynamics and root water uptake, enabling a more accurate depiction of water utilization patterns.
The vegetation index-canopy leaf water content-20 cm surface soil moisture model was used to estimate soil moisture for four major crops (corn, millet, sorghum, and potatoes) at a dryland base on three dates: 18 July, 29 August, and 30 September. According to the hydrological characteristics of the region, soil moisture is mainly influenced by two major factors: infiltration recharge from atmospheric precipitation and crop water absorption. (Figure 5). On 18 July, high water demand during the crops’ rapid growth period and limited rainfall in the dryland area resulted in an average soil moisture content of less than 10%. On 29 August, continuous rainfall temporarily increased the average soil moisture content to between 20% and 25%. By 30 September, the maturation of crops, coupled with cooler temperatures and reduced sunlight, led to decreased soil evaporation and a stabilization of soil moisture content at below 20%. During this period, a potato cultivation region was severely impacted by pest infestations, leading to poor growth and reduced vegetation cover. This, in turn, caused increased soil evaporation and a reduction in soil moisture content. The model’s predictions were consistent with actual measurements, confirming its effectiveness in estimating soil moisture content within the 0 to 20 cm layer.
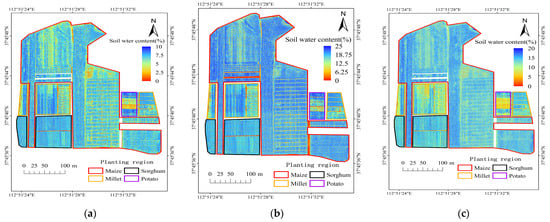
Figure 5.
Soil moisture inversion of 0–20 cm soil layer in four crop planting areas on 18 July (a); 29 August (b); 30 September (c).
Soil moisture movement, influenced by soil permeability, root distribution, and climatic conditions, is complex [44,45]. In our study using the Biswas model for surface soil moisture inversion in deep layers, we observed that the model’s predictions for 0–20 cm soil moisture had better accuracy in terms of R2, RMSE, MAE, NSE and RE compared to measured values. Specifically, for corn, the RE at a depth of 100–120 cm was 24.03%, while for millet, it was 18.40% at 60–80 cm and 12.75% at 80–100 cm depths. This discrepancy could be attributed to the presence of zero-flux surfaces in the soil, where water movement at certain depths is almost negligible [46]. If a zero-flux surface occurs at a specific depth, like the potential extent of corn roots to 100–120 cm in dryland conditions [47], the opposing water movements at this depth counteract each other. This complicates accurate reflection of soil moisture at that depth using surface moisture, leading to significant errors in inversion. For other depth inversions, the RE values ranged between 0 and 10%. This is consistent with Wang Guoyu et al.’s findings [48] in the dryland area of southern Shanxi, where the Biswas model accurately estimated deep soil moisture with an average relative error of approximately 10%. These results further affirm the Biswas model’s capability for inverting deep soil moisture content.
5. Conclusions
This study developed models to estimate deep soil moisture from vegetation indices using Drone multispectral imaging, incorporating data on leaf water content and soil moisture. We applied these models to maize, cereal grains, sorghum, and potatoes in dry-farming environments for rapid soil moisture estimation. Results revealed a strong correlation between vegetation indices and leaf water content for all four crops, with a significance level of 0.01. Moreover, the model accurately predicted leaf water content when estimating soil moisture from 0 to 20 cm deep. Nonlinear regression models, based on six indices related to leaf water, outperformed linear models. This confirmed its effectiveness as a surface soil moisture indicator. Additionally, soil moisture was found to stabilize with depth. The Biswas model confirmed the accuracy of deep soil moisture estimation (0~200 cm) under varying surface conditions (0~10 cm, 0~20 cm). The 20 cm depth model showed improvement in all metrics over the 10 cm model, with enhanced R2, RMSE, MAE, and NSE values for maize, cereal, sorghum, and potatoes. The average error remained below 10%, suggesting the 20 cm model’s superior accuracy in deep soil moisture estimation. In summary, this research highlights Drone multispectral remote sensing’s potential for soil moisture monitoring in dry-farming. It identifies the best model for deep soil moisture estimation in drylands, enhancing monitoring and management efficiency and accuracy.
Author Contributions
Conceptualization, T.Q., Y.L. and Q.Z.; methodology, T.Q., Y.L. and Q.Z.; software, T.Q., Y.L. and Y.Y.; validation, T.Q. and W.Z.; formal analysis, T.Q. and Y.L.; investigation T.Q., Q.Z. and Y.Y.; resources, T.Q., Y.L. and Q.Z.; data curation, T.Q., Y.Y. and Y.W.; writing—original draft preparation, T.Q. and Y.L.; writing—review and editing, T.Q., F.L. and W.Z.; visualization, T.Q. and W.Z.; supervision, Y.Y., F.L. and W.Z.; project administration, T.Q., F.L. and W.Z.; funding acquisition, F.L. and W.Z. All authors have read and agreed to the published version of the manuscript.
Funding
This study and the APC received funding from the National Key Research and Development Program of China (Ministry of Science and Technology of the People’s Republic of China, grant amount: CNY 450,000, Project Number: 2021YFD1901101-5), the Key Research and Development Program of Shanxi Province (Shanxi Provincial Department of Science and Technology, grant amount: CNY 1,100,000, Project Number: 202202140601021), and the Basic Research Project of the Shanxi Provincial Department of Science and Technology (Shanxi Provincial Department of Science and Technology, grant amount: CNY 100,000, Project Number: 202103021224123).
Institutional Review Board Statement
Not applicable.
Data Availability Statement
The datasets during the current study available from the authors on reasonable request.
Acknowledgments
We express our high respect and gratitude to the editors and reviewers, and their help and suggestions are very helpful to our manuscript. I would express my deepest gratitude to my family and friends for being my continuous sources of motivation throughout this journey.
Conflicts of Interest
The authors declare no conflicts of interest.
References
- Presti, D.L.; Di Tocco, J.; Massaroni, C.; Cimini, S.; De Gara, L.; Singh, S.; Raucci, A.; Manganiello, G.; Woo, S.L.; Schena, E.; et al. Current understanding, challenges and perspective on portable systems applied to plant monitoring and precision agriculture. Biosens. Bioelectron. 2023, 222, 115005. [Google Scholar] [CrossRef]
- Zhang, F.; Zhou, G. Research progress on monitoring vegetation water content by using hyperspectral remote sensing. Chin. J. Plant Ecol. 2018, 42, 517–525. [Google Scholar] [CrossRef]
- Zhou, L.; Chen, N.; Chen, Z.; Xing, C. ROSCC: An Efficient Remote Sensing Observation-Sharing Method Based on Cloud Computing for Soil Moisture Mapping in Precision Agriculture. IEEE J. Sel. Top. Appl. Earth Obs. Remote Sens. 2016, 12, 5588–5598. [Google Scholar] [CrossRef]
- Kim, H.N.; Park, J.H. Monitoring of soil EC for the prediction of soil nutrient regime under different soil water and organic matter contents. Appl. Biol. Chem. 2024, 67, 1. [Google Scholar] [CrossRef]
- Reichle, R.H. Assimilation of satellite observed brightness temperature and terrestrial water storage into the Catchment land surface model for improved soil moisture estimation. In Proceedings of the Agu Fall Meeting, San Francisco, CA, USA, 14–18 December 2015. AGU Fall Meeting Abstracts. [Google Scholar]
- Li, X.; Liang, B.; Bai, X.; Li, N. Research Progress on Spectroscopic Techniques for Soil Moisture Content Detection. Spectrosc. Spectr. Anal. 2020, 40, 3705–3710. [Google Scholar]
- Liu, Y.; Sun, Q.; Feng, H.; Yang, F. Estimation of Aboveground Biomass of Potatoes Based on Wavelet Analysis. Spectrosc. Spectr. Anal. 2021, 41, 1205–1212. [Google Scholar]
- Li, X.-X.; Liang, B.-W.; Bai, X.-B.; Li, N. Research Progress of Spectroscopy in the Detection of Soil Moisture Content. Spectrosc. Spectr. Anal. 2020, 40, 3705–3710. [Google Scholar]
- Chakhar, A.; Hernández-López, D.; Ballesteros, R.; Moreno, M.A. Improvement of the Soil Moisture Retrieval Procedure Based on the Integration of UAV Photogrammetry and Satellite Remote Sensing Information. Remote Sens. 2021, 13, 4968. [Google Scholar] [CrossRef]
- Cheng, L.; Liu, S.; Mo, X.; Hu, S.; Zhou, H.; Xie, C.; Nielsen, S.; Grosen, H.; Bauer-Gottwein, P. Assessing the Potential of 10-m Resolution TVDI Based on Downscaled LST to Monitor Soil Moisture in Tang River Basin, China. Remote Sens. 2023, 15, 744. [Google Scholar] [CrossRef]
- Przeździecki, K.; Zawadzki, J.J.; Urbaniak, M.; Ziemblińska, K.; Miatkowski, Z. Using temporal variability of land surface temperature and normalized vegetation index to estimate soil moisture condition on forest areas by means of remote sensing. Ecol. Indic. 2023, 148, 110088. [Google Scholar] [CrossRef]
- Ndlovu, H.S.; Odindi, J.; Sibanda, M.; Mutanga, O.; Clulow, A.; Chimonyo, V.G.; Mabhaudhi, T. A comparative estimation of maize leaf water content using machine learning techniques and unmanned aerial vehicle (UAV)-based proximal and remotely sensed data. Remote Sens. 2021, 13, 4091. [Google Scholar] [CrossRef]
- Ullah, S.; Skidmore, A.K.; Ramoelo, A.; Groen, T.A.; Naeem, M.; Ali, A. Retrieval of leaf water content spanning the visible to thermal infrared spectra. ISPRS J. Photogramm. Remote Sens. 2014, 93, 56–64. [Google Scholar] [CrossRef]
- Ullah, S.; Skidmore, A.K.; Naeem, M.; Schlerf, M. An accurate retrieval of leaf water content from mid to thermal infrared spectra using continuous wavelet analysis. Sci. Total Environ. 2012, 437, 145–152. [Google Scholar] [CrossRef]
- Yu, X.; Li, H.; Zhuo, W.; Feng, J. Efficient Prediction of Potato Leaf Water Content Based on Near-Infrared Spectroscopy Technology. Opt. Instrum. 2020, 42, 7–13. [Google Scholar]
- Bian, J.; Zhang, Z.; Chen, J.; Chen, H.; Cui, C.; Li, X.; Chen, S.; Fu, Q. Simplified evaluation of cotton water stress using high resolution unmanned aerial vehicle thermal imagery. Remote Sens. 2019, 11, 267. [Google Scholar] [CrossRef]
- Zhou, X.; Sun, J.; Mao, H.; Wu, X.; Zhang, X.; Yang, N. Visualization research of moisture content in leaf lettuce leaves based on WT-PLSR and hyperspectral imaging technology. J. Food Process Eng. 2018, 41, e12647. [Google Scholar] [CrossRef]
- Yan, X.; Zhang, Z.; Zhao, X.; Huang, M.; Wu, X.; Guo, T. Differentiated responses of plant water use regulation to drought in Robinia pseudoacacia plantations on the Chinese Loess Plateau. Agric. Water Manag. 2024, 291, 108659. [Google Scholar] [CrossRef]
- Aslan, F.; Prado-Tarango, D.E.; Mata-González, R.; Godwin, D. Soil water content and its interaction with plant water potential in a conservation wetland. In Proceedings of the Society for Range Management Annual Meeting, Denver, CO, USA, 16–20 February 2020. [Google Scholar]
- Amatya, S.; Karkee, M.; Alva, A.K. Identifying Water Stress in Potatoes Using Leaf Reflectance as an Indicator of Soil Water Content. GSTF J. Agric. Eng. 2014, 1, 52–61. [Google Scholar] [CrossRef] [PubMed]
- Wang, J.; Zhao, C.; Huang, W.; Guo, X.; Li, H. Effects of Soil Moisture on Leaf Water Content and Physiological Functions of Wheat. J. Triticeae Crops 2001, 21, 42–47. [Google Scholar]
- Zhang, Z.; Wang, H.; Han, W.; Bian, J.; Chen, S.; Cui, T. Study on Soil Moisture Retrieval Based on Unmanned Aerial Vehicle Multispectral Remote Sensing. Trans. Chin. Soc. Agric. Mach. 2018, 49, 173–181. [Google Scholar]
- Blank, D.; Eicker, A.; Jensen, L.; Güntner, A. A global analysis of water storage variations from remotely sensed soil moisture and daily satellite gravimetry. Hydrol. Earth Syst. Sci. 2023, 27, 2413–2435. [Google Scholar] [CrossRef]
- Tian, S.; Renzullo, L.J.; Van Dijk, A.I.; Tregoning, P.; Walker, J.P. Global joint assimilation of GRACE and SMOS for improved estimation of root-zone soil moisture and vegetation response. Hydrol. Earth Syst. Sci. 2019, 23, 1067–1081. [Google Scholar] [CrossRef]
- Yang, J.; Cai, H.; Wang, S.; Xie, H. Study on the Relationship between Shallow Soil Moisture and Deep Soil Moisture in Yangling District. Agric. Res. Arid. Areas 2010, 5, 53–57. [Google Scholar]
- Yao, F.; Cai, H.; Zhang, Z. Study on the Relationship between Surface Soil Moisture and Deep Soil Moisture Transformation in Yantai Apple Orchard. In Modern Water-Saving High-Efficiency Agriculture and Ecological Irrigation District Construction; Yunnan University Press: Yunnan, China, 2010; Volume II. [Google Scholar]
- Tan, C.; Zhang, Z.; Xu, C.; Ma, Y.; Yao, Z.; Wei, G.; Li, Y. Retrieval of Soil Moisture in Corn Root Zone at Various Growth Stages Based on Unmanned Aerial Vehicle Multispectral Remote Sensing. Trans. Chin. Soc. Agric. Eng. 2020, 36, 63–74. [Google Scholar]
- Jia, Y.; Jin, S.; Xiao, Z.; Yan, Q.; Pei, Y. Reflectance Measurement of Soil Moisture Remote Sensing Using Global Navigation Satellite Systems: Current Status and Opportunities. J. Wuhan Univ. Inf. Sci. Ed. 2023, 48, 1784–1799. [Google Scholar] [CrossRef]
- Biswas, B.C.; Dasgupta, S.K. Estimate of moisture at deeper depth from surface layer data. Mausam 1979, 30, 40–45. [Google Scholar] [CrossRef]
- Ma, C. Study on Soil Moisture Conditions of Winter Wheat in the Renmin Shengli Canal Irrigation Area Based on Remote Sensing and Model Coupling. Chin. Acad. Agric. Sci. 2018, 12, 1–104. [Google Scholar]
- Liu, J.; Zhang, Z.; Xie, H.; Cai, H. Study on Estimation of Soil Water Storage in the Root Zone of Pear Orchards in Jiaodong. Soil Bull. 2007, 38, 640–644. [Google Scholar]
- Cheng, T.; Rivard, B.; Sánchez-Azofeifa, A.G.; Féret, J.B.; Jacquemoud, S.; Ustin, S.L. Predicting leaf gravimetric water content from foliar reflectance across a range of plant species using continuous wavelet analysis. J. Plant Physiol. 2012, 169, 1134–1142. [Google Scholar] [CrossRef]
- Yang, S.; Chen, J.; Zhou, Y.; Cui, W.; Yang, N. Research on Methods for Estimating Soil Moisture Content in the Root Zone of Maize Using Unmanned Aerial Vehicle Thermal Infrared Remote Sensing. Water-Sav. Irrig. 2021, 3, 12–18. [Google Scholar]
- Ke, Y.; Im, J.; Lee, J.; Gong, H.; Ryu, Y. Characteristics of Landsat 8 OLI-derived NDVI by comparison with multiple satellite sensors and in-situ observations. Remote Sens. Environ. 2015, 164, 298–313. [Google Scholar] [CrossRef]
- Zhao, W.; Duan, W.; Wang, Y.; Zhou, C.; Ma, H. Study on the Inversion Model of Multispectral Vegetation Water Content Based on Sensitive Variable Selection. Trans. Chin. Soc. Agric. Mach. 2023, 54, 343–351+385. [Google Scholar]
- Chen, D.; Zhang, F.; Tan, M.L.; Chan, N.W.; Shi, J.; Liu, C.; Wang, W. Improved Na+ estimation from hyperspectral data of saline vegetation by machine learning. Comput. Electron. Agric. 2022, 196, 106862. [Google Scholar] [CrossRef]
- Si, S.; Li, D. Study on the Inversion Model of Deep Soil Moisture Content in the Lower Yellow River Diversion Irrigation Area. People’s Yellow River 2023, 45, 124–127+142. [Google Scholar]
- Nijigati, K.; Zhang, Z.; Wumuti, A. Estimation of Leaf Water Content in Spring Wheat Based on Three-Band Spectral Indices. J. Triticeae Crops 2023, 43, 1–10. [Google Scholar]
- Feng, X.; Zhou, G. Relationship between Leaf Water Content, Photosynthesis, and Soil Moisture in Summer Maize. Acta Ecol. Sin. 2018, 38, 177–185. [Google Scholar]
- Rui, T.; Xu, Y.; Cheng, Q.; Yang, B.; Feng, Z.; Zhou, T.; Zhang, S. Estimation of Leaf Water Content in the Canopy of Winter Wheat Based on Unmanned Aerial Vehicle Multispectral Remote Sensing. J. Triticeae Crops 2022, 42, 1921–1930. [Google Scholar]
- Reyi, A.; Wumuti, A.; Abuduni, A.; Negati, K. Hyperspectral Estimation of Leaf Water Content in Spring Wheat Based on Machine Learning. J. Triticeae Crops 2022, 42, 640–648. [Google Scholar]
- Zhang, H.; Zhang, F.; Zhang, X.; Li, Z.; Ghulam, A.; Song, J. Estimation of Leaf Water Content in Vegetation Canopy Using Spectral Indices. Spectrosc. Spectr. Anal. 2018, 38, 1540–1546. [Google Scholar] [CrossRef]
- Wang, H. Influence of Soil Moisture under Different Irrigation Conditions in Hexi Oasis on Leaf Water Content of Wheat Canopy. J. Anhui Agric. Sci. 2014, 42, 6957–6959. [Google Scholar]
- Humphrey, V.; Berg, A.; Ciais, P.; Gentine, P.; Jung, M.; Reichstein, M.; Seneviratne, S.I.; Frankenberg, C. Soil moisture–atmosphere feedback dominates land carbon uptake variability. Nature 2021, 592, 65–69. [Google Scholar] [CrossRef] [PubMed]
- Yang, T.; Chen, X.; Xu, H.; Qin, Z.; Liu, S.; Liu, J. Spatial Differentiation Characteristics of Soil Moisture Movement in Agricultural Land under the Influence of Pepper Roots. Trans. Chin. Soc. Agric. Eng. 2023, 39, 141–150. [Google Scholar]
- Brutsaert, W. The daily mean zero-flux plane during soil-controlled evaporation: AG reen’s function approach. Water Resour. Res. 2014, 50, 9405–9413. [Google Scholar] [CrossRef]
- Li, C.; Guo, J.; Wang, D.; Chen, X.; Guan, H.; Li, Y.; Zhang, D.; Liu, X.; He, G.; Wang, T.; et al. Genomic insight into changes of root architecture under drought stress in maize. Plant Cell Environ. 2023, 46, 1860–1872. [Google Scholar] [CrossRef] [PubMed]
- Wang, G.; Chi, B.; Li, N.; Liang, G. Dynamic Soil Moisture and Prediction Simulation in Dryland Farmland of Southern Shanxi. Shanxi Agric. Sci. 2014, 42, 1106–1110. [Google Scholar]
Disclaimer/Publisher’s Note: The statements, opinions and data contained in all publications are solely those of the individual author(s) and contributor(s) and not of MDPI and/or the editor(s). MDPI and/or the editor(s) disclaim responsibility for any injury to people or property resulting from any ideas, methods, instructions or products referred to in the content. |
© 2024 by the authors. Licensee MDPI, Basel, Switzerland. This article is an open access article distributed under the terms and conditions of the Creative Commons Attribution (CC BY) license (https://creativecommons.org/licenses/by/4.0/).