Article

Root Architectural Adaptations to Phosphorus Deficiency: Unraveling Genotypic Variability in Wheat Seedlings

by
Vijay Rajamanickam
1,
Kunnummal Kurungara Vinod
2,
Krishnapriya Vengavasi
3,
Tarun Kumar
1,
Viswanathan Chinnusamy
1 and
Renu Pandey
1,*
1
Division of Plant Physiology, ICAR-Indian Agricultural Research Institute, New Delhi 110012, India
2
Division of Genetics, ICAR-Indian Agricultural Research Institute, New Delhi 110012, India
3
Plant Physiology Section, Division of Crop Production, ICAR-Sugarcane Breeding Institute, Coimbatore 641007, India
*
Author to whom correspondence should be addressed.
Agriculture 2024, 14(3), 447; https://doi.org/10.3390/agriculture14030447
Submission received: 4 January 2024 / Revised: 8 March 2024 / Accepted: 8 March 2024 / Published: 10 March 2024
(This article belongs to the Special Issue Crop Responses to Abiotic Stress and Genetic Research)

Abstract

:
Understanding the changes in the root system architecture of bread wheat under phosphorus (P)-limited conditions is critical for identifying specific traits contributing to improved P uptake. Phenotypic variability in root, biomass, and P index-related traits among 204 diverse wheat genotypes at the seedling stage was examined under low and optimum P treatments. Strong genotypic and phenotypic associations between P utilization efficiency (PUtE) and total root volume, dry weight of root and shoot, total P uptake, and total plant biomass were observed under optimum P. Under low P, strong positive correlations between PUtE and total root length, total root volume, total surface area, and total biomass were observed, while it was negatively correlated with average diameter. These traits exhibited medium to high heritability. Under low P, average root diameter, primary root length, root mass ratio, total root tips, and surface area showed high Shannon–Weaver diversity index (H’) values (>0.79). The agglomerative hierarchical clustering analysis grouped the genotypes into four distinct clusters. The best performing genotypes in Clusters I and II indicated their strong relationship with P use efficiency due to higher percent increases in total root length, total surface area, total root volume, total root tips, total biomass, P efficiency ratio, specific root length, and PUtE under low P as compared to optimum P conditions. The present study identified specific root system architectural traits and P use-efficient genotypes (SHANGHAI, Pavon F76, BWL 5233, SONALIKA, KHARCHIA LOCAL, WH 102, BWL 4425, HD 2888.2, CBW 12, MN75136/PGO, KRL 19, and WH 1022) associated with efficient P uptake and utilization. These identified genotypes and traits may be useful in wheat breeding programs to develop P-efficient varieties with better adaptations for sustainable agriculture.

1. Introduction

Bread wheat (Triticum aestivum L.) is the third most extensively cultivated cereal crop and a staple food for about one-third of the world’s population [1,2,3]. Global cultivation of wheat is around 220.0 million hectares (Mha), with an annual production of over 700.0 million tons (Mt), leading to an annual export worth around US$ 50 billion in 2019 [4]. For optimum grain yields, wheat removes a substantial amount of phosphatic fertilizer (c.a. 2.5 to 8.0 kg P tonne−1 grain) as compared to other food crops [5]. However, phosphorus (P), being a key macronutrient, is essential for crop growth and productivity. It is a structural component of nucleic acids and membranes, with crucial roles in energy transfer reactions, signal transduction, and enzyme activation [6,7]. In wheat, P nutrition is critical to seed germination, seedling establishment, tillering, uniform heading, spike formation, and uniform maturity [8,9]. The P requirement in wheat varies between 0.2 and 0.5% on a dry weight basis. Its deficiency during the early growth stage can cause significant reductions in tiller growth, spike formation, and yield [8,10]. Considering the role of wheat as a major dietary global food crop and its P requirement, there is a need to develop wheat varieties with enhanced P uptake efficiency (PUpE) and P utilization efficiency (PUtE) that require less frequent repletion of P fertilizer for global food security [11,12].
Phosphatic fertilizers are solely derived from natural ‘non-renewable’ sources, that is, phosphate rock. Global rock phosphate reserves are limited and are estimated to last for next 300 to 400 years [13]. The poor P use efficiency (15 to 20%) of plants further adds to the complexity of P nutrient availability. Besides the natural efficiency of individual plants, excessive P fertilizer application contributes to low P use efficiency. The excess P is fixed with oxides and hydroxides of iron (Fe) and aluminum (Al) in acidic soil and with calcium (Ca) in alkaline soil [14] and is lost through run-off, ending up in water bodies, causing adverse effects on water quality [6,14,15]. The problems of resource limitation, unscrupulous use, and the diminishing available P status of global agricultural land raise serious concerns. A total of 29% of the worldwide cropping area is P deficient, while 71% has excess soil P content [11,16]. To safeguard future agriculture and to sustain present day agricultural productivity, P resources must be used judiciously. Nonetheless, increasing the P use efficiency of plants is the most viable solution to achieve this goal.
Under P deficiency, one of the morphological adaptations plants exhibit is alteration of the root system architecture (RSA), which enhances soil exploration through improved root–soil contact, thus improving PUpE. However, until recently, root traits have mostly gone unnoticed by plant breeders and are not targeted as selection criteria. Understanding RSA, therefore, holds potential for the detection, manipulation, and exploitation of root traits to increase crop yield and ensure soil health [17,18]. Targeted breeding for root traits tailored to diverse soils needs a detailed study of the implications of diverse root system types for these environments and the genetics underlying RSA [18,19]. Once heritable characters associated with P use efficiency are identified, they can be used to create P use-efficient genotypes with high grain yield [20]. The root system modifications include increases in root length, root angle, root branching, lateral root number and length, and root hair density and length to increase the root surface area in plant species when they sense P scarcity [21,22,23]. A higher root-to-shoot ratio is the most evident alteration in the majority of plants in response to low P stress [24,25]. Therefore, improved root adaptive responses could be the way to enhance the P absorption and uptake capacity of plants [26]. Root hair length and density are increased significantly under low P stress in wheat [23] and soybean (Glycine max L. Merr.) [27]. Root traits including total surface area, total root length, and total root volume are moderately heritable in maize under low P stress [28]. Harnessing these crucial RSA traits is one of the strategies to improve plant P foraging ability and thus P use efficiency.
Breeding for P use efficiency in bread wheat can be achieved through improving PUtE or assimilation efficiency and PUpE or P acquisition efficiency. PUtE governs the internal allocation or mobilization of P and is typically characterized by the amount of P accumulated per unit of biomass [29], whereas PUpE defines the inherent capacity of roots to obtain P from the soil [30]. Wheat accessions with shallow root systems exhibit better PUpE. Hence, modeling root traits is undoubtedly a useful strategy for enhancing PUpE in bread wheat [31]. Despite its importance, besides reports from our laboratory with a fewer number of genotypes [32,33], not much work has been undertaken with respect to root system trait variability and responses to P starvation in a large number of bread wheat accessions. In the present study, we aimed to characterize the phenotypic variability in the root system and P-related traits in a diverse set of 204 bread wheat genotypes grown with low and optimum P levels using a hydroponic system and to determine the interrelation and selection criteria for efficient P acquisition. We used a hydroponic system for phenotyping mainly because measuring root traits in soil during the stages of seedling, tillering, flowering, and grain development is highly challenging [34,35]. Since hydroponics offers practical advantages over soil in terms of regulating fertilizer or nutrient availability and measuring uptake rates, we employed the hydroponic method.

2. Materials and Methods

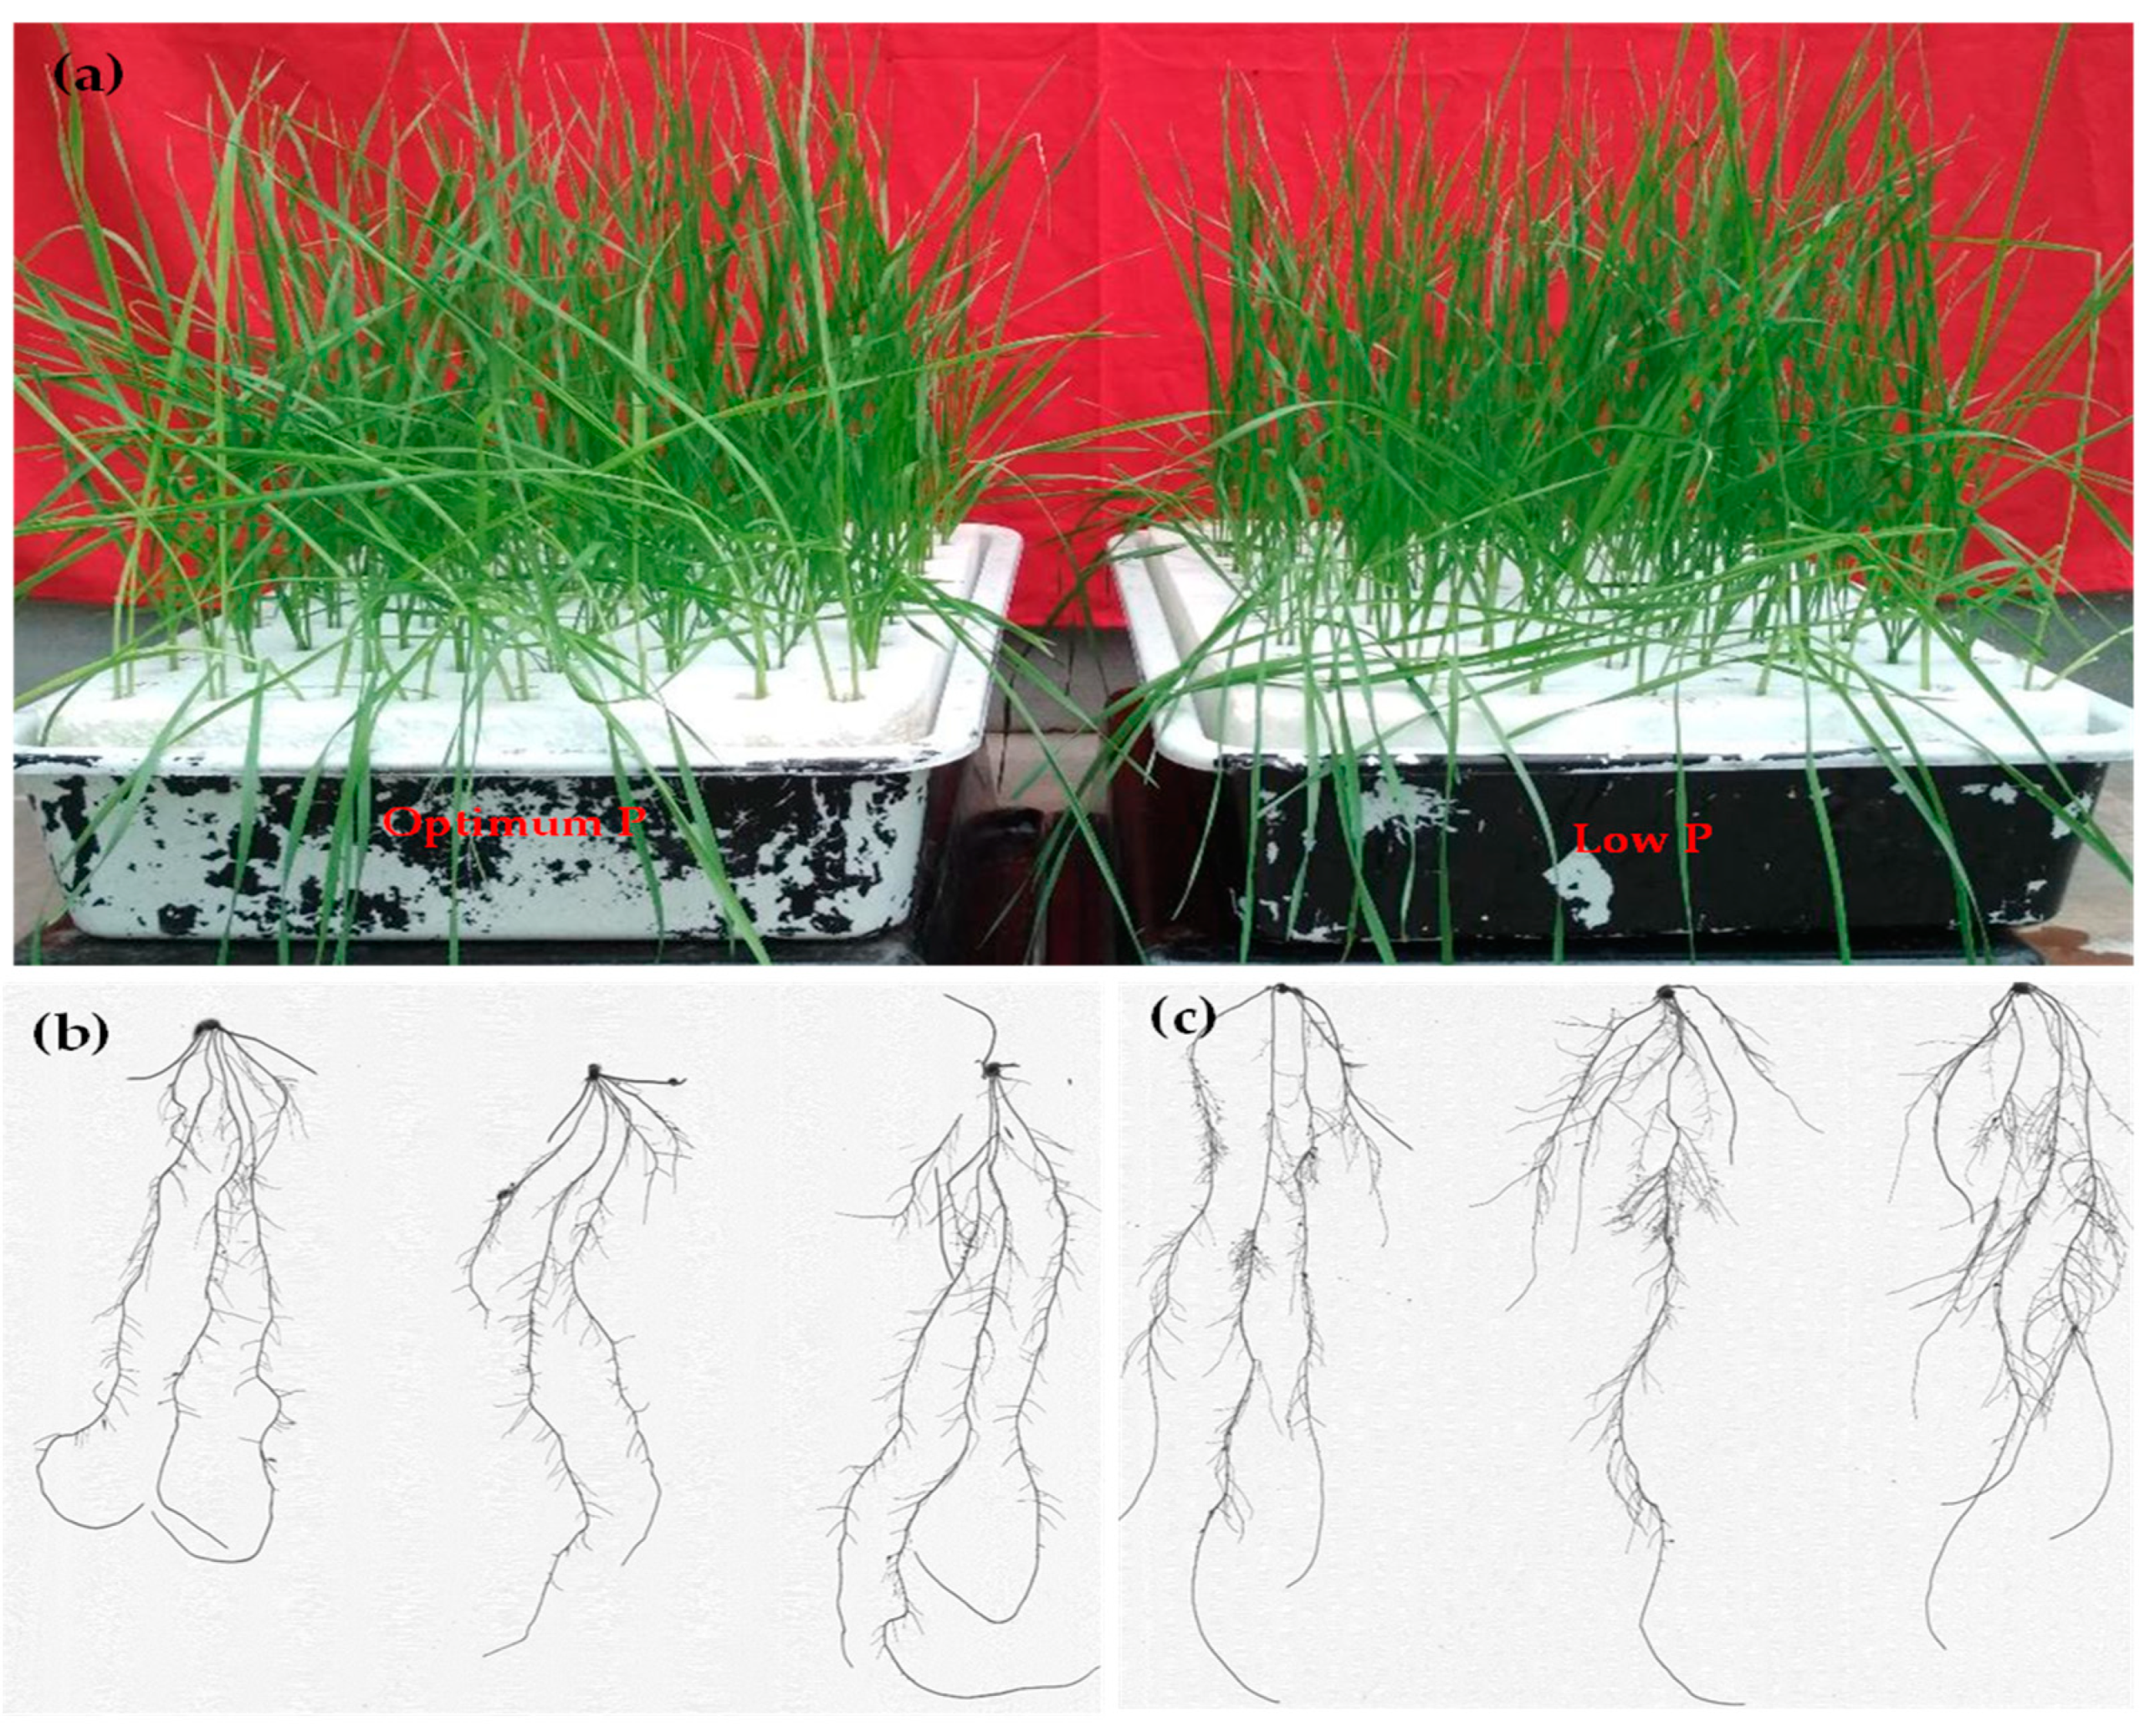
2.1. Plant Material and Growth Conditions

The seeds of 204 bread wheat (Triticum aestivum L.) genotypes were procured from the Indian Institute of Wheat and Barley Research, Karnal (India), Punjab Agricultural University, Ludhiana (India), CIMMYT, El Batán (Mexico), Australian Winter Cereals Collection, Tamworth, (Australia), and the ICAR-Indian Agricultural Research Institute, New Delhi (ICAR-IARI) (India) (Table S2; Figure S1). This panel comprised 127, 21, 13, and 2 genotypes, sharing origins from India, Australia, Mexico, and China, respectively. Six genotypes were from the USA, Iran, Egypt, Brazil, and Germany, and information was not available for the remaining 35 genotypes.
The seeds were surface-sterilized with 0.1% (w/v) HgCl2 and germinated in moistened paper towel. After 5 days, the uniform and healthy seedlings were transplanted to 5 cm thick polystyrene foam sheets mounted on plastic trays holding 12 l of nutrient solution. Two P levels were maintained using H3PO4 as optimum P (500 μM) and low P (5 μM) (Figure 1a) [33]. The nutrient solution contained salts of (NH4)2SO4 (0.5 mM), KNO3 (5.0 Mm), Ca (NO3)2 (5.0 mM), and MgSO4 (2.0 mM) and micronutrients Fe-EDTA (0.02 mM), H3BO3 (1.0 μM), ZnSO4.7H2O (7.0 μM), MnCl2.4H2O (0.5 μM), (NH4)6 Mo7O24.4H2O (0.075 μM), and CuSO4.5H2O (0.2 μM) [33].
The whole set up was placed inside growth chambers at the National Phytotron Facility, ICAR-IARI, Pusa Campus, New Delhi, with the following environmental parameters: 22/18 °C day/night temperature, 11/13 h day/night photoperiod, 400 μmol m−2 s−1 photon flux density, and 85% relative humidity. The nutrient solution was maintained at pH 5.8 using either 1.0 N HCl or 1.0 N KOH, which was monitored regularly using a portable hand-held pH meter (EUTECH EcoTestr pH1 Pocket pH Tester- ECOPHTEST1). The solution was aerated continuously with an aquarium air pump and renewed every third day. All root-related traits were recorded in 21-day-old seedlings.

2.2. Root Trait Measurements

Twenty-one-day old roots of wheat seedlings were sampled to record observations on root traits. Roots were carefully separated in an acrylic tray holding water for digitization of root images. The root system was scanned using a root scanner (EPSON professional scanner) and greyscale images obtained in TIFF format were analyzed with WinRhizo software (Pro version 2016a; Regent Instrument Inc., Quebec, QC, Canada). Root traits including total root length (TRL), total root surface area (TSA), root volume (RVL), average diameter (AVD), and total root tips (TIP) were recorded. Primary root length (PRL) was measured manually using a scale.
Shoots and roots were separated carefully and dried at 60 °C in a hot air oven until a constant dry mass was obtained to record root dry weight (RDW) and shoot dry weight (SDW). Total biomass (TBM) and root mass ratio (RMR) were calculated from SDW and RDW. The specific root length (SRL) was derived from TRL and RDW (Table S1).

2.3. Tissue P Status and P-Related Indices

Digestion of dried tissue was performed with di-acid mixture (HNO3:HClO3, 9:4). The P concentration (P CON) was determined by using inductively coupled plasma optical emission spectrometry (ICP-OES) (Agilent VDV5110, Singapore) and expressed in ppm. Other P index traits [TPU (total P uptake), PUtE (P utilization efficiency), and PUpE (P uptake efficiency)] under both P treatment conditions were derived from P CON, root, and biomass traits (Table S1).

2.4. Statistical Analysis

The hydroponics experiment was conducted in a completely randomized design with two factors, P level and genotype. Four replications were maintained for each genotype × P level combination for root and biomass trait measurements and three replications for other P index traits. Descriptive statistics and heritability (h2) were calculated for all traits. Two-way analysis of variance was calculated using the package ‘palmerpenguins’ version 0.1.0 in R-Studio version 3.5.1 (R Foundation for Statistical Computing, Vienna). Phenotypic and genotypic correlations were calculated using META-R version 3.5.1 [36]. Principal component analysis (PCA) was carried out using the package ‘factoextra’ version 1.0.7 in R-Studio version 3.5.1. Broad-sense heritability (h2) was calculated using the equation:
Broad - sense   heritability   h 2   = σ g 2 ( σ g 2 + σ e 2 ) / r Broad - sense   heritability   ( combined )   h 2   = σ g 2 ( σ g 2 + σ g e 2 ) / e ) + ( σ e 2 ) / r e ) )
where ‘σ2g, ‘σ2e, and ‘σ2ge are the genetic, residual, and genotype × environment interaction variances, respectively; and ‘e’ and ‘r’ represent the number of environments and the number of experimental replications, respectively [37,38]. From ANOVA, genetic and residual variances were calculated. A polymorphic diversity index, the Shannon–Weaver diversity index (H’), was calculated for each trait [39,40,41] using the formula:
H = i = 1 s     p i ( l n p i )
where ‘pi’ is the proportion of individuals belonging to the ‘ith’ class, and ‘s’ is the total number of genotypes. A dendrogram of agglomerative hierarchical clustering (AHC) was derived using ward.D, with the squared Euclidean distance as the interval of measurement for relative values under low P and optimum P conditions of 15 traits using ‘factoextra’ version 1.0.7. Box and whisker plot were plotted using GraphPad Prism version 10.2.0 (GraphPad Software, La Jolla, CA, USA).

2.5. Identification of P Use-Efficient and -Inefficient Genotypes

The stress tolerance of wheat genotypes under low P level was estimated by the relative value calculated as the ratio of trait values under low P to optimum P conditions.
The ranking value of the PCA was utilized to assess the stress tolerance of genotypes under various P conditions. For each bread wheat genotype, the ranking value was calculated by the formula [42]:
PCA-ranking value = (Contribution of PC-1 (%) × PC-1) + (Contribution of PC-2 (%) × PC-2) + (Contribution of PC-3 (%) × PC-3) + (Contribution of PC-4 (%) × PC-4).

3. Results

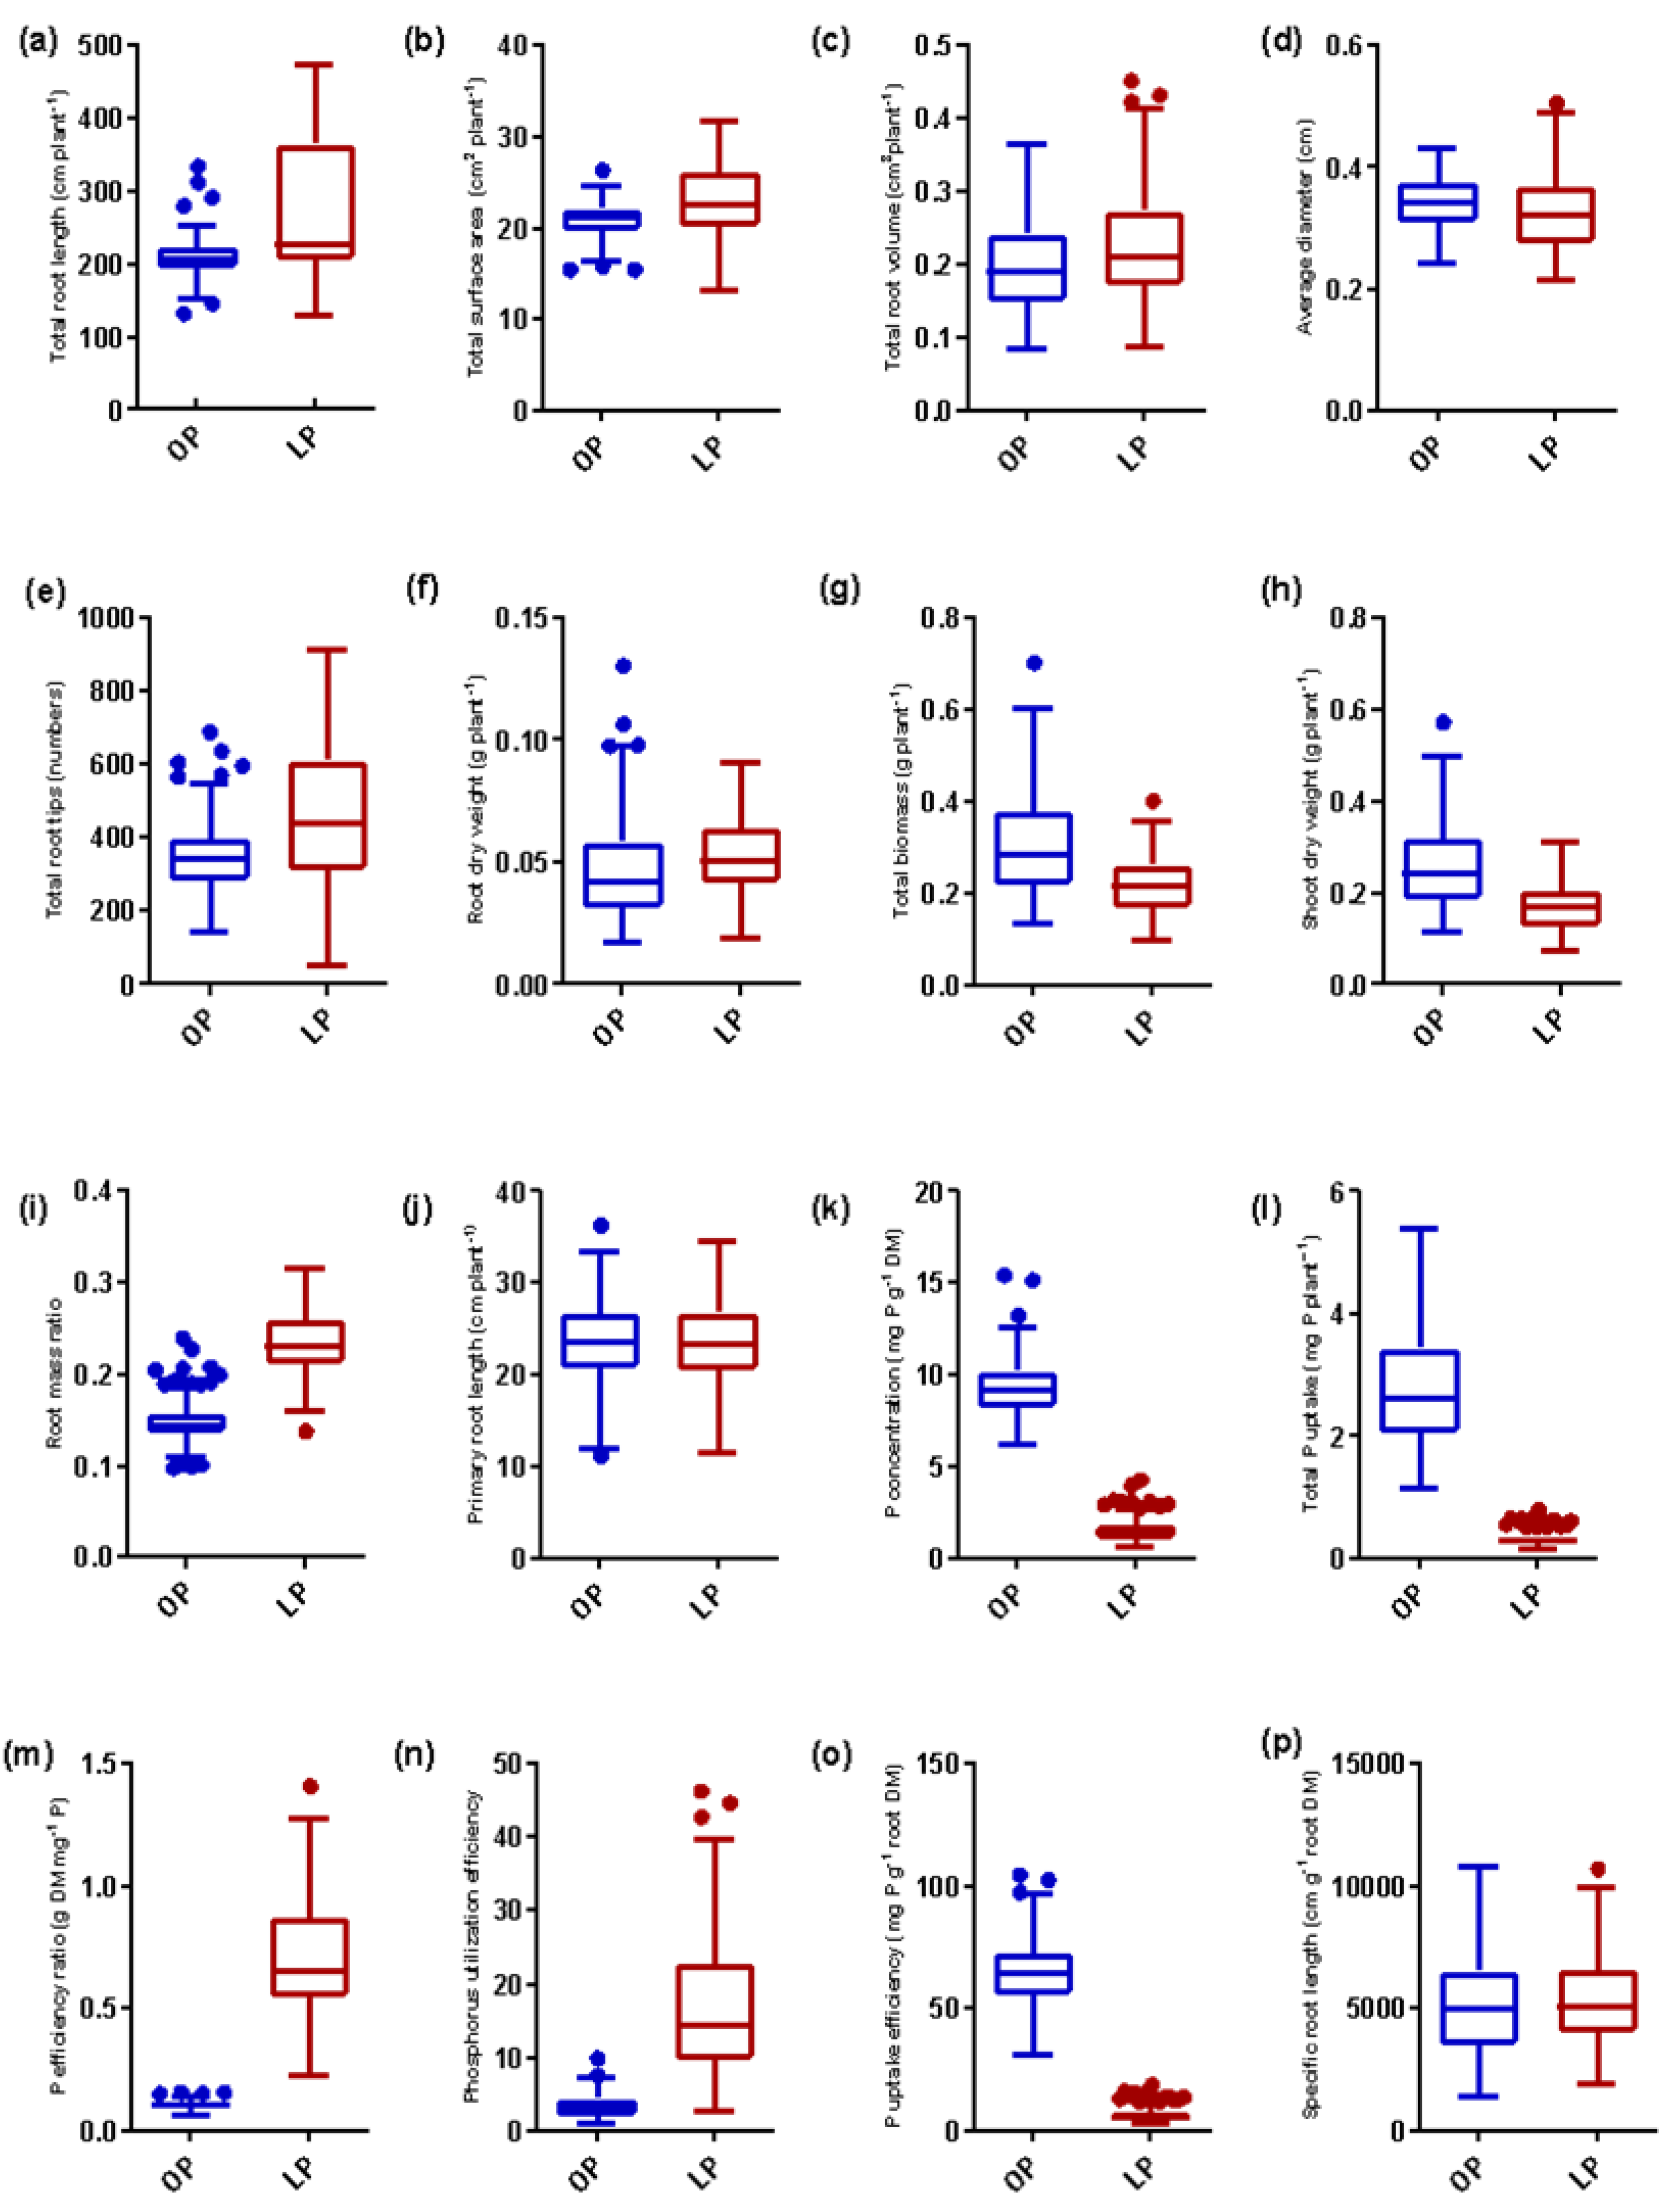
3.1. Variability in Root System, Biomass, P Concentration, and P Indices

All 16 traits (Table S1) measured in 204 genotypes revealed significant variation due to P levels (Table 1). The phenotypic variation of the 16 traits observed under two P levels is visualized using box and whisker plots (Figure 2a–p). Marked increases in total root length (TRL), total root surface area (TSA), total root volume (RVL), total root tips (TIP), root dry weight (RDW), root mass ratio (RMR), P efficiency ratio (PER), and P utilization efficiency (PUtE) were observed at low P as compared to control or optimum P. However, total biomass (TBM), shoot dry weight (SDW), average diameter (AVD), primary root length (PRL), tissue P concentration (P CON), total P uptake (TPU), specific root length (SRL), and P uptake efficiency (PUpE) were reduced under low P treatment (Table 1). Under low P, among all traits, TRL showed a maximum 16% increase relative to the optimum P condition.
Among the genotypes, two Indian genotypes (WH1022, WH102) and one Mexican genotype (PAVON F76) exhibited >58% increases in TRL at low P in comparison to optimum P (Table S2). Similarly, > 36% increases in TSA under low P were observed in two Indian-origin genotypes (WH1022, and PBW590) and one American-origin genotype (MN75136/PGO) (Table 1 and Table S2).
AVD decreased by an average of 7.5% under low P as compared to optimum P conditions. The variation in number of root tips, where a root link ends without any other connection, was significantly higher under low P (Figure 1b,c and Figure 2e). The number of TIP increased by >60% in genotypes of Indian (WH1022, HS 277, and NP 824) and Mexican (Kater-1) origins under low P as compared to optimum P conditions. Among genotypes, the biomass-related traits (RDW, SDW, and TBM) showed variations in the response to P treatment. Indian-origin genotypes (WH 1022, KHAPLI, K 9465, and BWL 5202) showed >54% increases in RDW, whereas four genotypes (Indian—RAJ 4248 and HD 2888.2; Mexican—DHARWAD DRY and Bacanora F-88) exhibited >60% decreases in RDW under low P in comparison to optimum P conditions. Further, a 39% reduction in TBM was noted at low P relative to optimum P treatment. Among genotypes, three of Indian origin (K 9465, WH 1022, and BWL 5202) and one of Australian origin (Kulin) showed >20% increases in TBM under low P treatment (Table 1 and Table S2). Overall, RMR increased by 36% at low P relative to optimum P treatment.
The reduction in P CON in plant tissue and TPU per plant at low P was obvious as compared to optimum P. The reduction in TPU was >8.2-fold at low P. The average PUtE under low P was 16.7% (Table 1). Increases in PUtE by more than 87.5% were observed in four Indian (KRL-1-4, PBW 746, HD 3086, and IC 335700) and one Mexican (Vee/Myna) genotype. However, >55.5% increases in PUtE were observed in two Indian-origin genotypes (DL 1266-5 and HD 2888.1) and three genotypes (EC 252874, BWL 0814, and BWL 5487) for which the origin details were not available. Likewise, PUpE ranged from 31.7 to 104.98 mg P g root dry matter−1 under optimum P, with a mean of 64.9 mg P g root dry matter−1.
Table 1 shows the descriptive statistics, with the coefficient of variation ranging from 11.5% for TSA to 39.2% for PUtE under optimum P, whereas it ranged from 15.4% for RMR to 41.2% for PUtE under low P. The traits with lower CV values showed less variability and high stability in response to P treatment as compared to those with higher CV values. A CV value up to 30 is acceptable but more than 30 is not acceptable. High (>0.80) broad-sense heritability (h2) was observed for AVD, RVL, RDW, TBM, PUtE, and SDW when the data under low and optimum P were pooled (Table 1). However, it was observed that under low P, h2 was more than 0.90 for TRL, AVD, P CON, PER, and PUpE, while under optimum P, it was less than 0.90 for all traits (Table S3).

3.2. Phenotypic and Genotypic Correlations

Phenotypic and genotypic correlations carried out separately between all 16 traits under two P levels revealed significant associations at P < 0.05, P < 0.01, and P < 0.001. Under optimum P levels, significant and positive genetic correlations were obtained, for example, between TRL and TSA (r = 0.72), TRL and RVL (r = 0.36), TIP and TSA (r = 0.43), RDW and RVL (0.85), RMR and RVL (r = 45), PRL and TSA (r = 0.73), PRL and TIP (r = 0.47), TPU and RVL (r = 0.76), TPU and RDW (r = 0.86), and SRL and PUpE (r = 0.56) (Table S4a). Similarly, under low P, highly significant and positive genetic correlations were obtained between various traits, as presented in Table S4b. Under both conditions, PUtE showed significant genetic correlations with TRL, RVL, RDW, TBM, SDW, and PER. Furthermore, under the low P condition, AVD showed significant and negative genetic correlations with TSA, PRL, TIP, P CON, TPU, and PUpE (Table S4b). TIP under the low P condition showed strong positive correlations with P CON and TPU (Table S4b).
Under optimum P, significant phenotypic correlations were obtained between RVL and RDW (r = 0.77), TBM and RVL (r = 0.76), TVL and SDW (r = 0.74), RVL and RMR (0.38) RVL and TPU (r = 0.70), TSA and TIP (r = 0.40), RDW and TBM (r = 0.94), SDW and TBM (r = 0.90), TBM and TPU (r = 0.89), TBM and PUtE (r = 0.93), PER and PUtE (r = 0.61), and SRL and PUpE (r = 0.56) (Table S4c). Whereas under low P, significant phenotypic correlations were obtained between TRL and RDW (r = 0.47), TRL and TBM (r = 0.49), TRL and PUtE (r = 0.50), TRL and PER (r = 0.47), TRL and SRL (0.64), TIP and TPU (r = 0.36), RDW and PER (r = 0.51), RDW and PUtE (r = 0.73), TBM and PUtE (0.84), and RVL and PER (r = 0.59) (Figure S4d).
Phenotypic correlations between TRL and TSA and between TRL and RVL were similar under both treatment conditions. Highly significant and negative phenotypic correlations were found between traits like AVD and TIP, AVD and PRL, AVD and P CON, AVD and TPU, and AVD and PUpE, and a similar trend was observed in the genotypic correlations (Table S4). The results showed that PRL exhibited a similar relationship with TRL and TSA under both P conditions.

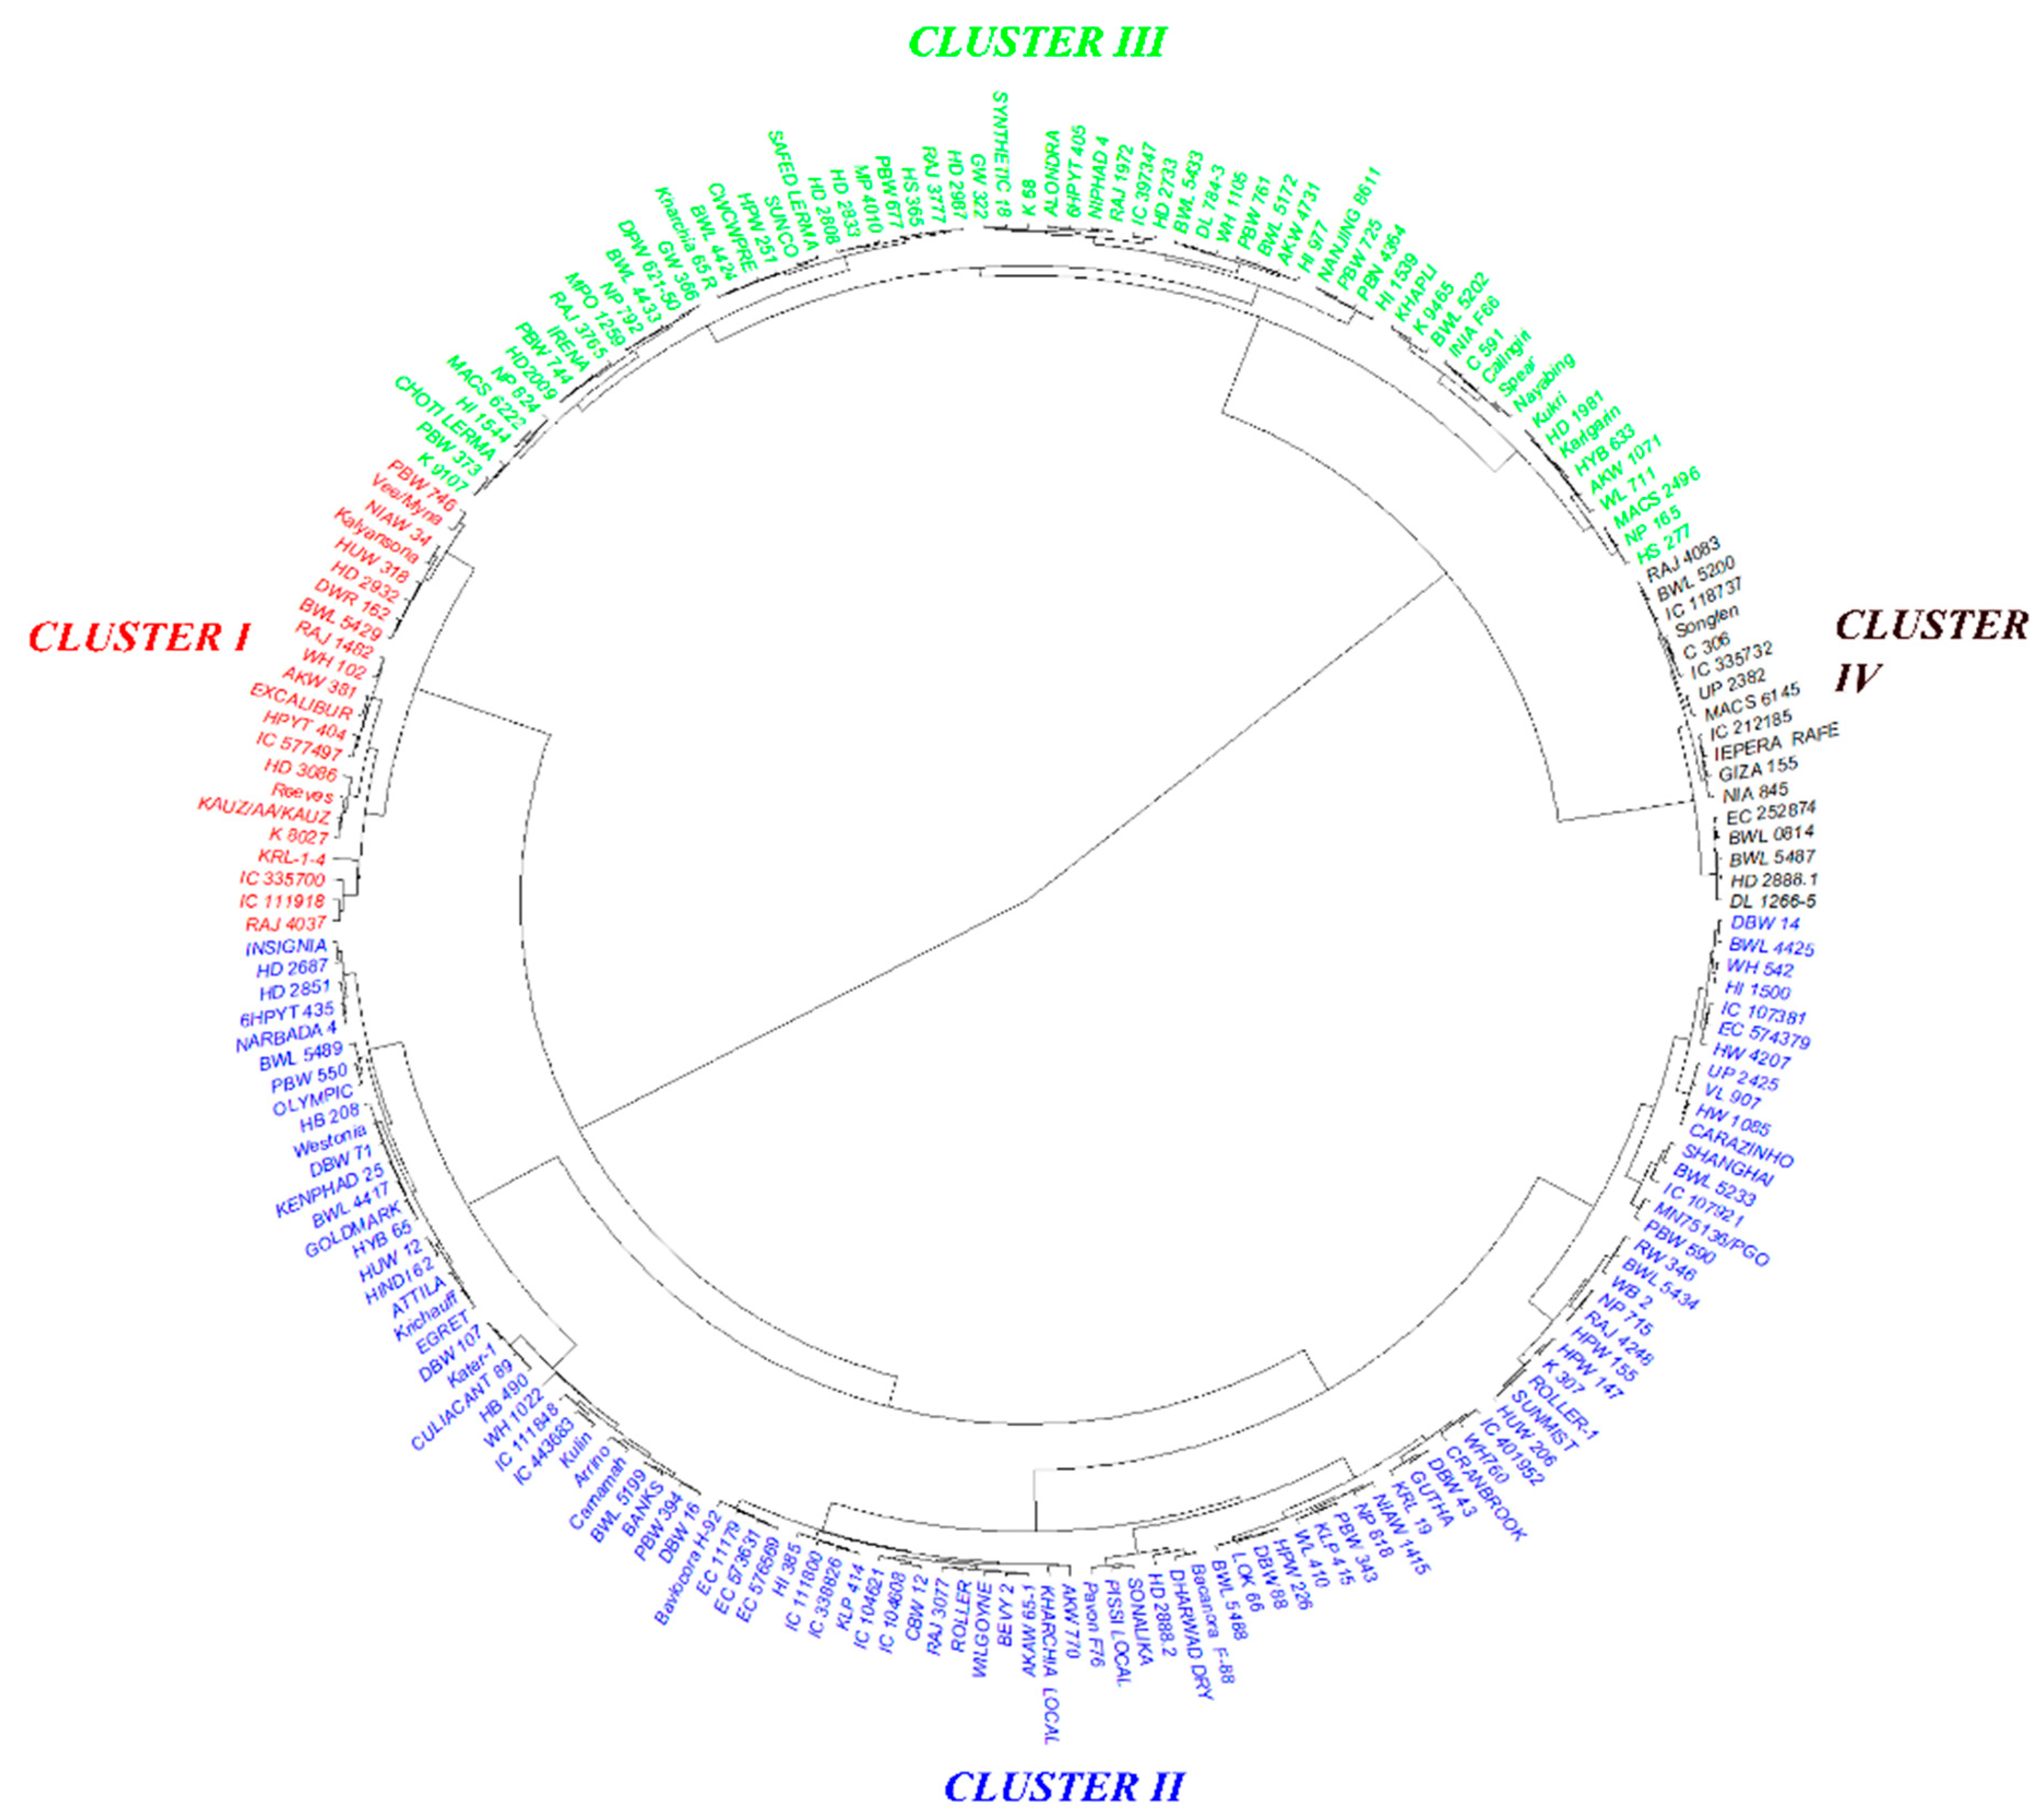
3.3. Trait-Based Diversity Pattern among the Genotypes

The Shannon–Weaver diversity index (H′) was calculated to study the diversity among the 16 traits for all 204 genotypes (Table 2). The H′ values varied for all traits, with an average of 0.70 for all 204 genotypes. Under optimum P, traits such as TSA (0.81), RVL (0.78), PER (0.77), P CON (0.76), PUtE (0.76), TRL (0.73), RDW (0.73), and TBM (0.73) showed higher H′ values, whereas SRL (0.59), RMR (0.62), TIP (0.64), and PUpE (0.68) showed lower H′ values. Similarly, under the low P condition, PRL (0.84), TSA (0.80), RMR (0.80), AVD (0.79), TIP (0.79), TBM (0.78), and SDW (0.78) exhibited higher H’ values, whereas PUpE (0.38), P CON (0.55), TPU (0.60), and SRL (0.6) showed low H’ values. Most of the root morphological traits (TRL, PRL, TSA, AVD, and TIP) and biomass traits (TBM, SDW, and RDW) under low P displayed significant variations because they possessed higher H’ values as compared to optimum P (Table 2).

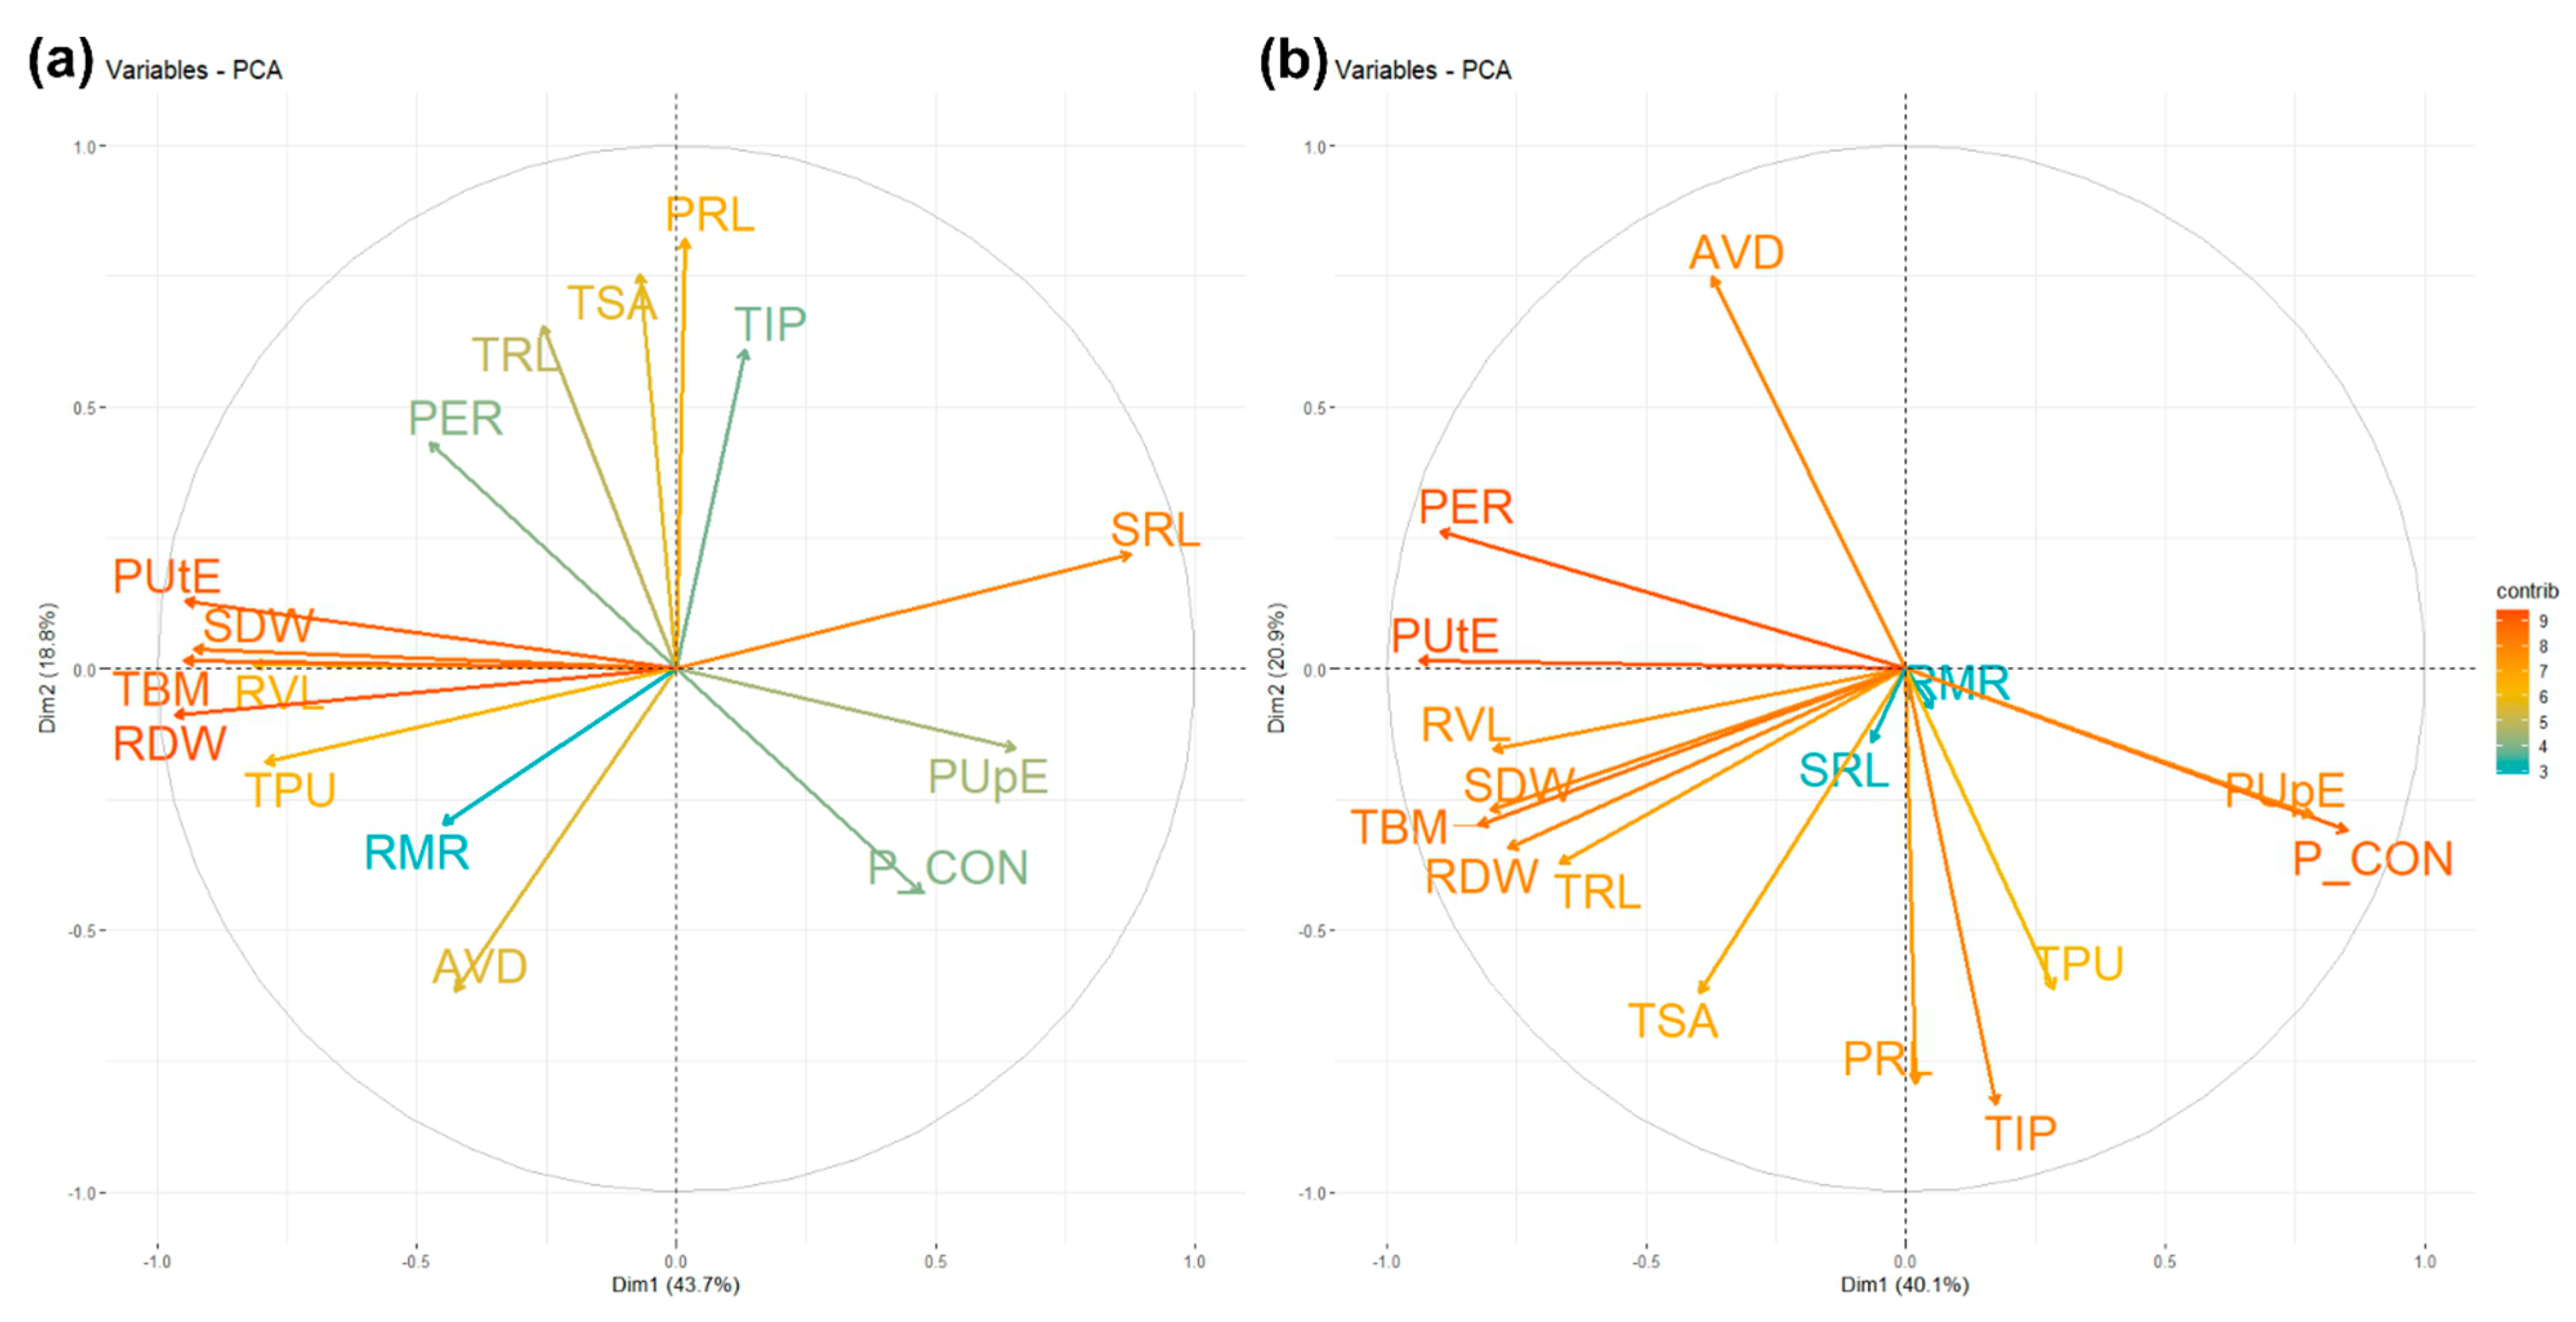
3.4. Principal Component Analysis for Root, Biomass, P Concentration, and Phosphorus Indices

The PCA for traits under optimum P treatment showed that the first two principal components (PCs) explained 43.7% and 18.8% of the total variations, respectively, whereas under low P, the first two PCs explained 40.1% and 20.9%, respectively (Figure 3a,b; Table 3).
The PC1 for optimum P revealed that AVD, RDW, TBM, SDW, PUtE, and SRL were the most contributing traits, as evident from their high loading matrix values of 0.31, 0.37, 0.36, 0.35, 0.36, and −0.33, respectively, while under the low P condition, traits like AVD, TBM, SDW, P CON, PER, PUtE, and PUpE contributed significantly, with loading matrix values of 0.32, 0.32, 0.32, −0.34, 0.35, 0.37, and −0.31, respectively (Table 3).
The PC2 for optimum P revealed traits like TRL, TSA, RVL, TIP, and PRL as highly contributing traits, with loading values of 0.38, 0.44, −0.36, 0.35, and 0.47, respectively, whereas under low P, variables like TSA, RVL, TIP, PRL, and TPU were the most contributing variables, with loading scores of 0.34, −0.41, 0.46, 0.43, and 0.33, respectively (Table 3).
Under both P conditions, AVD had highly negative correlations with most traits. But AVD was the most contributing trait under the low P condition, with a loading matrix value of 0.32 (Table 3). Under optimum P, TRL showed strong and significant correlations with TSA, TIP, PRL, and PER. Moreover, PUtE exhibited high correlations with RDW, TPU, TBM, SDW, and RVL under optimum P, whereas under low P, TRL exhibited significant and strong correlations with TSA, RDW, TBM, SDW, RVL, PUtE, and PER. Moreover, TIP exhibited a high and strong correlation with TPU (Figure 3a,b).

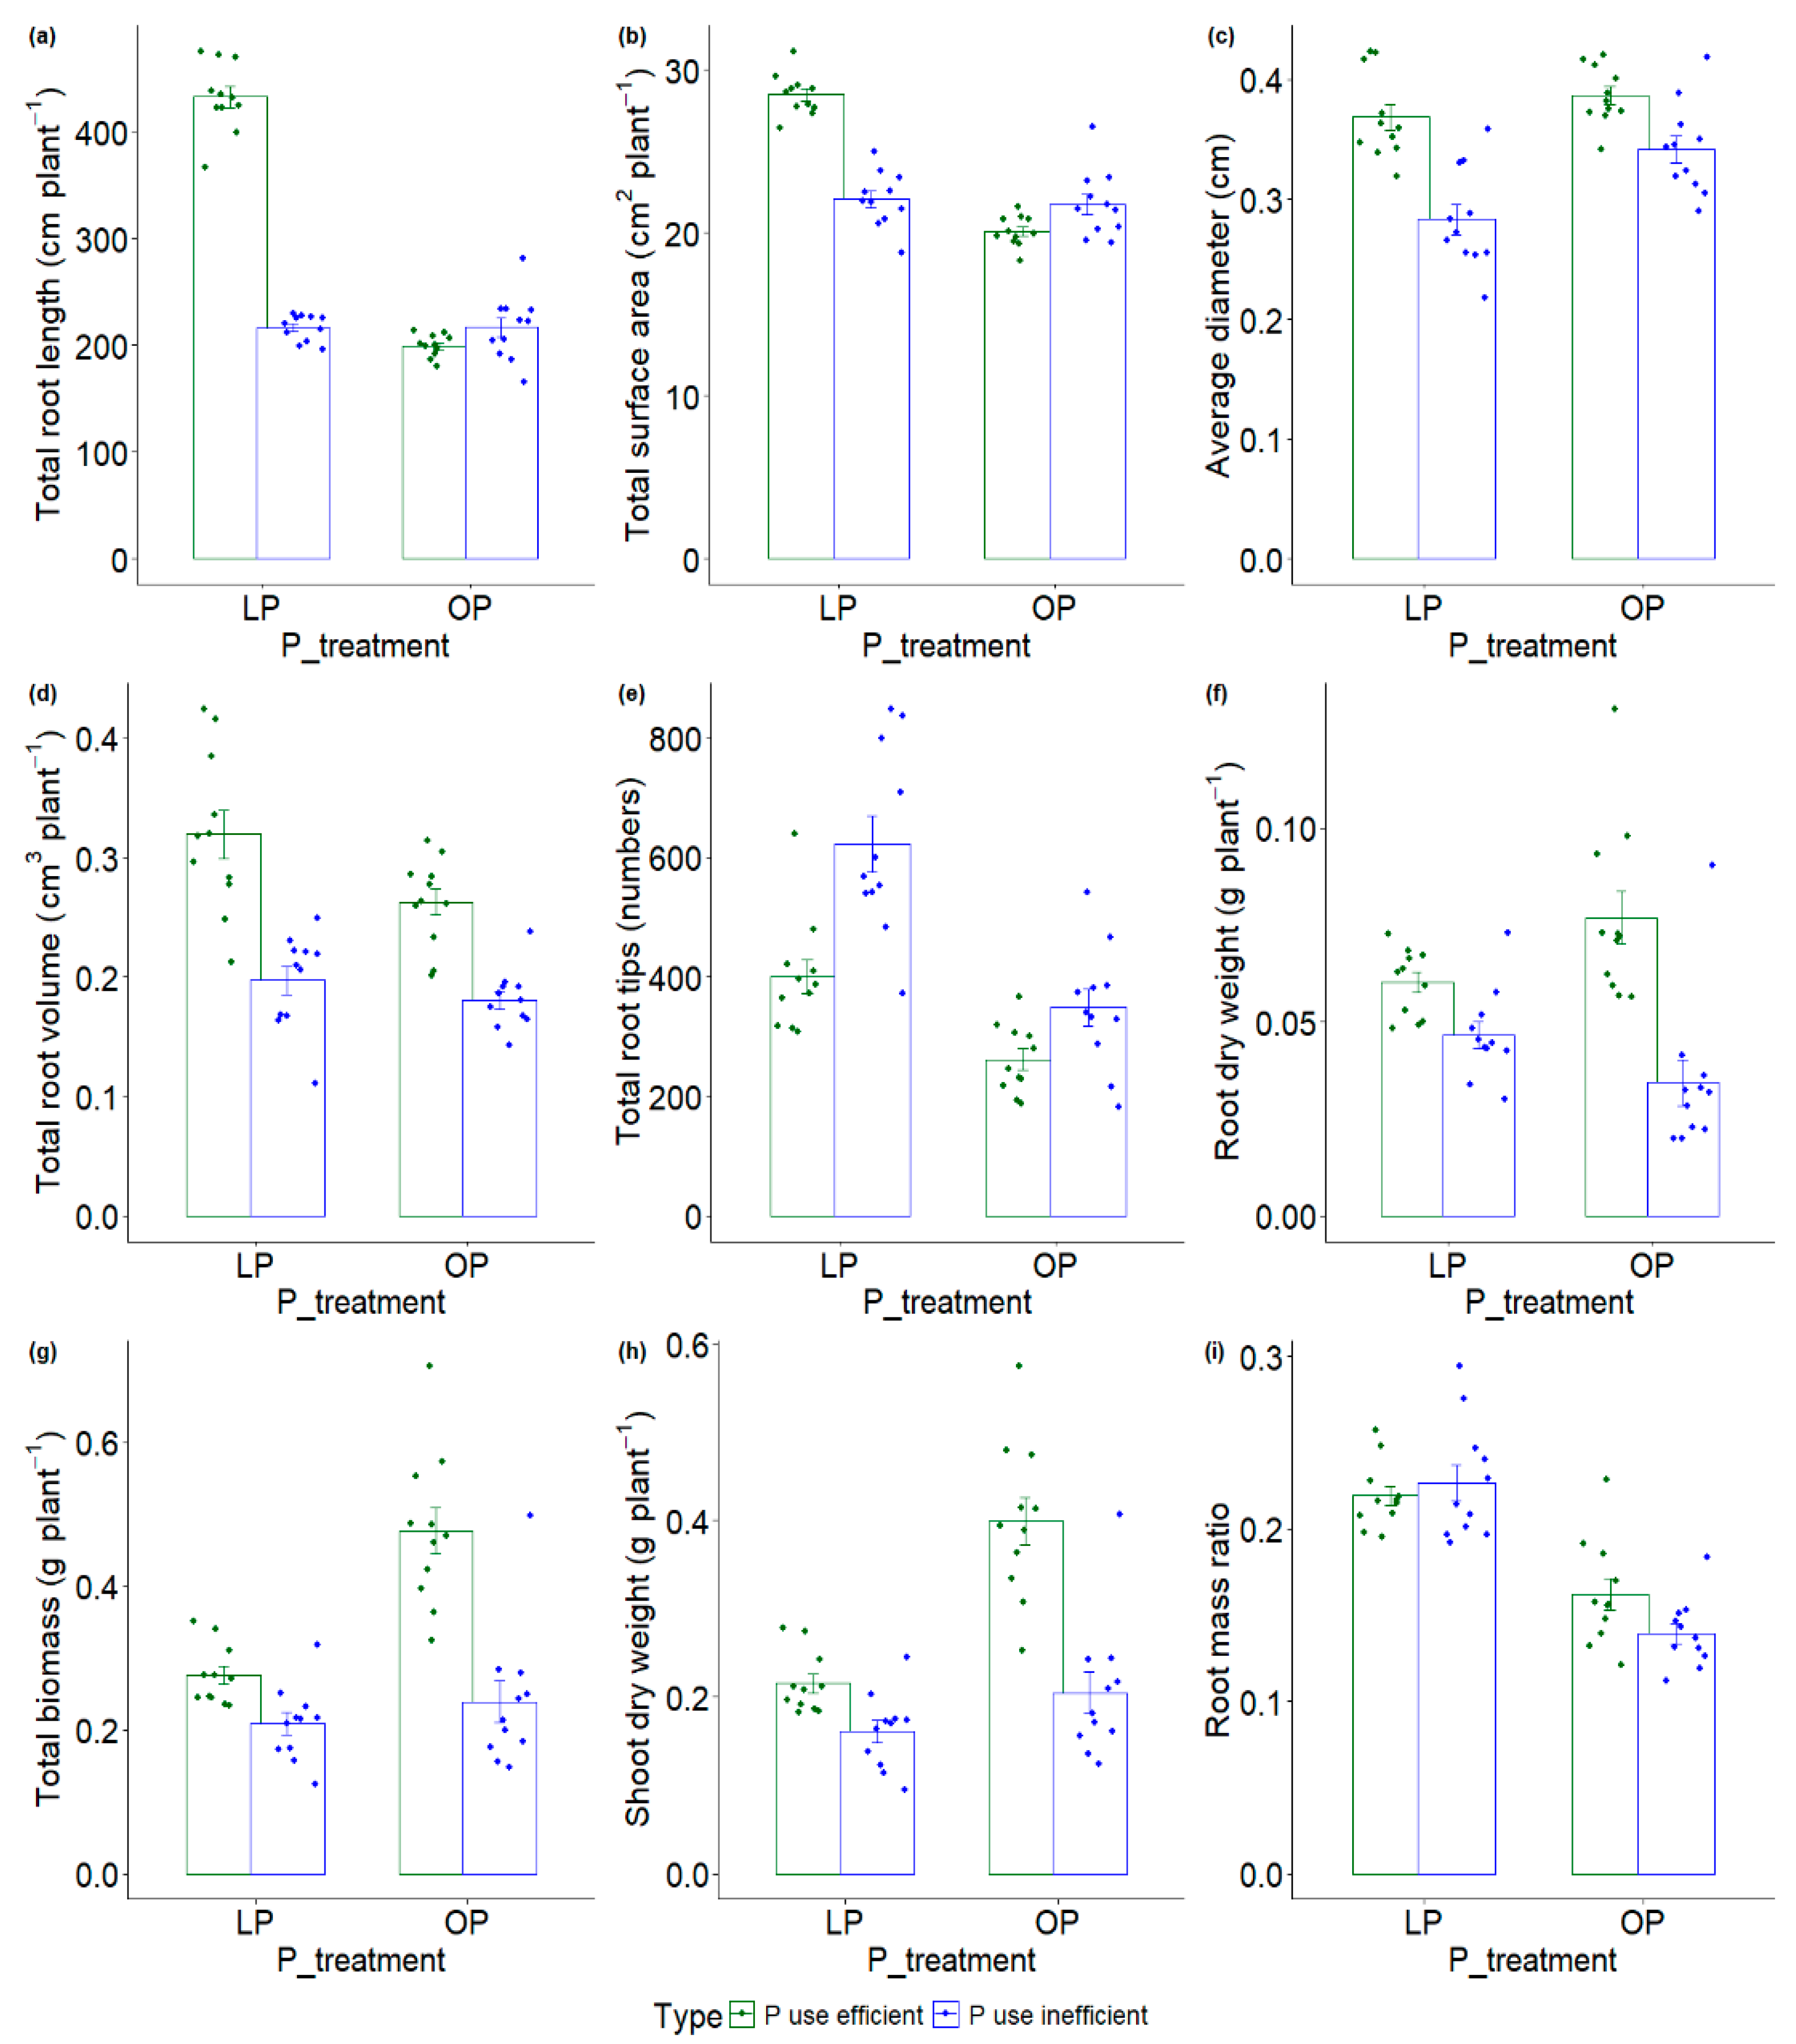
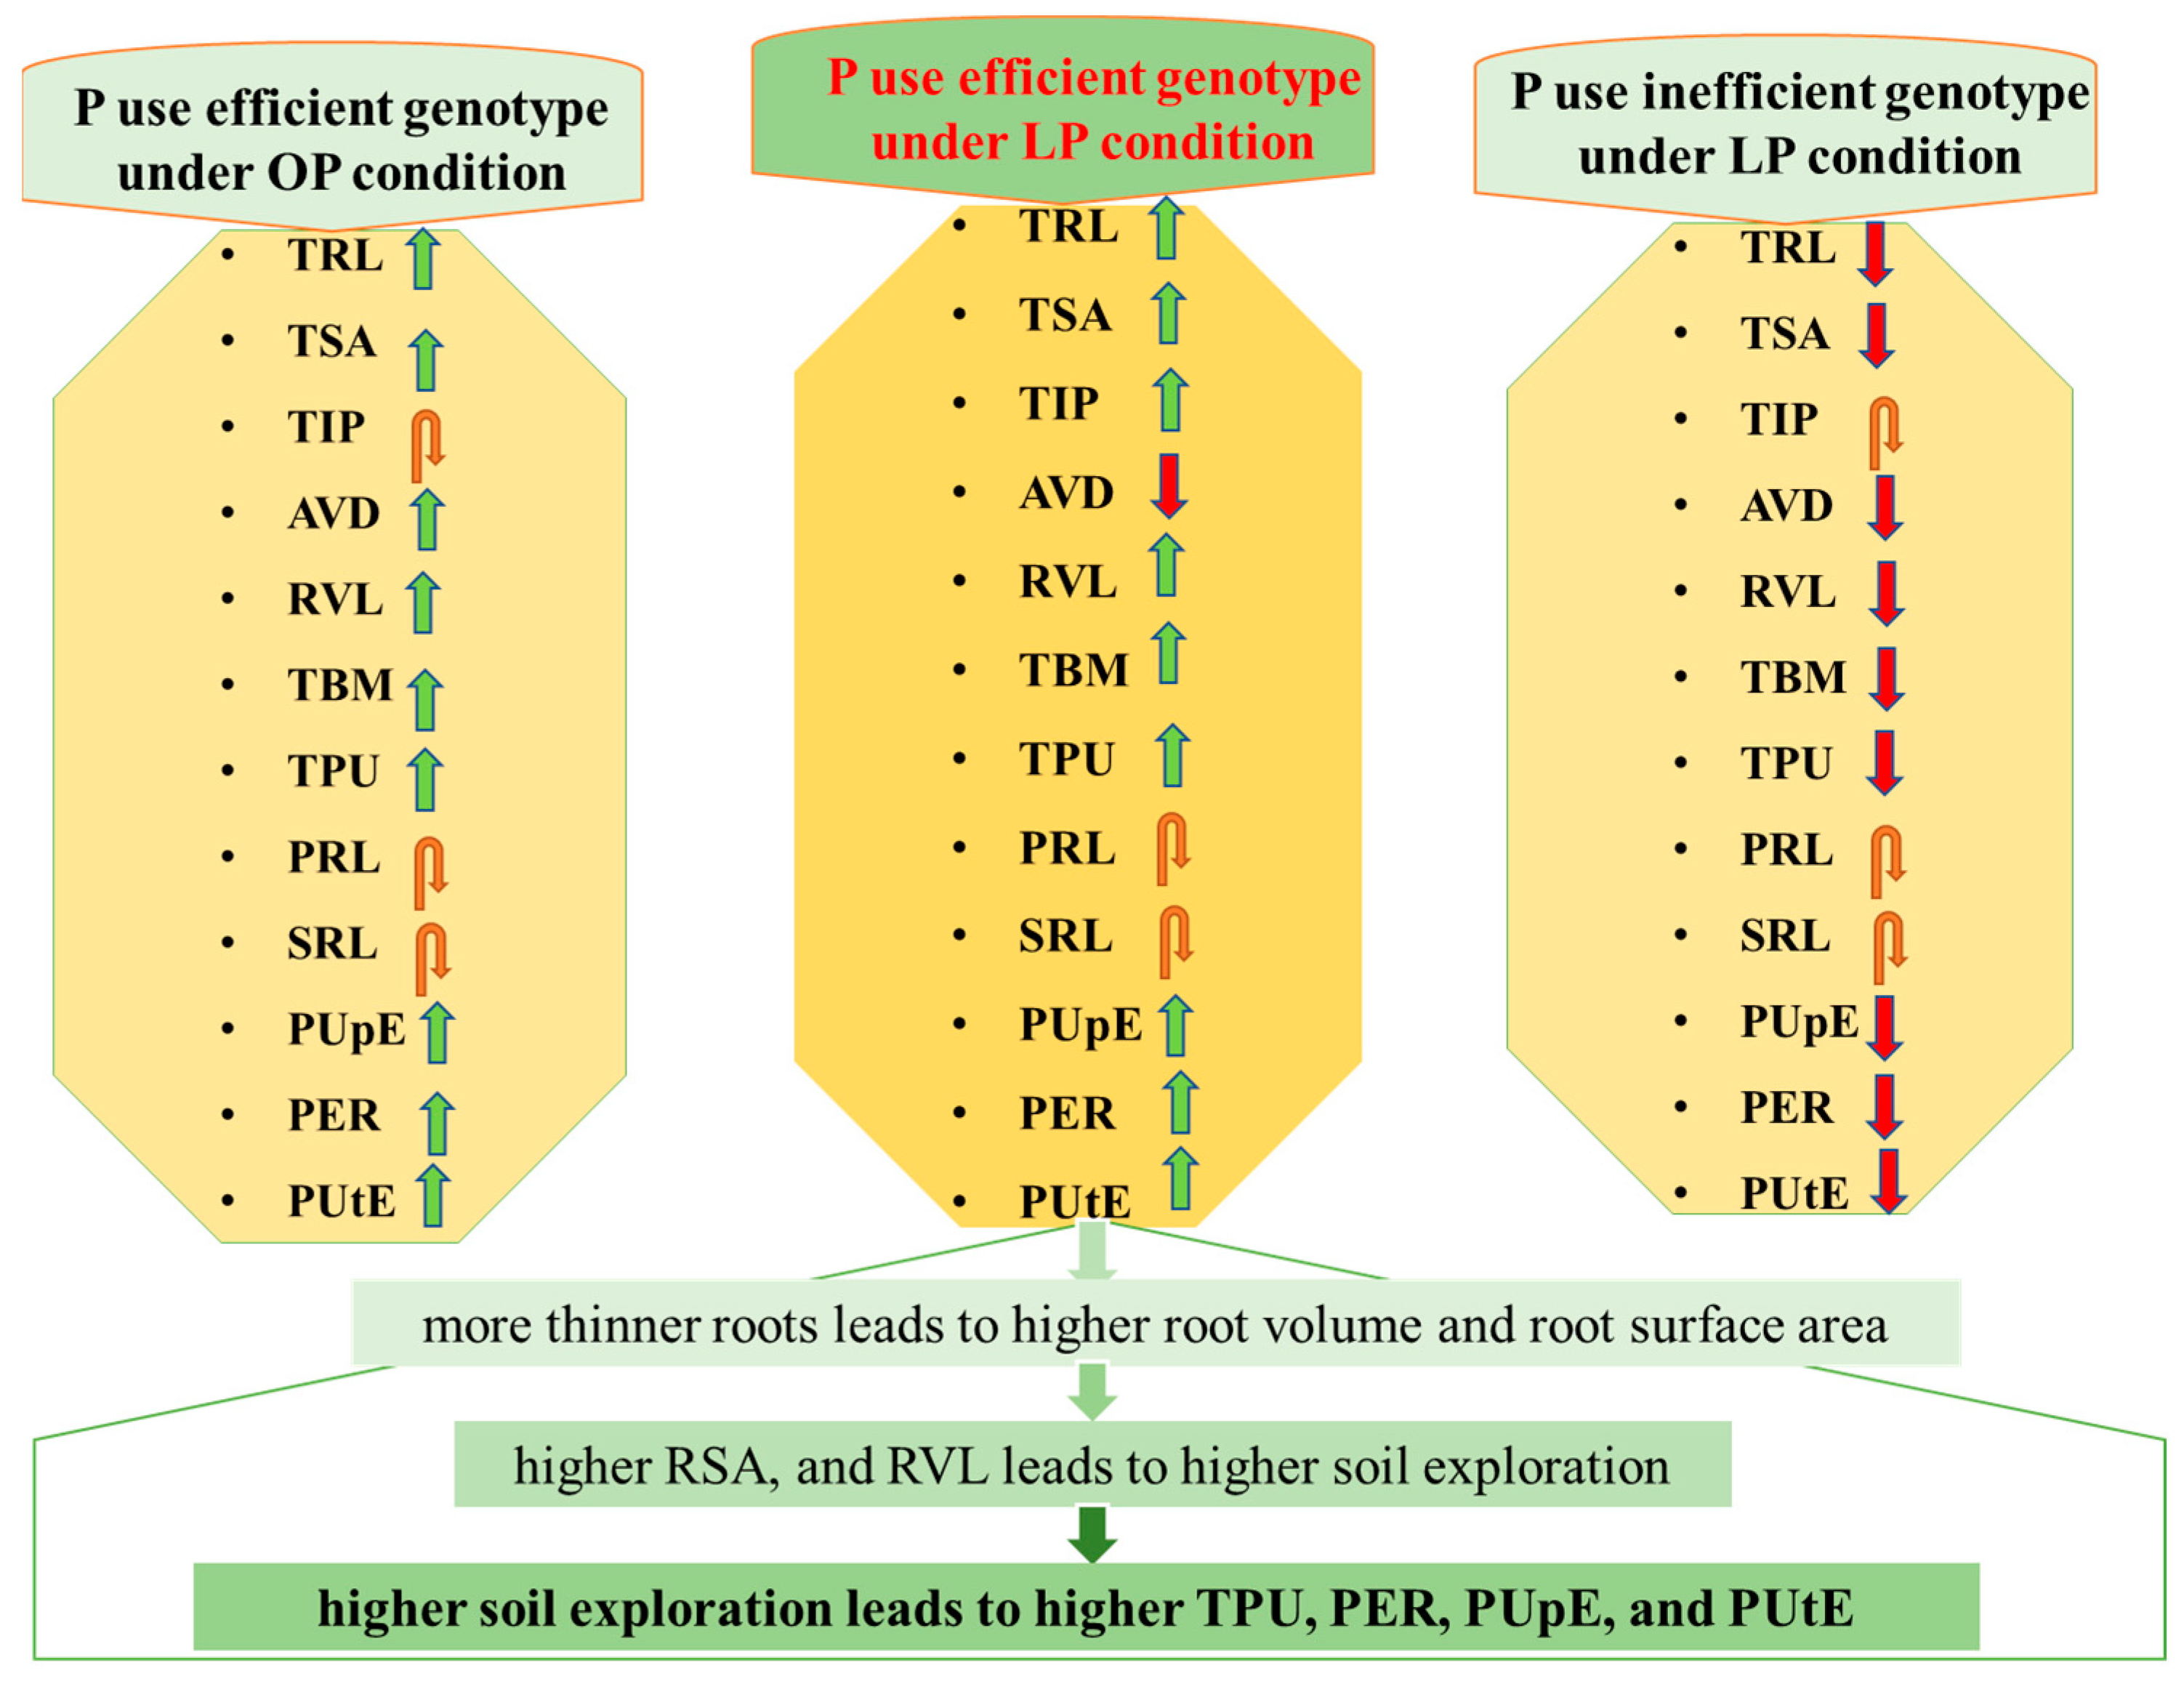
3.5. Identification and Differential Responses of Contrasting Groups to Low and Optimum P

Based on the PCA ranking values, the top 11 genotypes with higher rank values were grouped as P use efficient and the bottom 11 accessions with low rank values were grouped as P use inefficient (Table 4 and Table S5). The P use efficient genotypes possessed ranking values higher than 268.87, while the P-inefficient genotypes showed ranking values lower than 127.13 (Table S5). The phenotypic and genotypic variations in P use efficient and inefficient genotypes under different P levels are visualized in the bar plots (Figure 4a–i: Figure S2a–g). Among P use-efficient genotypes, six were Indian and three genotypes had their origins in Mexico, China, and India, respectively, while the origins of two genotypes were not available. Likewise, six Indian genotypes were P use inefficient, while the details of the other five P-inefficient genotypes were not available (Table 4 and Table S2). All of the P use-efficient genotypes showed >53% increases in TRL and >29% increases in TSA under low P as compared to optimum P (Figure 4a). Similarly, other traits like TIP, RMR, PRL, PER, PUtE, and SRL also showed >31%, >8%, >25%, >2%, >87%, >77%, and >63% increases, respectively, in all P use-efficient genotypes under low P as compared to optimum P conditions (Figure 4; Figure S2). On the other hand, the P use-inefficient genotypes showed >69% increases in PER and PUtE under low P compared to optimum P. Reductions in SRL (>42%) were observed in the P use-inefficient genotypes. Further, the P use-inefficient genotypes showed 14% and 27.2% decreases in TBM and SDW, respectively, in response to low P as compared to optimum P conditions (Figure 4g,h).
These accessions were identified on the basis of PCA ranking using loading scores from relative values under low and optimum P conditions. The ranking values are presented in Table S5.

3.6. Grouping Genotypes Based on Root, Biomass, and P Indices

The dendrogram of the AHC analysis revealed four distinct groups of genotypes based on their relative values under optimum and low P for six root-related (TRL, TSA, RVL, TIP, PRL, and SRL), three biomass-related (RDW, TBM, RMR, and SDW), and five P index traits (P CON, TPU, PER, PUpE, and PUtE) using ward.D. Out of 204 wheat genotypes, 22, 100, 65, and 17 genotypes were grouped into Clusters I, II, III, and IV, respectively. Out of 22 genotypes in Cluster I, 16 were Indian, 2 Australian, 1 Mexican, 1 German, and 2 were genotypes for which the origin information was not available. Out of 100 genotypes in Cluster II, 57 were Indian, 14 Australian, 9 Mexican, 1 Brazilian, 1 of Chinese origin, and 17 were genotypes for which the origin information was not available. Likewise, 46 Indian, 3 Australian, 3 Mexican, 1 Chinese, 1 Iranian, and 10 genotypes for which the origin information was not available formed Cluster III. Out of 17 genotypes in Cluster IV, nine were Indian, one Australian, one of Egyptian origin, and six were genotypes for which the origin information was not available (Figure 5). These results confirmed that genotypes from the same origin were not always clustered into the same or close group(s). Clusters I and II showed maximum increases in TRL, TSA, RVL, TIP, RDW, TBM, PER, PUtE, and SRL as compared to other clusters. All 11 P use-efficient genotypes were grouped in Clusters I and II, while most of the P use-inefficient genotypes were present in Cluster IV. Root morphological traits like TRL, RVL, TIP, and P index trait PUtE showed significant increases under low P compared to optimum P conditions in all clusters.

4. Discussion

In the present study, we examined the influence of low P on root morphology, biomass, and P-related indices of 204 diverse wheat genotypes and investigated the various root (TRL, TSA, RVL, TIP, PRL, AVD and SRL), biomass (RDW, SDW, RMR, and TBM), and P index traits (P CON, PER, TPU, PUpE, and PUtE). A common response to low P stress, in terms of increased RMR, was due to better stimulation of the root at the expense of shoot growth [43]. TRL represents the sum of primary, seminal, crown, basal, and lateral roots. The various components of RSA were also selected as important traits for the screening of genotypes under P deficiency. We found significant variations, medium to high heritability, and significant correlations for various traits. Low CV and high heritability of these studied traits showed the genetic stability of the traits in the genotypes. Our results are in agreement with earlier reports [10,44,45]. The extensively used indicators TRL, TSA, RVL, and AVD were highly heritable under low P, suggesting that they are reliable parameters for PUE (Table S2). Higher root length and root density in the topsoil of wheat crops was reported to be the most important root trait for P uptake [10,46], which was positively correlated with enhanced recovery of fertilized P. Allocation of resources toward greater TRL, TSA, and soil exploration rather than radial thickening of roots is especially important for exploration of soil domains where growth limiting resources are confined [10,47].
The traits such as TRL, TSA, RVL, TIP, RDW, TBM, SDW, PRL, PUtE, and SRL identified from principal component analysis were responsible for higher phenotypic variation at the seedling stage under the OP condition of tested wheat genotypes (Figure 3a). But under the low P condition, AVD, TSA, RVL, TIP, TBM, SDW, PRL, P CON, TPU, PER, PUtE, and PUpE were responsible for higher phenotypic variation (Figure 3b). Earlier reports also found similar results, with traits such as TRL, TSA, RDW, TIP, and AVD identified as the major traits for selection of wheat genotypes under different P levels [10,32]. The higher loading matrix values in the PCA demonstrated that the phenotypic variation was more due to TIP, PRL, TPU, P CON, PER, and PUtE under low P as compared to optimum P conditions (Figure 3; Table 3). Moreover, TRL, TSA, RVL, TBM, SDW, PER, SRL, and RDW showed strong associations with PUtE under low P rather than optimum P conditions. Finally, we suggest phenotypic traits like TRL, RDW, TPU, P CON, PER, PUtE, TBM, TSA, TIP, and AVD as potential physiological markers for the selection of bread wheat genotypes for P use efficiency.
The PCA, genetic, and phenotypic correlations showed that TRL was significantly and positively correlated with TSA, RVL, and PUtE under both P levels, but negatively correlated with AVD typically under the low P condition. Identified P use-efficient genotypes also showed a decrease in AVD under low P rather than optimum P. This demonstrated that AVD plays a key role in P availability as compared to other root-related traits at the seedling stage. Reduction in AVD leads to thinner roots and diverts the energy toward increasing length, so that the roots can extend to unexplored soil regions to forage for more P [48,49]. Reduced AVD under low P compared to optimum P was reported in maize (Zea mays L.) [45], sorghum (Sorghum bicolor (L.) Moench) [47], wheat [10,50], and Aegilops tauschii [51]. Similarly, enhanced TRL under low P was observed in wheat grown in hydroponics [32,44,52] and field conditions [53]. Thus, suppression of root secondary growth (reduction in average diameter of the root) decreases the metabolic (i.e., carbon, nutrient, and energy) costs of producing and sustaining root length and has been proposed to be an adaptive strategy to improve the metabolic efficiency of soil exploration [47,53,54]. Another key trait, root surface area, has a close association with the nutrient absorption rate. Vigorous root growth with high TRL and TSA guarantees the effective absorption of macro and micronutrients at the early growth stage of the plant. TSA and TRL are mainly influenced by the root diameter [10,27,55]. In addition, TRL and root number were also positively correlated with biomass and grain yield [56,57]. Other noticeable genotypic and phenotypic correlations were between TSA and TIP, PRL, and PUtE, which were typically higher under low P. Further, RVL, RDW, and TBM also showed higher correlations with PUtE under both P levels (Table S4, Figure 3). Therefore, water and nutrient uptake from the soil is proportional to the contact area between the root surface and soil [58]. The higher values of PUtE under the optimum P condition were attributed to high values of TPU for the studied genotypes. The presented results are in good synchronization with the earlier reports of PUtE in rice [59] and wheat [44,50,60].
The multivariate analysis, like PCA, identified traits like TBM and SDW as highly dependent variables for PUtE under optimum P, whereas under low P, TBM, PER, PUpE, AVD, and TIP were highly dependent variables for PUtE. Furthermore, PCA and genotypic correlation studies emphasized the TIPs positive associations with TPU, and PUpE, as well as SRL relationships with PCON, and PUpE. The root meristem exhaustion under low P probably perturbs auxin circulation in the root tip and consequently impacts lateral branching in older parts of the root. This increases the absorptive surface area for nutrients. A plastic response of lateral root proliferation (increase in number of root ends or tips) was induced in wheat and maize in response to P deprivation [25,44,61]. The plastic responses of P use-efficient and -inefficient genotypes in root, biomass, and P index traits under different P conditions are depicted in Figure 6. SRL, the length to mass ratio of roots, represents how the root mass can be used for nutrient acquisition. An increase in SRL would increase the volume of soil explored per unit of biomass invested in the fine roots, which is dependent on environmental changes [62,63,64]. These findings indicate that PUtE, TIP, AVD, PUpE, RDW, SRL, and TBM are key root traits differentiating P availability among the studied traits.
Phosphorus use efficiency is the dry biomass formed per unit of P uptake. It is well known that both P uptake and utilization are vital for high P use efficiency. Generally, PUtE is low under optimum P and high under low P conditions (Table 1). Genetic variation for better P uptake and utilization under P-deficient conditions has been reported in various wheat genotypes [65,66,67].
Among the traits, PRL, TSA, AVD, TRL, RMR, TIP, TBM, RDW, and RVL showed high H’ index values under the low P condition, whereas under optimum P, traits like TSA, RVL, PER, PUtE, P CON, and TBM showed higher H’ index value. The Shannon–Weaver diversity index has been previously used to describe root trait diversity in rice [68], maize [69], mung bean [70], and wheat [71]. Greater root diameter diversity is attributed to an improvement in the fine root dispersion by root diameter class, regardless of root length [72]. The presence of high H’ values in this study showed the presence of significant phenotypic diversity and balanced frequency distribution [57,73].
Among genotypes, WH 1022, WH 102, and PAVON F76 exhibited the highest percent increases in TRL under low P in comparison to optimum P. Furthermore, these genotypes possessed higher PCA ranking values (>210.5) (Table S5). Therefore, these genotypes may be included in the wheat breeding program to develop P nutrient use-efficient genotypes with enhanced TRL and PUtE. Genotypes from different geographic origins showed some variations in root, biomass, and P index traits (Figure S3a–p), which reflects potential ecological and climatic linkages that require further exploration.

5. Conclusions

Large phenotypic and genotypic variability in root, biomass, and P index traits in diverse wheat genotypes under low and optimum P treatments was observed at the seedling stage using a hydroponic phenotyping platform. Screening a large set of genotypes in hydroponics provided the least environmental influences. Moreover, it was previously demonstrated that the selection of genotypes via hydroponic screening is likely to be relevant in the field too [33]. Phenotypic and genotypic differences and trait correlations may be useful for breeding wheat cultivars with efficient acquisition of P with better root architectural adaptations to resource-depleted environments. Further, the genotype WH 1022 along with P use-efficient and -inefficient genotypes (Table 4) may be used to identify the genes/genomic regions for P use efficiency by developing mapping populations to design suitable markers for molecular breeding programs. Our results indicate that the P use-efficient genotypes showed increased fine root anatomy and their adaptation strategy to low P conditions. The studied traits like TIP, RVL, TSA, AVD, TRL, P CON, TBM, RDW, PUtE, and PER showed higher phenotypic variation and heritability under the low P condition, which can be used as physiological markers for evaluating the responses of wheat accessions to P nutrient stress conditions. More shoot-associated traits, such as phenological development and shoot morphophysiological characteristics, could be measured in the coming studies.

Supplementary Materials

The following supporting information can be downloaded at: https://www.mdpi.com/article/10.3390/agriculture14030447/s1, Table S1: Description of the 16 root, biomass, and phosphorus index traits accessed in the study [7,27,48,58,70,74,75]; Table S2: Pedigree details of 204 diverse wheat accessions originating from nine countries grown in hydroponics culture under low P and optimum P conditions (Source: http://wheatpedigree.net/) (accessed on 6 April 2023); Table S3: Genotypic and phenotypic variance and broad-sense heritability (h2) for all traits measured under low P and optimum P conditions for all 204 accessions; Table S4a: Genetic correlations among 16 tested traits under optimum P for all 204 accessions; Table S4b: Genetic correlations among 16 tested traits under the low P condition for all 204 accessions; Table S4c: Phenotypic correlations among 16 tested traits under the optimum P condition for all 204 accessions; Table S4d: Phenotypic correlations among 16 tested traits under the low P condition for all 204 accessions; Table S5: The PCA ranking values derived from principal components (PC) 1 to 4 using 15 traits of wheat under two P levels; Figure S1: Geographic origin of 204 wheat accessions used in the present study. Color indicates the country of origin. The geographic distributions of accessions are visualized by https://www.mapchart.net/world-advanced.html (accessed on 2 March 2023); Figure S2: Bar plot showing variations of P use-efficient and -inefficient genotypes under low and optimum P in (a) Total P uptake (TPU), (b) P concentration (P CON), (c) P utilization efficiency (PUtE), (d) P efficiency ratio (PER), (e) P uptake efficiency (PUpE), (f) Primary root length (PRL), and (g) Specific root length (SRL). Bar plots show the means and error bars indicate standard error; Figure S3a–p: Variations among the nine countries of origin in (a) Total root length, (b) Total surface area, (c) Average diameter, (d) Total root volume, (e) Total root tips, (f) Root dry weight, (g) Total biomass, (h) Shoot dry weight, (i) Root mass ratio, (j) Primary root length, (k) P concentration, (l) Total P uptake, (m) P efficiency ratio, (n) P utilization efficiency, (o) P uptake efficiency, and (p) specific root length in 204 wheat genotypes grown in a hydroponic phenotyping platform for 21 days. The boxplots are confined to the first and third quartile with the middle lines being the median. The number of genotypes in each country varied and ranged from 1 to 127 (see Table S2).

Author Contributions

Conceptualization, R.P. and V.R.; data curation, V.R. and T.K.; formal analysis, V.R.; funding acquisition, R.P.; investigation, V.R.; methodology, R.P., K.K.V. and V.R.; project administration, R.P.; resources, R.P.; supervision, R.P.; writing-original draft, V.R.; writing-review and editing, V.R., K.V., K.K.V., V.C. and R.P. All authors have read and agreed to the published version of the manuscript.

Funding

This work was partly supported by the Newton-Bhabha Fund Project co-funded by the Department of Biotechnology Ministry of Science and Technology, Government of India (Grant number BT/IN/UK-VNC/43/KV/2015-16) to R. Pandey and NAHEP-CAAST (National Agricultural Higher Education Project-Centre of Advanced Agricultural Science & Technology) to Vijay Rajamanickam.

Institutional Review Board Statement

Not applicable.

Data Availability Statement

Data generated and analyzed during this study are contained in this manuscript or Supplementary Materials.

Acknowledgments

We would like to thank ICAR-Indian Agricultural Research Institute, New Delhi, India, for providing subsistence fellowship and to the Department of Biotechnology, Ministry of Science & Technology, Government of India, for providing the Newton-Bhabha PhD Program fellowship to V.R. during PhD program.

Conflicts of Interest

The authors declare no conflicts of interest.

References

  1. Tan, Y.; Chai, Q.; Li, G.; Zhao, C.; Yu, A.; Fan, Z.; Yin, W.; Hu, F.; Fan, H.; Wang, Q.; et al. Improving wheat grain yield via promotion of water and nitrogen utilization in arid areas. Sci. Rep. 2021, 11, 13821. [Google Scholar] [CrossRef] [PubMed]
  2. Chowdhury, M.K.; Hasan, M.A.; Bahadur, M.M.; Islam, R.; Hakim, A.; Iqbal, M.A.; Javed, T.; Raza, A.; Shabbir, R.; Sorour, S.; et al. Evaluation of drought tolerance of some wheat (Triticum aestivum L.) genotypes through phenology, growth, and physiological indices. Agronomy 2021, 11, 1792. [Google Scholar] [CrossRef]
  3. Liu, J.; Xu, Z.; Fan, X.; Zhou, Q.; Cao, J.; Wang, F.; Ji, G.; Yang, L.; Feng, B.; Wang, T. A genome-wide association study of wheat spike related traits in China. Front. Plant Sci. 2018, 871, 1584. [Google Scholar] [CrossRef] [PubMed]
  4. Regmi, K.C.; Yogendra, K.; Farias, J.G.; Li, L.; Kandel, R.; Yadav, U.P.; Sha, S.; Trittermann, C.; Short, L.; George, J.; et al. Improved yield and photosynthate partitioning in AVP1 expressing wheat (Triticum aestivum) plants. Front. Plant Sci. 2020, 11, 273. [Google Scholar] [CrossRef] [PubMed]
  5. Van Duivenbooden, N.; De Wit, C.T.; Van Keulen, H. Nitrogen, Phosphorus and Potassium Relations in Five Major Cereals Reviewed in Respect to Fertilizer Recommendations Using Simulation Modelling. Fertil. Res. 1996, 44, 37–49. [Google Scholar] [CrossRef]
  6. Vinod, K.K.; Heuer, S. Approaches towards nitrogen- and phosphorus-efficient rice. AoB Plants 2012, 2012, pls028. [Google Scholar] [CrossRef] [PubMed]
  7. Pongrac, P.; Castillo-Michel, H.; Reyes-Herrera, J.; Hancock, R.D.; Fischer, S.; Kelemen, M.; Thompson, J.A.; Wright, G.; Likar, M.; Broadley, M.R.; et al. Effect of phosphorus supply on root traits of two Brassica oleracea L. genotypes. BMC Plant Biol. 2020, 20, 368. [Google Scholar] [CrossRef]
  8. Qiu, H.; Mei, X.; Liu, C.; Wang, J.; Wang, G.; Wang, X.; Liu, Z.; Cai, Y. Fine mapping of quantitative trait loci for acid phosphatase activity in maize leaf under low phosphorus stress. Mol. Breed. 2013, 32, 629–639. [Google Scholar] [CrossRef]
  9. Salim, N.; Raza, A. Nutrient Use Efficiency (NUE) for sustainable wheat production: A review. J. Plant Nutr. 2020, 43, 297–315. [Google Scholar] [CrossRef]
  10. Lin, Y.; Chen, G.; Hu, H.; Yang, X.; Zhang, Z.; Jiang, X.; Wu, F.; Shi, H.; Wang, Q.; Zhou, K.; et al. Phenotypic and genetic variation in phosphorus-deficiency-tolerance traits in chinese wheat landraces. BMC Plant Biol. 2020, 20, 330. [Google Scholar] [CrossRef]
  11. Hasan, B.R. Phosphorus Status of Soils in India. Crops 1996, 10, 4–5. [Google Scholar]
  12. Alewell, C.; Ringeval, B.; Ballabio, C.; Robinson, D.A.; Panagos, P.; Borrelli, P. Global Phosphorus Shortage Will Be Aggravated by Soil Erosion. Nat. Commun. 2020, 11, 4546. [Google Scholar] [CrossRef] [PubMed]
  13. Kauwenbergh, S.J.V. World Phosphate Rock Reserves and Resources. Available online: https://Pdf.Usaid.Gov/Pdf_docs/PNADW835.Pdf (accessed on 15 December 2023).
  14. Iqbal, A.; Gui, H.; Zhang, H.; Wang, X.; Pang, N.; Dong, Q.; Song, M. Genotypic Variation in Cotton Genotypes for Phosphorus-Use Efficiency. Agronomy 2019, 9, 689. [Google Scholar] [CrossRef]
  15. Gaxiola, R.A.; Edwards, M.; Elser, J.J. A Transgenic Approach to Enhance Phosphorus Use Efficiency in Crops as Part of a Comprehensive Strategy for Sustainable Agriculture. Chemosphere 2011, 84, 840–845. [Google Scholar] [CrossRef] [PubMed]
  16. MacDonald, G.K.; Bennett, E.M.; Potter, P.A.; Ramankutty, N. Agronomic Phosphorus Imbalances across the World’s Croplands. Proc. Natl. Acad. Sci. USA 2011, 108, 3086–3091. [Google Scholar] [CrossRef] [PubMed]
  17. Herder, G.D.; Van Isterdael, G.; Beeckman, T.; De Smet, I. The Roots of a New Green Revolution. Trends Plant Sci. 2010, 15, 600–607. [Google Scholar] [CrossRef] [PubMed]
  18. Dhanapal, A.P.; York, L.M.; Hames, K.A.; Fritschi, F.B. Genome-Wide Association Study of Topsoil Root System Architecture in Field-Grown Soybean [Glycine mx (L.) Merr.]. Front. Plant Sci. 2021, 11, 590179. [Google Scholar] [CrossRef]
  19. Manavalan, L.P.; Prince, S.J.; Musket, T.A.; Chaky, J.; Deshmukh, R.; Vuong, T.D.; Song, L.; Cregan, P.B.; Nelson, J.C.; Shannon, J.G.; et al. Identification of Novel QTL Governing Root Architectural Traits in an Interspecific Soybean Population. PLoS ONE 2015, 10, e0120490. [Google Scholar] [CrossRef]
  20. Nguyen, V.L.; Stangoulis, J. Variation in root system architecture and morphology of two wheat genotypes is a predictor of their tolerance to phosphorus deficiency. Acta Physiol. Plant 2019, 41, 109. [Google Scholar] [CrossRef]
  21. Bates, T.R.; Lynch, J.P. Stimulation of Root Hair Elongation in Arabidopsis Thaliana by Low Phosphorus Availability. Plant. Cell Environ. 1996, 19, 529–538. [Google Scholar] [CrossRef]
  22. Williamson, L.C.; Ribrioux, S.P.C.P.; Fitter, A.H.; Leyser, H.M.O. Phosphate availability regulates root system architecture in arabidopsis. Plant Physiol. 2001, 126, 875–882. [Google Scholar] [CrossRef]
  23. Huang, G.; Liang, W.; Sturrock, C.J.; Pandey, B.K.; Giri, J.; Mairhofer, S.; Wang, D.; Muller, L.; Tan, H.; York, L.M.; et al. Rice actin binding protein RMD controls crown root angle in response to external phosphate. Nat. Commun. 2018, 9, 2346. [Google Scholar] [CrossRef] [PubMed]
  24. Gruber, B.D.; Giehl, R.F.H.; Friedel, S.; von Wirén, N. Plasticity of the arabidopsis root system under nutrient deficiencies. Plant Physiol. 2013, 163, 161–179. [Google Scholar] [CrossRef]
  25. Niu, Y.F.; Chai, R.S.; Jin, G.L.; Wang, H.; Tang, C.X.; Zhang, Y.S. Responses of root architecture development to low phosphorus availability: A Review. Ann. Bot. 2013, 112, 391–408. [Google Scholar] [CrossRef] [PubMed]
  26. Kohli, P.S.; Kumar Verma, P.; Verma, R.; Parida, S.K.; Thakur, J.K.; Giri, J. Genome-Wide Association Study for Phosphate Deficiency Responsive Root Hair Elongation in Chickpea. Funct. Integr. Genom. 2020, 20, 775–786. [Google Scholar] [CrossRef]
  27. Wang, Y.S.; Jensen, L.S.; Magid, J. Differential Responses of Root and Root Hair Traits of Spring Wheat Genotypes to Phosphorus Deficiency in Solution Culture. Plant. Soil Environ. 2016, 62, 540–546. [Google Scholar] [CrossRef]
  28. Li, R.; Zeng, Y.; Xu, J.; Wang, Q.; Wu, F.; Cao, M.; Lan, H.; Liu, Y.; Lu, Y. Genetic Variation for Maize Root Architecture in Response to Drought Stress at the Seedling Stage. Breed. Sci. 2015, 65, 298–307. [Google Scholar] [CrossRef] [PubMed]
  29. Bilal, H.M.; Aziz, T.; Maqsood, M.A.; Farooq, M.; Yan, G. Categorization of Wheat Genotypes for Phosphorus Efficiency. PLoS ONE 2018, 13, e0205471. [Google Scholar] [CrossRef]
  30. Campos, P.; Borie, F.; Cornejo, P.; López-Ráez, J.A.; López-García, Á.; Seguel, A. Phosphorus acquisition efficiency related to root traits: Is mycorrhizal symbiosis a key factor to wheat and barley cropping? Front. Plant Sci. 2018, 9, 752. [Google Scholar] [CrossRef]
  31. van de Wiel, C.C.; van der Linden, C.G.; Scholten, O.E. Improving phosphorus use efficiency in agriculture: Opportunities for breeding. Euphytica 2016, 207, 1–22. [Google Scholar] [CrossRef]
  32. Soumya, P.R.; Sharma, S.; Meena, M.K.; Pandey, R. Response of Diverse Bread Wheat Genotypes in Terms of Root Architectural Traits at Seedling Stage in Response to Low Phosphorus Stress. Plant Physiol. Rep. 2021, 26, 152–161. [Google Scholar] [CrossRef]
  33. Soumya, P.R.; Singh, D.; Sharma, S.; Singh, A.M.; Pandey, R. Evaluation of Diverse Wheat (Triticum aestivum) and Triticale (× Triticosecale) Genotypes for Low Phosphorus Stress Tolerance in Soil and Hydroponic Conditions. J. Soil Sci. Plant Nutr. 2021, 21, 1236–1251. [Google Scholar] [CrossRef]
  34. Li, L.; Peng, Z.; Mao, X.; Wang, J.; Chang, X.; Reynolds, M.; Jing, R. Genome-Wide Association Study Reveals Genomic Regions Controlling Root and Shoot Traits at Late Growth Stages in Wheat. Ann. Bot. 2019, 124, 993–1006. [Google Scholar] [CrossRef] [PubMed]
  35. Ma, J.; Zhao, D.; Tang, X.; Yuan, M.; Zhang, D.; Xu, M.; Duan, Y.; Ren, H.; Zeng, Q.; Wu, J.; et al. Genome-Wide Association Study on Root System Architecture and Identification of Candidate Genes in Wheat (Triticum aestivum L.). Int. J. Mol. Sci. 2022, 23, 1843. [Google Scholar] [CrossRef] [PubMed]
  36. Alvarado, G.; Rodríguez, F.M.; Pacheco, A.; Burgueño, J.; Crossa, J.; Vargas, M.; Pérez-Rodríguez, P.; Lopez-Cruz, M.A. META-R: A Software to Analyze Data from Multi-Environment Plant Breeding Trials. Crop. J. 2020, 8, 745–756. [Google Scholar] [CrossRef]
  37. Falconer, D.S.; Mackay, T.F.C. Introduction to Quantitative Genetics, 4th ed.; Prentice Hall: Harlow, UK, 1996. [Google Scholar]
  38. Hallauer, A.R.; Carena, M.J.; Miranda Filho, J. Quantitative Genetics in Maize Breeding (Handbook of Plant Breeding); Springer Science & Business Media: New York, NY, USA; Berlin/Heidelberg, Germany, 2010. [Google Scholar]
  39. Shannon, C.E.; Weaver, W. The Mathematical Theory of Communication; The University of Illinois Press: Urbana, IL, USA, 1963. [Google Scholar]
  40. Hutcheson, K.A. A test for comparing diversities based on the Shannon formula. J. Theor. Biol. 1970, 29, 151–154. [Google Scholar] [CrossRef] [PubMed]
  41. Aski, M.S.; Rai, N.; Reddy, V.R.P.; Gayacharan; Dikshit, H.K.; Mishra, G.P.; Singh, D.; Kumar, A.; Pandey, R.; Singh, M.P.; et al. Assessment of root phenotypes in mungbean mini-core collection (MMC) from the World Vegetable Center (AVRDC) Taiwan. PLoS ONE 2021, 16, e0247810. [Google Scholar] [CrossRef] [PubMed]
  42. Meena, S.K.; Pandey, R.; Sharma, S.; Gayacharan; Kumar, T.; Singh, M.P.; Dikshit, H.K. Physiological basis of combined stress tolerance to low phosphorus and drought in a diverse set of mungbean germplasm. Agronomy 2021, 11, 99. [Google Scholar] [CrossRef]
  43. Ramaekers, L.; Remans, R.; Rao, I.M.; Blair, M.W.; Vanderleyden, J. Strategies for Improving Phosphorus Acquisition Efficiency of Crop Plants. Field Crops Res. 2010, 117, 169–176. [Google Scholar] [CrossRef]
  44. Zhang, H.; Wang, H.G. QTL Mapping for Traits Related to P-Deficient Tolerance Using Three Related RIL Populations in Wheat. Euphytica 2015, 203, 505–520. [Google Scholar] [CrossRef]
  45. Wang, Q.; Yuan, Y.; Liao, Z.; Jiang, Y.; Wang, Q.; Zhang, L.; Gao, S.; Wu, F.; Li, M.; Xie, W.; et al. Genome-Wide Association Study of 13 Traits in Maize Seedlings under Low Phosphorus Stress. Plant Genome 2019, 12, 190039. [Google Scholar] [CrossRef]
  46. Manske, G.G.B.; Ortiz-Monasterio, J.I.; Van Ginkel, M.; González, R.M.; Rajaram, S.; Molina, E.; Vlek, P.L.G. Traits associated with improved P-uptake efficiency in CIMMYT's semidwarf spring bread wheat grown on an acid Andisol in Mexico. Plant Soil 2000, 221, 189–204. [Google Scholar] [CrossRef]
  47. Gladman, N.; Hufnagel, B.; Regulski, M.; Liu, Z.; Wang, X.; Chougule, K.; Kochian, L.; Magalhães, J.; Ware, D. Sorghum Root Epigenetic Landscape during Limiting Phosphorus Conditions. Plant Direct 2022, 6, e393. [Google Scholar] [CrossRef]
  48. Strock, C.F.; De La Riva, L.M.; Lynch, J.P. Reduction in root secondary growth as a strategy for phosphorus acquisition. Plant Physiol. 2018, 176, 691–703. [Google Scholar] [CrossRef]
  49. Lynch, J. Root architecture and plant productivity. Plant Physiol. 1995, 109, 7. [Google Scholar] [CrossRef]
  50. Yang, M.; Wang, C.; Hassan, M.A.; Li, F.; Xia, X.; Shi, S.; Xiao, Y.; He, Z. QTL Mapping of Root Traits in Wheat under Different Phosphorus Levels Using Hydroponic Culture. BMC Genom. 2021, 22, 174. [Google Scholar] [CrossRef] [PubMed]
  51. Liu, Y.; Wang, L.; Deng, M.; Li, Z.; Lu, Y.; Wang, J.; Wei, Y.; Zheng, Y. Genome-Wide Association Study of Phosphorus-Deficiency-Tolerance Traits in Aegilops Tauschii. Theor. Appl. Genet. 2015, 128, 2203–2212. [Google Scholar] [CrossRef] [PubMed]
  52. Horst, W.J.; Abdou, M.; Wiesler, F. Genotypic Differences in Phosphorus Efficiency of Wheat. Plant Soil 1993, 155–156, 293–296. [Google Scholar] [CrossRef]
  53. Steingrobe, B.; Schmid, H.; Claassen, N. Root production and root mortality of winter barley and its implication with regard to phosphate acquisition. Plant Soil 2001, 237, 239–248. [Google Scholar] [CrossRef]
  54. Lynch, J.P.; Brown, K.M. Root strategies for phosphorus acquisition. Ecophysiol. Plant-Phosphorus Interact. 2008, 7, 83–116. [Google Scholar] [CrossRef]
  55. Imada, S.; Yamanaka, N.; Tamai, S. Water Table Depth Affects Populus Alba Fine Root Growth and Whole Plant Biomass. Funct. Ecol. 2008, 22, 1018–1026. [Google Scholar] [CrossRef]
  56. Xie, Q.; Fernando, K.M.C.; Mayes, S.; Sparkes, D.L. Identifying Seedling Root Architectural Traits Associated with Yield and Yield Components in Wheat. Ann. Bot. 2017, 119, 1115–1129. [Google Scholar] [CrossRef]
  57. Aski, M.; Mehra, R.; Mishra, G.P.; Singh, D.; Yadav, P.; Rai, N.; Reddy, V.R.P.; Arun Kumar, M.B.; Pandey, R.; Singh, M.P.; et al. Genotypic Variation in Root Architectural Traits under Contrasting Phosphorus Levels in Mediterranean and Indian Origin Lentil Genotypes. PeerJ 2022, 10, e12766. [Google Scholar] [CrossRef] [PubMed]
  58. Narayanan, S.; Mohan, A.; Gill, K.S.; Vara Prasad, P.V. Variability of Root Traits in Spring Wheat Germplasm. PLoS ONE 2014, 9, e100317. [Google Scholar] [CrossRef]
  59. Wissuwa, M.; Kondo, K.; Fukuda, T.; Mori, A.; Rose, M.T.; Pariasca-Tanaka, J.; Kretzschmar, T.; Haefele, S.M.; Rose, T.J. Unmasking Novel Loci for Internal Phosphorus Utilization Efficiency in Rice Germplasm through Genome-Wide Association Analysis. PLoS ONE 2015, 10, e0124215. [Google Scholar] [CrossRef] [PubMed]
  60. Yuan, Y.; Gao, M.; Zhang, M.; Zheng, H.; Zhou, X.; Guo, Y.; Zhao, Y.; Kong, F.; Li, S. QTL Mapping for Phosphorus Efficiency and Morphological Traits at Seedling and Maturity Stages in Wheat. Front. Plant Sci. 2017, 8, 614. [Google Scholar] [CrossRef]
  61. Yano, K.; Kume, T. Root Morphological Plasticity for Heterogeneous Phosphorus Supply in Zea mays L. Plant Prod. Sci. 2005, 8, 427–432. [Google Scholar] [CrossRef]
  62. Wang, X.; Veneklaas, E.J.; Pearse, S.J.; Lambers, H. Interactions among Cluster-Root Investment, Leaf Phosphorus Concentration, and Relative Growth Rate in Two Lupinus Species. Am. J. Bot. 2015, 102, 1529–1537. [Google Scholar] [CrossRef]
  63. Chen, Y.; Rengel, Z.; Palta, J.; Siddique, K.H.M. Efficient Root Systems for Enhancing Tolerance of Crops to Water and Phosphorus Limitation. Indian J. Plant Physiol. 2018, 23, 689–696. [Google Scholar] [CrossRef]
  64. Chen, Y.; Palta, J.; Prasad, P.V.V.; Siddique, K.H.M. Phenotypic Variability in Bread Wheat Root Systems at the Early Vegetative Stage. BMC Plant Biol. 2020, 20, 185. [Google Scholar] [CrossRef]
  65. Rose, T.J.; Rose, M.T.; Pariasca-Tanaka, J.; Heuer, S.; Wissuwa, M. The Frustration with Utilization: Why Have Improvements in Internal Phosphorus Utilization Efficiency in Crops Remained so Elusive? Front. Plant Sci. 2011, 2, 73. [Google Scholar] [CrossRef]
  66. Salma Kosar, H.; Gill, M.A.; Aziz, T.; Tahir, M.A. Relative phosphorus utilization efficiency of wheat genotypes in hydroponics. Pak. J. Agric. Sci. 2003, 40, 28–32. [Google Scholar]
  67. Safdar, L.B.; Umer, M.J.; Almas, F.; Uddin, S.; Safdar, Q.T.A.; Blighe, K.; Quraishi, U.M. Identification of Genetic Factors Controlling Phosphorus Utilization Efficiency in Wheat by Genome-Wide Association Study with Principal Component Analysis. Gene 2021, 768, 145301. [Google Scholar] [CrossRef] [PubMed]
  68. Raju, B.R.; Narayanaswamy, B.R.; Mohankumar, M.V.; Sumanth, K.K.; Rajanna, M.P.; Mohanraju, B.; Udayakumar, M.; Sheshshayee, M.S. Root Traits and Cellular Level Tolerance Hold the Key in Maintaining Higher Spikelet Fertility of Rice under Water Limited Conditions. Funct. Plant Biol. 2014, 41, 930–939. [Google Scholar] [CrossRef] [PubMed]
  69. Kumar, B.; Abdel-Ghani, A.H.; Reyes-Matamoros, J.; Hochholdinger, F.; Lübberstedt, T. Genotypic Variation for Root Architecture Traits in Seedlings of Maize (Zea mays L.). Inbred Lines. Plant Breed. 2012, 131, 465–478. [Google Scholar] [CrossRef]
  70. Reddy, V.R.P.; Aski, M.S.; Mishra, G.P.; Dikshit, H.K.; Singh, A.; Pandey, R.; Singh, M.P.; Gayacharan; Ramtekey, V.; Priti; et al. Genetic variation for root architectural traits in response to phosphorus deficiency in mungbean at the seedling stage. PLoS ONE 2020, 15, e0221008. [Google Scholar] [CrossRef]
  71. Lin, Y.; Yi, X.; Tang, S.; Chen, W.; Wu, F.; Yang, X.; Jiang, X.; Shi, H.; Ma, J.; Chen, G.; et al. Dissection of Phenotypic and Genetic Variation of Drought-Related Traits in Diverse Chinese Wheat Landraces. Plant Genome 2019, 12, 190025. [Google Scholar] [CrossRef] [PubMed]
  72. Zobel, R.W.; Kinraide, T.B.; Baligar, V.C. Fine Root Diameters Can Change in Response to Changes in Nutrient Concentrations. Plant Soil 2007, 297, 243–254. [Google Scholar] [CrossRef]
  73. Yadav, R.K.; Gautam, S.; Palikhey, E.; Joshi, B.K.; Ghimire, K.H.; Gurung, R.; Adhikari, A.R.; Pudasaini, N.; Dhakal, R. Agro-Morphological Diversity of Nepalese Naked Barley Landraces. Agric. Food Secur. 2018, 7, 86. [Google Scholar] [CrossRef]
  74. Nagar, C.K.; Gayatri, G.; Sinha, S.K.; Venkatesh, K.; Mandal, P.K. Nitrogen stress induced changes in root system architecture (RSA) in diverse wheat (T. aestivum L.) Genotypes at Seedling Stage. Wheat Barley Res. 2018, 10, 93–101. [Google Scholar] [CrossRef]
  75. Gourley, C.J.P.; Allan, D.L.; Russelle, M.P. Plant nutrient efficiency: A comparison of definitions and suggested improvement. Plant Soil 1994, 158, 29–37. [Google Scholar] [CrossRef]
Figure 1. (a) Wheat plants grown in hydroponic system with optimum (500 μM P) and low (5 μM) P conditions. Root morphology under (b) optimum P and (c) low P conditions for genotype NP 172.
Agriculture 14 00447 g001
Figure 2. Box and whisker plots showing phenotypic variation under different phosphorus levels. (a) Total root length, (b) Total surface area, (c) Total root volume, (d) Average diameter, (e) Total root tips, (f) Root dry weight (g) Total biomass, (h) Shoot dry weight, and (i) Root mass ratio (root-to-shoot ratio), (j) Primary root length (PRL), (k) P concentration (P CON), (l) Total P uptake (TPU), (m) P efficiency ratio (PER), (n) P utilization efficiency (PUtE), (o) P uptake efficiency (PUpE), (p) Specific root length (SRL). Horizontal lines inside boxes, median; box hinges, first and third quartiles; whiskers, full range of the data; dots represent outliers.
Agriculture 14 00447 g002
Figure 3. Principal component (PC) analysis showing the contributions of 16 traits under (a) optimum P and (b) low P conditions. Arrows represent the direction of loading for each trait and color-coding shows their contribution to the percentage variation of the component.
Agriculture 14 00447 g003
Figure 4. Responses of P use-efficient and -inefficient genotypes to low and optimum P in terms of: (a) Total root length, (b) Total surface area, (c) Average diameter, (d) Total root volume, (e) Total root tips, (f) Root dry weight, (g) Total biomass, (h) Shoot dry weight, and (i) Root mass ratio. Bar plots represent mean values and bars indicate standard error.
Agriculture 14 00447 g004
Figure 5. Grouping of 204 wheat genotypes into four distinct clusters by agglomerative hierarchical cluster analysis using the relative values of 15 traits. Plants were grown under optimum and low P conditions. The details of the genotypes are mentioned in Table S2.
Agriculture 14 00447 g005
Figure 6. Root architectural adaptation mechanisms for P use efficiency based on the current study. [Note: upward green arrow indicates a positive response, curved brown arrow indicates a minor or no response, and downward red arrow indicates a negative response to the local P nutrient availability. OP, optimum phosphorus; LP, low phosphorus].
Agriculture 14 00447 g006
Table 1. Summary of ANOVA results (F-value), descriptive statistics, coefficient of variation, and heritability (h2) of root, biomass, and phosphorus index traits measured under two different P treatment conditions.
TraitP LevelGenotypeP LevelGenotype × P LevelStd. DeviationMeanMinimumMaximumCV (%)Heritability (h2)
TRLOP5.219 ***306.6 ***20.32 ***33.81207.8133.6335.133.80.71
LP69.45271.2129.2474.835.7
TSAOP5.033 ***118.7 ***13.21 ***2.4120.9815.6126.911.50.68
LP4.2322.8113.2831.918.5
AVDOP16.96 ***43.29 ***12.04 ***0.0450.340.240.4313.20.91
LP0.0630.330.220.5119.5
RVLOP12.17 ***69.7 ***2.297 ***0.0650.200.090.3733.00.88
LP0.0780.230.090.4534.3
TIPOP5.58 ***185.7 ***9.252 *** 111.2347.0143.2691.032.10.73
LP211.5460.552.5914.837.9
RDWOP11.02 ***39.6 ***5.30 ***0.020.050.0170.1137.30.86
LP0.0170.050.0190.0931.9
TBMOP8.881 ***316.2 ***5.362 ***0.1190.310.140.6138.70.87
LP0.0680.220.100.4130.7
SDWOP6.998 ***524.9 ***5.559 ***0.10.260.120.5038.30.85
LP0.0540.170.080.3131.9
RMROP1.143 ***3108 ***7.239 ***0.0260.150.100.2417.30.69
LP0.0370.240.140.3215.5
PRLOP12.103 ***3.526 NS4.637 ***5.1123.811.336.421.50.72
LP5.3923.511.634.823.1
P CONOP0.223 ***13797 ***29.69 ***1.539.356.2215.516.40.64
LP0.581.600.714.3631.2
TPUOP0.577 ***3550 ***11.05 ***1.022.811.165.4136.40.70
LP0.1190.710.231.2835.6
PEROP0.619 ***4354 ***42.29 ***0.0170.110.070.1616.20.78
LP0.2250.710.231.2928.6
PUtEOP1.989 ***1264 ***14.61 ***11.5933.461.0610.039.20.71
LP9.0416.672.8946.341.2
PUpEOP8.972 ***9157 ***6.755 ***14.7264.931.7104.922.70.81
LP2.786.702.9119.1041.1
SRLOP3.201 ***4.485 *5.91 ***2292.85220152010,29139.10.62
LP2054.65376211210,22432.3
TRL, Total root length; TSA, Total root surface area; AVD, Average diameter; TIP, Total root tips, RVL, Total root volume; PRL, Primary root length; RDW, Root dry weight; SDW, Shoot dry weight; TBM, Total biomass; RMR, Root mass ratio; P CON, Tissue P concentration; TPU, Total P uptake, PER, P efficiency ratio; PUtE, Phosphorus utilization efficiency; PUpE, P uptake efficiency; SRL, Specific root length, CV(%), coefficient of variation; OP, optimum P; LP, low P. *** significance at 0.0001; * significance at 0.01; NS, non-significant.
Table 2. The Shannon–Weaver diversity index (H’) and performance categories under optimum (OP) and low (LP) phosphorus conditions.
TraitsTreatmentPerformance of All 204 Wheat Genotypes
LowMediumHighH′
TRLOP197590.73
LP1676110.73
TSAOP2165170.81
LP2863120.80
AVDOP978160.71
LP1064290.79
RVLOP1869160.78
LP118570.64
TIPOP584140.64
LP2864110.79
RDWOP1676110.73
LP2072110.75
TBMOP1676110.73
LP2667100.78
SDWOP1577110.72
LP2667100.78
RMROP586120.62
LP1364260.80
PRLOP1280110.69
LP2858170.84
P CONOP1070230.76
LP69250.55
TPUOP1281100.68
LP98860.60
PEROP2369110.77
LP786100.63
PUtEOP1971130.76
LP1083100.66
PUpEOP980140.68
LP69340.38
SRLOP1278130.59
LP207490.60
Table 3. Principal component analysis and identification of most contributing traits to P use efficiency in wheat seedlings grown under low and optimum P treatments.
TraitsOptimum PLow P
PC1PC2PC1PC2
TRL0.100.380.260.20
TSA0.030.440.160.34
AVD0.310.010.320.08
RVL0.16−0.360.15−0.41
TIP−0.050.35−0.070.46
RDW0.37−0.050.300.19
TBM0.360.010.320.16
SDW0.350.020.320.15
RMR0.17−0.17−0.020.04
PRL−0.010.47−0.010.43
PCON−0.18−0.25−0.340.17
TPU0.30−0.10−0.110.33
PER0.180.250.35−0.14
PUtE0.360.070.37−0.01
PUpE−0.25−0.09−0.310.15
SRL−0.330.130.030.08
Variation proportion
Standard deviation2.71.732.531.83
Variance percent43.718.840.021.0
Cumulative variant %43.762.540.061.0
Most contributing traitsTRL, TSA, AVD, RVL, TIP, RDW, TBM, SDW, PRL, PUtE, SRLTSA, AVD, RVL, TIP, TBM, SDW, PRL, P CON, TPU, PER, PUtE, PUpE
For each trait, the large variable loading score appears in bold; OP, optimum P; LP, low P.
Table 4. P use-efficient and P use-inefficient wheat accessions (11 each) based on their responses to optimum P and low P treatments.
S.No.P Use-Efficient GenotypesP Use-Inefficient Genotypes
1SHANGHAIHS 365
2Pavon F76WH760
3BWL 5233IEPERA RAFE
4SONALIKAIC 212185
5KHARCHIA LOCAL NIA 845
6WH 102K 9465
7BWL 4425MACS 2496
8HD 2888.2IC 335732
9CBW 12IC 118737
10MN75136/PGOHB 490
11KRL 19BWL 0814
Disclaimer/Publisher’s Note: The statements, opinions and data contained in all publications are solely those of the individual author(s) and contributor(s) and not of MDPI and/or the editor(s). MDPI and/or the editor(s) disclaim responsibility for any injury to people or property resulting from any ideas, methods, instructions or products referred to in the content.

