Article

An Agronomic Efficiency Analysis of Winter Wheat at Different Sowing Strategies and Nitrogen Fertilizer Rates: A Case Study in Northeastern Poland

by
Krzysztof Lachutta
and
Krzysztof Józef Jankowski
*
Department of Agrotechnology and Agribusiness, Faculty of Agriculture and Forestry, University of Warmia and Mazury in Olsztyn, Oczapowskiego 8, 10-719 Olsztyn, Poland
*
Author to whom correspondence should be addressed.
Agriculture 2024, 14(3), 442; https://doi.org/10.3390/agriculture14030442
Submission received: 27 January 2024 / Revised: 22 February 2024 / Accepted: 7 March 2024 / Published: 8 March 2024
(This article belongs to the Special Issue Research on Technologies for Achieving High-Yield Wheat)

Abstract

:
This study was undertaken to examine the influence of the sowing date, sowing density, and split spring application of nitrogen (N) fertilizer on plant density, tillering, yield components, and grain yields of winter wheat (Triticum aestivum L.) grown in northeastern Poland between 2018 and 2021. The experiment had a split-plot design with three sowing dates (early (3–6 September), delayed by 14 days, and delayed by 28 days), three sowing densities (200, 300, and 400 live grains m−2), and three split spring N rates (40 + 100, 70 + 70, and 100 + 40 kg ha−1 applied in BBCH stages 22–25 and 30–31, respectively). The number of spikes m−2 increased by 11% on average when winter wheat was sown with a delay of 14 days (17–20 September) and 28 days (1–4 October). The number of spikes m−2 was highest when winter wheat was sown at 300 and 400 live grains m−2. The application of 100 + 40 kg N ha−1 (BBCH 22–25 and 30–31, respectively) increased the number of spikes m−2. An increase in sowing density from 200 to 300 to 400 live grains m−2 decreased the number of grains spike−1 by 5% and 7%, respectively. Thousand grain weight (TGW) increased by 1% and 2% when sowing was delayed by 14 (17–20 September) and 28 days (1–4 October), respectively. In northeastern Poland, grain yields peaked when winter wheat was sown between 17 September and 4 October (10.52–10.58 Mg ha−1). In late-sown winter wheat, grain yields increased due to a higher number of spikes m−2 and higher grain weight. The highest sowing density (400 live grains m−2) induced a greater increase in grain yields than the lowest sowing density (200 live grains m−2) (10.25 vs.10.02 Mg ha−1). In winter wheat sown at a density of 400 live grains m−2, the increase in grain yields resulted in a higher number of spikes m−2. Grain yields peaked in response to 100 kg N ha−1 applied in BBCH stages 22–25 and 40 kg N ha−1 applied in BBCH stages 30–31 (this split N rate increased the number of spikes m−2). In turn, the highest straw yield (6.23 Mg ha−1) was obtained when the second split of N fertilizer was applied in BBCH stages 30–31 (40 + 100 kg N ha−1). Straw yields decreased significantly (by 6%) when winter wheat was sown late (early October). Delayed sowing (mid-September and early October) increased the harvest index (HI) of winter wheat by 5–7%. Split spring N application influenced grain and straw yields, but it had no effect on the HI of winter wheat.

1. Introduction

In the European Union (EU), the contribution of agriculture to the gross domestic product (GDP), one of the indicators of economic well-being, is generally low (approx. 1–2%) [1,2]. However, the role of agriculture is not to stimulate the economic growth of countries/regions, but to guarantee food security and, increasingly often, energy security [1,3,4,5]. It should also be noted that alternative scenarios for the use of agricultural raw materials (energy, chemicals, etc.) are possible, provided that non-competitive models of economic cooperation are introduced in production and processing [6,7,8]. Recent events clearly indicate that strategic food reserves should be produced locally. In countries that rely heavily on food imports, any disruptions in the supply chain (pandemics, military conflicts) can limit the availability and affordability of food and undermine the biological survival of nations [9,10,11]. Cereals play a particularly important role in catering to the global food demand. The share of cereals in the human diet (based on energy equivalents) ranges from 30% to 80% [12]. Cereals occupy around 51% of arable land in the world [13]. The current increase in global cereal production caters solely to the needs of the world’s growing population, and it does significantly affect production volume per capita, which has remained stable at around 380 kg for many years [13]. Wheat, in particular common wheat (Triticum aestivum L.), occupies more land than any other food crop. In 2021, wheat was grown on 220 million ha, with a mean yield of 3.4 Mg ha−1 [13]. The global population is projected to increase to 9.7 billion by 2050, and so the significance of wheat as a strategic crop for global food security will continue to grow [14,15,16]. The expected increase in the supply of wheat grain can be achieved mainly through an improvement in yields [17,18,19]. A further increase in the area under wheat cultivation is unlikely because agricultural expansion has adverse environmental and social consequences (closure of small farms, community displacement, and decreased availability of land for non-agricultural use) [20,21].
Wheat yields could be increased by introducing new, high-yielding cultivars and developing production technologies that maximize nitrogen-use efficiency (NUE) [15,22]. Wheat genotypes that effectively utilize N offer a sustainable approach to meeting the growing global demand for grain [15].
Nearly 30% of global nitrogen (N) fertilizer is used in wheat production [23]. Nitrogen significantly increases yields, but excessive N fertilization has negative consequences, such as high soil acidity, greenhouse gas emissions, and water pollution [24,25,26]. Inadequate N management not only decreases wheat yields, but it can also contribute to the loss of N due to leaching, surface erosion, volatilization, and denitrification [27,28,29]. Higher N rates lead to a decrease in NUE [26,30,31,32]; therefore, N rates should be balanced with NUE to promote the sustainable development of global crop production and minimize the consequences of climate change [24,33].
Soil N levels are generally sufficient to promote the growth of winter wheat in fall and winter, but rapid plant growth in spring may lead to N deficiency [34]. In Europe, N fertilizer is applied in three splits during the spring growth of winter wheat [35,36,37,38]. The first split of N fertilizer is applied at the beginning of spring growth, which, in properly managed stands, corresponds to the tillering stage (BBCH 22–25, Biologische Bundesanstalt, Bundessortenamt und Chemische Industrie [39]) [40]. In this stage of rapid plant growth, an adequate supply of N increases the NUE of winter wheat [41]. The first spring rate of N stimulates the development of side shoots and, consequently, increases the number of spikes, which are the main yield component. The first N rate should be selected based on the overwintering success of wheat stands. Stands that produced numerous shoots in fall and did not sustain losses in winter should not be supplied with very high N rates in early spring. Excess supply of N in spring can damage emerging shoots, and increased competition between tillers will inhibit the development of the root system [42]. In turn, winter wheat stands with sparse tillers require higher N rates in early spring [43]. The second application of N in the stem elongation stage (BBCH 30–32) regulates the development of side shoots, prevents a decrease in the number of spikelets and the number of grains per spike, and prolongs green area duration. Excess N supply in this period can lead to the rapid growth of above-ground biomass and tillers, which can contribute to lodging [43]. In many European regions, a third application of N in spring (BBCH 37–51) is required in the production of winter wheat for human consumption [34,35]. The third application of N enhances the quality of winter wheat by increasing the protein and gluten content of grain, but it has a minor effect on grain yield [43]. In a study by Podolska [44], the total N rate of 120 kg ha−1 applied in two splits of 60 kg N ha−1 each (spring emergence and beginning of stem elongation) induced a greater increase in yields than the same N rate divided into three portions of 40 kg N ha−1 each (spring emergence, beginning of stem elongation, and heading). In turn, in the work of Barad et al. [45], yields were higher when winter wheat was supplied with 40 kg N ha−1 in the tillering stage and 80 kg N ha−1 at the beginning of stem elongation than with three equal splits of 60 kg N ha−1 each. The observed difference in grain yields resulted from a 14% increase in the number of spikes m−2, a 12% increase in the number of grains spike−1, and a 12% increase in TGW). According to Fageria et al. [46], in the early stages of plant growth, weakly developed roots are unable to effectively absorb large amounts of N.
Winter wheat yields and NUE are also influenced by the remaining agronomic practices, in particular sowing date [47,48] and sowing density [49]. Global climate change has prolonged the growth of winter wheat in fall, which prompts farmers to delay the sowing date [50,51,52]. However, delayed sowing can compromise N uptake in plants and decrease NUE [48], uptake efficiency (UPE), and utilization efficiency (UTE) [53].
Sowing density is a critical determinant of wheat grain yield because it optimizes the number of spikes m−2 [54,55,56]. Plant density that is too low can compromise nutrient use efficiency, including NUE, thus decreasing grain yields [56,57,58]. In turn, too high sowing density can increase production costs and decrease yields due to a higher risk of disease, pest infestation, and lodging [59,60]. The optimal density of winter wheat stands at harvest is 550–650 spikes m−2, which guarantees high yields in Poland and can be achieved through both low sowing density (promoting productive tillering) and high sowing density (limiting tillering). In the first case, winter wheat is sown at 200–300 live grains m−2 to obtain 2–3 productive shoots per plant and maximize yields. However, the performance of low-density stands is highly dependent on environmental conditions (soil, weather, fertilizer rate, etc.). Under unfavorable conditions (light soil, dry year, low fertilizer rate, etc.), grain yields are highly likely to decrease in low-density stands [43]. The yield components of wheat effectively adapt to changes in environmental conditions [57,59]. However, these compensatory mechanisms differ across wheat genotypes [59,61]. In low-density stands that do not fully utilize the productive potential of a given site, the number of side shoots can increase to compensate for the absence of plants and to produce more spikes [62]. In turn, higher sowing densities can directly increase the number of spikes per unit area, but also decrease the weight and number of grains per spike [59,61]. Wheat seeding rates should be adjusted to optimize NUE [49,63,64]. In a study by Gao et al. [65], an increase in seeding rate from 180 kg ha−1 to 220 kg ha−1 increased the NUE by 17% on average. This observation indicates that higher sowing density can enhance N uptake when its supply is limited. According to Dai et al. [64], N uptake from deep soil layers can be improved by decreasing the N rate and increasing the sowing density.
The aim of this study was to determine the effect of sowing date, sowing density, and the split spring application of N fertilizer on the yield components (spikes m−2, grains spike−1, TGW) and yields of winter wheat (grain yield, straw yield, harvest index—HI) grown in northeastern Poland.

2. Materials and Methods

2.1. Field Experiment

Winter wheat (Triticum aestivum L.) was grown in a small-area field experiment conducted in the Agricultural Experiment Station (AES) in Bałcyny (53°35′46.4″ N, 19°51′19.5″ E, elevation 137 m, in NE Poland) between 2018 and 2021. The AES is part of the University of Warmia and Mazury in Olsztyn. The experimental variables were (i) sowing date: early (6 September 2018; 5 September 2019; 3 September 2020), delayed by 14 days (17–20 September), and delayed by 28 days (1–4 October); and (ii) sowing density: 200, 300, and 400 live grains m−2; (iii) split spring application of N at BBCH 22–25 + BBCH 30–31: 40 + 100, 70 + 70, and 100 + 40 kg ha−1.
The experiment had a split-plot with three replications. The plot size was 15 m2 (10 by 1.5 m). The preceding crop was winter oilseed rape (Brassica napus L.). After the preceding crop was harvested (late July) in each year of the experiment, the field was skimmed to a depth of 6–8 cm and fertilized with 20 kg N ha−1 (urea, 46% N), 17.4 kg P ha−1 (enriched superphosphate, 17.4% P), and 41.5 kg K ha−1 (potash salt, 49.8% K). The field was harrowed once (with a light-duty disc harrow) to incorporate the fertilizers and control weeds. In late August, the field was plowed to a depth of 20–22 cm. A shallow tillage treatment was performed 4–5 days before sowing to level the soil. Winter wheat cv. Julius was sown to a depth of 3 cm with an inter-row spacing of 12.5 cm on the dates and at the densities described in the experimental design. Winter wheat was sown with a plot seeder (Promar SPZ-1.5, Poznań, Poland). Weeds were controlled with metribuzin (49 g ha−1), flufenacet (147 g ha−1), and diflufenican (100 g ha−1) in BBCH stages 11–12. The first and the second splits of N fertilizer (ammonium nitrate, 34%) were applied in spring in BBCH stages 22–25 and 30–31 in the amounts indicated in the experimental design. The third split of N fertilizer (40 kg ha−1; ammonium nitrate, 34%) was applied in BBCH stage 37 in all plots. In BBCH stage 31, trinexapac-ethyl was applied at 100 g ha−1 to regulate plant growth. During the spring growing season, an insecticide was applied once (5 g ha−1 deltamethrin, BBCH 51–52) and fungicides were applied three times: (i) 375 g ha−1 spiroxamine + 150 g ha−1 prothioconazole + 75 g ha−1 bixafen (BBCH 30–31); (ii) 75 g ha−1 benzovindiflupyr + 150 g ha−1 prothioconazole (BBCH 37–39); and (iii) 250 g ha−1 tebuconazole (BBCH 61). Winter wheat was harvested in late July or early August (BBCH 89) with a small-plot harvester (Wintersteiger Classic, type 1540–447, Ried im Innkreis, Austria).
The experiment was established on Haplic Luvisol originating from boulder clay [66]. Soil pH ranged from 6.2 to 6.4 (digital pH meter), and soil nutrient levels were determined in the range of 1.22–1.39% Corg (modified Kurmies method; UV-1201V spectrophotometer, Shimadzu Corporation, Kyoto, Japan), 74.6–128.9 mg kg−1 P (vanadium molybdate yellow colorimetric method; UV-1201V spectrophotometer, Shimadzu Corporation, Kyoto, Japan), 128.6–199.2 mg kg−1 K (atomic emission spectrometry; Flame Photometers, BWB Technologies Ltd., Newbury, UK), 32.6–49.4 mg kg−1 Mg (atomic absorption spectrophotometry; AAS1N, Carl Zeiss, Jena, Germany), and 1.0–1.86 mg kg−1  SO 4 2 (nephelometry method; UV-1201V spectrophotometer, Shimadzu Corporation, Kyoto, Japan). The chemical properties of soil were determined in the laboratory of the District Chemical–Agricultural Station in Olsztyn.

2.2. Parameters Determined in the Field

The number of plants per m2 was determined after emergence (BBCH 12–13) and in spring (BBCH 22–25) by counting plants ten times in each plot (four middle rows) on both sides of a 1 m band. In spring (BBCH 29), tillering was assessed by counting the number of shoots plant−1 in 80 randomly selected plants (8 × 10 plants) sampled from the four middle rows in each plot. The number of spikes was determined directly before harvest at five random locations in a plot with an area of 0.25 m2. The number of grains per spike was determined in 500 spikes randomly sampled from each plot (10 × 50 spikes). Thousand grain weight was determined in five samples of threshed grain (100 g each) from each plot. In each plot, grain and straw yields were determined by weighting directly after threshing. The dry matter (DM) content of grain and straw was determined directly after harvest by drying in an oven (FD 53 Binder GmbH, Tuttlingen, Germany) until constant weight (Equation (1)). Grain and straw yields in each plot were adjusted to 86% DM and expressed per 1 ha. The HI was calculated using Equation (2):
Moisture   content   ( % ) = Wet   sample   weight   ( g )   dry   sample   weight   ( g ) Wet   sample   weight   ( g ) ×   100
Harvest   index = Grain   yield   ( Mg   DM   ha 1 ) Grain   and   straw   yield   ( Mg   DM   ha 1 )

2.3. Statistical Analysis

Plant density, tillering, the number of spikes m−2, the number of grains spike−1, TGW, grain yield, straw yield, and HI were analyzed in a general linear mixed model using Statistica software [67]. Sowing date, sowing density, and the split spring N rate were the fixed effects, whereas years and replications were the random effects. Treatment means were compared in Tukey’s honest significant difference (HSD) test at a significance level of p ≤ 0.05. The results of the F-test for fixed effects in ANOVA are presented in Table 1.

3. Results

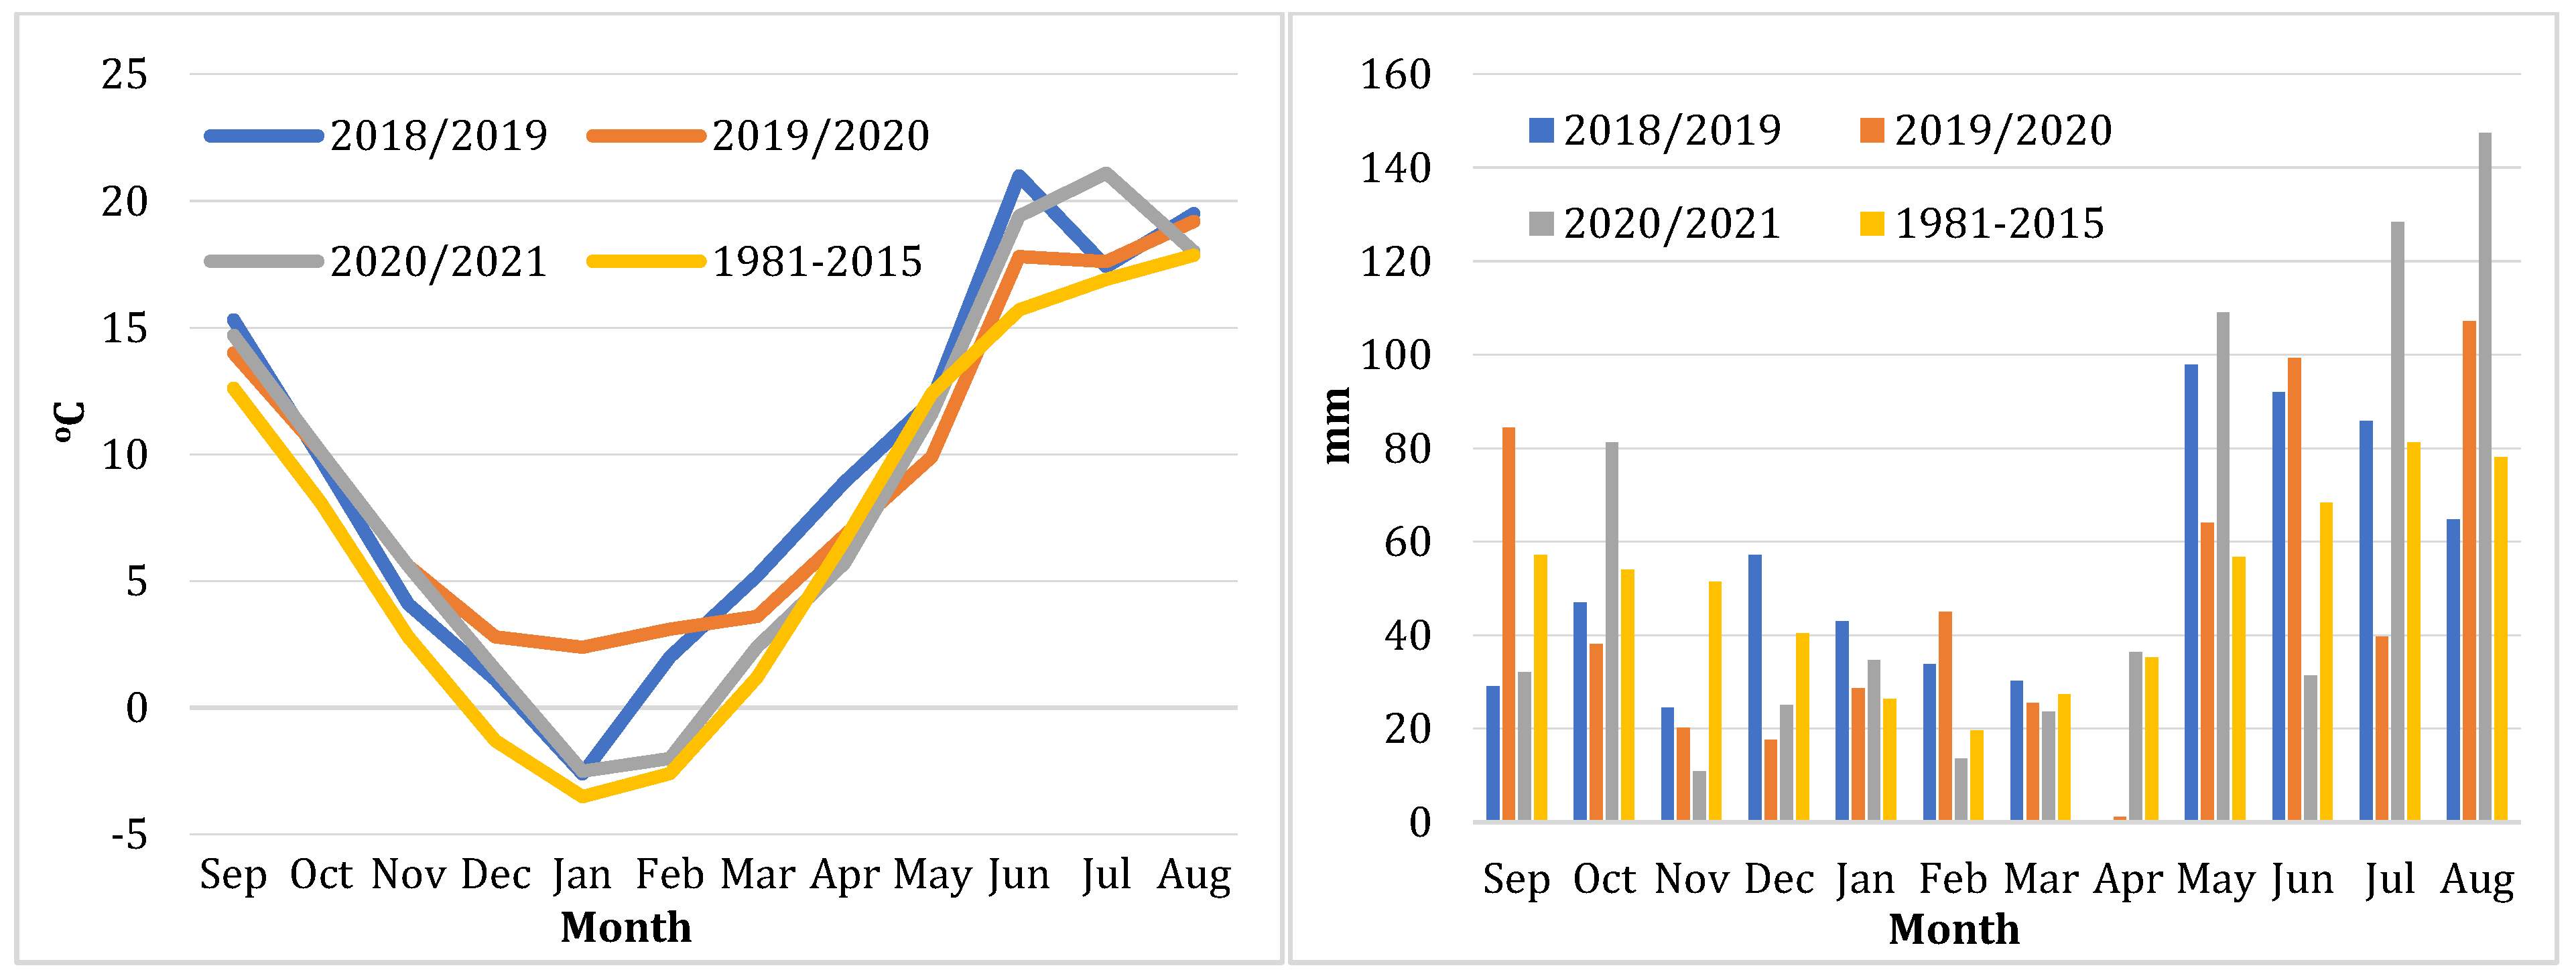
3.1. Weather Conditions

In all years of the experiment, the fall growing season (September–November) of winter wheat was characterized by low precipitation (61–82% of the long-term average for 1981–2015) and high mean daily temperatures (2.0 °C above the long-term average). During winter dormancy (December–March), mean daily temperatures exceeded the long-term average by 2.8 °C, while winter precipitation approximated the long-term average in all years of the study (Figure 1).
In all years of the experiment, mean daily temperatures approximated the long-term average in April and May but exceeded the long-term average in June–August. Precipitation levels in the spring growing seasons differed considerably over several years. In the first growing season (2018/2019), there was no rainfall in April, whereas precipitation levels in May, June, and July exceeded the long-term average by 72%, 35%, and 5%, respectively. In the second growing season (2019/2020), April was also an extremely dry month (1 mm), but heavy precipitation was noted in May and June (113% and 145% above the long-term average, respectively). In the third growing season (2020/2021), May, July, and August were characterized by abundant precipitation (192%, 156%, and 189% above the long-term average, respectively). Total rainfall during the growing season of winter wheat was determined at 605 mm in 2018/2019, 570 mm in 2019/2020, and 674 mm in 2020/2021. The long-term monthly average (1981–2015) in the study area was 596 mm.

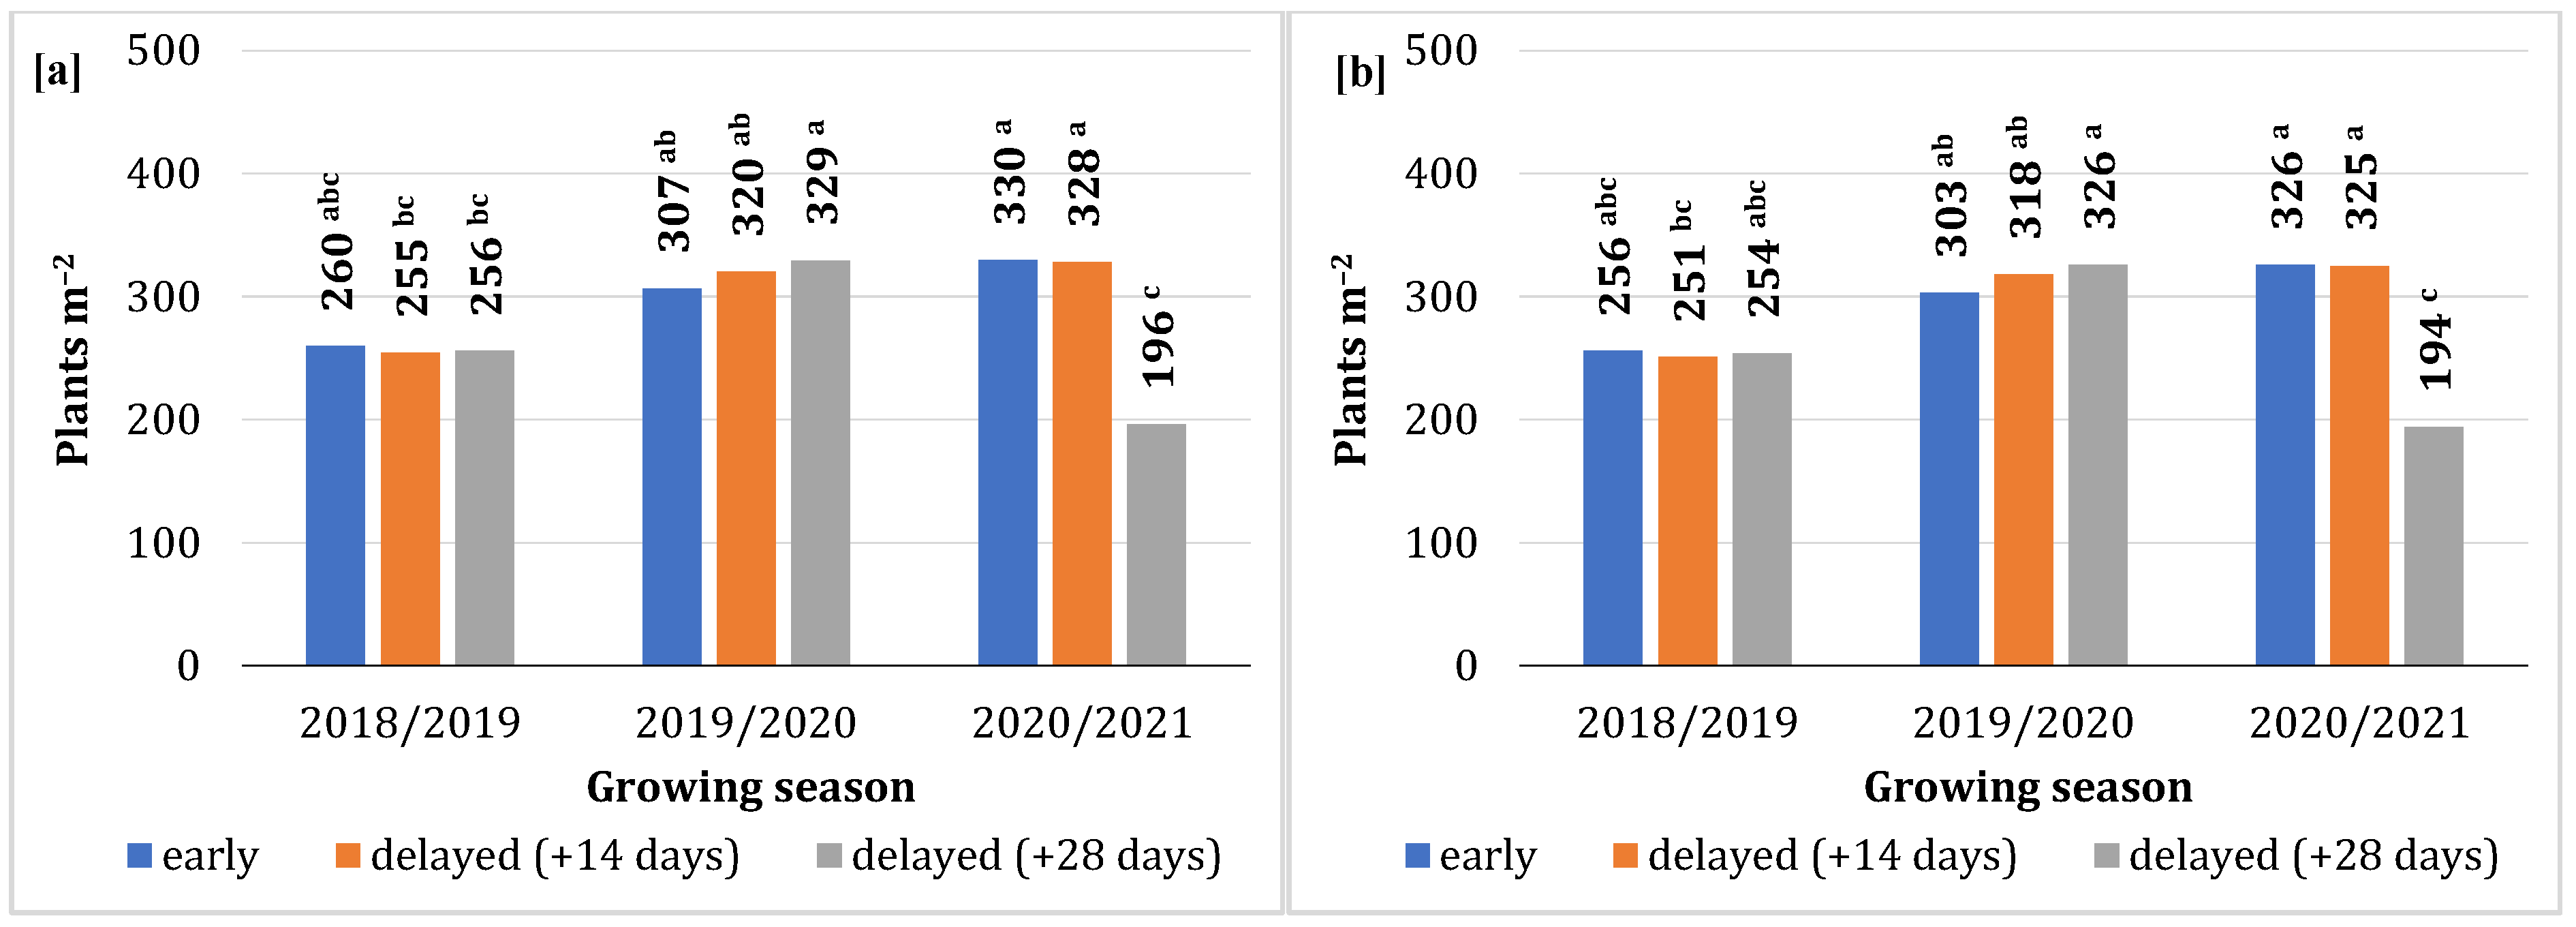
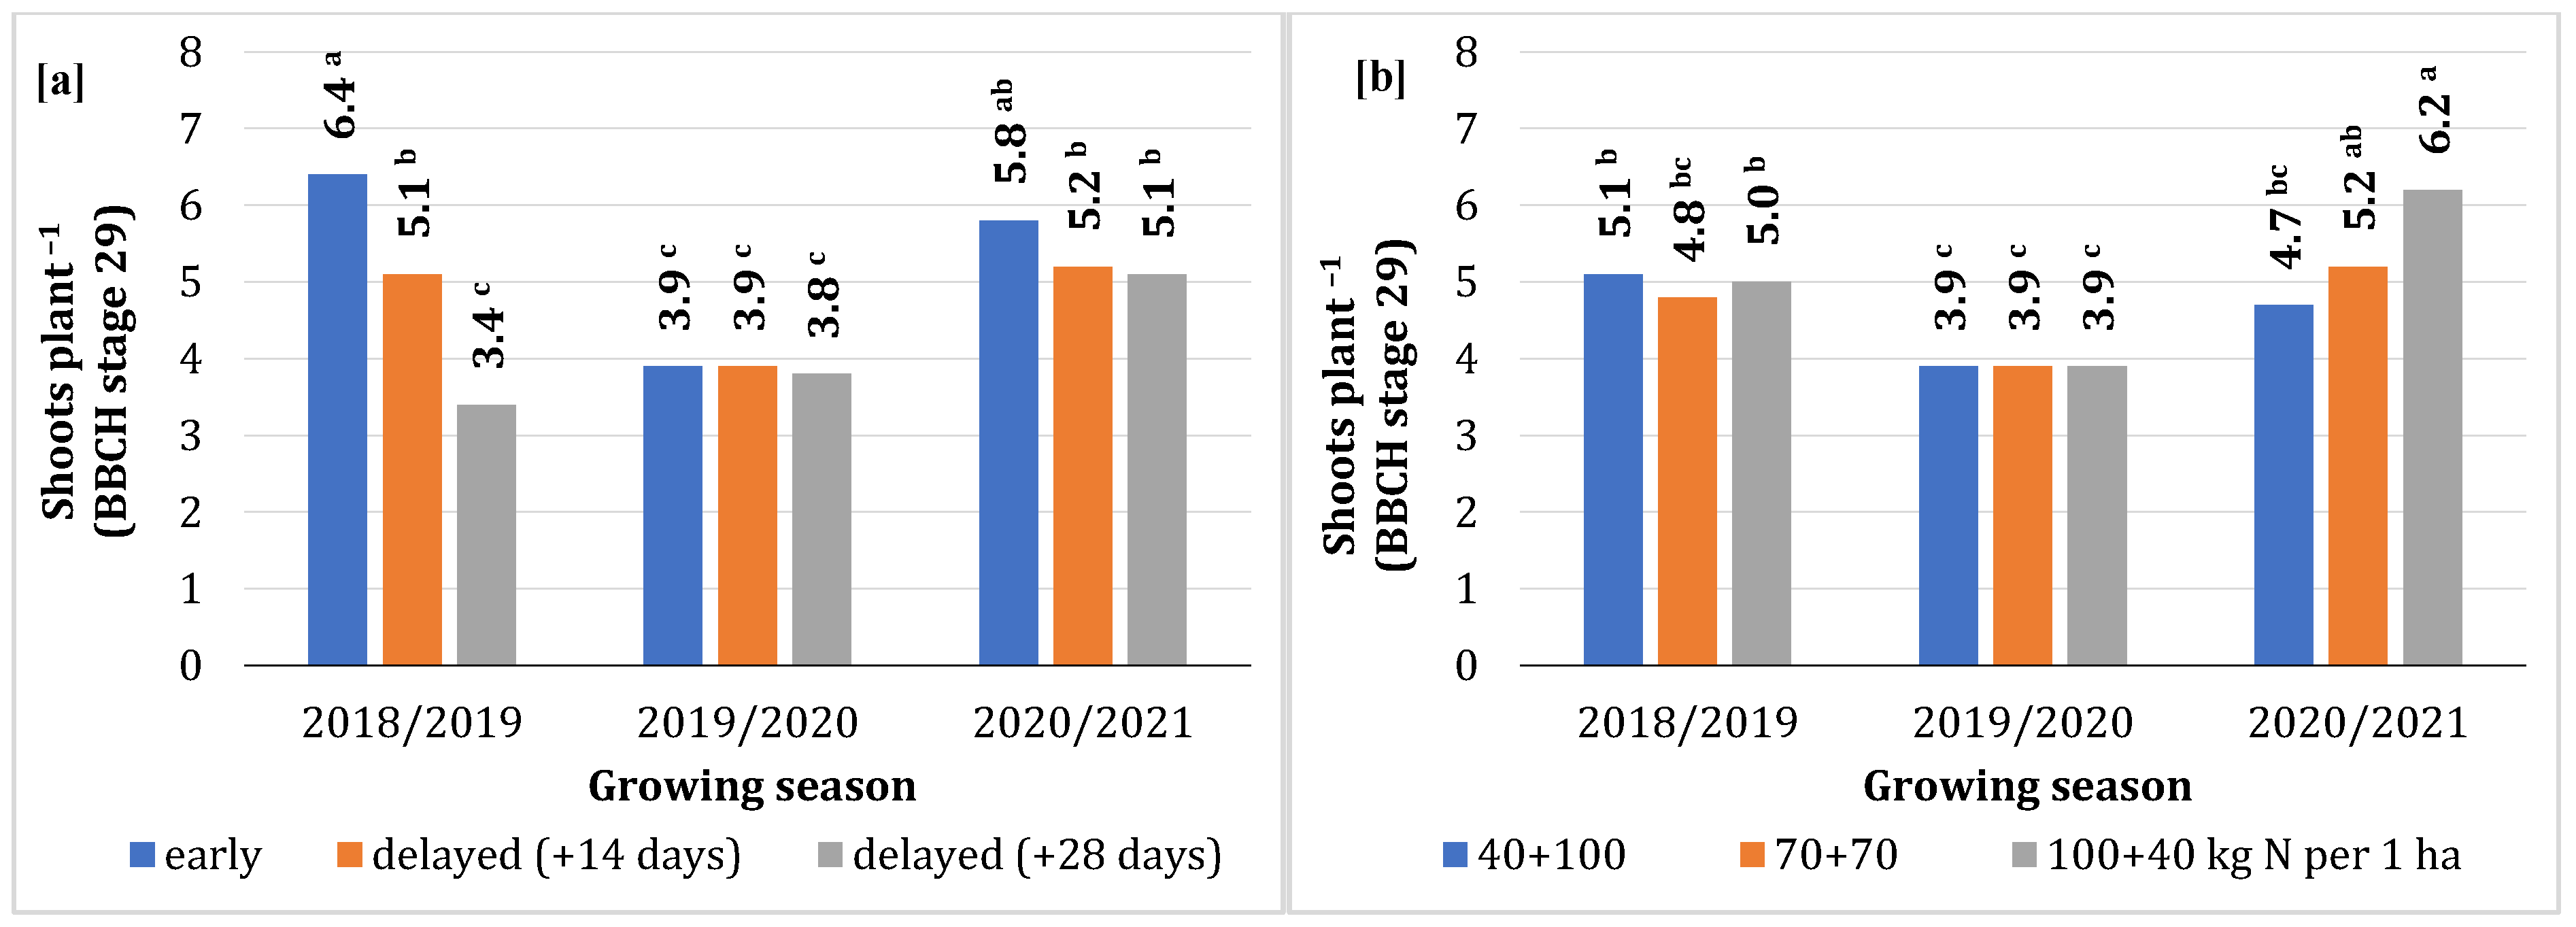
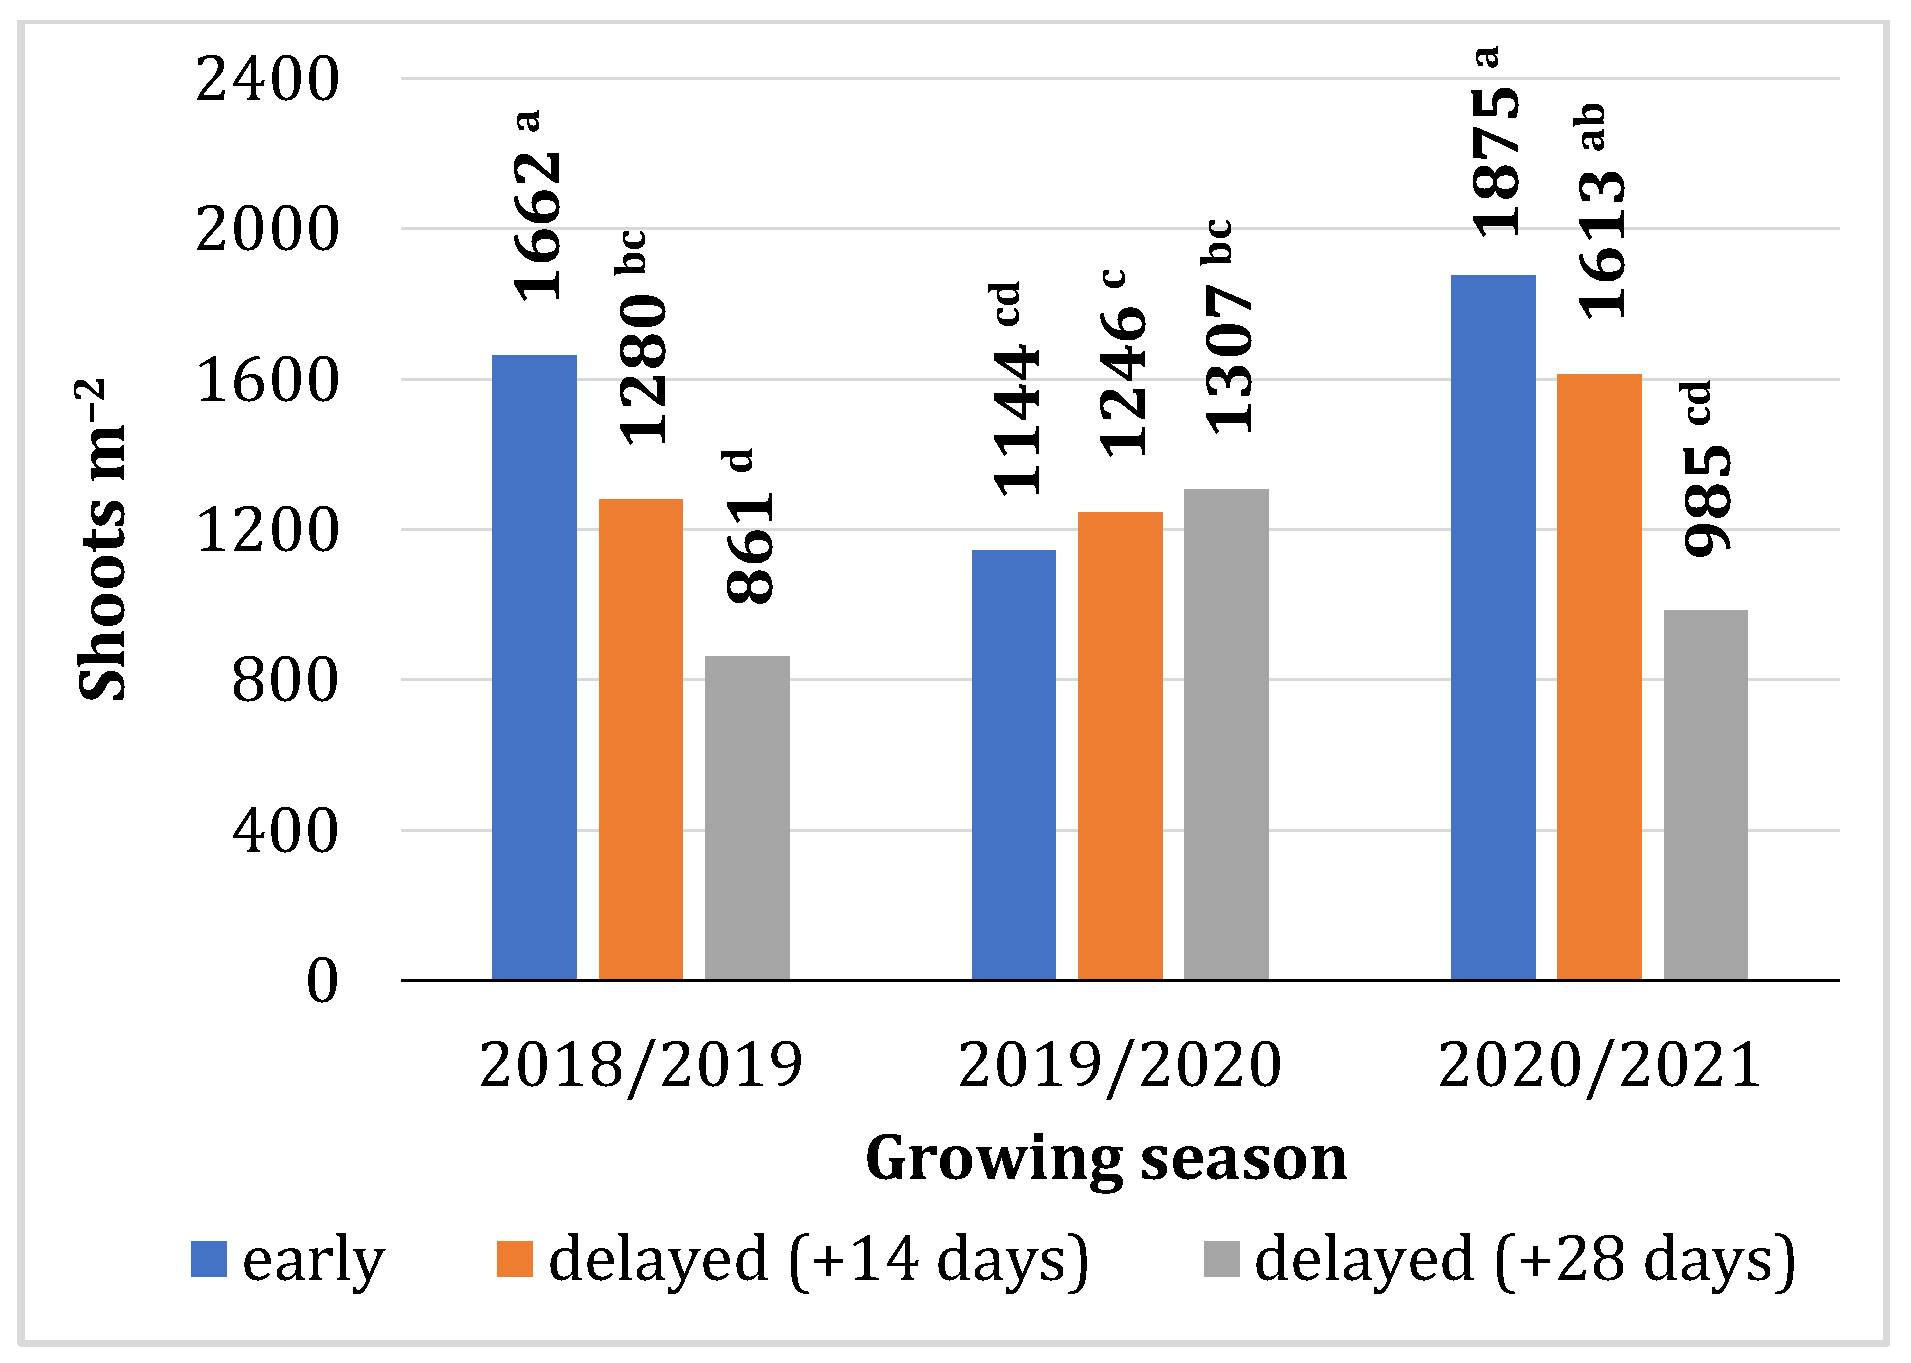
3.2. Plant Density and Tillering

After emergence, and in early spring, plant density was considerably differentiated by weather conditions, sowing date, and sowing density (Table 1). Favorable weather conditions in winter contributed to the high overwintering success rate of winter wheat plants (98–99%). Plant density after emergence and in early spring was highest in the second growing season. On average, plant density after emergence and in early spring was 15% lower in the first and third growing season. Delayed sowing (early October) decreased plant density in fall and spring by 13% relative to early sowing (September) (Table 2). Sowing delayed by 28 days induced a significant 40% decrease in plant density after emergence and in early spring in the third growing season (Figure 2). Higher sowing densities promoted a gradual increase in the number of plants after emergence and in early spring (Table 2), regardless of weather conditions (Table 1).
The number of shoots plant−1 and the number of shoots m−2 were significantly differentiated by all experimental factors (Table 1). The values of both parameters were highest in the third growing season (2020/2021). In plots where sowing was delayed by 14 and 28 days, the number of shoots plant−1 decreased by 13% and 24%, respectively, at the end of the tillering stage (BBCH 29) (Table 2). The number of shoots plant−1 was not only affected by the sowing date in the growing season of 2019/2020 (Figure 3a). An increase in sowing density from 200 to 400 live grains m−2 decreased the number of shoots plant−1 by 10% in BBCH stage 29. A decrease in the first spring rate of N (BBCH 22–25) from 100 to 40 kg ha−1 reduced the number of shoots plant−1 by 10% on average (Table 2). The strongest response to the first spring rate of N was observed in the third growing season, when 100 kg N ha−1 applied in BBCH stages 22–25 increased the number of shoots plant−1 by 32% (Figure 3b).
Delayed sowing also decreased the number of shoots m−2 in BBCH stage 29 (which was calculated by multiplying plant density by the number of shoots per plant) (Table 2). Winter wheat sown in early October produced 33% fewer shoots m−2 on average than wheat sown on the earliest date (3–6 September) (Table 2). The sowing date did not only affect the number of shoots m−2 in the growing season of 2019/2020. In the remaining seasons, the number of shoots m−2 decreased by 47–48% when sowing was delayed to early October (Figure 4). An increase in sowing density from 200 to 300 and 400 live grains m−2 increased the number of shoots m−2 by 38% and 78%, respectively. The number of shoots m−2 increased by 12% when the first spring rate of N (BBCH 22–25) was increased from 40 to 100 kg ha−1 (Table 2).

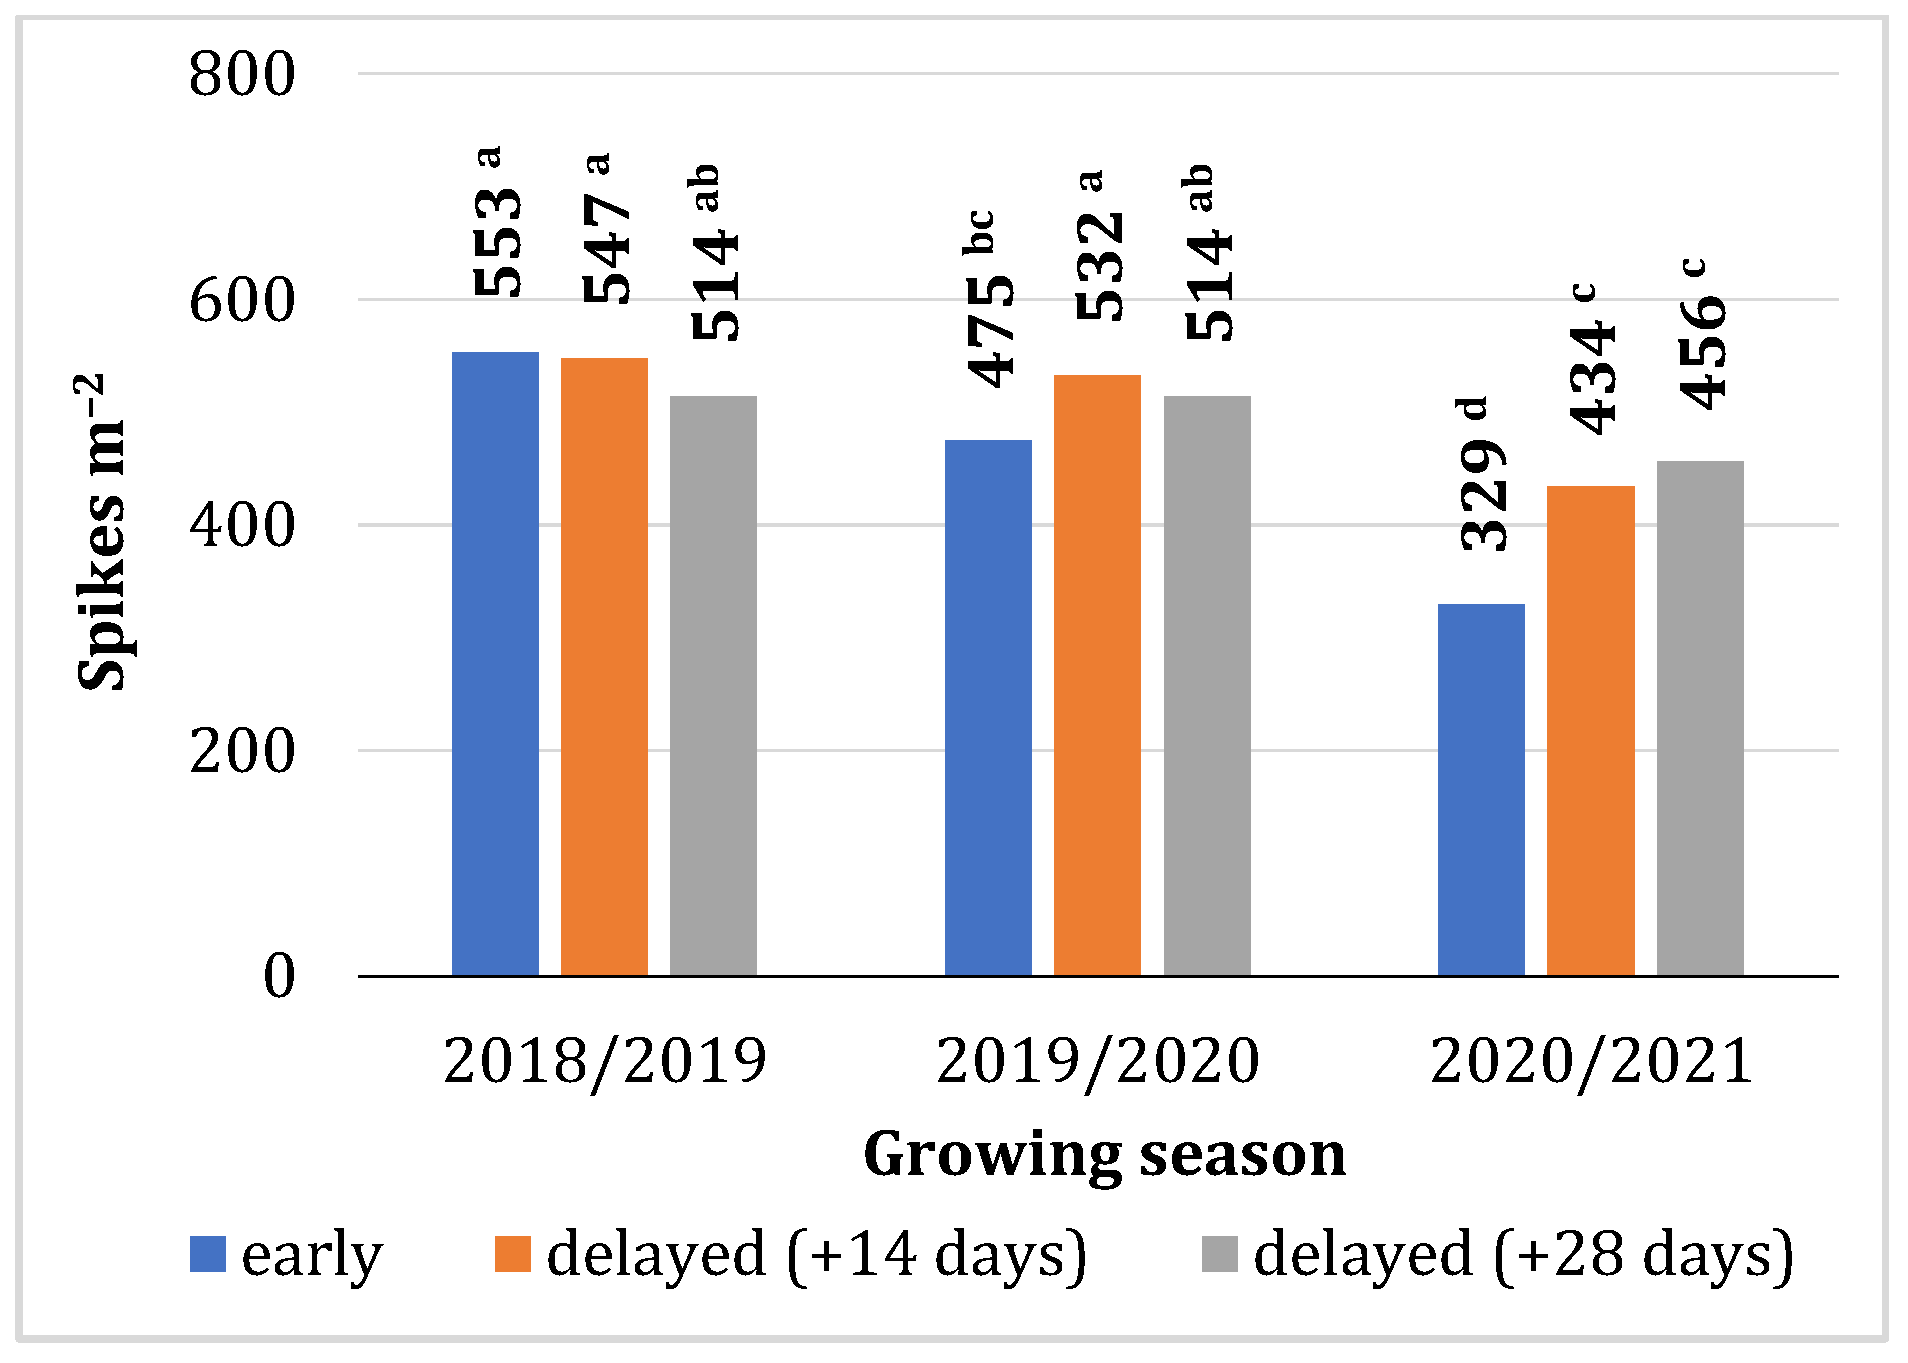
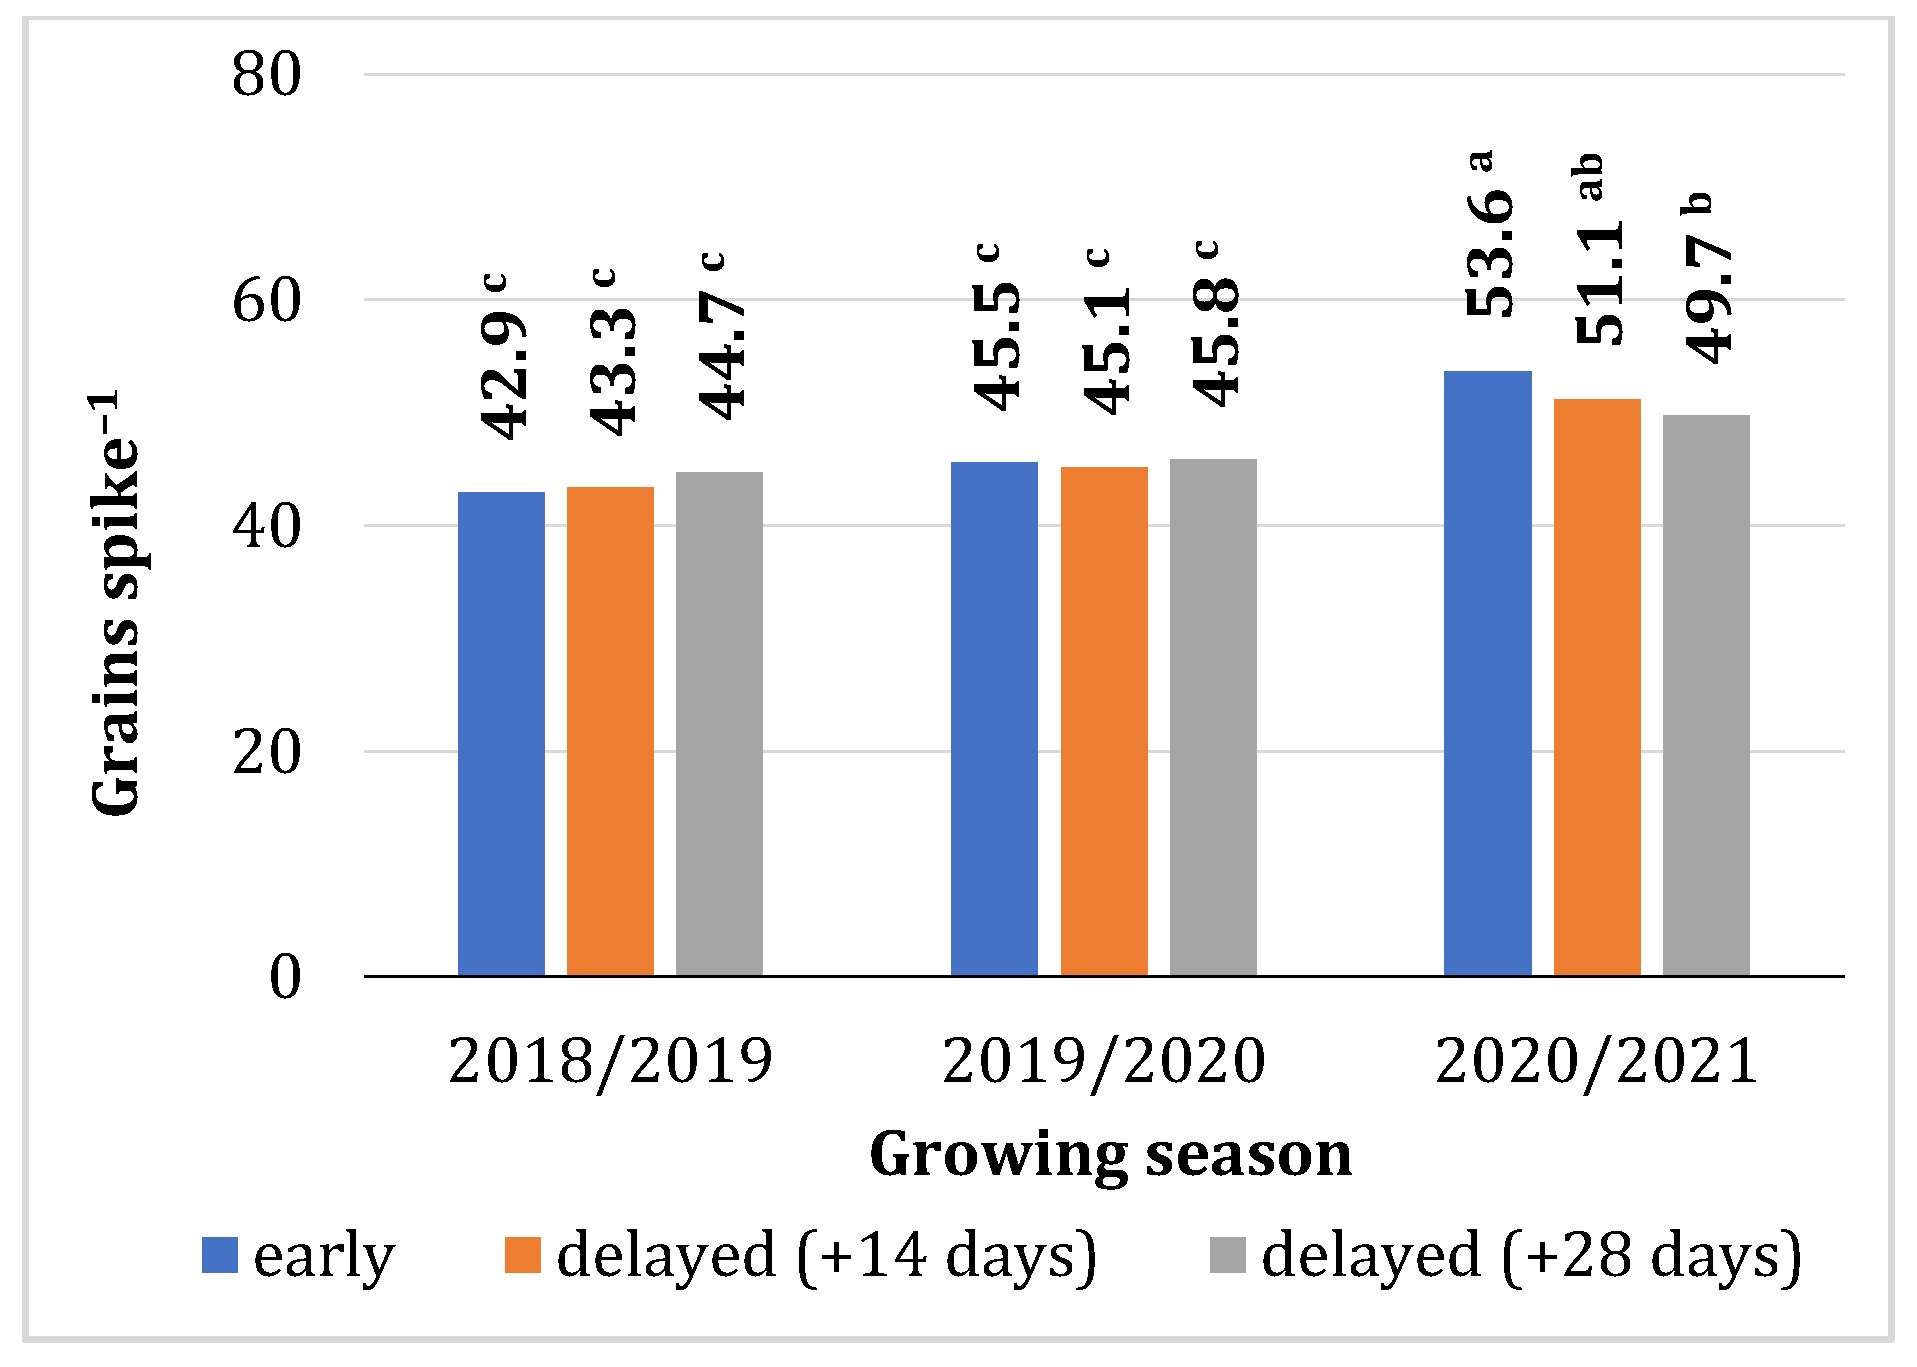
3.3. Yield Components

Winter wheat grown in northeastern Poland produced from 406 (2020/2021) to 538 (2018/2019) spikes m−2. The number of spikes m−2 was lowest in the third growing season, which was characterized by the highest number of shoots plant−1 (5.4) and shoots m−2 (1491). In the third growing season, the number of shoots was strongly reduced between the late tillering stage and the heading stage, which could be attributed to low precipitation in June (approx. 50% of the long-term average). In the remaining seasons, June precipitation exceeded the long-term average by 35–45%. In the dry month of June, strong competition for light in dense stands could have additionally contributed to the observed decrease in the number of shoots. The number of spikes m−2 increased by 11% on average when sowing was delayed by 14 (17–20 September) and 28 days (1–4 October) (Table 3). Sowing date did not affect the number of spikes m−2 only in the first growing season. In the remaining seasons, winter wheat stands sown in mid-September or in early October were characterized by the highest number of spikes m−2 (Figure 5). The number of spikes m−2 was also significantly differentiated by sowing density (Table 1). The value of this parameter was lowest when winter wheat was sown at a density of 200 live grains m−2. An increase in sowing density to 300 live grains m−2 led to a significant 8% increase in the number of spikes m−2. A further increase in sowing density (400 live grains m−2) did not induce significant changes in the number of spikes m−2. The application of 100 + 40 kg N ha−1 (BBCH 22–25 and 30–31, respectively) had a positive impact on the number of spikes m−2. The number of spikes m−2 decreased by 4% when the early spring rate of N was reduced to 40 kg ha−1 (40+100 kg N ha−1) (Table 3).
Winter wheat produced 43.7 and 51.5 grains spike−1 in the 2018/2019 and 2020/2021 seasons, respectively (Table 3). On average, the sowing date did not significantly influence the number of grains spike−1 (Table 1). The number of grains spike−1 only decreased in the third season, reducing by 7% when sowing was delayed by 28 days (early October) (Figure 6). An increase in sowing density from 200 to 300 to 400 live grains m−2 decreased the number of grains spike−1 by 5% and 7%, respectively (Table 3), regardless of weather conditions (Table 1). The split application of different N rates in spring had no significant influence on the number of grains spike−1 (Table 1).
The thousand grain weight was significantly influenced by weather conditions and sowing date (Table 1). The value of this parameter was highest in the second growing season (47.76 g). On average, TGW was 5% and 9% lower in the first and third growing season, respectively. Winter wheat sown in early September was characterized by the lowest TGW (44.95 g). Sowing delayed by 14 (17–20 September) and 28 days (1–4 October) increased TGW by 1% and 2%, respectively (Table 3).

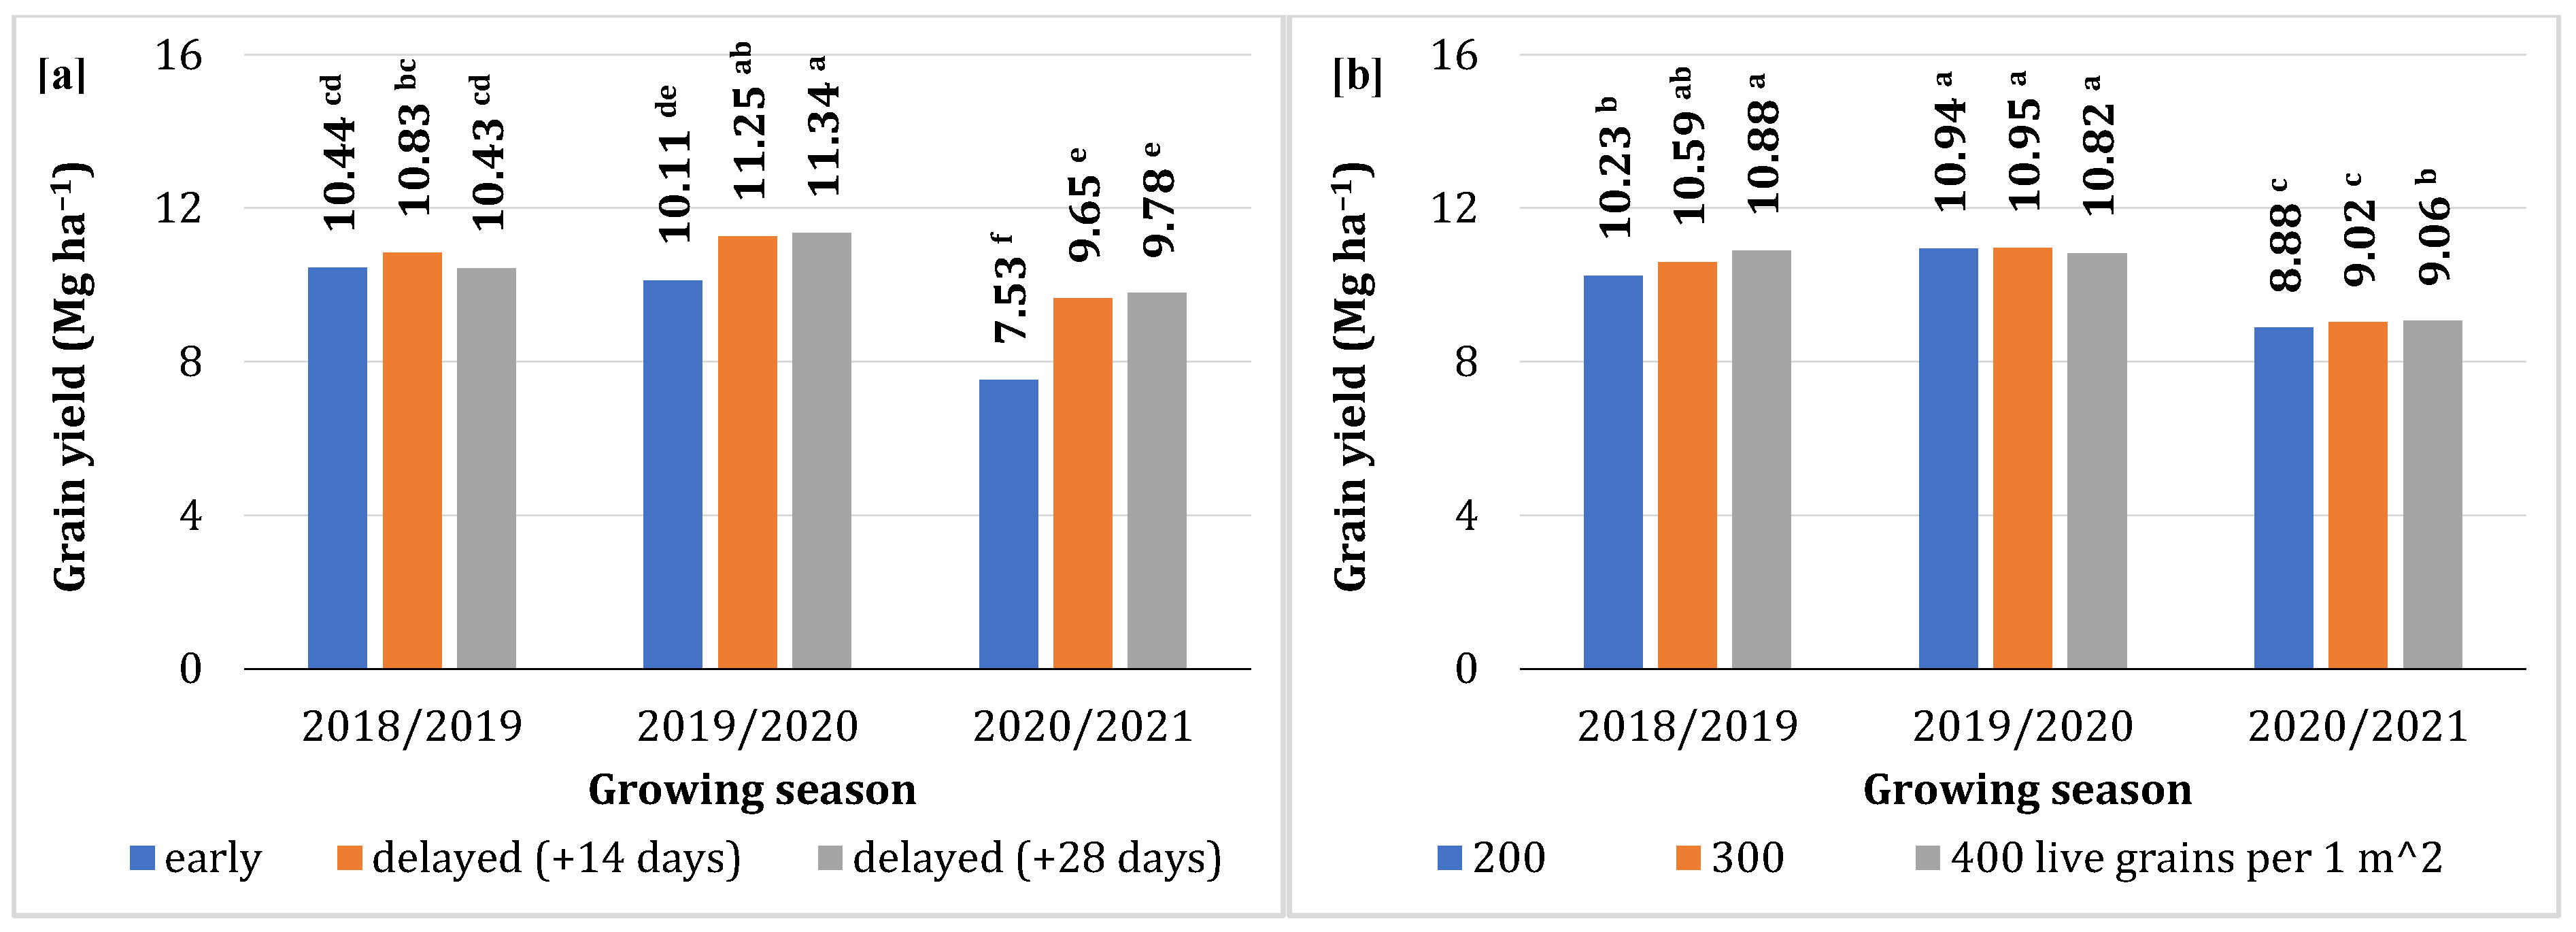
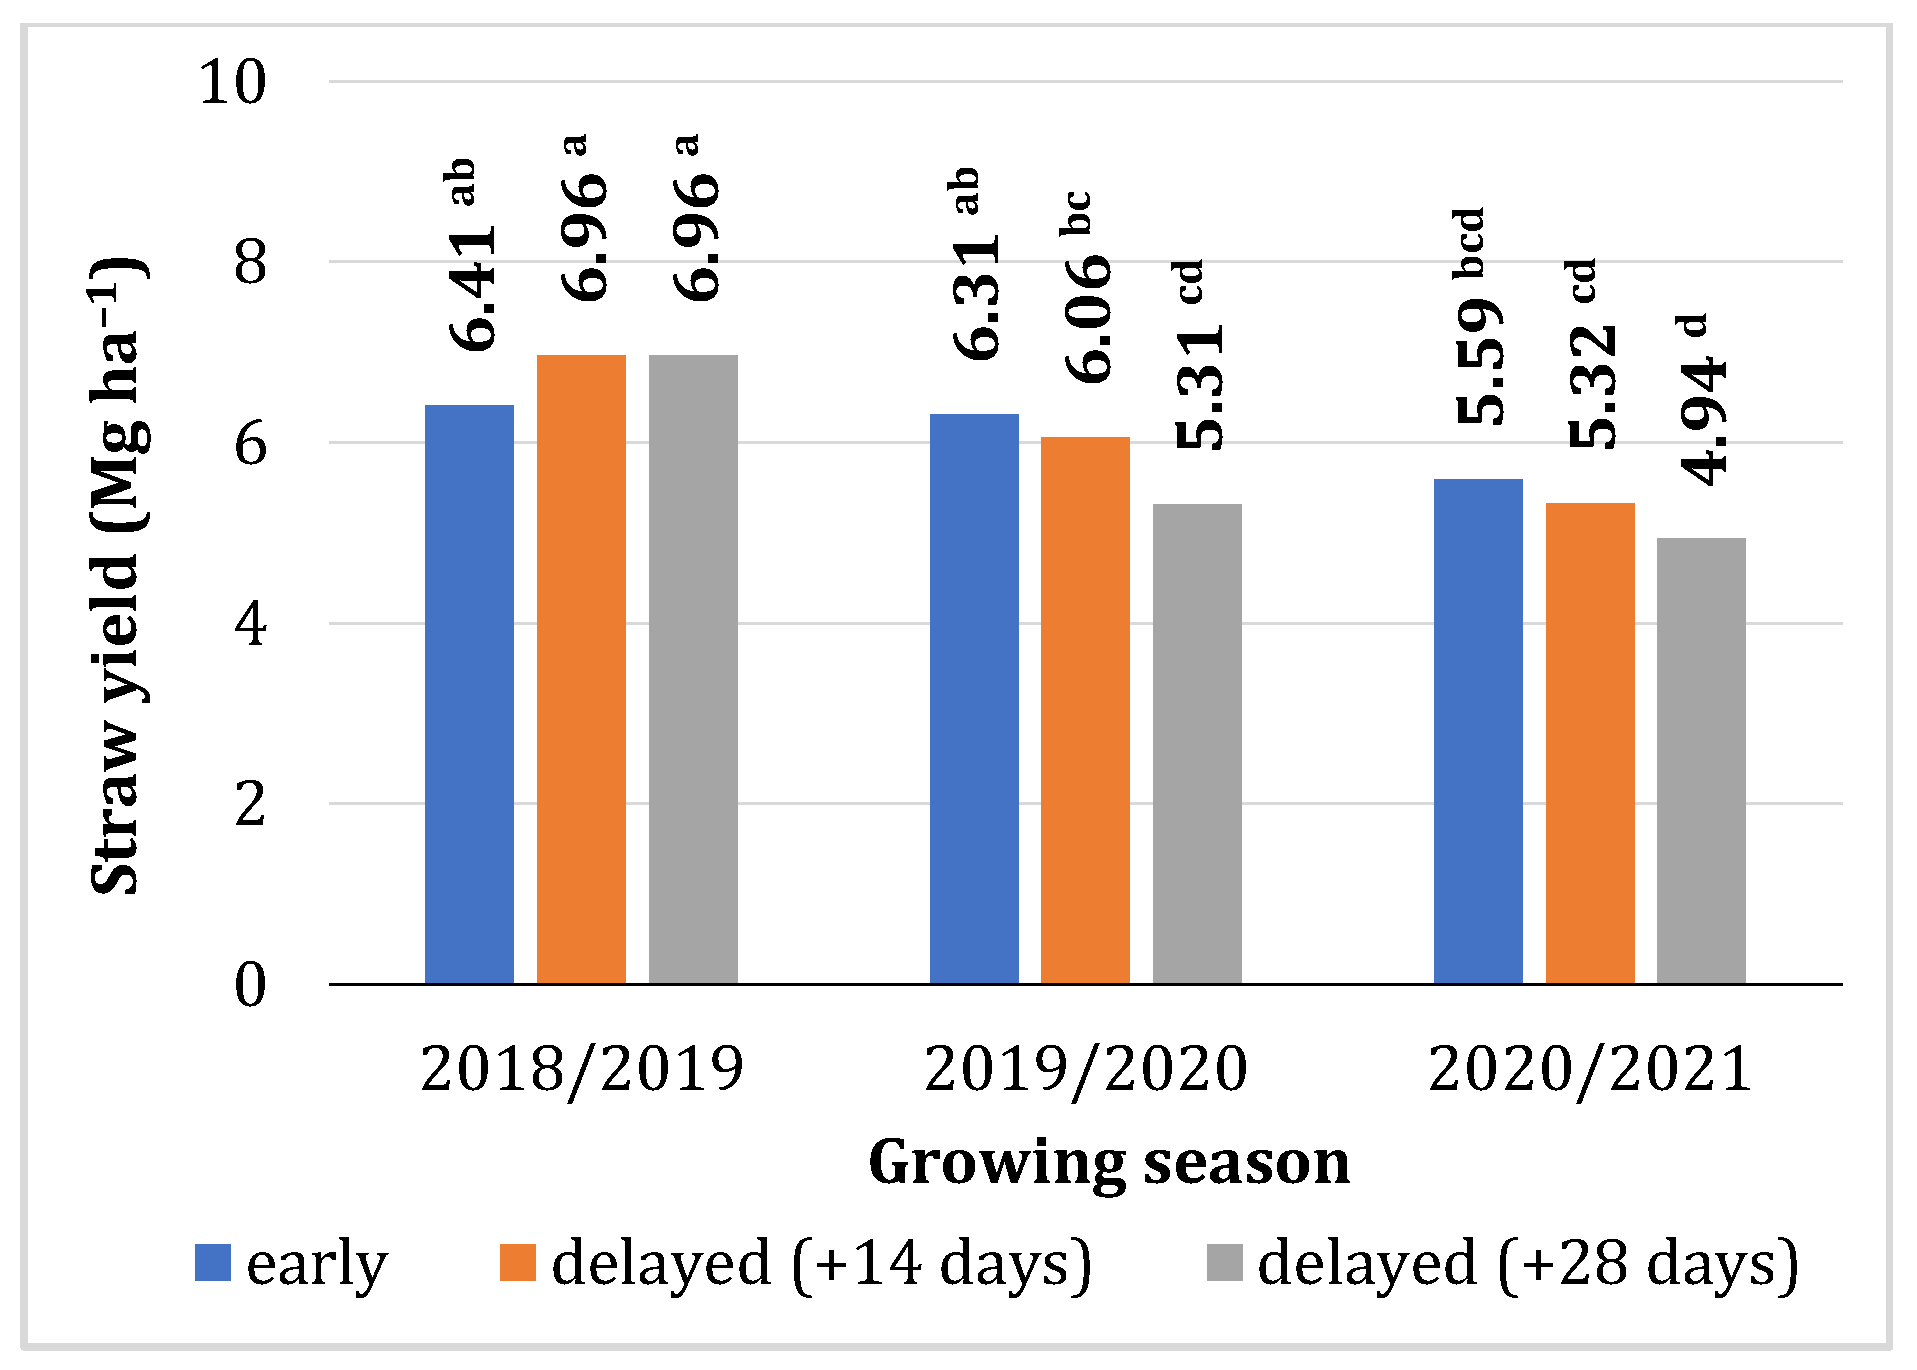
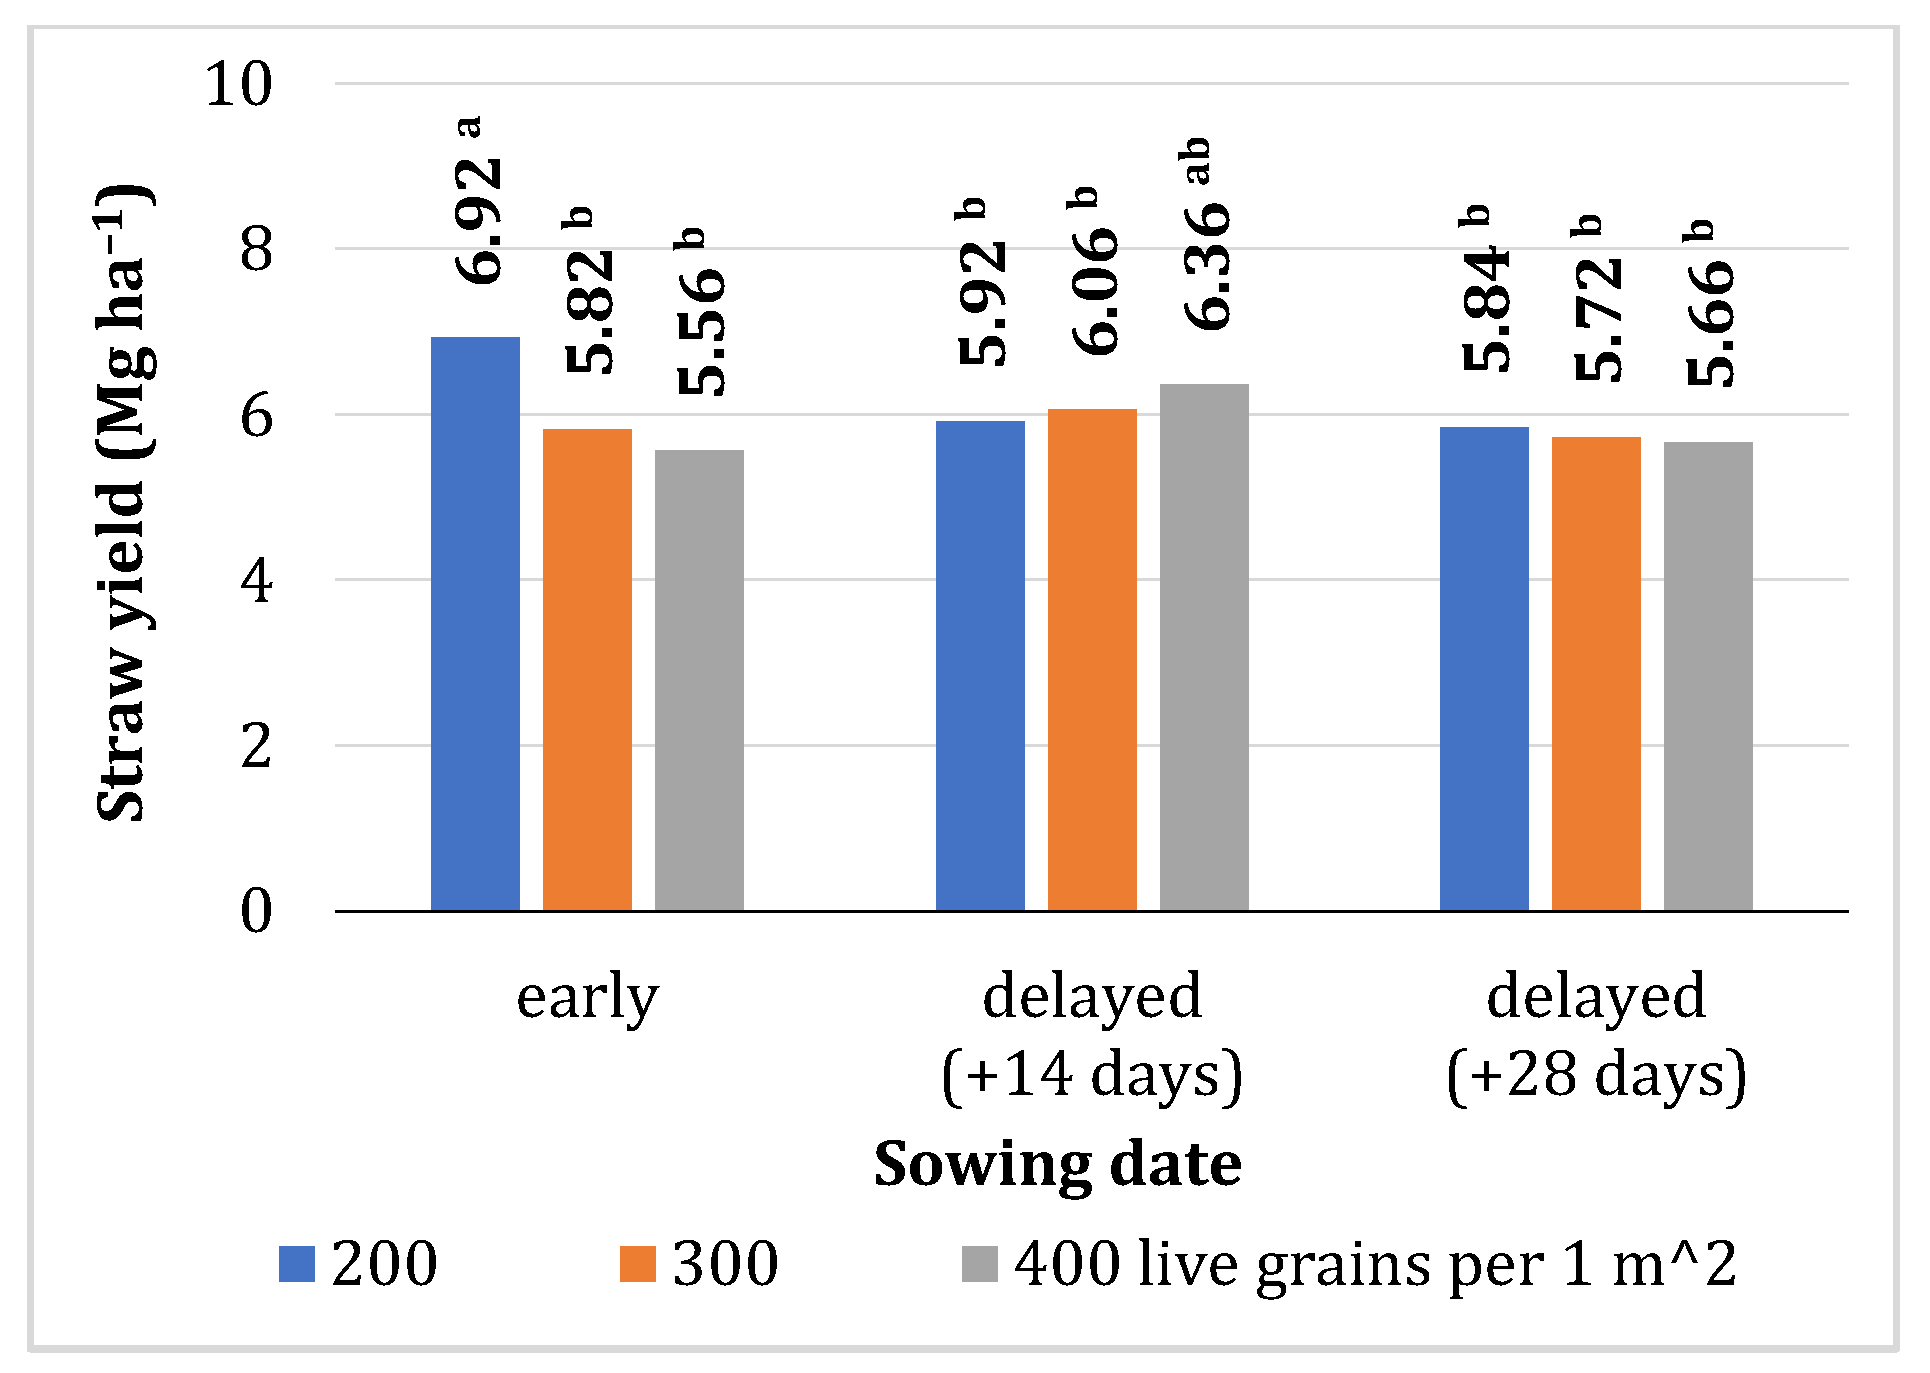
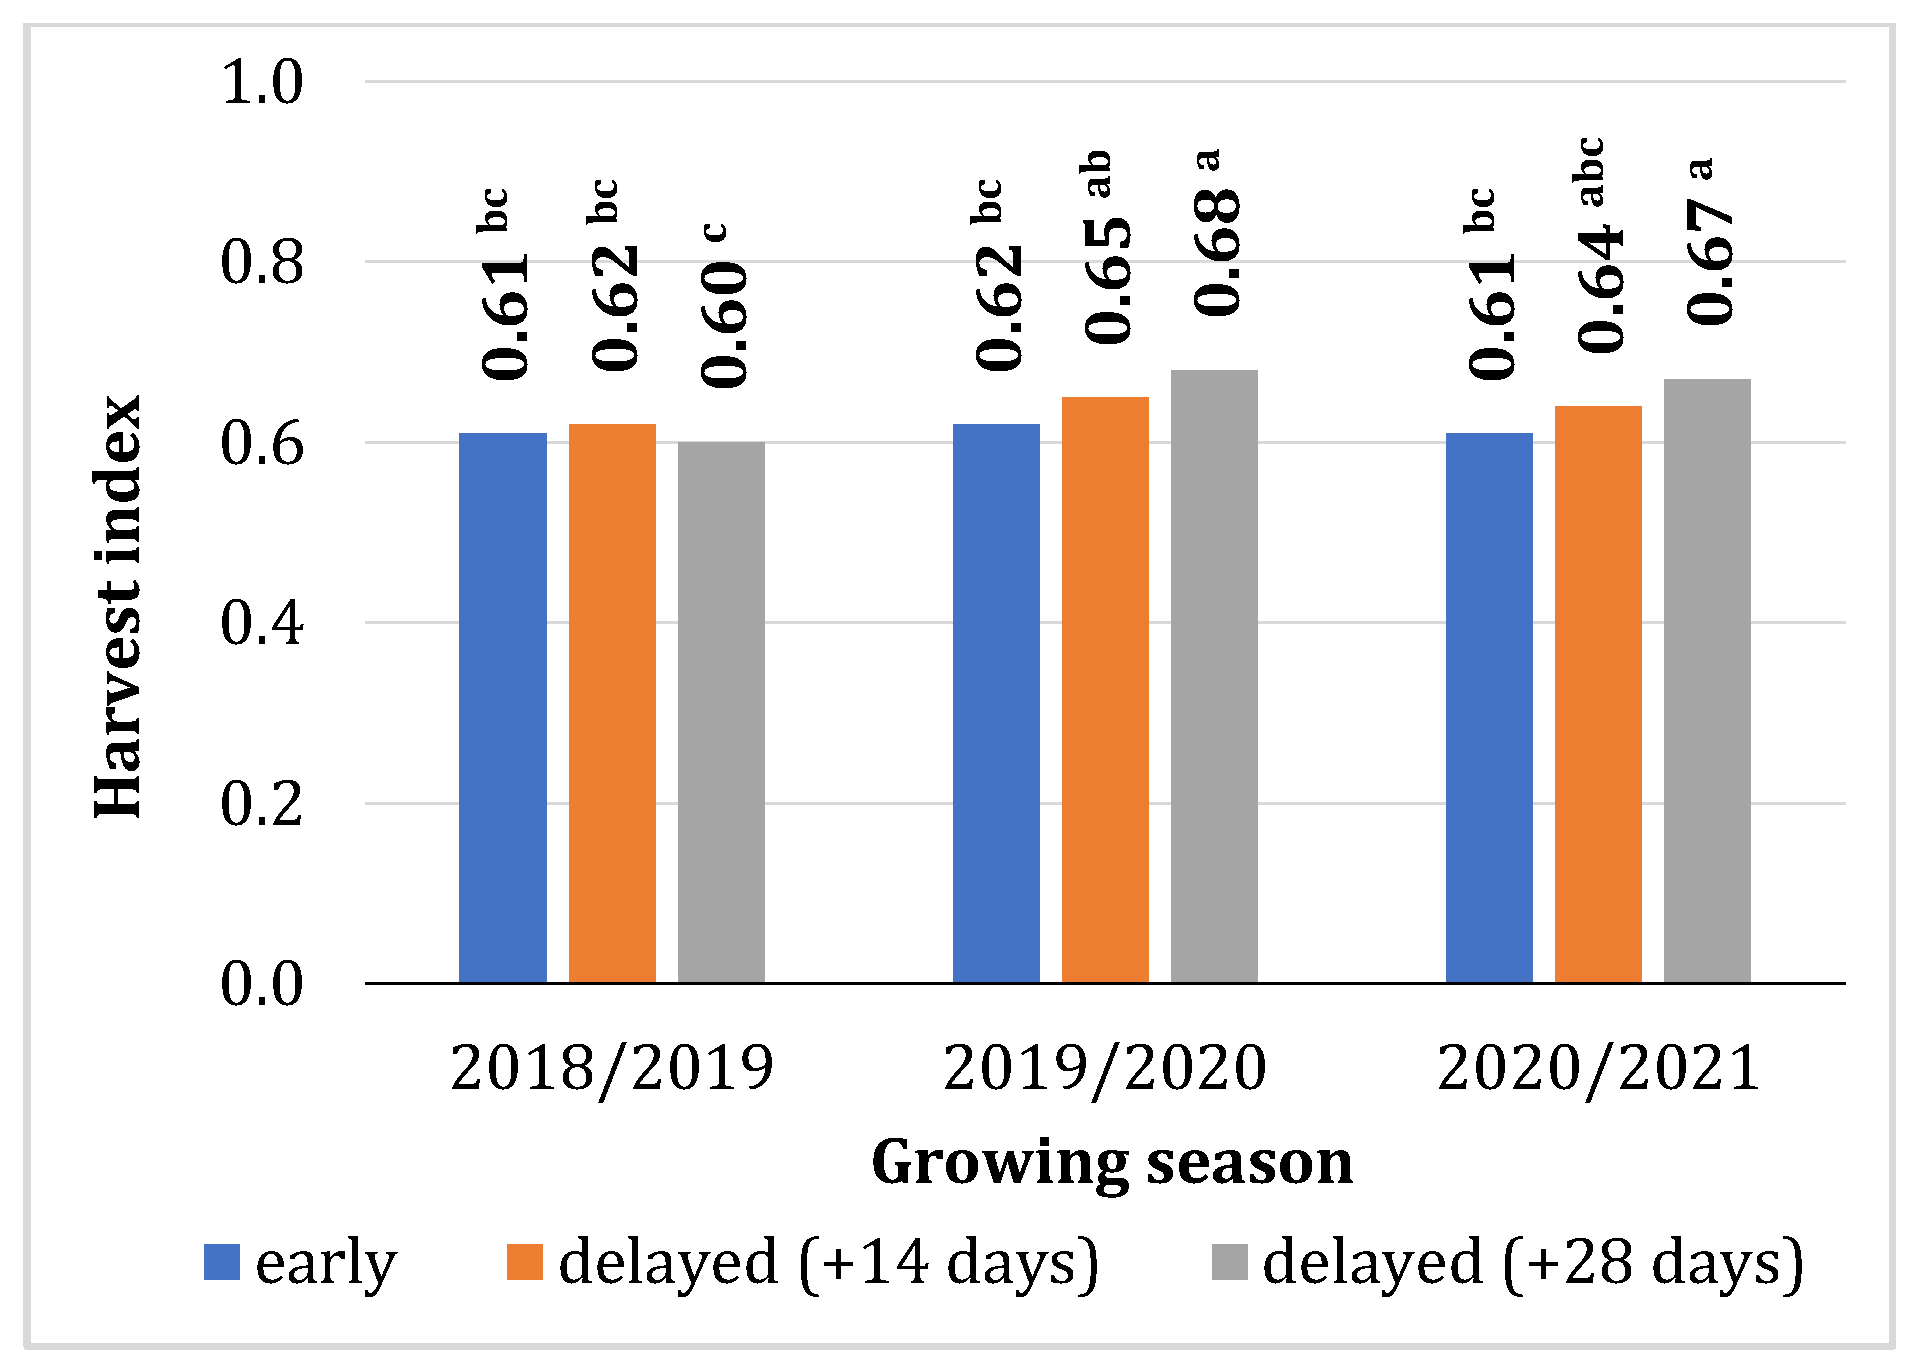
3.4. Biomass Yield and the Harvest Index

The grain yields of winter wheat grown in northeastern Poland ranged from 8.99 (2020/2021) to 10.57–10.90 Mg ha−1 (2018/2019 and 2019/2020) (Table 4). The number of spikes m−2 and TGW were 20–25% and 5–9% lower, respectively, in the third growing season than in the remaining seasons, which resulted in the lowest yields in the third year of the study. Early sowing (3–6 September) decreased grain yields (9.36 Mg ha−1). Grain yields were considerably higher (by 12–13% on average) when winter wheat was sown between 17 September and 4 October (Table 4). Winter wheat sown with a delay of 14 and 28 days was characterized by a significantly higher number of spikes m−2 (by 10–12%) and higher TGW (by 1–2%) (Table 3). Sowing date only exhibited no effect on the grain yields in the first growing season. In the second and third growing season, grain yields were 10% and 22% lower in early sown winter wheat (3–6 September), respectively, than in wheat sown with a delay of 14 and 28 days (Figure 7a). Sowing density induced minor differences (±2%) in grain yields. However, yields were higher in densely sown (400 live grains m−2) than in sparsely sown stands (200 live grains m−2) (10.25 vs.10.02 Mg ha−1) (Table 4). Grain yields were not influenced by sowing density during the second growing season exclusively (Figure 7b). In stands sown at 400 live grains m−2, yields increased due to a rise in the number of spikes m−2 (by 8–10%). However, higher sowing density decreased the number of grains spike−1 by 5–7% (Table 3). Yields peaked in response to 100 and 40 kg N ha−1 applied in BBCH stages 22–25 and 30–31, respectively (Table 4), regardless of sowing date or sowing density (Table 1). When a portion of N was moved from the first to the second split (40 + 100 kg N ha−1 in BBCH 22–25 and 30–31, respectively), grain yields decreased by 2%, mainly due to a decrease in the number of spikes m−2 (Table 3).
Straw yields ranged from 5.28–5.89 (2019/2020 and 2020/2021) to 6.78 Mg ha−1 (2018/2019). Delayed sowing (early October) significantly decreased straw yields (by 6%) (Table 4), and the sowing date only had no effect on straw yields in the first growing season (Figure 8). The relationship between sowing density and straw yields was influenced by the sowing date (Table 1). In early sown stands (early September), an increase in sowing density from 200 to 300 and 400 live grains m−2 decreased straw yields by 16% and 20%, respectively. In stands sown with a delay of 14 and 28 days, straw yields were not significantly differentiated by sowing density (200, 300, and 400 live grains m−2) (Figure 9). Straw yields peaked (6.23 Mg ha−1) in response to the lowest first spring rate of N (40 + 100 kg ha−1 in BBCH 22–25 and 30–31, respectively). Straw yields decreased by 6% on average when the first spring rate of N was increased to 70 or 100 kg ha−1 and when the second N rate was decreased (70 + 70 or 100 + 40 kg ha−1) (Table 4).
The HI of winter wheat ranged from 0.61 (2018/2019) to 0.64–0.65 (2019/2020–2020/2021). The HI increased by 5–7% when sowing was delayed to mid-September and early October (Table 4). The sowing date did not significantly influence the HI of winter wheat only in the first growing season (Figure 10). The ratio of grain yield to biomass yield was not significantly affected by sowing density or the split spring N rate (Table 1).

4. Discussion

4.1. Yield Components

The grain yield of winter wheat is determined mainly by the number of spikes m−2 and, to a smaller extent, by the number of grains spike−1 and TGW [68,69,70]. Delayed sowing can potentially decrease the number of productive shoots and spikelet buds due to a lower number of leaves per unit area and a low leaf area index (LAI) [71,72,73,74]. In addition, delayed sowing shifts the phenological stages of winter wheat to periods with higher temperatures, which can induce considerable differences in grain formation (grains spike−1 and TGW) [75]. However, the mechanism responsible for the decrease in grain yield in late-sown wheat remains unclear [74,76,77,78,79,80,81,82,83,84,85,86,87,88,89,90]. Aslani and Mehrvar [80] and Zhou et al. [90] reported that delayed sowing decreased the number of spikes m−2 (by 12–13%) and the number of grains spike−1 (by 5–6%) but did not affect TGW. In turn, Baloch et al. [78], Khosravi et al. [79], and Silva et al. [83] found that delayed sowing decreased TGW by 3–8% but had no effect on the remaining wheat yield components. In a study by Tahir et al. [77], delayed sowing decreased the number of spikes m−2 (by 25%), but it did not influence the remaining yield components. Delayed sowing decreased the values of all yield components in the work of Shah et al. [74], Wajid et al. [76], Mukherjee [81], Alam et al. [82], Gupta et al. [84], Gebrel et al. [85], Madhu et al. [86], Pathania et al. [87], and Yusuf et al. [89]. However, delayed sowing of winter wheat can have different consequences due to climate change. Delayed sowing can increase grain yields ([47,53,56,59,72,91], present study, Table 4) and, according to Dai et al. [48], Lloveras et al. [59], and Chen et al. [91] contributes to high wheat grain yields because the number of grains spike−1 increases as plants compete for light, nutrients, and water. In the current experiment, delayed sowing increased grain yields mainly due to an increase in the number of grains spike−1 (by 11%) and, to a smaller extent, an increase in TGW (by 1–2%). In the work of Ma et al. [72], delayed sowing also increased the number of spikes m−2 (by 7%), but it induced a minor decrease in the number of grains spike−1 (by 3%) and TGW (by 4%). Contrary results were reported by Sun et al. [47]. In a study by Yin et al. [53], delayed sowing decreased the spikes m−2 (by 6%), increased the number grains spike−1 (by 5%), but had no effect on TGW. In turn, Budzyński et al. [92] found that sowing date had no influence on yield components or grain weight.
In winter wheat, grain yields can be maximized by optimizing sowing density [54,55,56,72]. Modern winter wheat cultivars are more tolerant to higher sowing density, relative to previous recommendations [93]. Therefore, the optimal sowing density should be redefined to ensure that winter wheat plants effectively utilize natural resources [64]. Winter wheat’s response to sowing density should be also examined due to the high genetic diversity of cultivars [93,94]. In winter wheat, sowing density is selected mainly based on a given cultivar’s tillering potential [61]. Sowing density should be higher in cultivars with a low tillering capacity [61] and lower in genotypes with a high tillering capacity [62]. According to Valério et al. [95] and Mehring [96], to maximize yields, wheat cultivars with a low tillering potential should be sown at a density of 417 to 555 grains m−2, whereas cultivars with a high tillering potential should be sown at a density of 221 to 422 grains m−2. In turn, in the work of Dai et al. [49], the optimal sowing density was determined to be 135–405 grains m−2 in a cultivar with a lower tillering capacity, and at 90–345 grains m−2 in a cultivar with a higher tillering capacity. In general, sowing densities higher than optimal not only increase production costs (by increasing the demand for seeds), but also decrease wheat’s yield potential [49,59], mainly due to greater competition for natural resources [97,98] or higher disease pressure [60]. Sparse stands produce fewer spikes than dense stands [95], which is consistent with the results of the current study (Table 3). In turn, an increase in sowing density generally increases the number of spikes m−2 but decreases the number of grains spike−1 [78,94,99,100]. Sander et al. [97], Podolska and Wyzińska [101], Buczek and Bobrecka-Jamro [102], and the present study (Table 3) demonstrated that a high sowing density increases the number of spikes and decreases the number of grains spike−1 in various wheat genotypes. In general, the TGW of winter wheat is weakly differentiated by sowing density ([59,61,103] and present study, Table 3).
Nitrogen fertilization is an agronomic factor that exerts the strongest influence on the yield potential of winter wheat because it affects all yield components by (i) preventing a decrease in the number of productive shoots and, consequently, the number of spikes m−2; (ii) preventing a decrease in the number of spikelets per spike, which increases the number of grains spike−1; and (iii) increasing grain weight [43]. In the present study, the split application of N fertilizer in spring (40 + 100, 70 + 70, and 100 + 40 kg ha−1) induced significant differences only in the number of spikes m−2. This parameter was maximized (495 spikes m−2) in response to 100 and 40 kg N ha−1 applied in BBCH stages 22–25 and 30–31, respectively. The number of spikes m−2 decreased by 4% when the N rate was reduced to 40 kg ha−1 in BBCH stages 22–25 and increased to 100 kg ha−1 in BBCH stages 30–31. In the work of López-Bellido et al. [104], Budzyński and Bielski [105], and Podolska [44], a decrease in the early spring N rate also decreased the number of spikes m−2 by 5%, 10%, and 5–11%, respectively. In turn, Brzozowska et al. [106] found that TGW was the only parameter that was significantly influenced by the split application of N fertilizer in spring. A decrease in the second N split applied in BBCH stages 35–36 decreased TGW by 1%. López-Bellido et al. [104] and Ferrari et al. [107] also found that the split application of N fertilizer was associated with TGW. In a study by Zhang et al. [70], splitting the N fertilizer rate induced significant differences in the number of grains spike−1 and TGW. The highest number of grains spike−1 (39.4–40.9) and the highest TGW (43.2–44.3 g) were observed when N was applied at 120 kg ha−1 before sowing and at 120 kg ha−1 at the beginning of stem elongation (the total N rate of 240 kg ha−1 was split into two equal doses) [70]. An increase in the pre-sowing N rate, followed by a decrease in the N rate at the beginning of stem elongation (the ratio at which N splits were applied between sowing and stem elongation was changed to 100:0 and 70:30) decreased the number of grains spike−1 by 6–7% and decreased TGW by 9–10% [70].

4.2. Biomass Yield and the Harvest Index

Sowing date is a non-material agronomic factor that considerably influences the quality of crops [92]. The interactions between sowing date and weather conditions, particularly in regions with harsh winters (including northeastern Poland, Scandinavian and Baltic countries), affect the grain yields of winter wheat and other winter cultivars of Triticum species (durum wheat, T. durum Desf, and spelt—T. spelta L.). Winter cultivars of common wheat have to be sown on a date which ensures that plants reach at least BBCH stage 23 before winter dormancy. The achievement of BBCH stage 23 before winter dormancy ensures the optimal use of water and temperature [72], promotes cold hardening and, consequently, increases overwintering success [92]. In northeastern Poland, winter cultivars of Triticum species develop the optimal number of shoots only when they are sown in September. October seeding is generally regarded as late for all winter cultivars of T. aestivum, T. durum, and T. spelta because it delays seedling emergence, prolongs the initial stages of plant development, and prevents complete tiller formation before winter [43]. However, sowing is frequently delayed, relative to the optimal date, in agricultural practice, which prevents wheat cultivars from fully achieving their genetic yield potential [74]. Late-sown wheat usually develops under less supportive conditions, even in years with favorable weather [108]. The vegetative growth (between sowing and winter dormancy) of late-sown wheat is compromised by less sunlight, shorter day length [74], and lower mean daily temperatures, which decreases germination, tillering potential, and the number of shoots [74,109,110,111]. In the current study, delayed sowing also decreased the number of plants after emergence and in early spring (by 13%), and decreased the number of shoots plant−1 (by 13–24%) and shoots m−2 (by 24–33%) at the end of tillering (BBCH 29). Delayed sowing can also affect inflorescence emergence, and it exposes wheat plants to higher temperatures during grain filling [112], which can speed up and shorten reproductive spike development and decrease the number of grains spike−1 [109,110,111,112,113,114]. In northwestern China, every day of delay in the sowing date decreased grain yields by 1% due to slower plant growth and a decrease in both yield components and the LAI [74]. A significant decrease in wheat yields (21%) was also reported in the eastern coastal area of China when sowing was delayed by 30 days [78]. In Pakistan, grain yields were reduced by 7–12% when winter wheat was sown with a delay of 10–20 days [47,115]. In southeastern Germany, sowing delayed by 26 days decreased the grain yields of winter wheat by 7% on average [116]. According to Dai et al. [48], delayed sowing does not always affect inflorescence emergence, DM accumulation, grain filling, or grain yield in wheat. In a study by Budzyński et al. [92], common wheat, spelt, and durum wheat grown in northeastern Poland weakly responded to a 10- and 20-day delay in sowing. Delayed sowing (including in October) did not induce changes in the grain yields of winter cultivars of the examined wheat species [92]. Oleksiak [117] also reported a minor (1–5%) decrease in the grain yields of late-sown winter wheat in Poland. In the present experiment, grain yields did not decrease when sowing was delayed by 2 or 4 weeks. On the contrary, grain yields increased by 13% (by 1.22 Mg ha−1) when sowing was delayed by 14 days (mid-September). According to Paymard et al. [118], winter wheat’s response to delayed sowing can be attributed to climate change. Ding et al. [119] also noted that, in an era of climate change, winter wheat should be sown with a delay of 10–25 days, depending on precipitation levels. Different responses of winter wheat to delayed sowing in an era of climate change are also manifested by the ratio of grain yield to biomass yield [86,88,120,121,122,123,124]. Tahir et al. [88], Moustafa et al. [121], Shirinzadeh et al. [122], and Singh [124] found that delayed sowing decreased the HI by 4–36%. In turn, in the work of Madhu et al. [86], Donaldson et al. [120], Acharya et al. [123], and in the present study (Table 4), delayed sowing increased the HI by 6% or even 14–20%.
Sowing density directly affects the number of spikes m−2 in all cereal species [43]. However, stand density is influenced by environmental conditions, weather, and the applied production technology, which is why the strength of the interactions between cultivar and environmental factors is generally below the threshold of statistical significance [125,126]. Sowing density that is too high can compromise plant survival, contribute to plant loss, and decrease the performance of the surviving plants without influencing grain yield [92]. Weather and environmental conditions affect yields, which is why the optimal sowing density should be adapted to local requirements [93,94]. According to Lloveras et al. [59], the recommended sowing density in Belgium and northern France is 200 grains m−2, whereas, in the USA, this parameter ranges from 67 grains m−2 (dryland plains) to even 400 grains m−2 (eastern regions). In the USA, the most recommended wheat sowing density is 200 grains m−2, which can be increased by 50% for irrigated conditions [93]. In Slovenia, the recommended sowing density is 600–800 grains m−2 [99]. In Serbia, wheat grain yields were maximized at a sowing density of 500−600 grains m−2 [100,127]. In southeastern Poland, the optimal sowing densities for winter wheat were determined at 300 [101] and 400 grains m−2 [102]. In the present experiment, the lowest sowing density (200 live grains m−2) was also least productive, and a significant increase in the grain yields of winter wheat was observed at a sowing density of 400 live grains m−2 (10.02 vs. 10.25 Mg ha−1). According to Dubis and Budzyński [128], the influence of sowing density on grain yield is determined by precipitation during spring growth. In the cited study, in years with average or low precipitation in spring, grain yields peaked when winter wheat was sown at 480–600 grains m−2. In turn, low sowing densities (120–240 grains m−2) were most productive in years with high spring precipitation [128]. In the current study, weather conditions did not affect grain yields in winter wheat stands with different sowing densities (in all years, grain yields peaked at the sowing density of 400 grains m−2). In the work of Budzyński et al. [92], the yields of common wheat, spelt, and durum wheat grown in northeastern Poland were not significantly differentiated by the tested sowing densities (350–550 kernels m−2). Sowing density did not affect wheat yields in studies conducted in Brazil, Egypt, and Iran by Sander et al. [97], Ahmadi et al. [129], Gross et al. [130], Teixeira Filho et al. [131], and El-Metwally et al. [132]. According to Aćin [127], sowing density should be increased when winter wheat is sown late. The cited author demonstrated that the sowing density of late-sown winter wheat in Serbia should be increased from 500−600 to even 700 grains m−2 [127]. Lloveras et al. [59], Staggenborg et al. [133], and Kristó et al. [134] also found that sowing density should be increased when winter wheat is sown late to counteract the decrease in plant growth and shoot formation in the tillering stage. In the present experiment, the sowing date was not significantly associated with sowing density (no significant interaction was found between these factors). Winter wheat responded differently to the tested sowing densities because yield components are significantly affected by genotype, environmental conditions, and weather [43]. Sowing density does not exert a unidirectional effect on the HI of winter wheat. The HI is strongly determined by a cultivar’s tillering capacity and plant responses to stand density. In the work of Whaley et al. [57], Laghari et al. [60], Ahmadi et al. [129], and Hu et al. [135], higher sowing density decreased the HI by 9–28%. Farooq et al. [136] and Abd El-Lattief [137] reported a 6-17% increase in the HI of wheat with an increase in sowing density. In turn, in studies conducted by Ahmadi et al. [129], Porker et al. [138], Hussain et al. [139], Dalia et al. [140], and in the current experiment (Table 4), the HI was not influenced by sowing density.
Nitrogen fertilization is the key determinant of grain yield in wheat production [43,92,141,142]. Depending on soil type and cultivar, N fertilization increased grain yields in common wheat up to the N rate of 120–150 kg N ha−1 [92,143,144] or 200–240 kg N ha−1 in high-input production technologies [145,146]. Excess N available to plants can decrease tolerance to stress, photosynthetic efficiency, and grain yields [147]. The split application of N fertilizer improves NUE and minimizes the environmental impact of N fertilization [148]. In the present study, the grain yields of winter wheat peaked in response to 100 kg N ha−1 applied in BBCH stages 22–25 and 40 kg N ha−1 applied in BBCH stages 30–31. Podolska [44], Pisarek et al. [149], Sedlář et al. [150], and Belete et al. [151] also demonstrated that a higher rate of N should be applied in the tillering stage than in the stem elongation stage (grain yields increased by 4–16%). In turn, Budzyński and Bielski [105] did not report significant differences in grain yields when winter wheat was supplied with lower (120 kg ha−1) and higher (150 kg ha−1) N rates in early spring. In the work of Brzozowska et al. [106] and Školníková et al. [152], the split application of different N rates (135–160 kg ha−1) had no significant influence on winter wheat yields. However, in many studies, the greatest increase in grain yield was reported when the total N rate in early spring was split into two equal doses (50:50) [70,104,153,154,155,156]. A high N rate in the early stages of growth can inhibit DM accumulation during grain filling (and decrease TGW) [70]. The split application of N fertilizer in spring exerts varied effects on the HI of winter wheat ([104,157,158], present study, Table 4). In a study by Pisarek et al. [157] and in the present experiment (Table 4), the HI was not influenced by the spring N rate applied in splits. In the work of López-Bellido et al. [104], the HI peaked when N was applied in two equal splits (50:50). In turn, in a study by Akhter et al. [158], the HI was highest when N was applied before sowing (25%), in the tillering stage (50%), and in the heading stage (25%).

5. Conclusions

In northeastern Poland, winter wheat can be sown in late September or early October without the risk of decreasing grain yields. Delayed sowing did not decrease but actually increased grain yields (by 1.16–1.22 Mg ha−1, i.e., by 12–13%) by boosting the number of spikes m−2 (10–12%) and TGW (by 1–2%) relative to early-sown wheat (beginning of September). Grain yields peaked in response to a sowing density of 400 live grains m−2, which can be attributed to an increase in the number of spikes m−2. The application of 40 and 100 kg N ha−1 in BBCH stages 22–25 and 30–31, respectively, maximized grain yields. This split spring N rate exerted a positive impact on the number of spikes m−2. However, in an era of rapid climate change, further research involving different winter wheat cultivars grown under different environmental conditions is needed to validate the present findings.

Author Contributions

Conceptualization, K.L. and K.J.J.; methodology, K.L. and K.J.J.; software, K.L.; validation, K.L.; formal analysis, K.L.; investigation, K.L.; resources, K.L.; data curation, K.L.; writing—original draft preparation, K.L.; writing—review and editing, K.L. and K.J.J.; visualization, K.L.; supervision, K.J.J.; project administration, K.L. and K.J.J.; funding acquisition, K.J.J. All authors have read and agreed to the published version of the manuscript.

Funding

The results presented in this paper were obtained as part of a comprehensive study financed by the Faculty of Agriculture and Forestry, University of Warmia and Mazury in Olsztyn (grant No. 30.610.013-110). Funded by the Minister of Science under “the Regional Initiative of Excellence Program”.

Institutional Review Board Statement

Not applicable.

Data Availability Statement

Data are contained within the article.

Acknowledgments

We would like to thank the staff of the AES in Bałcyny for technical support during the experiment.

Conflicts of Interest

The authors declare no conflicts of interest.

References

  1. Domagała, J. Economic and environmental aspects of agriculture in the EU countries. Energies 2021, 14, 7826. [Google Scholar] [CrossRef]
  2. Eurostat. Performance of the Agricultural Sector. 2023. Available online: https://ec.europa.eu/eurostat/statistics-explained/index.php?title=Performance_of_the_agricultural_sector (accessed on 20 December 2023).
  3. Sunderji, S.; Bass, R.; Hand, D.; Nova, N. Understanding Impact Performance: Agriculture Investments; Global Impact Investing Network: New York, NY, USA, 2020; Available online: https://thegiin.org/assets/Understanding%20Impact%20Performance_Agriculture%20Investments_webfile.pdf (accessed on 20 December 2023).
  4. Baldock, D.; Buckwell, A. Just Transition in the EU Agriculture and Land Use Sector; Institute for European Environmental Policy: London, UK, 2021. [Google Scholar]
  5. Bielski, S.; Marks-Bielska, R.; Zielińska-Chmielewska, A.; Romaneckas, K.; Šarauskis, E. Importance of agriculture in creating energy security—A case study of Poland. Energies 2021, 14, 2465. [Google Scholar] [CrossRef]
  6. Allami, H.A.; Tabasizadeh, M.; Rohani, A.; Nayebzadeh, H.; Farzad, A. Effect of ultrasonic irradiation on the properties and performance of biodiesel produced from date seed oil used in the diesel engine. Ultrason. Sonochem. 2020, 60, 104672. [Google Scholar] [CrossRef]
  7. Pawlak, K.; Kołodziejczak, M. The role of agriculture in ensuring food security in developing countries: Considerations in the context of the problem of sustainable food production. Sustainability 2020, 12, 5488. [Google Scholar] [CrossRef]
  8. Reinhardt, J.; Hilgert, P.; Von Cossel, M. Yield performance of dedicated industrial crops on low-temperature characterized marginal agricultural land in Europe—A review. Biofuels Bioprod. Bioref. 2022, 16, 609–622. [Google Scholar] [CrossRef]
  9. Behnassi, M.; El Haiba, M. Implications of the Russia–Ukraine war for global food security. Nat. Hum. Behav. 2022, 6, 754–755. [Google Scholar] [CrossRef]
  10. Mottaleb, K.A.; Gideon, K.; Sieglinde, S. Potential impacts of Ukraine-Russia armed conflict on global wheat food security: A quantitative exploration. Globa. Food Sec. 2022, 35, 100659. [Google Scholar] [CrossRef]
  11. Alabi, M.O.; Ngwenyama, O. Food security and disruptions of the global food supply chains during COVID-19: Building smarter food supply chains for post COVID-19 era. Br. Food J. 2023, 125, 167–185. [Google Scholar] [CrossRef]
  12. Alexandratos, N.; Bruinsma, J. World Agriculture: Towards 2030/2050; ESA Working Paper No. 12–03; FAO: Rome, Italy, 2012. [Google Scholar]
  13. FAOSTAT. Food and Agriculture Organization Corporate Statistical Database. 2023. Available online: http://www.apps.fao.org (accessed on 20 December 2023).
  14. United States Census Bureau. International Programs. International Data Base: World Population. 2016. Available online: http://www.census.gov/population/international/data/idb/worldpoptotal.php (accessed on 22 December 2023).
  15. Guttieri, M.J.; Frels, K.; Regassa, T.; Waters, B.M.; Baenziger, P.S. Variation for nitrogen use efficiency traits in current and historical Great Plains hard winter wheat. Euphytica 2017, 213, 87. [Google Scholar] [CrossRef]
  16. United Nations. World Population Prospects. 2019. Available online: https://population.un.org/wpp/Publications/Files/wpp2019_10KeyFindings.pdf (accessed on 20 December 2023).
  17. Neumann, K.; Verburg, P.H.; Stehfest, E.; Müller, C. The yield gap of global grain production: A spatial analysis. Agric. Syst. 2010, 103, 316–326. [Google Scholar] [CrossRef]
  18. Buczek, J.; Jarecki, W.; Bobrecka-Jamro, D. The response of population and hybrid wheat to selected agro-environmental factors. Plant Soil Environ. 2016, 62, 67–73. [Google Scholar] [CrossRef]
  19. Jańczak-Pieniążek, M.; Buczek, J.; Kwiatkowski, C.A.; Harasim, E. The course of physiological processes, yielding, and grain quality of hybrid and population wheat as affected by integrated and conventional cropping systems. Agronomy 2022, 12, 1345. [Google Scholar] [CrossRef]
  20. Foley, J.A.; Ramankutty, N.; Brauman, K.A.; Cassidy, E.S.; Gerber, J.S.; Johnston, M.; Mueller, N.D.; O’Connell, C.; Ray, D.K.; West, P.C.; et al. Solutions for a cultivated planet. Nature 2011, 478, 337–342. [Google Scholar] [CrossRef]
  21. Meyfroidt, P.; Carlson, K.M.; Fagan, M.E.; Gutiérrez-Vélez, V.H.; Macedo, M.N.; Curran, L.M.; DeFries, R.S.; Dyer, G.A.; Gibbs, H.K.; Lambin, E.F.; et al. Multiple pathways of commodity crop expansion in tropical forest landscapes. Environ. Res. Lett. 2014, 9, 074012. [Google Scholar] [CrossRef]
  22. Ren, K.; Xu, M.; Li, R.; Zheng, L.; Wang, H.; Liu, S.; Zhang, W.; Duan, D.; Lu, C. Achieving high yield and nitrogen agronomic efficiency by coupling wheat varieties with soil fertility. Sci. Total Environ. 2023, 881, 163531. [Google Scholar] [CrossRef] [PubMed]
  23. Economic Research Service. Fertilizer Use and Price. U.S. Department of Agriculture. 2019. Available online: https://data.nal.usda.gov/dataset/fertilizer-use-and-price (accessed on 20 December 2023).
  24. Cui, Z.; Zhang, H.; Chen, X.; Zhang, C.; Ma, W.; Huang, C.; Zhang, W.; Mi, G.; Miao, Y.; Li, X.; et al. Pursuing sustainable productivity with millions of smallholder farmers. Nature 2018, 7696, 363–366. [Google Scholar] [CrossRef] [PubMed]
  25. Liang, S.; Li, Y.; Zhang, X.; Sun, Z.; Sun, N.; Duan, Y.; Xu, M.; Wu, L. Response of crop yield and nitrogen use efficiency for wheat-maize cropping system to future climate change in Northern China. Agric. For. Meteorol. 2018, 262, 310–321. [Google Scholar] [CrossRef]
  26. Zhang, C.; Ju, X.; Powlson, D.; Oenema, O.; Smith, P.J. Nitrogen surplus benchmarks for controlling N pollution in the main cropping systems of China. Environ. Sci. Technol. 2019, 53, 6678–6687. [Google Scholar] [CrossRef] [PubMed]
  27. Carvalho, J.M.G.; Bonfim-Silva, E.M.; Da Silva, T.J.A.; Sousa, H.H.D.F.; Guimarães, S.L.; Pacheco, A.B. Nitrogen and potassium in production, nutrition and water use efficiency in wheat plants. Cienc. Investig. Agrar. 2016, 43, 442–451. [Google Scholar] [CrossRef]
  28. Ladha, J.; Tirol-Padre, A.; Reddy, C.K.; Cassman, K.G.; Verma, S.; Powlson, D.S.; Van Kessel, C.; Richter, D.D.B.; Chakraborty, D.; Pathak, H. Global nitrogen budgets in cereals: A 50-year assessment for maize, rice and wheat production systems. Sci. Rep. 2016, 6, 19355. [Google Scholar] [CrossRef]
  29. Rossini, F.; Provenzano, M.E.; Sestili, F.; Ruggeri, R. Synergistic effect of sulfur and nitrogen in the organic and mineral fertilization of durum wheat: Grain yield and quality traits in the Mediterranean environment. Agronomy 2018, 8, 189. [Google Scholar] [CrossRef]
  30. Shah, A.N.; Yang, G.; Tanveer, M.; Iqbal, J. Leaf gas exchange, source–sink relationship, and growth response of cotton to the interactive effects of nitrogen rate and planting density. Acta Physiol. Plant. 2017, 39, 119. [Google Scholar] [CrossRef]
  31. Bhattacharya, A. Global Climate Change and Its Impact on Agriculture. In Changing Climate and Resource Use Efficiency in Plants; Academic Press: Cambridge, MA, USA, 2019; pp. 1–50. [Google Scholar]
  32. Bhattarai, D.; Abagandura, G.O.; Nleya, T.; Kumar, S. Responses of soil surface greenhouse gas emissions to nitrogen and sulfur fertilizer rates to Brassica carinata grown as a bio-jet fuel. GCB Bioenergy 2021, 13, 627–639. [Google Scholar] [CrossRef]
  33. Shah, A.N.; Iqbal, J.; Tanveer, M.; Yang, G.; Hassan, W.; Fahad, S.; Yousaf, M.; Wu, Y. Nitrogen fertilization and conservation tillage: A review on growth, yield, and greenhouse gas emissions in cotton. Environ. Sci. Pollut. Res. 2017, 24, 2261–2272. [Google Scholar] [CrossRef] [PubMed]
  34. Efretuei, A.; Gooding, M.; White, E.; Spink, J.; Hackett, R. Effect of nitrogen fertilizer application timing on nitrogen use efficiency and grain yield of winter wheat in Ireland. Ir. J. Agric. Food Res. 2016, 55, 63–73. [Google Scholar] [CrossRef]
  35. Litke, L.; Gaile, Z.; Ruža, A. Effect of nitrogen fertilization on winter wheat yield and yield quality. Agron. Res. 2018, 16, 200–209. [Google Scholar]
  36. Zörb, C.; Ludewig, U.; Hawkesford, M.J. Perspective on wheat yield and quality with reduced nitrogen supply. Trends Plant Sci. 2018, 23, 1029–1037. [Google Scholar] [CrossRef]
  37. Moitzi, G.; Neugschwandtner, R.W.; Kaul, H.P.; Wagentristl, H. Efficiency of mineral nitrogen fertilization in winter wheat under Pannonian climate conditions. Agriculture 2020, 10, 541. [Google Scholar] [CrossRef]
  38. Tabak, M.; Lepiarczyk, A.; Filipek-Mazur, B.; Lisowska, A. Efficiency of nitrogen fertilization of winter wheat depending on sulfur fertilization. Agronomy 2020, 10, 1304. [Google Scholar] [CrossRef]
  39. Meier, U. Growth Stages of Mono- and Dicotyledonous Plants: BBCH Monograph; Julius Kühn-Institut: Quedlinburg, Germany, 2018; Available online: https://www.julius-kuehn.de/media/Veroeffentlichungen/bbch%20epaper%20en/page.pdf (accessed on 10 December 2023).
  40. Wall, D.P.; Plunkett, M. Major and Micro Nutrient Advice for Productive Agricultural Crops; Teagasc Johnstown Castle: Wexford, Ireland, 2020; p. 176. [Google Scholar]
  41. Limaux, F.; Recous, S.; Meynard, J.M.; Guckert, A. Relationship between rate of crop growth at date of fertilizer N application and fate of fertilizer N applied to winter wheat. Plant Soil 1999, 214, 49–59. [Google Scholar] [CrossRef]
  42. Grzebisz, W. Cereals. In Crop Fertilization Technologies—The Physiology of Crop Yield; Cereals and Maize; Grzebisz, W., Ed.; PWRiL: Poznań, Poland, 2012; pp. 8–193. (In Polish) [Google Scholar]
  43. Budzyński, W. Common wheat. In Wheats—Common, Spelt, Durum; Budzyński, W., Ed.; PWRiL: Poznań, Poland, 2012; pp. 23–150. (In Polish) [Google Scholar]
  44. Podolska, G. Effect of nitrogen fertilization doses and way of its application on yield and technological quality of winter wheat cultivars grain. Acta Sci. Pol. Agric. 2008, 7, 57–65. (In Polish) [Google Scholar]
  45. Barad, B.B.; Mathukia, R.K.; Bodar, K.H.; Der, H.N. Real time nitrogen fertilization using precision tools for enhancing productivity of wheat (Triticum aestivum L.). Int. J. Pure Appl. Biosci. 2018, 6, 434–440. [Google Scholar] [CrossRef]
  46. Fageria, N.K.; Baligar, V.C. Enhancing nitrogen use efficiency in crop plants. Adv. Agron. 2005, 88, 97–185. [Google Scholar]
  47. Sun, H.; Zhang, X.; Chen, S.; Pei, D.; Liu, C. Effects of harvest and sowing time on the performance of the rotation of winter wheat–summer maize in the North China Plain. Ind. Crops Prod. 2007, 25, 239–247. [Google Scholar] [CrossRef]
  48. Dai, X.; Wang, Y.; Dong, X.; Qian, T.; Yin, L.; Dong, S.; He, M. Delayed sowing can increase lodging resistance while maintaining grain yield and nitrogen use efficiency in winter wheat. Crop J. 2017, 5, 541–552. [Google Scholar] [CrossRef]
  49. Dai, X.; Zhou, X.; Jia, D.; Xiao, L.; Kong, H.; He, M. Managing the seeding rate to improve nitrogen-use efficiency of winter wheat. Field Crops Res. 2013, 154, 100–109. [Google Scholar] [CrossRef]
  50. Ainsworth, E.A.; Ort, D.R. How do we improve crop production in a warming world? Plant Physiol. 2010, 154, 526–530. [Google Scholar] [CrossRef]
  51. Xiao, D.; Tao, F.; Liu, Y.; Shi, W.; Wang, M.; Liu, F.; Zhang, S.; Zhu, Z. Observed changes in winter wheat phenology in the North China Plain for 1981–2009. Int. J. Biometeorol. 2013, 57, 275–285. [Google Scholar] [CrossRef]
  52. Xiao, D.; Moiwo, J.P.; Tao, F.; Yang, Y.; Shen, Y.; Xu, Q.; Liu, J.; Zhang, H.; Liu, F. Spatiotemporal variability of winter wheat phenology in response to weather and climate variability in China. Mitig. Adapt. Strateg. Glob. Chang. 2015, 20, 1191–1202. [Google Scholar] [CrossRef]
  53. Yin, L.; Dai, X.; He, M. Delayed sowing improves nitrogen utilization efficiency in winter wheat without impacting yield. Field Crops Res. 2018, 221, 90–97. [Google Scholar] [CrossRef]
  54. Hochman, Z.; Horan, H. Causes of wheat yield gaps and opportunities to advance the water-limited yield frontier in Australia. Field Crops Res. 2018, 228, 20–30. [Google Scholar] [CrossRef]
  55. Jaenisch, B.R.; de Oliveira Silva, A.; DeWolf, E.; Ruiz-Diaz, D.A.; Lollato, R.P. Plant population and fungicide economically reduced winter wheat yield gap in Kansas. Agron. J. 2019, 111, 650–665. [Google Scholar] [CrossRef]
  56. Lollato, R.P.; Ruiz Diaz, D.A.; DeWolf, E.; Knapp, M.; Peterson, D.E.; Fritz, A.K. Agronomic practices for reducing wheat yield gaps: A quantitative appraisal of progressive producers. Crop Sci. 2019, 59, 333. [Google Scholar] [CrossRef]
  57. Whaley, J.M.; Sparkes, D.L.; Foulkes, M.J.; Spink, J.H.; Semere, T.; Scott, R.K. The physiological response of winter wheat to reductions in plant density. Ann. Appl. Biol. 2000, 137, 165–177. [Google Scholar] [CrossRef]
  58. Fischer, R.A.; Ramos, O.M.; Monasterio, I.O.; Sayre, K.D. Yield response to plant density, row spacing, and raised beds in low latitude spring wheat with ample soil resources: An update. Field Crops Res. 2019, 232, 95–105. [Google Scholar] [CrossRef]
  59. Lloveras, J.; Manent, J.; Viudas, J.; Lopez, A.; Santiveri, P. Seeding rate influence on yield and yield components of irrigated winter wheat in a Mediterranean climate. Agron. J. 2004, 96, 1258–1265. [Google Scholar] [CrossRef]
  60. Laghari, G.M.; Oad, F.C.; Tunio, S.; Chachar, Q.; Ghandahi, A.; Siddiqui, M.H.; Hassan, S.W.; Ali, A. Growth and yield attributes of wheat at different seed rates. Sarhad J. Agric. 2011, 27, 177–183. [Google Scholar]
  61. Valério, I.P.; De Carvalho, F.I.F.; Benin, G.; Da Silveira, G.; Da Silva, J.A.G.; Nornberg, R.; Hagemann, T.; Luche, H.D.S.; De Oliveira, A.C. Seeding density in wheat: The more, the merrier? Sci. Agric. 2013, 70, 176–184. [Google Scholar] [CrossRef]
  62. Bastos, L.M.; Carciochi, W.; Lollato, R.P.; Jaenisch, B.R.; Rezende, C.R.; Schwalbert, R.; Prasad, P.V.V.; Zhang, G.; Fritz, A.K.; Foster, C.; et al. Winter wheat yield response to plant density as a function of yield environment and tillering potential: A review and field studies. Front. Plant Sci. 2020, 11, 54. [Google Scholar] [CrossRef]
  63. Arduini, I.; Masoni, A.; Ercoli, L.; Mariotti, M. Grain yield, and dry matter and nitrogen accumulation and remobilization in durum wheat as affected by variety and seeding rate. Eur. J. Agron. 2006, 25, 309–318. [Google Scholar] [CrossRef]
  64. Dai, X.; Xiao, L.; Jia, D.; Kong, H.; Wang, Y.; Li, C.; Zhang, Y.; He, M. Increased plant density of winter wheat can enhance nitrogen–uptake from deep soil. Plant Soil 2014, 384, 141–152. [Google Scholar] [CrossRef]
  65. Gao, Y.; Li, Y.; Zhang, J.; Liu, W.; Dang, Z.; Cao, W.; Qiang, Q. Effects of mulch, N fertilizer, and plant density on wheat yield, wheat nitrogen uptake, and residual soil nitrate in a dryland area of China. Nutr. Cycl. Agroecosyt. 2009, 85, 109–121. [Google Scholar] [CrossRef]
  66. IUSS Working Group WRB. World Reference Base for Soil Resources 2022; FAO: Rome, Italy, 2022; Available online: https://eurasian-soil-portal.info/wp-content/uploads/2022/07/wrb_fourth_edition_2022-3.pdf (accessed on 20 December 2023).
  67. TIBCO Software Inc. Statistica (Data Analysis Software System), Version 13; TIBCO Software Inc.: Palo Alto, CA, USA, 2017. [Google Scholar]
  68. Agami, R.A.; Alamri, S.A.; Abd El-Mageed, T.A.; Abousekken, M.S.M.; Hashem, M. Role of exogenous nitrogen supply in alleviating the deficit irrigation stress in wheat plants. Agric. Water Manag. 2018, 210, 261–270. [Google Scholar] [CrossRef]
  69. Rivera-Amado, C.; Trujillo-Negrellos, E.; Molero, G.; Reynolds, M.P.; Sylvester-Bradley, R.; Foulkes, M.J. Optimizing dry-matter partitioning for increased spike growth, grain number and harvest index in spring wheat. Field Crops Res. 2019, 240, 154–167. [Google Scholar] [CrossRef]
  70. Zhang, Z.; Yu, Z.; Zhang, Y.; Shi, Y. Split nitrogen fertilizer application improved grain yield in winter wheat (Triticum aestivum L.) via modulating antioxidant capacity and 13 C photosynthate mobilization under water-saving irrigation conditions. Ecol. Process. 2021, 10, 21. [Google Scholar] [CrossRef]
  71. Arduini, I.; Pellegrino, E.; Ercoli, L. Contribution of main culm and tillers to grain yield of durum wheat: Influence of sowing date and plant traits. Ital. J. Agron. 2018, 13, 235–247. [Google Scholar] [CrossRef]
  72. Ma, S.C.; Wang, T.C.; Guan, X.K.; Zhang, X. Effect of sowing time and seeding rate on yield components and water use efficiency of winter wheat by regulating the growth redundancy and physiological traits of root and shoot. Field Crop. Res. 2018, 221, 166–174. [Google Scholar] [CrossRef]
  73. Zhai, Y.; Wu, Q.; Chen, G.; Zhang, H.; Yin, X.; Chen, F. Broadcasting winter wheat can increase grain yield without reducing the kernels per spike and the kernel weight. Sustainability 2018, 10, 4858. [Google Scholar] [CrossRef]
  74. Shah, F.; Coulter, J.A.; Ye, C.; Wu, W. Yield penalty due to delayed sowing of winter wheat and the mitigatory role of increased seeding rate. Eur. J. Agron. 2020, 119, 126120. [Google Scholar] [CrossRef]
  75. Sattar, A.; Cheema, M.A.; Farooq, M.; Wahid, M.A.; Wahid, A.; Babar, B.H. Evaluating the performance of wheat cultivars under late sown conditions. Int. J. Agric. Biol. 2010, 12, 561–565. [Google Scholar]
  76. Wajid, A.; Hussain, A.; Ahmad, A.; Goheer, A.R.; Ibrahim, M.; Mussaddique, M. Effect of sowing date and plant population on biomass, grain yield and yield components of wheat. Int. J. Agric. Biol. 2004, 6, 1003–1005. [Google Scholar]
  77. Tahir, M.; Ali, A.; Nadeem, M.A.; Hussain, A.; Khalid, F. Effect of different sowing dates on growth and yield of wheat (Triticum aestivum L.) varieties in district Jhang, Pakistan. Pak. J. Life Soc. Sci. 2009, 27, 66–69. [Google Scholar]
  78. Baloch, M.S.; Shah, I.T.H.; Nadim, M.A.; Khan, M.I.; Khakwani, A.A. Effect of seeding density and planting time on growth and yield attributes of wheat. J. Anim. Plant Sci. 2010, 20, 239–240. [Google Scholar]
  79. Khosravi, V.; Khajoie-Nejad, G.; Mohammadi-Nejad, G.; Yousefi, K. The effect of different sowing dates on yield and yield components of wheat (Triticum aestivum L.) cultivars. Int. J. Agron. Plant Prod. 2010, 1, 77–82. [Google Scholar]
  80. Aslani, F.; Mehrvar, M.R. Responses of wheat genotypes as affected by different sowing dates. Asian J. Agric. Sci. 2012, 4, 72–74. [Google Scholar]
  81. Mukherjee, D. Effect of different sowing dates on growth and yield of wheat (Triticum aestivum) cultivars under mid hill situation of West Bengal. Indian J. Agron. 2012, 57, 152–156. [Google Scholar] [CrossRef]
  82. Alam, M.P.; Kumar, S.; Ali, N.; Manjhi, R.P.; Kumari, N.; Lakra, R.K.; Izhar, T. Performance of wheat varieties under different sowing dates in Jharkhand. J. Wheat Res. 2013, 5, 61–64. [Google Scholar]
  83. Silva, R.R.; Benin, G.; Almeida, J.L.D.; Fonseca, I.C.D.B.; Zucareli, C. Grain yield and baking quality of wheat under different sowing dates. Acta Sci. Agron. 2014, 36, 201–210. [Google Scholar] [CrossRef]
  84. Gupta, S. Effect of different sowing dates on growth and yield attributes of wheat in Udham Singh Nagar district of Uttarakhand, India. Plant Arch. 2017, 17, 232–236. [Google Scholar]
  85. Gebrel, E.E.; Gad, M.A.; Kishk, A.M.S. Effect of sowing dates on potential yield and rust resistance of some wheat cultivars. J. Plant Prod. 2018, 9, 369–375. [Google Scholar] [CrossRef]
  86. Madhu, U.; Begum, M.; Salam, A.; Sarkar, S.K. Influence of sowing date on the growth and yield performance of wheat (Triticum aestivum L.) varieties. Arch. Agric. Environ. Sci. 2018, 3, 89–94. [Google Scholar] [CrossRef]
  87. Pathania, R.; Prasad, R.; Rana, R.S.; Mishra, S.; Sharma, S. Growth and yield of wheat as influenced by dates of sowing and varieties in north western Himalayas. J. Pharmacogn. Phytochem. 2018, 7, 517–520. [Google Scholar]
  88. Tahir, S.; Ahmad, A.; Khaliq, T.; Cheema, M.J.M. Evaluating the impact of seed rate and sowing dates on wheat productivity in semi-arid environment. Int. J. Agric. Biol. 2019, 22, 57–64. [Google Scholar]
  89. Yusuf, M.; Kumar, S.; Dhaka, A.K.; Singh, B.; Bhuker, A. Effect of sowing dates and varieties on yield and quality performance of wheat (Triticum aestivum L.). Agric. Sci. Dig. 2019, 39, 306–310. [Google Scholar] [CrossRef]
  90. Zhou, B.; Sun, X.; Ge, J.; Li, C.; Ding, Z.; Ma, S.; Ma, W.; Zhao, M. Wheat growth and grain yield responses to sowing date-associated variations in weather conditions. Agron. J. 2020, 112, 985–997. [Google Scholar] [CrossRef]
  91. Chen, C.; Neill, K.; Wichman, D.; Westcott, M. Hard red spring wheat response to row spacing, seeding rate, and nitrogen. Agron. J. 2008, 100, 1296–1302. [Google Scholar] [CrossRef]
  92. Budzyński, W.S.; Bepirszcz, K.; Jankowski, K.J.; Dubis, B.; Hłasko-Nasalska, A.; Sokólski, M.M.; Olszewski, J.; Załuski, D. The responses of winter cultivars of common wheat, durum wheat and spelt to agronomic factors. J. Agric. Sci. 2018, 156, 1163–1174. [Google Scholar] [CrossRef]
  93. Lindsey, L.E.; Goodwin, A.W.; Harrison, S.K.; Paul, P.A. Optimum seeding rate and stand assessment of soft red winter wheat. Agron. J. 2020, 112, 4069–4075. [Google Scholar] [CrossRef]
  94. Kondić, D.; Bajić, M.; Hajder, Đ.; Bosančić, B. The rate of productive tillers per plant of winter wheat (Triticum aestivum L.) cultivars under different sowing densities. Agro-Know. J. 2017, 17, 345–357. [Google Scholar] [CrossRef]
  95. Valério, I.P.; Carvalho, F.I.F.; Oliveira, A.C.; Benin, G.; Souza, V.Q.; Machado, A.A.; Bertan, I.; Busato, C.C.; Silveira, G.; Fonseca, D.A.R. Seeding density in wheat genotypes as a function of tillering potential. Sci. Agric. 2009, 66, 28–39. [Google Scholar] [CrossRef]
  96. Mehring, G.H. Determining Optimum Seeding Rates for Diverse Hard Red Spring Wheat (Triticum aestivum L.) Cultivars; North Dakota State University ProQuest Dissertations Publishing: Fargo, ND, USA, 2016; p. 10144681. [Google Scholar]
  97. Sander, G.; da Costa, A.C.T.; Júnior, J.B.D. Agronomic performance of wheat as a function of different spacing and sowing densities in two agricultural years. Afr. J. Agric. Res. 2017, 12, 3099–3105. [Google Scholar]
  98. Khan, A.; Ahmad, A.; Ali, W.; Hussain, S.; Ajayo, B.S.; Raza, M.A.; Kamran, M.; Te, X.; Al Amin, N.; Ali, S. Optimization of plant density and nitrogen regimes to mitigate lodging risk in wheat. Agron. J. 2020, 112, 2535–2551. [Google Scholar] [CrossRef]
  99. Bavec, M.; Bavec, F.; Varga, B.; Kovacevic, V. Relationship among yield, it’s quality and yield components in winter wheat (Triticum aestivum L.) cultivars affected by seeding rates. Die Bodenkult. 2002, 53, 143–151. [Google Scholar]
  100. Bokan, N.; Malešević, M. The planting density effect on wheat yield structure. Acta Agric. Serb. 2004, 9, 65–79. [Google Scholar]
  101. Podolska, G.; Wyzińska, M. The response of new winter wheat cultivars to density and sowing date. Pol. J. Agron. 2011, 6, 44–51. (In Polish) [Google Scholar]
  102. Buczek, J.; Bobrecka-Jamro, D. Response of population and hybrid wheat to diverse sowing rate. Fragm. Agron. 2015, 32, 7–16. (In Polish) [Google Scholar]
  103. Tavares, L.C.V.; Foloni, J.S.S.; Bassoi, M.C.; Prete, C.E.C. Wheat genotypes under different seeding rates. Pesqui. Agropecu. Trop. 2014, 44, 166–174. (In Portuguese) [Google Scholar] [CrossRef]
  104. López-Bellido, L.; López-Bellido, R.J.; Redondo, R. Nitrogen efficiency in wheat under rainfed Mediterranean conditions as affected by split nitrogen application. Field Crop Res. 2005, 94, 86–97. [Google Scholar] [CrossRef]
  105. Budzyński, W.; Bielski, S. The effect of nitrogen fertilization on winter wheat yields. Fragm. Agron. 2008, 25, 27–38. (In Polish) [Google Scholar]
  106. Brzozowska, I.; Brzozowski, J.; Hruszka, M. Yielding and yield structure of winter wheat in dependence on methods of crop culivation and nitrogen fertilisation. Acta Agropys. 2008, 11, 597–611. (In Polish) [Google Scholar]
  107. Ferrari, M.; Szareski, V.J.; Nardino, M.; de Pelegrin, A.J.; Carvalho, I.R.; de Souza, V.Q. Effects of sources and split application of nitrogen fertilizer on wheat genotypes performance. Aust. J. Crop Sci. 2016, 11, 1669–1674. [Google Scholar] [CrossRef]
  108. Tester, M.; Langridge, P. Breeding technologies to increase crop production in a changing world. Science 2010, 327, 818–822. [Google Scholar] [CrossRef]
  109. Jan, A.; Hamid, I.; Muhammad, T. Seed rates and sowing dates effect on the performance of wheat variety Bakhtawar–92. Pak. J. Biol. Sci. 2000, 3, 1409–1411. [Google Scholar]
  110. Hussain, S.; Khaliq, A.; Bajwa, A.A.; Matloob, A.; Areeb, A.; Ashraf, U.; Hafeez, A.; Imran, M. Crop growth and yield losses in wheat due to little seed canary grass infestation differ with weed densities and changes in environment. Planta Daninha 2017, 35, e017162328. [Google Scholar] [CrossRef]
  111. Kaur, C. Performance of wheat varieties under late and very late sowing conditions. Int. J. Curr. Microbiol. Appl. Sci. 2017, 6, 3488–3492. [Google Scholar] [CrossRef]
  112. Garg, D.; Sareen, S.; Dalal, S.; Tiwari, R.; Singh, R. Grain filling duration and temperature pattern influence on the performance of wheat genotypes under late planting. Cereal Res. Commun. 2013, 41, 500–507. [Google Scholar] [CrossRef]
  113. Bailey–Serres, J.; Parker, J.E.; Ainsworth, E.A.; Oldroyd, G.E.D.; Schroeder, J.I. Genetic strategies for improving crop yields. Nature 2019, 575, 109–118. [Google Scholar] [CrossRef]
  114. Dubey, R.; Pathak, H.; Singh, S.; Chakravarti, B.; Thakur, A.K.; Fagodia, R.K. Impact of sowing dates on terminal heat tolerance of different wheat (Triticum aestivum L.) cultivars. Acad. Sci. Lett. 2019, 42, 445–449. [Google Scholar] [CrossRef]
  115. Ali, M.; Ali, L.; Sattar, M.; Ali, M.A. Improvement in wheat (Triticum aestivum L.) yield by manipulating seed rate and row spacing in Vehari zone. J. Anim. Plant Sci. 2010, 20, 225–230. [Google Scholar]
  116. Prey, L.; Germer, M.; Schmidhalter, U. Temporal and organ-specific responses in NUE traits to N fertilization, fungicide intensity and early sowing in winter wheat cultivars. Agronomy 2019, 9, 313. [Google Scholar] [CrossRef]
  117. Oleksiak, T. Effect of sowing date on winter wheat yields in Poland. J. Cent. Eur. Agric. 2014, 15, 83–99. [Google Scholar] [CrossRef]
  118. Paymard, P.; Bannayan, M.; Haghighi, R.S. Analysis of the climate change effect on wheat production systems and investigate the potential of management strategies. Nat. Hazards 2018, 91, 1237–1255. [Google Scholar] [CrossRef]
  119. Ding, D.; Feng, H.; Zhao, Y.; He, J.; Zou, Y.; Jin, J. Modifying winter wheat sowing date as an adaptation to climate change on the Loess Plateau. Agron. J. 2016, 108, 53–63. [Google Scholar] [CrossRef]
  120. Donaldson, E.; Schillinger, W.F.; Dofing, S.M. Straw production and grain yield relationships in winter wheat. Crop Sci. 2001, 41, 100–106. [Google Scholar] [CrossRef]
  121. Moustafa, A.T.H.; El-Sawi, S.A. Influence of sowing date on development, harvest index and yield components for bread wheat cultivars having different thermal responses in middle Egypt. J. Plant Prod. 2014, 5, 211–226. [Google Scholar] [CrossRef]
  122. Shirinzadeh, A.; Abad, H.H.S.; Nourmohammadi, G.; Harvan, E.M.; Madani, H. Effect of planting date on growth periods, yield, and yield components of some bread wheat cultivars in Parsabad Moghan. Int. J. Farm. Allied Sci. 2017, 6, 109–119. [Google Scholar]
  123. Acharya, R.; Marahatta, S.; Amgain, L.P. Response of wheat cultivars in different agricultural practices differed by sowing date. Int. J. Appl. Sci. Biotechnol. 2017, 5, 250–255. [Google Scholar] [CrossRef]
  124. Singh, Y.P.; Singh, S.; Dhangrah, V.K.; Mishra, T. Effects of sowing dates on yield and yield components of different varieties of wheat (Triticum aestivum L.) in western Uttar Pradesh. Int. J. Econ. Plants 2021, 8, 188–192. [Google Scholar] [CrossRef]
  125. Slafer, G.A.; Savin, R.; Sadras, V.O. Coarse and fine regulation of wheat yield components in response to genotype and environment. Field Crops Res. 2014, 157, 71–83. [Google Scholar] [CrossRef]
  126. Rozbicki, J.; Ceglińska, A.; Gozdowski, D.; Jakubczak, M.; Cacak-Pietrzak, G.; Mądry, W.; Golba, J.; Piechociński, M.; Sobczyński, G.; Studnicki, M.; et al. Influence of the cultivar, environment and management on the grain yield and bread-making quality in the winter wheat. J. Cereal Sci. 2015, 61, 126–132. [Google Scholar] [CrossRef]
  127. Aćin, V. Sowing Dates and Densities in a Function of Winter Wheat Yield in the Long-Term Field Trial. Ph.D. Thesis, University of Novi Sad, Faculty of Agriculture, Novi Sad, Serbia, 2016. (In Serbian). [Google Scholar]
  128. Dubis, B.; Budzyński, W. Response of winter wheat to the date and density of sowing. Acta Sci. Pol. Agric. 2006, 5, 15–24. (In Polish) [Google Scholar]
  129. Ahmadi, G.H.; Kahrizi, D.; Mohammadi, G.; Shirkhani, A. Effects of sowing density on yield and yield components of irrigated bread wheat cultivars. Agric. Food Sci. 2011, 5, 91–95. [Google Scholar]
  130. Gross, T.F.; Dias, A.R.; Kappes, C.; Schiebelbein, L.M.; Anselmo, J.L.; Holanda, H.V. Productive performance of wheat in different sowing methods and densities. Sci. Agrar. Parana. 2012, 11, 50–60. (In Portuguese) [Google Scholar]
  131. Teixeira Filho, M.C.M.; Buzetti, S.; Alvarez, R.; de Freitas, J.G.; Arf, O.; de Sá, M.E. Response of wheat cultivars to plant population and nitrogen fertilization in a cerrado region. Científica 2008, 36, 97–106. (In Portuguese) [Google Scholar]
  132. El-Metwally, E.A.; Mekkei, M.E.R.; El-Salam, A.; Abo Shama, H.M. Effect of some mineral and bio fertilization treatments on yield and yield components of bread wheat under two seeding rates. J. Plant Prod. 2018, 9, 733–738. [Google Scholar] [CrossRef]
  133. Staggenborg, S.; Whitney, D.; Fjell, D.; Shroyer, J. Seeding and nitrogen rates required to optimize winter wheat yields following grain sorghum and soybean. Agron. J. 2003, 95, 253–259. [Google Scholar] [CrossRef]
  134. Kristó, I.; Gyuris, K.; Torma, M.; Hódi-Szél, M.; Petróczi, I.M. Investigation of sowing date and seeding rate on the yield of winter wheat. Cereal Res. Commun. 2007, 35, 685–688. [Google Scholar] [CrossRef]
  135. Hu, C.; Zheng, C.; Sadras, V.O.; Ding, M.; Yang, X.; Zhang, S. Effect of straw mulch and seeding rate on the harvest index, yield and water use efficiency of winter wheat. Sci. Rep. 2018, 8, 8167. [Google Scholar] [CrossRef]
  136. Farooq, U.; Khan, E.A.; Khakwani, A.A.; Ahmed, S.; Ahmed, N.; Zaman, G. Impact of sowing time and seeding density on grain yield of wheat variety Gomal-08. Asian J. Agric. Biol. 2016, 2, 38–44. [Google Scholar]
  137. Abd El-Lattief, E.A. Determining the optimization seeding rate for improved productivity of wheat under Southern Egypt conditions. Int. J. Agron. Agric. Res. 2014, 4, 47–57. [Google Scholar]
  138. Porker, K.; Straight, M.; Hunt, J.R. Evaluation of G×E×M interactions to increase harvest index and yield of early sown wheat. Front. Plant Sci. 2020, 11, 994. [Google Scholar] [CrossRef]
  139. Hussain, S.; Sajjad, A.; Hussain, M.I.; Saleem, M. Growth and yield response of three wheat varieties to different seeding densities. Int. J. Agric. Biol. 2001, 3, 228–229. [Google Scholar]
  140. Dalia, A.A.; Hag, D.A.E. Effect of seeding rates on yield and yield components of two bread wheat cultivars. J. Agric. Res. 2016, 42, 71–81. [Google Scholar]
  141. Basso, B.; Cammarano, D.; Fiorentino, C.; Ritchie, J.T. Wheat yield response to spatially variable nitrogen fertilizer in Mediterranean environment. Eur. J. Agron. 2013, 51, 65–70. [Google Scholar] [CrossRef]
  142. Vogeler, I.; Jensen, J.L.; Thomsen, I.K.; Labouriau, R.; Hansen, E.M. Fertiliser N rates interact with sowing time and catch crops in cereals and affect yield and nitrate leaching. Eur. J. Agron. 2021, 124, 126244. [Google Scholar] [CrossRef]
  143. Saint Pierre, C.; Peterson, C.J.; Ross, A.S.; Ohm, J.B.; Verhoeven, M.C.; Larson, M.; Hoefer, B. White wheat grain quality changes with genotype, nitrogen fertilization, and water stress. Agron. J. 2008, 100, 414–420. [Google Scholar] [CrossRef]
  144. Harasim, E.; Wesołowski, M.; Kwiatkowski, C.; Harasim, P.; Staniak, M.; Feledyn-Szewczyk, B. The contribution of yield components in determining the productivity of winter wheat (Triticum aestivum L.). Acta Agrobot. 2016, 69, 1675. [Google Scholar] [CrossRef]
  145. Sieling, K.; Stahl, C.; Winkelmann, C.; Christen, O. Growth and yield of winter wheat in the first 3 years of a monoculture under varying N fertilization in NW Germany. Eur. J. Agron. 2005, 22, 71–84. [Google Scholar] [CrossRef]
  146. Shekoofa, A.; Emam, Y. Effects of nitrogen fertilization and plant growth regulators (PGRs) on yield of wheat (Triticum aestivum L.) cv. Shiraz. J. Agric. Sci. Technol. 2010, 10, 101–108. [Google Scholar]
  147. Xue, H.; Han, Y.; Li, Y.; Wang, G.; Feng, L.; Fan, Z.; Du, W.; Yang, B.; Cao, C.; Mao, S. Spatial distribution of light interception by different plant population densities and its relationship with yield. Field Crop. Res. 2015, 184, 17–27. [Google Scholar] [CrossRef]
  148. Hu, C.; Sadras, V.O.; Lu, G.; Zhang, P.; Han, Y.; Liu, L.; Xie, J.; Yang, X.; Zhang, S. A global meta-analysis of split nitrogen application for improved wheat yield and grain protein content. Soil Tillage Res. 2021, 213, 105111. [Google Scholar] [CrossRef]
  149. Pisarek, M.; Rozbicki, J.; Samborski, S.; Wawryło, B.; Golba, J. Effect of seven agronomic factors on winter wheat productivity cultivating in condition of an excessive share of cereals in crop rotation. Part II. Grain yield and it’s components. Fragm. Agron. 2013, 30, 113–120. (In Polish) [Google Scholar]
  150. Sedlář, O.; Balík, J.; Černý, J.; Peklová, L.; Kulhánek, M. Nitrogen uptake by winter wheat (Triticum aestivum L.) depending on fertilizer application. Cereal Res. Commun. 2015, 43, 515–524. [Google Scholar] [CrossRef]
  151. Belete, F.; Dechassa, N.; Molla, A.; Tana, T. Effect of split application of different N rates on productivity and nitrogen use efficiency of bread wheat (Triticum aestivum L.). Agric. Food Secur. 2018, 7, 92. [Google Scholar] [CrossRef]
  152. Školníková, M.; Škarpa, P.; Ryant, P.; Kozáková, Z.; Antošovský, J. Response of winter wheat (Triticum aestivum L.) to fertilizers with nitrogen-transformation inhibitors and timing of their application under field conditions. Agronomy 2022, 12, 223. [Google Scholar] [CrossRef]
  153. Zhang, Z.; Zhang, Y.; Shi, Y.; Yu, Z. Optimized split nitrogen fertilizer increases photosynthesis, grain yield, nitrogen use efficiency, and water use efficiency under water-saving irrigation. Sci. Rep. 2020, 10, 20310. [Google Scholar] [CrossRef]
  154. Zain, M.; Si, Z.; Li, S.; Gao, Y.; Mehmood, F.; Rahman, S.U.; Hamani, A.K.M.; Duan, A. The coupled effects of irrigation scheduling and nitrogen fertilization mode on growth, yield, and water use efficiency in drip-irrigated winter wheat. Sustainability 2021, 13, 2742. [Google Scholar] [CrossRef]
  155. Abubakar, S.A.; Hamani, A.K.M.; Chen, J.; Traore, A.; Abubakar, N.A.; Usman Ibrahim, A.; Duan, A. Optimized drip fertigation scheduling improves nitrogen productivity of winter wheat in the North China Plain. J. Soil Sci. Plant Nutr. 2022, 22, 2955–2968. [Google Scholar] [CrossRef]
  156. Hamani, A.K.M.; Abubakar, S.A.; Si, Z.; Kama, R.; Gao, Y.; Duan, A. Responses of grain yield and water-nitrogen dynamic of drip-irrigated winter wheat (Triticum aestivum L.) to different nitrogen fertigation and water regimes in the North China Plain. Agric. Water Manag. 2023, 288, 108494. [Google Scholar] [CrossRef]
  157. Pisarek, M.; Rozbicki, J.; Samborski, S.; Wawryło, B.; Golba, J. Effect of seven agronomic factors on winter wheat productivity cultivating in condition of an excessive share of cereals in crop rotation. Part I. Yield of aboveground biomass, nitrogen nutrition index and infection rate of root rot. Fragm. Agron. 2013, 30, 99–112. (In Polish) [Google Scholar]
  158. Akhter, S.; Kotru, R.; Lone, B.A.; Jan, R. Effect of split application of potassium and nitrogen on wheat (Triticum aestivum) growth and yield under temperate Kashmir. Indian J. Agron. 2017, 62, 49–53. [Google Scholar]
Figure 1. Average monthly temperature (°C) and total monthly rainfall (mm) during the growing season of winter wheat in 2018–2021 and the long-term average (1981–2015) at the experimental site.
Agriculture 14 00442 g001
Figure 2. The effect of sowing date on the number of winter wheat plants in stages (a) BBCH 12–13, and (b) BBCH 22–25 (2018/2019, 2019/2020, 2020/2021; mean for sowing density and split spring N rate). Early: 3–6 September; delayed (+14 days): 17–20 September; delayed (+28 days): 1–4 October. Means with the same letters do not differ significantly at p ≤ 0.05 in Tukey’s test.
Agriculture 14 00442 g002
Figure 3. The effect of (a) sowing date and (b) split spring N rate on the number of shoots per plant of winter wheat (2018/2019, 2019/2020, 2020/2021; (a): mean for sowing density and split spring N rate; (b) mean for sowing date and sowing density). The number of shoots per plant was counted before the second application of N fertilizer. Early: 3–6 September; delayed (+14 days): 17–20 September; delayed (+28 days): 1–4 October. Means with the same letters do not differ significantly at p ≤ 0.05 in Tukey’s test.
Agriculture 14 00442 g003
Figure 4. The effect of sowing date on the number of shoots m−2 in BBCH stage 29 of winter wheat (2018/2019, 2019/2020, 2020/2021; mean for sowing density and split spring N rate). Early: 3–6 September; delayed (+14 days): 17–20 September; delayed (+28 days): 1–4 October. Means with the same letters do not differ significantly at p ≤ 0.05 in Tukey’s test.
Agriculture 14 00442 g004
Figure 5. The effect of sowing date on the number of winter wheat spikes m−2 (2018/2019, 2019/2020, 2020/2021; mean for sowing density and split spring N rate). Early: 3–6 September; delayed (+14 days): 17–20 September; delayed (+28 days): 1–4 October. Means with the same letters do not differ significantly at p ≤ 0.05 in Tukey’s test.
Agriculture 14 00442 g005
Figure 6. The effect of sowing date on the number of grains spike−1 in winter wheat (2018/2019, 2019/2020, 2020/2021; mean for sowing density and split spring N rate). Early: 3–6 September; delayed (+14 days): 17–20 September; delayed (+28 days): 1–4 October. Means with the same letters do not differ significantly at p ≤ 0.05 in Tukey’s test.
Agriculture 14 00442 g006
Figure 7. The effect of (a) sowing date and (b) sowing density on the grain yield of winter wheat (2018/2019, 2019/2020, 2020/2021; (a) mean for sowing density and split spring N rate; (b) mean for sowing date and split spring N rate). Early: 3–6 September; delayed (+14 days): 17–20 September; delayed (+28 days): 1–4 October. Means with the same letters do not differ significantly at p ≤ 0.05 in Tukey’s test.
Agriculture 14 00442 g007
Figure 8. The effect of sowing date on the straw yield of winter wheat (2018/2019, 2019/2020, 2020/2021; mean for sowing density and split spring N rate). Early: 3–6 September; delayed (+14 days): 17–20 September; delayed (+28 days): 1–4 October. Means with the same letters do not differ significantly at p ≤ 0.05 in Tukey’s test.
Agriculture 14 00442 g008
Figure 9. The effect of sowing date and sowing density on the straw yield of winter wheat (2018/2019, 2019/2020, 2020/2021; mean for sowing date and split spring N rate). Early: 3–6 September; delayed (+14 days): 17–20 September; delayed (+28 days): 1–4 October. Means with the same letters do not differ significantly at p ≤ 0.05 in Tukey’s test.
Agriculture 14 00442 g009
Figure 10. The effect of sowing date on the harvest index of winter wheat (2018/2019, 2019/2020, 2020/2021; mean for sowing density and split spring N rate). Early: 3–6 September; delayed (+14 days): 17–20 September; delayed (+28 days): 1–4 October. Means with the same letters do not differ significantly at p ≤ 0.05 in Tukey’s test.
Agriculture 14 00442 g010
Table 1. F-test statistics in ANOVA of plant density, tillering, grain yield components, biomass yield, and the harvest index.
TraitPlants m−2 (BBCH 12–13)Plants m−2 (BBCH 22–25)Shoots Plant−1 (BBCH 29)Shoots m−2 (BBCH 29)Spikes m−2Grains Spike−11000-Grain Weight (g)Grain Yield
(Mg ha−1)
Straw Yield
(Mg ha−1)
Harvest Index
Y11.086 **10.515 **32.657 **9.677 **179.406 **83.788 **101.954 **256.557 **46.733 **11.226 **
SDE5.938 **5.310 **22.008 **32.784 **29.615 **0.893 ns6.377 **115.474 **3.745 *9.994 **
SDY101.444 **93.057 **3.913 *68.407 **22.660 **15.478 **0.647 ns3.702 *3.602 *0.047 ns
N0.025 ns0.030 ns3.542 *3.475 *3.382 *0.191 ns0.547 ns3.100 *0.892 ns0.261 ns
Y × SDE8.551 **7.932 **12.085 **14.453 **22.752 **3.724 **1.372 ns28.858 **4.696 **4.245 **
Y × SDY0.220 ns0.231 ns2.282 ns0.541 ns2.408 ns1.268 ns2.197 ns3.125 *0.499 ns0.941 ns
Y × N0.050 ns0.040 ns3.750 **2.862 ns1.636 ns1.886 ns0.430 ns0.686 ns0.496 ns0.154 ns
SDE × SDY0.820 ns0.758 ns0.512 ns1.039 ns1.821 ns0.662 ns0.867 ns1.950 ns6.093 **0.511 ns
SDE × N0.040 ns0.032 ns0.219 ns0.184 ns2.325 ns0.793 ns1.992 ns0.906 ns1.094 ns0.155 ns
SDY × N0.022 ns0.015 ns0.211 ns0.240 ns0.380 ns0.286 ns0.377 ns0.800 ns0.526 ns0.313 ns
Y × SDE × SDY1.948 ns1.829 ns1.822 ns1.859 ns0.893 ns0.772 ns0.756 ns0.414 ns1.707 ns0.889 ns
Y × SDE × N0.036 ns0.041 ns0.142 ns0.188 ns0.945 ns0.352 ns0.488 ns0.381 ns0.245 ns0.094 ns
Y × SDY × N0.030 ns0.028 ns0.227 ns0.135 ns1.805 ns1.853 ns0.096 ns0.343 ns0.266 ns0.082 ns
SDE × SDY × N0.032 ns0.044 ns0.352 ns0.209 ns1.151 ns0.771 ns0.805 ns0.191 ns0.623 ns0.630 ns
Y × SDE × SDY × N0.040 ns0.039 ns0.280 ns0.256 ns1.155 ns0.781 ns0.558 ns0.181 ns0.388 ns0.444 ns
* significant p ≤ 0.05; ** significant p ≤ 0.01; ns—not significant; Y—growing season; SDE—sowing date; SDY—sowing density; N—split spring N rate.
Table 2. Plant density and tillering of winter wheat.
ParameterPlants m−2Shoots Plant−1
(BBCH 29)
Shoots m−2
(BBCH 29)
BBCH 12–13BBCH 22–25
Growing season
2018/2019257 b254 b5.0 b1268 b
2019/2020319 a316 a3.9 c1232 b
2020/2021285 b282 b5.4 a1491 a
Sowing date, mean for 2018–2021
Early299 a295 a5.4 a1560 a
Delayed (+14 days)301 a298 a4.7 b1380 b
Delayed (+28 days)261 b258 b4.1 c1051 c
Sowing density (live grains m−2), mean for 2018–2021
200193 c191 c5.0 a959 c
300286 b283 b4.7 ab1326 b
400381 a377 a4.5 b1705 a
Split spring N rate (kg ha−1), mean for 2018–2021 †
40 + 1002872844.5 b1272 b
70 + 702852824.6 ab1292 ab
100 + 402882865.0 a1427 a
† BBCH 22–25 + BBCH 30–31. Plant density and the number of shoots per plant were determined in spring before the second application of N fertilizer. Early: 3–6 September; delayed (+14 days): 17–20 September; delayed (+28 days): 1–4 October. Means with the same letters do not differ significantly at p ≤ 0.05 in Tukey’s test. Means without letters indicate that the main effect is not significant.
Table 3. Yield components of winter wheat.
ParameterSpikes m−2Grains Spike−11000-Grain Weight (g)
Growing season
2018/2019538 a43.7 c45.53 b
2019/2020507 b45.4 b47.76 a
2020/2021406 c51.5 a43.39 c
Sowing date, mean for 2018–2021
Early452 b47.344.95 c
Delayed (+14 days)504 a46.545.72 b
Delayed (+28 days)495 a46.746.01 a
Sowing density (live grains m−2), mean for 2018–2021
200456 b48.8 a45.60
300492 a46.3 b45.37
400503 a45.4 b45.71
Split spring N rate (kg ha−1), mean for 2018–2021 †
40 + 100477 b46.845.63
70 + 70479 ab47.145.67
100 + 40495 a46.745.38
† BBCH 22–25 + BBCH 30–31; Early: 3–6 September; delayed (+14 days): 17–20 September; delayed (+28 days): 1–4 October. Means with the same letters do not differ significantly at p ≤ 0.05 in Tukey’s test. Means without letters indicate that the main effect is not significant.
Table 4. Biomass yield and the harvest index of winter wheat.
ParameterGrain Yield (Mg ha−1)Straw Yield (Mg ha−1)Harvest Index
Growing season
2018/201910.57 b6.78 a0.61 b
2019/202010.90 a5.89 b0.65 a
2020/20218.99 c5.28 c0.64 a
Sowing date, mean for 2018–2021
Early9.36 b6.10 a0.61 b
Delayed (+14 days)10.58 a6.11 a0.64 a
Delayed (+28 days)10.52 a5.74 b0.65 a
Sowing density (live grains m−2), mean for 2018–2021
20010.02 b5.870.64
30010.19 ab6.070.64
40010.25 a6.010.63
Split spring N rate (kg ha−1), mean for 2018–2021 †
40 + 10010.03 b6.23 a0.63
70 + 7010.17 ab5.87 b0.63
100 + 4010.25 a5.86 b0.63
† BBCH 22–25 + BBCH 30–31; Early: 3–6 September; delayed (+14 days): 17–20 September; delayed (+28 days): 1–4 October; Means with the same letters do not differ significantly at p ≤ 0.05 in Tukey’s test. Means without letters indicate that the main effect is not significant.
Disclaimer/Publisher’s Note: The statements, opinions and data contained in all publications are solely those of the individual author(s) and contributor(s) and not of MDPI and/or the editor(s). MDPI and/or the editor(s) disclaim responsibility for any injury to people or property resulting from any ideas, methods, instructions or products referred to in the content.

