

Mapping Paddy Rice in Rice–Wetland Coexistence Zone by Integrating Sentinel-1 and Sentinel-2 Data
 , , and
Abstract
1. Introduction
2. Materials and Methods
2.1. Study Area
2.2. Data Sources
2.2.1. Remote Sensing Data
2.2.2. Validation Data
2.2.3. Other Land Cover Datasets Used for Comparison
- (1)
- Selected Land Cover Classification Data Products. Various typical land cover classification data products were chosen to ensure consistency in the classification results. World Cover Dataset: Developed collaboratively by the European Space Agency (ESA) and several global research institutions, this dataset offers land cover data at 10-m resolution with a producer’s accuracy of 75%. It spans the years 2020 and 2021, defined using the Land Cover Classification System (LCCS) by the Food and Agriculture Organization (FAO) of the United Nations. It encompasses 11 categories such as forests, shrubs, Wetland vegetation, croplands, buildings, deserts, snow and glaciers, water bodies, wetlands, mangroves, and lichens/mosses [30].
- (2)
- GLC_FCS30 Dataset. Developed by the team of Liangyun Liu at the Aerospace Information Research Institute of the Chinese Academy of Sciences. This dataset provides a detailed global land surface cover classification product at 30 m resolution. It boasts an overall accuracy of 82.5%. It is based on the dynamic monitoring of global land cover from 1985 to 2020 using all available land satellite data, updated every 5 years, and consists of 29 categories [31].
- (3)
- Single Rice Planting Distribution Dataset at 10-Meter Resolution. Created using a time-weighted dynamic time planning method in conjunction with optical remote sensing data and synthetic aperture radar data for the years 2017–2022. It achieves average user’s accuracy, producer’s accuracy, and overall accuracy of 73.08%, 82.81%, and 85.23%, respectively, across all provincial-level administrative regions [32].
- (4)
- Double Rice Planting Distribution Dataset from 2016 to 2020. Constructed based on Sentinel-1 remote sensing data and phenology identification methods. The overall accuracy ranges between 88.07% and 95.97% for early rice and 88.25% and 95.68% for late-season rice [33].
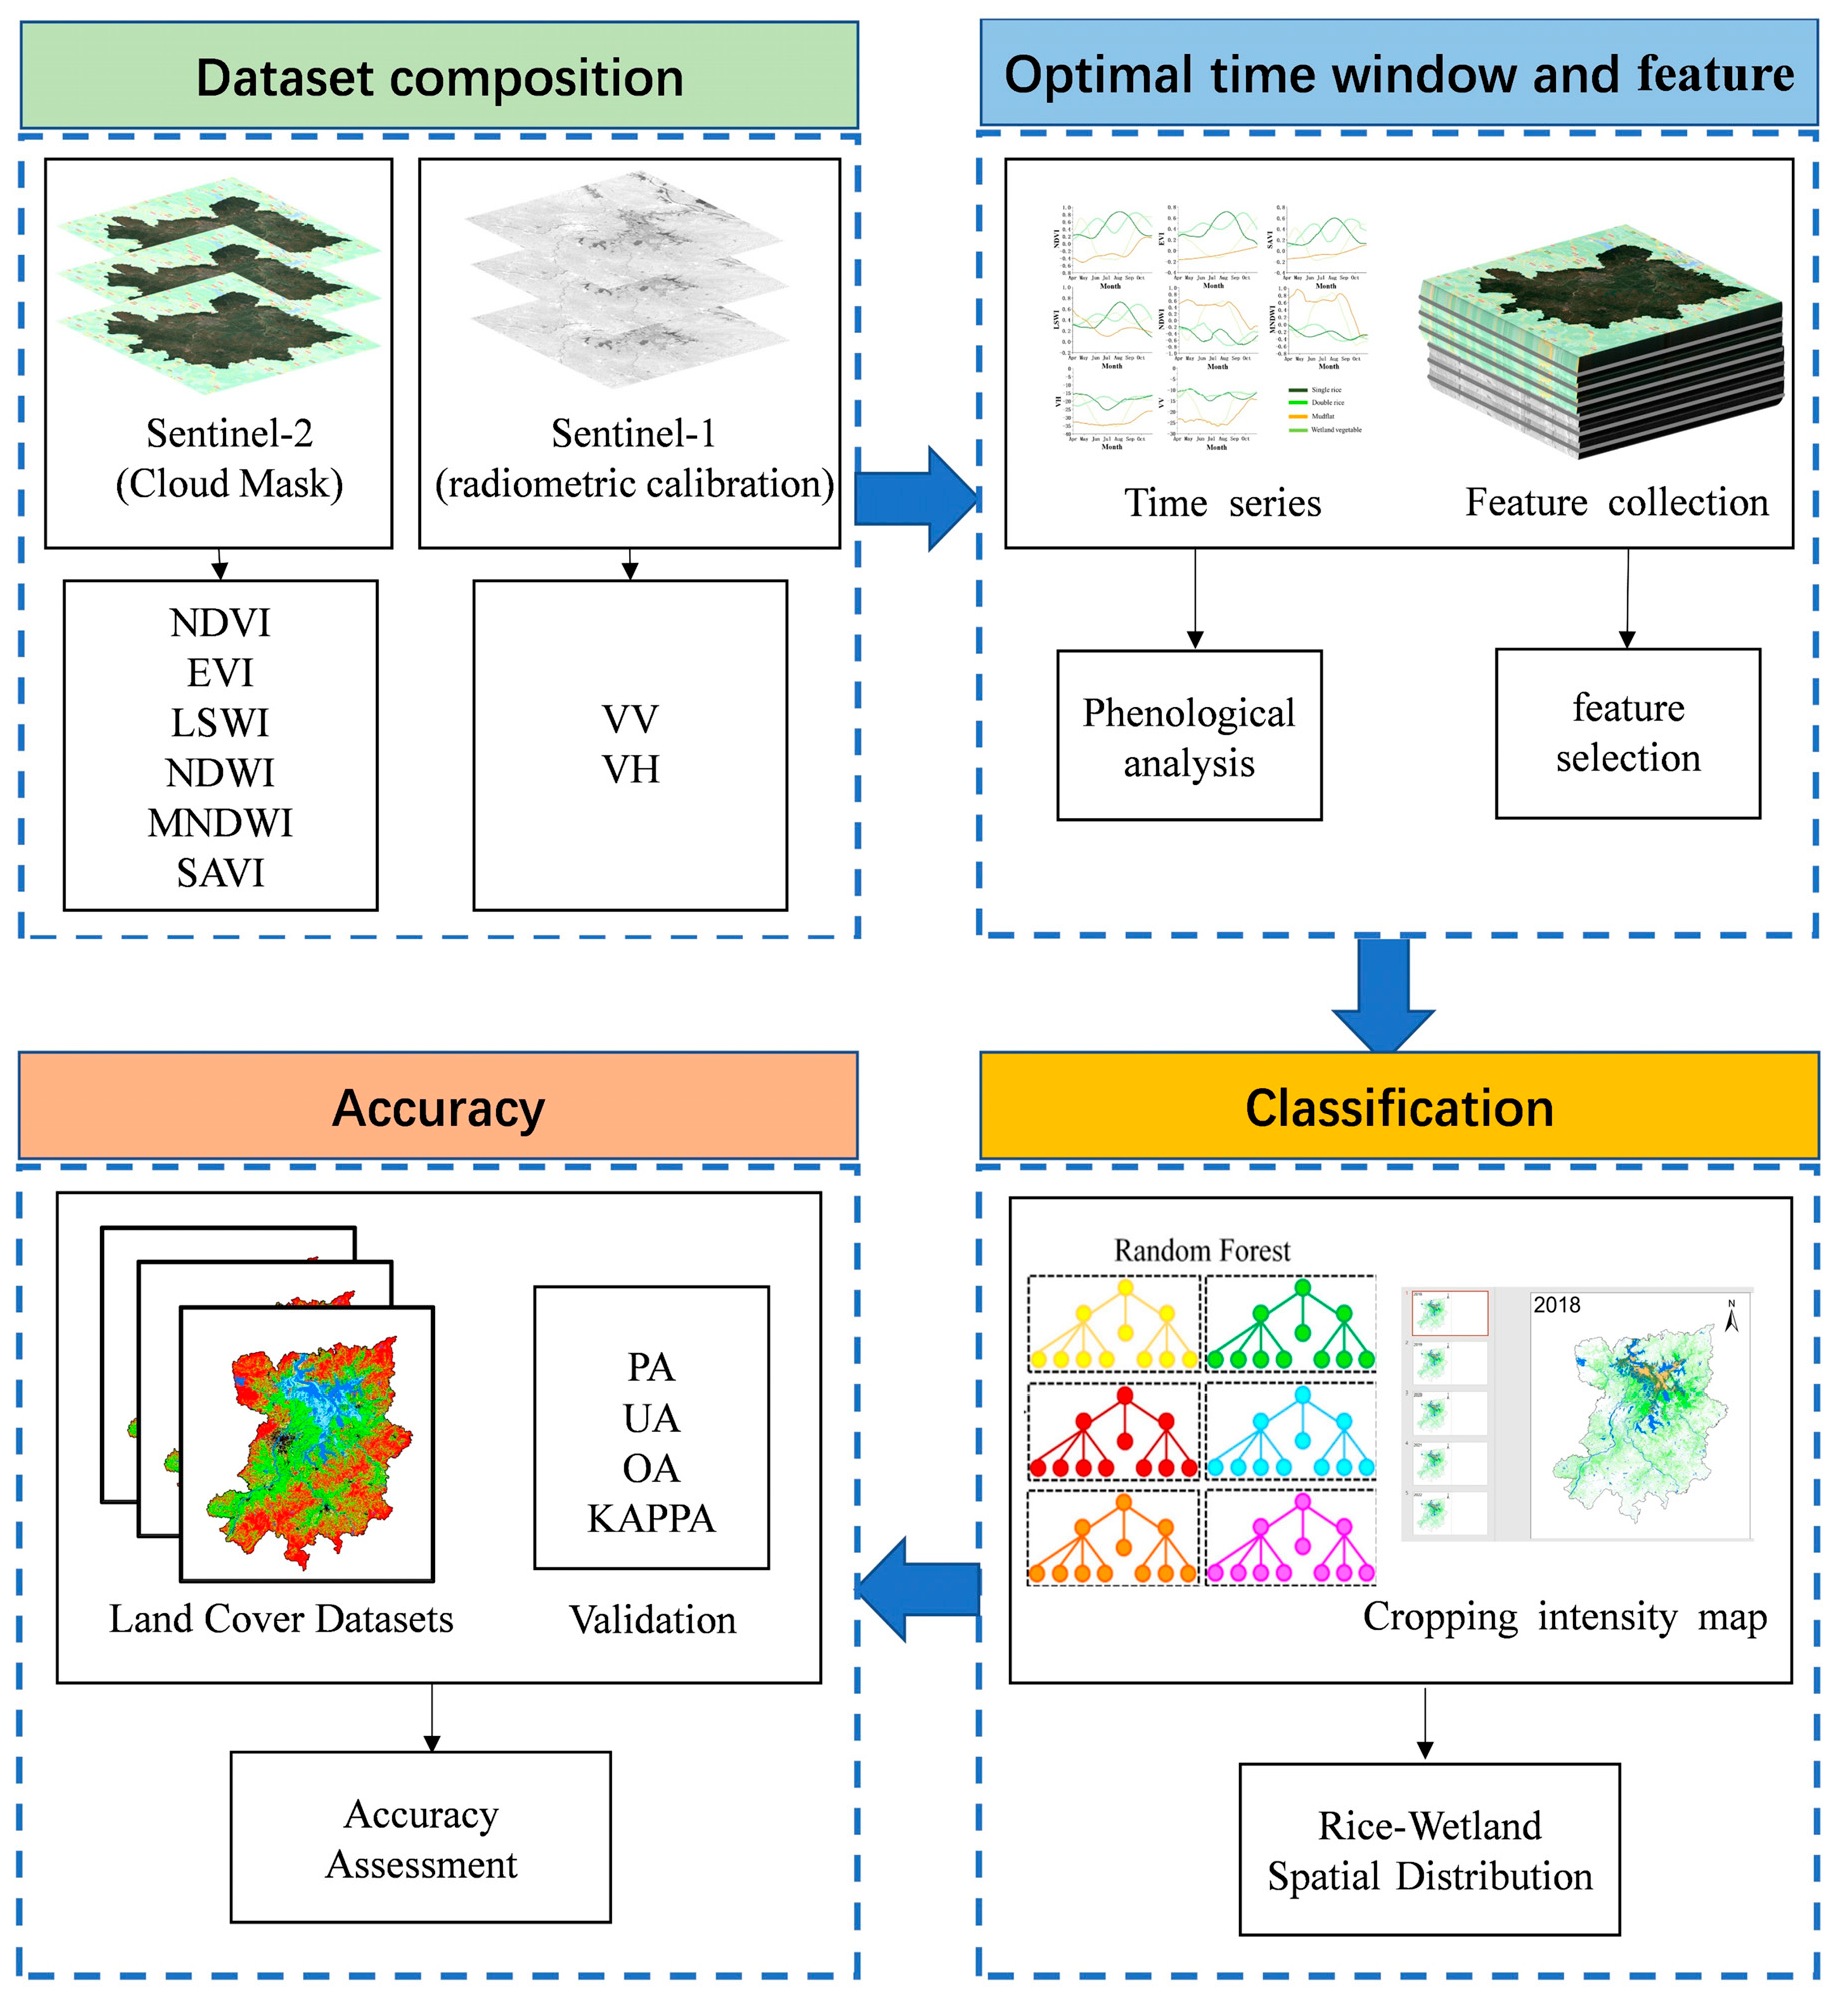
2.3. Machine Learning Classification Method Integrating Phenology and Active-Passive Remote Sensing
2.3.1. Constructing Vegetation Indices and Moisture Indices
2.3.2. Key Phenological Windows for Paddy Rice and Wetland
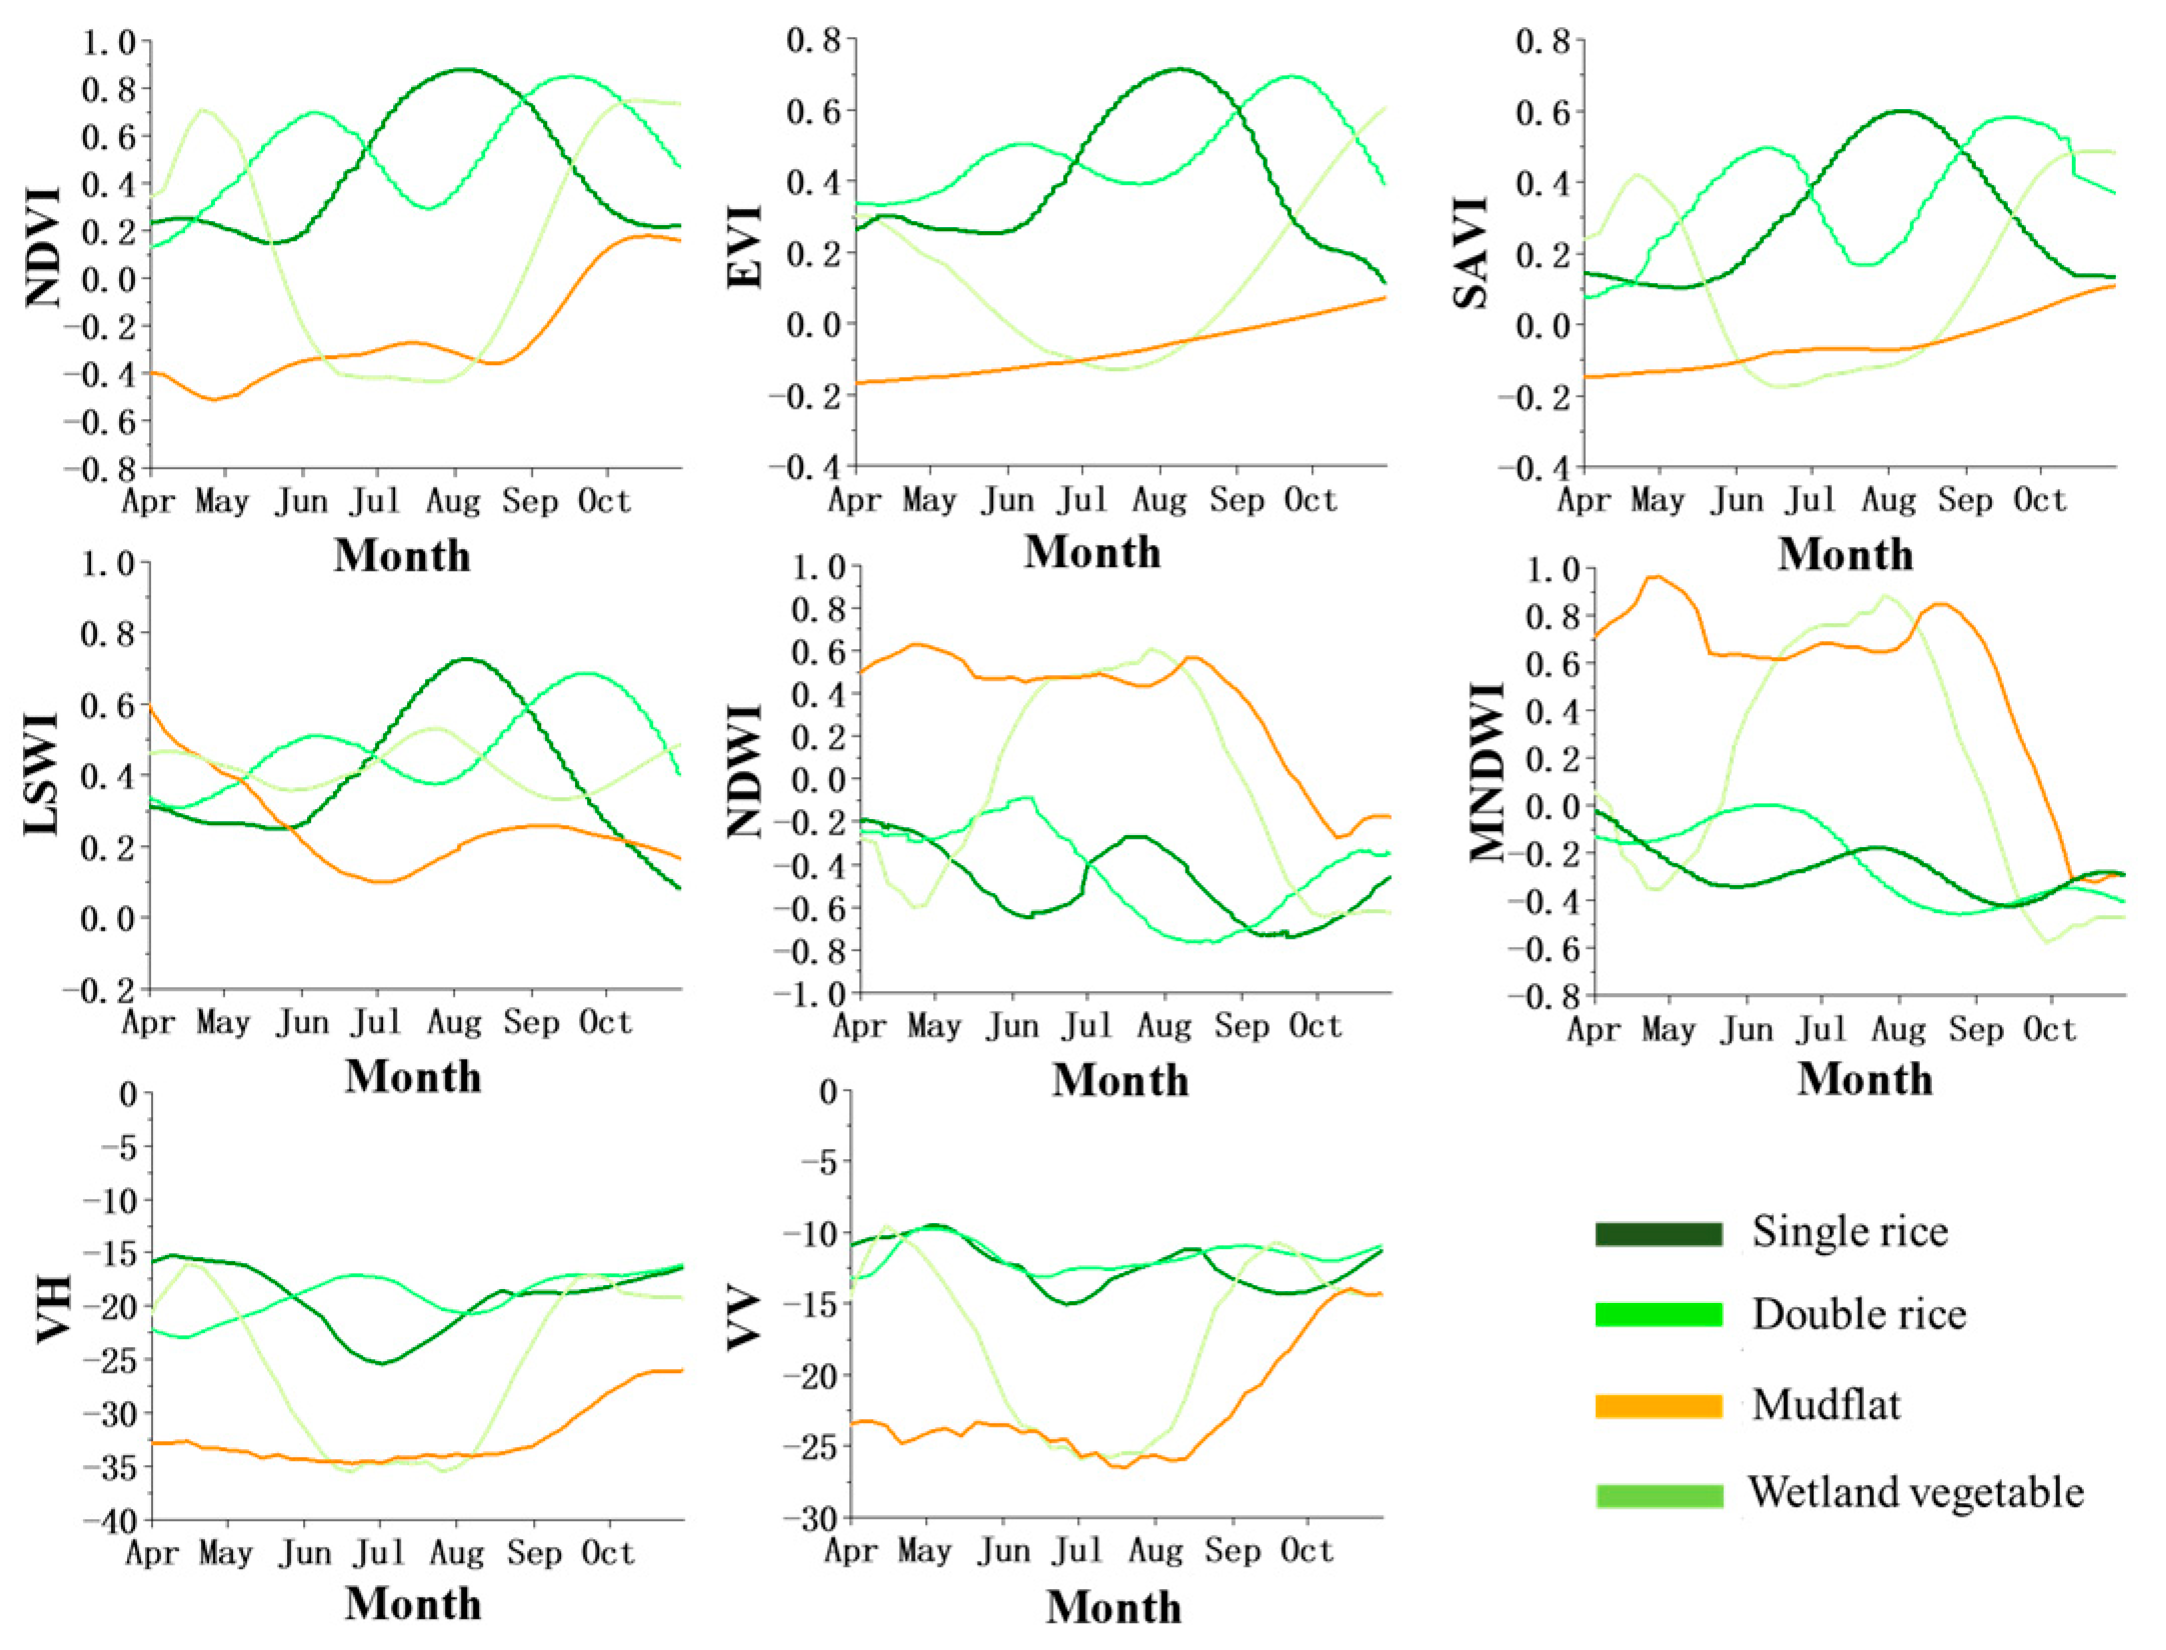
2.3.3. Monthly Variations of Spectral Indices and Backscattering Coefficients
2.3.4. Optimal Classification Feature Data Set
2.3.5. Machine Learning Algorithms and Design of Experimental Plan
2.3.6. Accuracy Assessment
3. Results
3.1. Optimization Results of Classification Feature Parameters
3.2. Accuracy Assessment of Land Cover Identification in Poyang Lake Basin
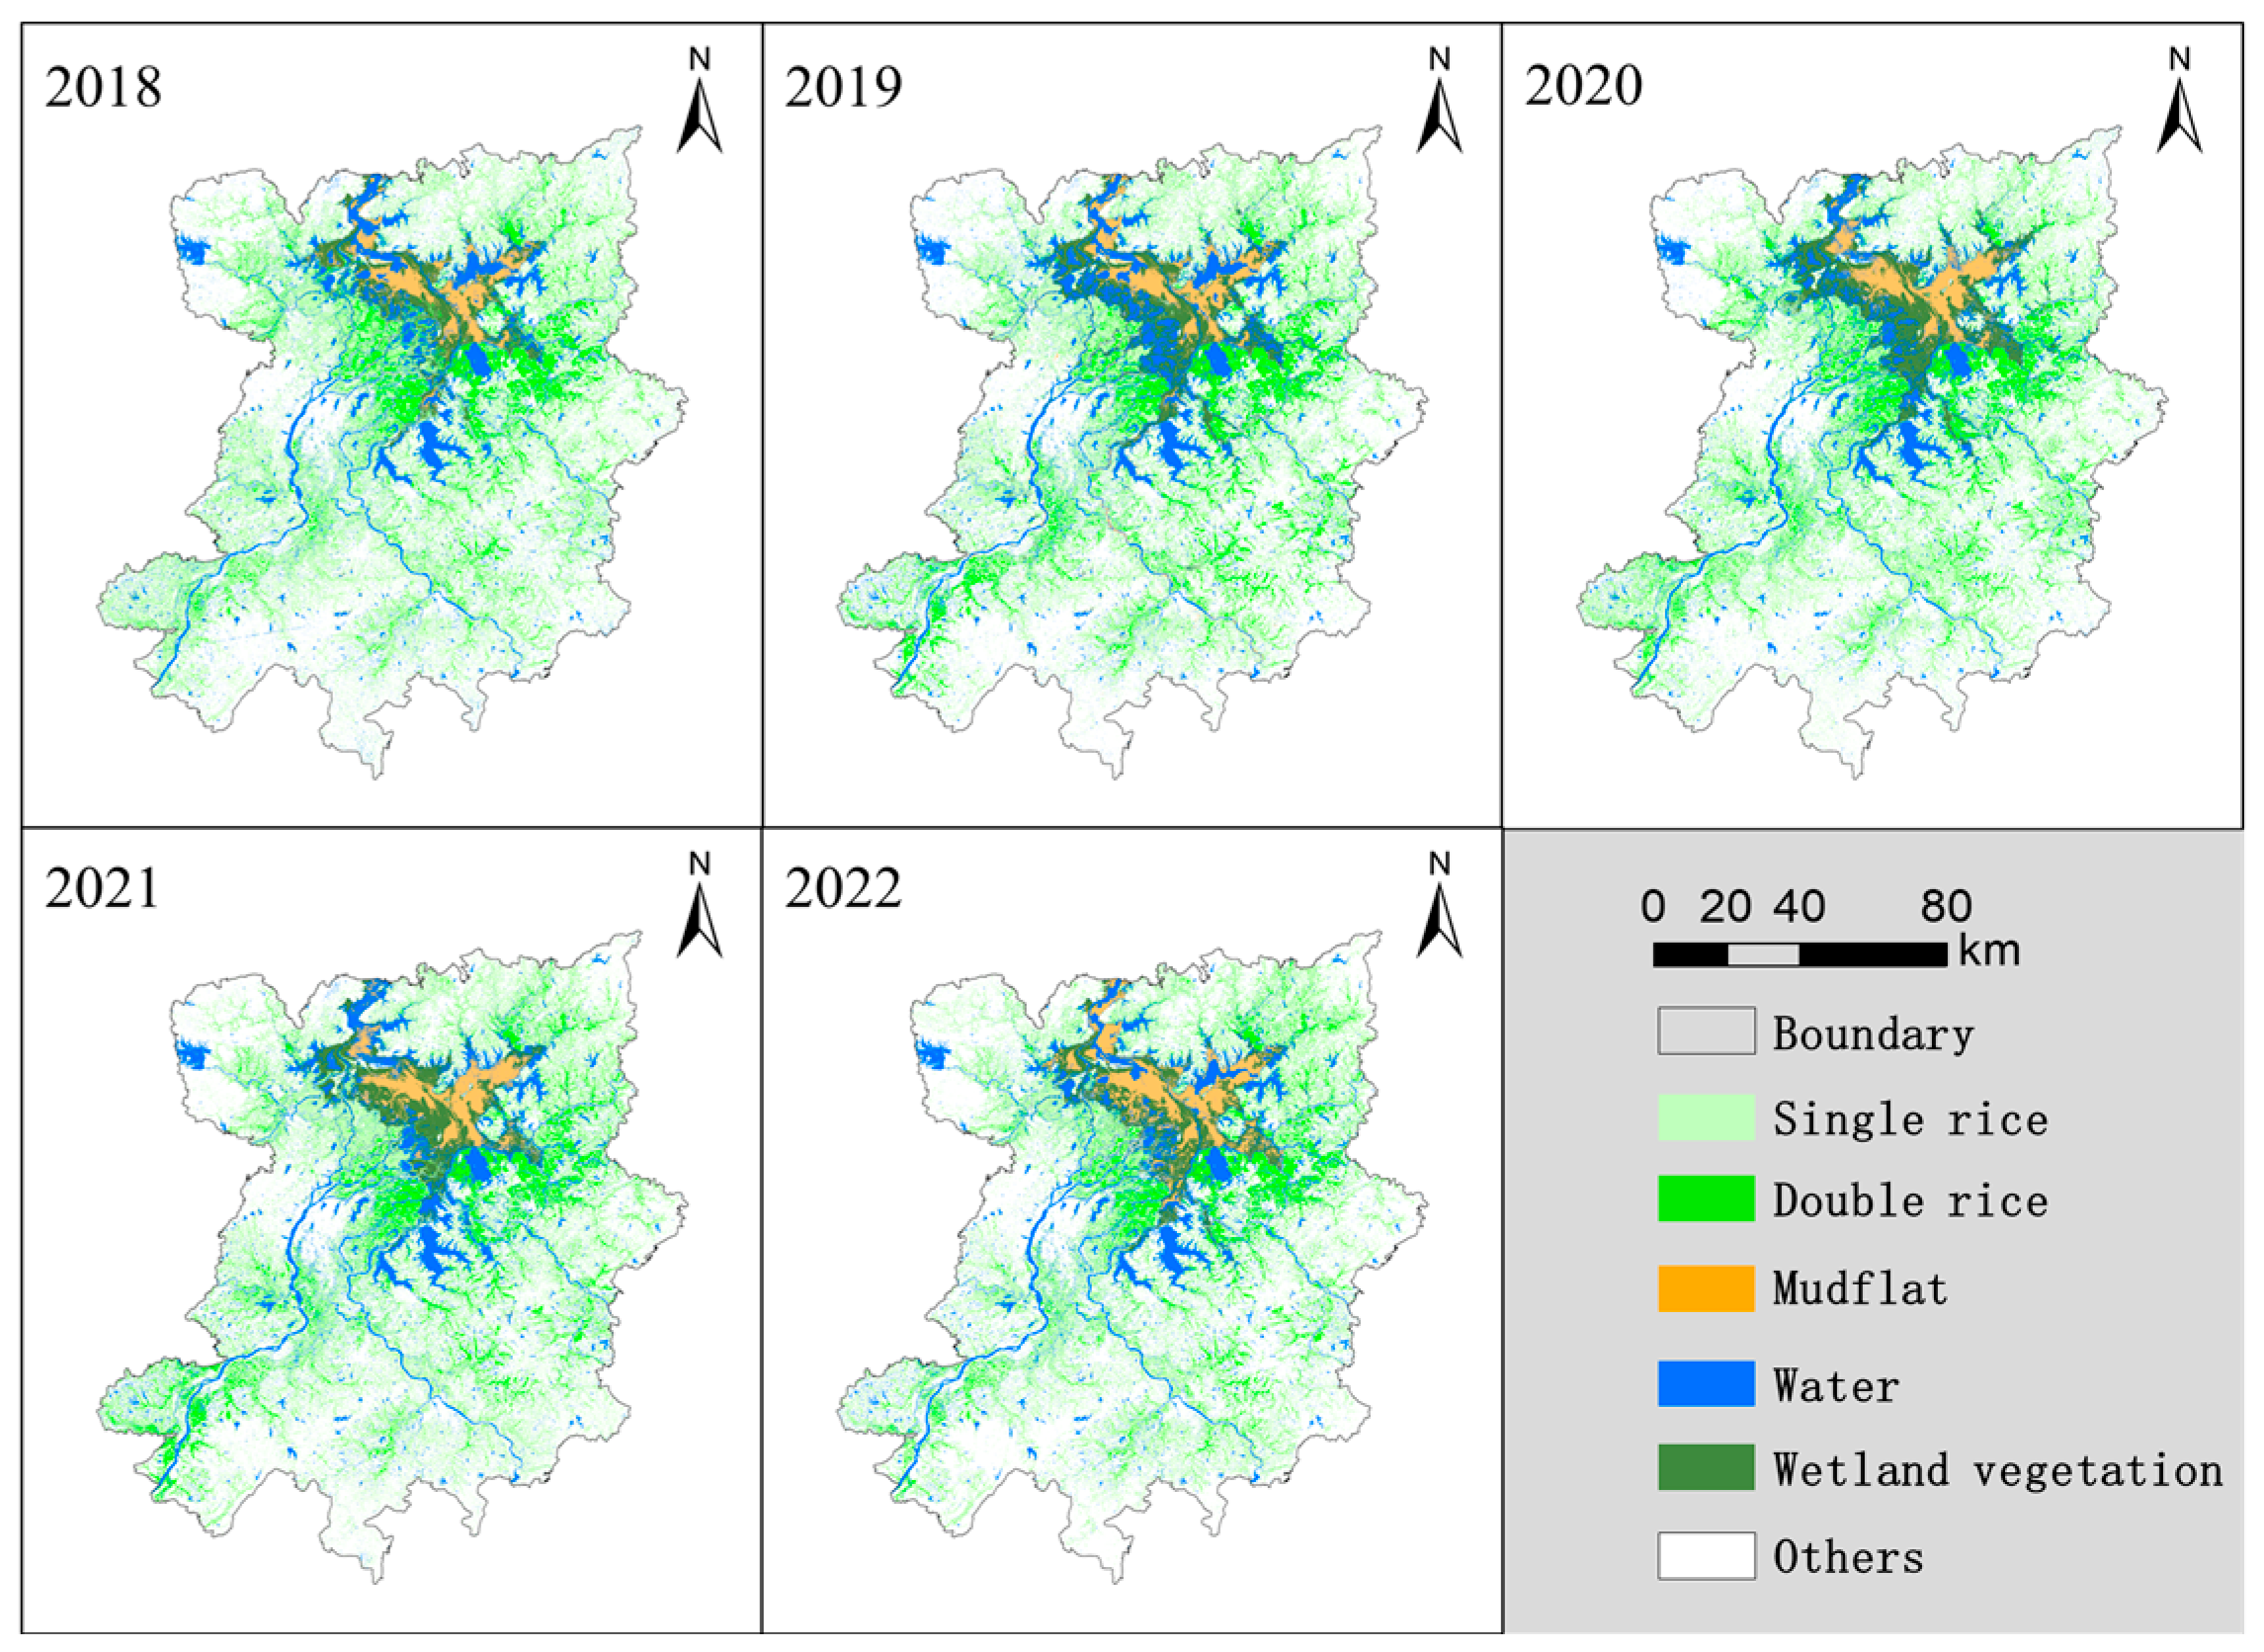
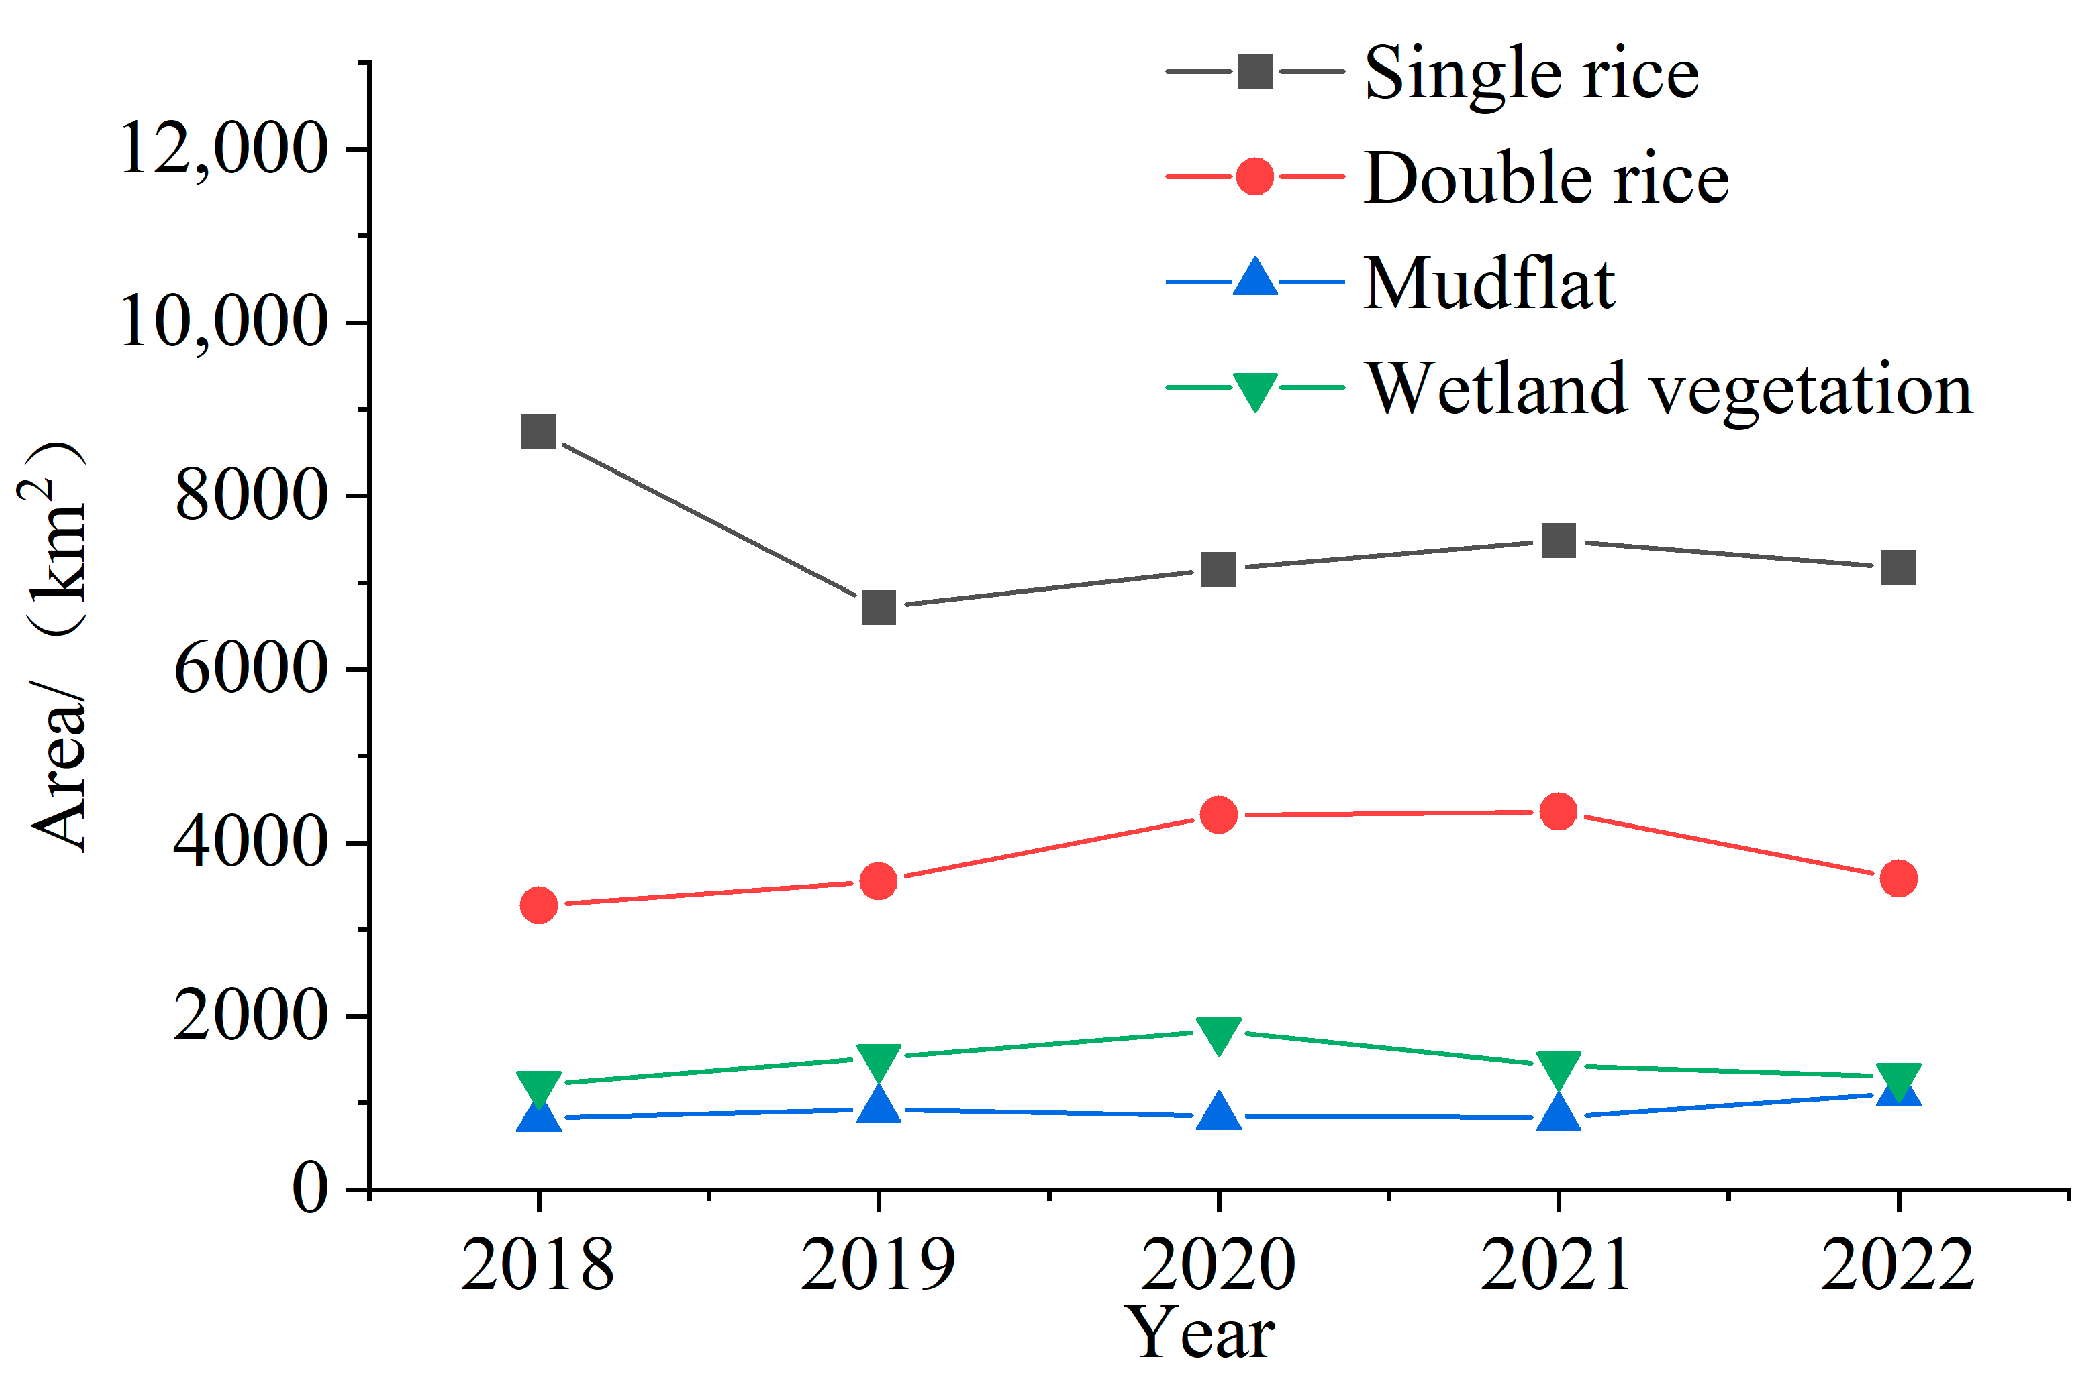
3.3. Rice–Wetland Spatial Distribution
4. Discussion
4.1. Integration of Times Series Sentinel-1 and Sentinel-2 Imagery
4.2. Verification of Consistency between Rice and Wetland Monitoring Areas and Verification Data
4.3. Uncertainty Analysis of Classification Results
4.4. Research Limitations and Possible Future Improvements
5. Conclusions
Author Contributions
Funding
Institutional Review Board Statement
Informed Consent Statement
Data Availability Statement
Acknowledgments
Conflicts of Interest
References
- Zhao, J.; Liu, D.; Cao, Y.; Zhang, L.; Peng, H.; Wang, K.; Xie, H.; Wang, C. An integrated remote sensing and model approach for assessing forest carbon fluxes in China. Sci. Total Environ. 2022, 811, 152480. [Google Scholar] [CrossRef]
- Wang, J.; Feng, L.; Palmer, P.I.; Liu, Y.; Fang, S.; Bösch, H.; O’Dell, C.W.; Tang, X.; Yang, D.; Liu, L. Large Chinese land carbon sink estimated from atmospheric carbon dioxide data. Nature 2020, 586, 720–723. [Google Scholar] [CrossRef] [PubMed]
- Fang, J.; Yu, G.; Liu, L.; Hu, S.; Chapin, F.S., III. Climate change, human impacts, and carbon sequestration in China. Proc. Natl. Acad. Sci. USA 2018, 115, 4015–4020. [Google Scholar] [CrossRef] [PubMed]
- Wei, Y.-M.; Chen, K.; Kang, J.-N.; Chen, W.; Wang, X.-Y.; Zhang, X. Policy and management of carbon peaking and carbon neutrality: A literature review. Engineering 2022, 14, 52–63. [Google Scholar] [CrossRef]
- Singha, M.; Dong, J.; Sarmah, S.; You, N.; Zhou, Y.; Zhang, G.; Doughty, R.; Xiao, X. Identifying floods and flood-affected paddy rice fields in bangladesh based on sentinel-1 imagery and google earth engine. ISPRS J. Photogramm. Remote Sens. 2020, 166, 278–293. [Google Scholar] [CrossRef]
- Ni, R.; Tian, J.; Li, X.; Yin, D.; Li, J.; Gong, H.; Zhang, J.; Zhu, L.; Wu, D. An enhanced pixel-based phenological feature for accurate paddy rice mapping with sentinel-2 imagery in google earth engine. ISPRS J. Photogramm. Remote Sens. 2021, 178, 282–296. [Google Scholar] [CrossRef]
- Xiao, X.; Boles, S.; Liu, J.; Zhuang, D.; Frolking, S.; Li, C.; Salas, W.; Moore, B., III. Mapping paddy rice agriculture in southern China using multi-temporal modis images. Remote Sens. Environ. 2005, 95, 480–492. [Google Scholar] [CrossRef]
- Xiao, X.; Boles, S.; Frolking, S.; Li, C.; Babu, J.Y.; Salas, W.; Moore, B., III. Mapping paddy rice agriculture in south and southeast Asia using multi-temporal modis images. Remote Sens. Environ. 2006, 100, 95–113. [Google Scholar] [CrossRef]
- Zhang, G.; Xiao, X.; Dong, J.; Kou, W.; Jin, C.; Qin, Y.; Zhou, Y.; Wang, J.; Menarguez, M.A.; Biradar, C. Mapping paddy rice planting areas through time series analysis of modis land surface temperature and vegetation index data. ISPRS J. Photogramm. Remote Sens. 2015, 106, 157–171. [Google Scholar] [CrossRef]
- Mansaray, L.R.; Huang, W.; Zhang, D.; Huang, J.; Li, J. Mapping rice fields in urban shanghai, southeast China, using sentinel-1a and landsat 8 datasets. Remote Sens. 2017, 9, 257. [Google Scholar] [CrossRef]
- Torres, R.; Snoeij, P.; Geudtner, D.; Bibby, D.; Davidson, M.; Attema, E.; Potin, P.; Rommen, B.; Floury, N.; Brown, M. GMES sentinel-1 mission. Remote Sens. Environ. 2012, 120, 9–24. [Google Scholar] [CrossRef]
- Jin, X.; Li, Z.; Yang, G.; Yang, H.; Feng, H.; Xu, X.; Wang, J.; Li, X.; Luo, J. Winter wheat yield estimation based on multi-source medium resolution optical and radar imaging data and the aquacrop model using the particle swarm optimization algorithm. ISPRS J. Photogramm. Remote Sens. 2017, 126, 24–37. [Google Scholar] [CrossRef]
- Van Tricht, K.; Gobin, A.; Gilliams, S.; Piccard, I. Synergistic use of radar sentinel-1 and optical sentinel-2 imagery for crop mapping: A case study for belgium. Remote Sens. 2018, 10, 1642. [Google Scholar] [CrossRef]
- Hakdaoui, S.; Emran, A.; Pradhan, B.; Lee, C.-W.; Nguemhe Fils, S.C. A collaborative change detection approach on multi-sensor spatial imagery for desert wetland monitoring after a flash flood in southern Morocco. Remote Sens. 2019, 11, 1042. [Google Scholar] [CrossRef]
- Schlaffer, S.; Chini, M.; Dettmering, D.; Wagner, W. Mapping wetlands in Zambia using seasonal backscatter signatures derived from Envisat Asar time series. Remote Sens. 2016, 8, 402. [Google Scholar] [CrossRef]
- Fatchurrachman; Rudiyanto; Soh, N.C.; Shah, R.M.; Giap, S.G.E.; Setiawan, B.I.; Minasny, B. High-resolution mapping of paddy rice extent and growth stages across peninsular malaysia using a fusion of sentinel-1 and 2 time series data in google earth engine. Remote Sens. 2022, 14, 1875. [Google Scholar] [CrossRef]
- Carrasco, L.; Fujita, G.; Kito, K.; Miyashita, T. Historical mapping of rice fields in Japan using phenology and temporally aggregated landsat images in google earth engine. ISPRS J. Photogramm. Remote Sens. 2022, 191, 277–289. [Google Scholar] [CrossRef]
- Mudereri, B.T.; Abdel-Rahman, E.M.; Ndlela, S.; Makumbe, L.D.M.; Nyanga, C.C.; Tonnang, H.E.; Mohamed, S.A. Integrating the strength of multi-date sentinel-1 and-2 datasets for detecting mango (Mangifera indica L.) orchards in a semi-arid environment in Zimbabwe. Sustainability 2022, 14, 5741. [Google Scholar] [CrossRef]
- Sahagian, D.; Melack, J.; Birkett, C.; Chanton, J.; Dunne, T.; Estes, J.; Finlayson, M.; Fresco, L.; Gopal, B.; Hess, L. Global Wetland Distribution and Functional Characterizaton: Trace Gases and the Hydrologic Cycle; Joint IGBP GAIM-DIS-BAHC-IGAC-LUCC Workshop; IGBP GAIM/IGBP Global Change: Santa Barbara, CA, USA, 1997; p. 45. [Google Scholar]
- You, N.; Dong, J. Examining earliest identifiable timing of crops using all available sentinel 1/2 imagery and google earth engine. ISPRS J. Photogramm. Remote Sens. 2020, 161, 109–123. [Google Scholar] [CrossRef]
- Zhao, X.; Nishina, K.; Izumisawa, H.; Masutomi, Y.; Osako, S.; Yamamoto, S. Monsoon asia rice calendar: A gridded rice calendar in Monsoon Asia based on sentinel-1 and sentinel-2 images. Earth Syst. Sci. Data Discuss. 2023, 2023, 1–33. [Google Scholar]
- Ozesmi, S.L. Satellite Remote Sensing of Wetlands and a Comparison of Classification Techniques; University of Minnesota: Minneapolis, MN, USA, 2000. [Google Scholar]
- Xu, P.; Herold, M.; Tsendbazar, N.-E.; Clevers, J.G. Towards a comprehensive and consistent global aquatic land cover characterization framework addressing multiple user needs. Remote Sens. Environ. 2020, 250, 112034. [Google Scholar] [CrossRef]
- Zhang, Z.; Chen, X.; Xu, C.-Y.; Hong, Y.; Hardy, J.; Sun, Z. Examining the influence of river–lake interaction on the drought and water resources in the Poyang lake basin. J. Hydrol. 2015, 522, 510–521. [Google Scholar] [CrossRef]
- Han, X.; Chen, X.; Feng, L. Four decades of winter wetland changes in Poyang lake based on Landsat observations between 1973 and 2013. Remote Sens. Environ. 2015, 156, 426–437. [Google Scholar] [CrossRef]
- Ye, X.; Zhang, Q.; Liu, J.; Li, X.; Xu, C.-y. Distinguishing the relative impacts of climate change and human activities on variation of streamflow in the Poyang lake catchment, China. J. Hydrol. 2013, 494, 83–95. [Google Scholar] [CrossRef]
- Gorelick, N.; Hancher, M.; Dixon, M.; Ilyushchenko, S.; Thau, D.; Moore, R. Google earth engine: Planetary-scale geospatial analysis for everyone. Remote Sens. Environ. 2017, 202, 18–27. [Google Scholar] [CrossRef]
- Tsiligiridis, T.; Ainali, K. Remote sensing big agridata for food availability. In 2018 International Conference on Image and Video Processing, and Artificial Intelligence; SPIE: Bellingham, WA, USA, 2018; pp. 302–307. [Google Scholar]
- Xiao, X.; Boles, S.; Frolking, S.; Salas, W.; Moore Iii, B.; Li, C.; He, L.; Zhao, R. Observation of flooding and rice transplanting of paddy rice fields at the site to landscape scales in China using vegetation sensor data. Int. J. Remote Sens. 2002, 23, 3009–3022. [Google Scholar] [CrossRef]
- Zanaga, D.; Van De Kerchove, R.; Daems, D.; De Keersmaecker, W.; Brockmann, C.; Kirches, G.; Wevers, J.; Cartus, O.; Santoro, M.; Fritz, S. ESA WorldCover 10 m 2021 v200. 2022. Available online: https://zenodo.org/records/7254221 (accessed on 1 January 2024).
- Zhang, X.; Liu, L.; Chen, X.; Gao, Y.; Xie, S.; Mi, J. Glc_fcs30: Global land-cover product with fine classification system at 30 m using time-series landsat imagery. Earth Syst. Sci. Data 2021, 13, 2753–2776. [Google Scholar] [CrossRef]
- Shen, R.; Pan, B.; Peng, Q.; Dong, J.; Chen, X.; Zhang, X.; Ye, T.; Huang, J.; Yuan, W. High-resolution distribution maps of single-season rice in China from 2017 to 2022. Earth Syst. Sci. Data Discuss. 2023, 15, 1–27. [Google Scholar] [CrossRef]
- Pan, B.; Zheng, Y.; Shen, R.; Ye, T.; Zhao, W.; Dong, J.; Ma, H.; Yuan, W. High resolution distribution dataset of double-season paddy rice in China. Remote Sens. 2021, 13, 4609. [Google Scholar] [CrossRef]
- Glenn, E.P.; Huete, A.R.; Nagler, P.L.; Nelson, S.G. Relationship between remotely-sensed vegetation indices, canopy attributes and plant physiological processes: What vegetation indices can and cannot tell us about the landscape. Sensors 2008, 8, 2136–2160. [Google Scholar] [CrossRef]
- Xue, J.; Su, B. Significant remote sensing vegetation indices: A review of developments and applications. J. Sens. 2017, 2017, 1353691. [Google Scholar] [CrossRef]
- Talema, T.; Hailu, B.T. Mapping rice crop using sentinels (1 sar and 2 msi) images in tropical area: A case study in fogera wereda, ethiopia. Remote Sens. Appl. Soc. Environ. 2020, 18, 100290. [Google Scholar] [CrossRef]
- Chen, D.; Huang, J.; Jackson, T.J. Vegetation water content estimation for corn and soybeans using spectral indices derived from modis near-and short-wave infrared bands. Remote Sens. Environ. 2005, 98, 225–236. [Google Scholar] [CrossRef]
- Zeng, L.; Wardlow, B.D.; Xiang, D.; Hu, S.; Li, D. A review of vegetation phenological metrics extraction using time-series, multispectral satellite data. Remote Sens. Environ. 2020, 237, 111511. [Google Scholar] [CrossRef]
- Justice, C.O.; Townshend, J.; Holben, B.; Tucker, E.C. Analysis of the phenology of global vegetation using meteorological satellite data. Int. J. Remote Sens. 1985, 6, 1271–1318. [Google Scholar] [CrossRef]
- Tian, H.; Wu, M.; Wang, L.; Niu, Z. Mapping early, middle and late rice extent using sentinel-1a and landsat-8 data in the Poyang lake plain, China. Sensors 2018, 18, 185. [Google Scholar] [CrossRef] [PubMed]
- Ding, M.; Guan, Q.; Li, L.; Zhang, H.; Liu, C.; Zhang, L. Phenology-based rice paddy mapping using multi-source satellite imagery and a fusion algorithm applied to the Poyang lake plain, southern China. Remote Sens. 2020, 12, 1022. [Google Scholar] [CrossRef]
- Nussbaum, S.; Niemeyer, I.; Canty, M. Seath-a new tool for automated feature extraction in the context of object-based image analysis. In Proceedings of the 1st International Conference on Object-Based Image Analysis (OBIA), Salzburg, Austria, 4–5 July 2006. [Google Scholar]
- Pal, M. Random forest classifier for remote sensing classification. Int. J. Remote Sens. 2005, 26, 217–222. [Google Scholar] [CrossRef]
- Suthaharan, S.; Suthaharan, S. Machine learning models and algorithms for big data classification: Thinking with examples for effective learning. Support Vector Mach. 2016, 36, 207–235. [Google Scholar]
- Steinberg, D.; Colla, P. The top ten algorithms in data mining. CART Classif. Regres. Trees 2009, 9, 179. [Google Scholar]
- Liu, L.; Xiao, X.; Qin, Y.; Wang, J.; Xu, X.; Hu, Y.; Qiao, Z. Mapping cropping intensity in China using time series landsat and sentinel-2 images and google earth engine. Remote Sens. Environ. 2020, 239, 111624. [Google Scholar] [CrossRef]
- Zhang, M.; Lin, H.; Wang, G.; Sun, H.; Fu, J. Mapping paddy rice using a convolutional neural network (CNN) with Landsat 8 datasets in the Dongting lake area, China. Remote Sens. 2018, 10, 1840. [Google Scholar] [CrossRef]
- Rad, A.M.; Ashourloo, D.; Shahrabi, H.S.; Nematollahi, H. Developing an automatic phenology-based algorithm for rice detection using sentinel-2 time-series data. IEEE J. Sel. Top. Appl. Earth Obs. Remote Sens. 2019, 12, 1471–1481. [Google Scholar]
- Ali, A.M.; Savin, I.; Poddubskiy, A.; Abouelghar, M.; Saleh, N.; Abutaleb, K.; El-Shirbeny, M.; Dokukin, P. Integrated method for rice cultivation monitoring using sentinel-2 data and leaf area index. Egypt. J. Remote Sens. Space Sci. 2021, 24, 431–441. [Google Scholar] [CrossRef]
- Yang, H.; Pan, B.; Li, N.; Wang, W.; Zhang, J.; Zhang, X. A systematic method for spatio-temporal phenology estimation of paddy rice using time series sentinel-1 images. Remote Sens. Environ. 2021, 259, 112394. [Google Scholar] [CrossRef]
- Bazzi, H.; Baghdadi, N.; El Hajj, M.; Zribi, M.; Minh, D.H.T.; Ndikumana, E.; Courault, D.; Belhouchette, H. Mapping paddy rice using sentinel-1 sar time series in Camargue, France. Remote Sens. 2019, 11, 887. [Google Scholar] [CrossRef]
- Solórzano, J.V.; Mas, J.F.; Gao, Y.; Gallardo-Cruz, J.A. Land use land cover classification with u-net: Advantages of combining sentinel-1 and sentinel-2 imagery. Remote Sens. 2021, 13, 3600. [Google Scholar] [CrossRef]
- Fiorillo, E.; Di Giuseppe, E.; Fontanelli, G.; Maselli, F. Lowland rice mapping in Sédhiou region (Senegal) using sentinel 1 and sentinel 2 data and random forest. Remote Sens. 2020, 12, 3403. [Google Scholar] [CrossRef]
- Mahdavi, S.; Salehi, B.; Granger, J.; Amani, M.; Brisco, B.; Huang, W. Remote sensing for wetland classification: A comprehensive review. GIScience Remote Sens. 2018, 55, 623–658. [Google Scholar] [CrossRef]
- Davranche, A.; Lefebvre, G.; Poulin, B. Wetland monitoring using classification trees and spot-5 seasonal time series. Remote Sens. Environ. 2010, 114, 552–562. [Google Scholar] [CrossRef]
- Zhang, R.; Zhu, D. Study of land cover classification based on knowledge rules using high-resolution remote sensing images. Expert Syst. Appl. 2011, 38, 3647–3652. [Google Scholar] [CrossRef]
- Xu, L.; Zhang, H.; Wang, C.; Wei, S.; Zhang, B.; Wu, F.; Tang, Y. Paddy rice mapping in Thailand using time-series sentinel-1 data and deep learning model. Remote Sens. 2021, 13, 3994. [Google Scholar] [CrossRef]


| Sensor | Bands | Wavelength/nm | Resolution/m | |
|---|---|---|---|---|
| Sentinel-2 MSI | B2 | Blue | 490 | 10 |
| B3 | Green | 560 | 10 | |
| B4 | Red | 665 | 10 | |
| B8 | Near-infrared | 842 | 10 | |
| B11 | Short-wave infrared 1 | 1610 | 20 | |
| B12 | Short-wave infrared 2 | 2190 | 20 | |
| Sentinel-1 SAR GRD | VV | Dual-band cross-polarization, vertical transmission/horizontal receiver | - | 10 |
| VH | - | 10 | ||
| Land Cover | Characteristics | Number |
|---|---|---|
| Single rice | Also referred to as middle rice. Rice harvested once a year in the same paddy field. Exhibits a smooth and uniform texture within the plot. | 330 |
| Double rice | Rice cultivated and harvested twice a year in the same paddy field that includes early rice and late rice. Demonstrates a smooth and uniform texture within the plot. | 330 |
| Mudflat | Sandy areas appear bright yellow, while mudflats exhibit a light gray color with clear boundaries, located near water bodies. | 134 |
| Wetland vegetation | Plants growing in areas where the soil is permanently or seasonally saturated with water, including emergent, floating, and submerged vegetation. | 150 |
| Construction land | Appears silver-white, occurring in contiguous or sporadic distributions with uniform and regular patterns. | 320 |
| Forest | Exhibits a deep green color, irregularly distributed in large patchy or cluster formations with clear boundaries. | 323 |
| Dry land | Encompasses other crops besides paddy rice, demonstrating relatively smooth and uniform plot patterns. | 150 |
| Water | Displays varying shades of blue with distinct boundaries. | 244 |
| Spectral Indices | Formulas |
|---|---|
| Normalized difference vegetation index (NDVI) | NDVI = (NIR − Red)/(NIR + Red) |
| Enhanced vegetation index (EVI) | EVI = 2.5 × (NIR − Red)/(NIR + 6 × Red − 7.5 × Blue + 1) |
| Synthetic aperture video index (SAVI) | SAVI = ((NIR − Red)/(NIR + Red + 0.5))(1 + 0.5) |
| Land Surface Water Index (LSWI) | LSWI = (NIR − SWIR)/NIR + SWIR) |
| Modified normalized difference water index (MNDWI) | MNDWI = (GREEN − SWIR)/(GREEN + SWIR) |
| Normalized difference water index (NDWI) | NDWI = (GREEN − NIR)/(GREEN + NIR) |
| Month | 4 | 5 | 6 | 7 | 8 | 9 | 10 |
|---|---|---|---|---|---|---|---|
| Early rice | Transplanting Stage | Growth Stage I | Growth Stage II | Maturation Stage | |||
| Late rice | Transplanting Stage | Growth Stage I | Growth Stage II | Maturation Stage | |||
| Middle rice | Transplanting Stage | Growth Stage I | Growth Stage II | Maturation Stage | |||
| Wetland vegetation | Nutrient Absorption Stage | Dormant Stage | Recovery Stage | ||||
| Scheme | Feature Group | Classifier |
|---|---|---|
| Option 1 | Spectral feature (NDVI, EVI, SAVI, LSWI, NDWI, MNDWI) | RF |
| Option 2 | Radar signature (VV, VH) | RF |
| Option 3 | Spectral feature + Radar signature | RF |
| Option 4 | Spectral feature + Radar signature (Key phenology) | RF |
| Option 5 | Spectral feature + Radar signature (Key phenology) | Cart |
| Option 6 | Spectral feature + Radar signature (Key phenology) | SVM |
| Precision Index | Calculation Formula |
|---|---|
| PA | |
| UA | |
| OA | |
| Kappa |
| Classification | Option 1 | Option 2 | Option 3 | Option 4 | Option 5 | Option 6 | |
|---|---|---|---|---|---|---|---|
| OA | 0.86 | 0.90 | 0.91 | 0.94 | 0.81 | 0.74 | |
| Kappa | 0.84 | 0.89 | 0.90 | 0.93 | 0.78 | 0.71 | |
| Single rice | PA | 0.78 | 0.83 | 0.83 | 0.95 | 0.73 | 0.69 |
| UA | 0.79 | 0.82 | 0.81 | 0.89 | 0.75 | 0.71 | |
| Double rice | PA | 0.83 | 0.86 | 0.85 | 0.95 | 0.74 | 0.58 |
| UA | 0.86 | 0.93 | 0.86 | 0.98 | 0.61 | 0.60 | |
| Mudflat | PA | 0.90 | 0.84 | 0.94 | 0.97 | 0.66 | 0.73 |
| UA | 0.91 | 0.85 | 0.96 | 0.98 | 0.76 | 0.68 | |
| Wetland vegetation | PA | 0.90 | 0.96 | 0.94 | 0.97 | 0.79 | 0.64 |
| UA | 0.92 | 0.93 | 0.95 | 0.98 | 0.87 | 0.73 | |
| Water | PA | 0.93 | 0.95 | 0.94 | 0.99 | 0.86 | 0.81 |
| UA | 0.96 | 0.97 | 0.98 | 0.99 | 0.89 | 0.79 | |
| Construction land | PA | 0.90 | 0.85 | 0.90 | 0.98 | 0.91 | 0.87 |
| UA | 0.90 | 0.87 | 0.92 | 0.99 | 0.88 | 0.81 | |
| Forest | PA | 0.90 | 0.91 | 0.94 | 0.95 | 0.81 | 0.85 |
| UA | 0.93 | 0.90 | 0.96 | 0.96 | 0.85 | 0.91 | |
| Dry land | PA | 0.77 | 0.78 | 0.79 | 0.84 | 0.71 | 0.64 |
| UA | 0.76 | 0.86 | 0.84 | 0.89 | 0.73 | 0.72 | |
| Year | Accuracy | Single Rice | Double Rice | Mudflat | Wetland Vegetation |
|---|---|---|---|---|---|
| 2018 | UA | 0.9 | 0.9 | 0.95 | 0.97 |
| PA | 0.91 | 0.98 | 0.95 | 0.97 | |
| OA | 0.91 | ||||
| Kappa | 0.90 | ||||
| 2019 | UA | 0.89 | 0.95 | 0.95 | 0.97 |
| PA | 0.92 | 0.89 | 0.98 | 0.98 | |
| OA | 0.94 | ||||
| Kappa | 0.93 | ||||
| 2020 | UA | 0.88 | 0.91 | 0.93 | 0.97 |
| PA | 0.88 | 0.91 | 0.88 | 0.96 | |
| OA | 0.90 | ||||
| Kappa | 0.89 | ||||
| 2021 | UA | 0.83 | 0.94 | 0.89 | 0.96 |
| PA | 0.88 | 0.92 | 0.92 | 0.88 | |
| OA | 0.87 | ||||
| Kappa | 0.88 | ||||
| 2022 | UA | 0.86 | 0.89 | 0.90 | 0.98 |
| PA | 0.9 | 0.95 | 0.97 | 0.9 | |
| OA | 0.85 | ||||
| Kappa | 0.87 | ||||
| County | Double Rice | Single Rice | ||||
|---|---|---|---|---|---|---|
| Extraction Area/km2 | Yearbook Area/km2 | Error | Extraction Area/km2 | Yearbook Area/km2 | Error | |
| Nanchang | 688.51 | 643.63 | 6.97% | 228.59 | 197.76 | 15.59% |
| Jinxian | 316.53 | 360.46 | −12.19% | 38.42 | 37.99 | 1.12% |
| Xinjian | 528.66 | 498.49 | 6.05% | 138.64 | 128.72 | 7.70% |
| Yongxiu | 347.14 | 258.56 | 34.26% | 35.57 | 46.00 | −22.68% |
| De’an | 103.50 | 104.87 | −1.31% | 3.30 | 3.70 | −10.81% |
| Duchang | 187.20 | 190.36 | −1.66% | 83.18 | 82.58 | 0.73% |
| Zhangshu | 414.70 | 393.89 | 5.28% | 24.55 | 28.52 | −13.91% |
| Fengcheng | 697.39 | 680.54 | 2.48% | 144.24 | 114.72 | 25.74% |
| Linchuan | 87.10 | 78.50 | 10.96% | 343.78 | 351.40 | −2.17% |
| Dongxiang | 245.98 | 226.20 | 8.74% | 15.34 | 14.96 | 2.54% |
| Chongren | 137.82 | 157.10 | −12.27% | 36.47 | 33.20 | 9.85% |
| Jinxi | 194.36 | 163.60 | 18.80% | 73.14 | 72.10 | 1.44% |
Disclaimer/Publisher’s Note: The statements, opinions and data contained in all publications are solely those of the individual author(s) and contributor(s) and not of MDPI and/or the editor(s). MDPI and/or the editor(s) disclaim responsibility for any injury to people or property resulting from any ideas, methods, instructions or products referred to in the content. |
© 2024 by the authors. Licensee MDPI, Basel, Switzerland. This article is an open access article distributed under the terms and conditions of the Creative Commons Attribution (CC BY) license (https://creativecommons.org/licenses/by/4.0/).
Share and Cite
Huang, D.; Xu, L.; Zou, S.; Liu, B.; Li, H.; Pu, L.; Chi, H. Mapping Paddy Rice in Rice–Wetland Coexistence Zone by Integrating Sentinel-1 and Sentinel-2 Data. Agriculture 2024, 14, 345. https://doi.org/10.3390/agriculture14030345
Huang D, Xu L, Zou S, Liu B, Li H, Pu L, Chi H. Mapping Paddy Rice in Rice–Wetland Coexistence Zone by Integrating Sentinel-1 and Sentinel-2 Data. Agriculture. 2024; 14(3):345. https://doi.org/10.3390/agriculture14030345
Chicago/Turabian StyleHuang, Duan, Lijie Xu, Shilin Zou, Bo Liu, Hengkai Li, Luoman Pu, and Hong Chi. 2024. "Mapping Paddy Rice in Rice–Wetland Coexistence Zone by Integrating Sentinel-1 and Sentinel-2 Data" Agriculture 14, no. 3: 345. https://doi.org/10.3390/agriculture14030345
APA StyleHuang, D., Xu, L., Zou, S., Liu, B., Li, H., Pu, L., & Chi, H. (2024). Mapping Paddy Rice in Rice–Wetland Coexistence Zone by Integrating Sentinel-1 and Sentinel-2 Data. Agriculture, 14(3), 345. https://doi.org/10.3390/agriculture14030345