
Genotypic Variation in Agronomic Traits and Molecular Markers among Chinese Luobuma (Apocynum spp.) Germplasm Accessions


Abstract
1. Introduction
2. Materials and Methods
2.1. Plant Materials and Field Trials
2.2. Measurements
2.3. ANOVA
2.4. Pattern Analysis
2.5. Phenotypic Correlation
2.6. Genetic Variation in Molecular Markers
3. Results
3.1. Genotypic Variance Components of Yield-Related Traits
3.2. Genotypic Variance Components for Nutritional Quality Traits
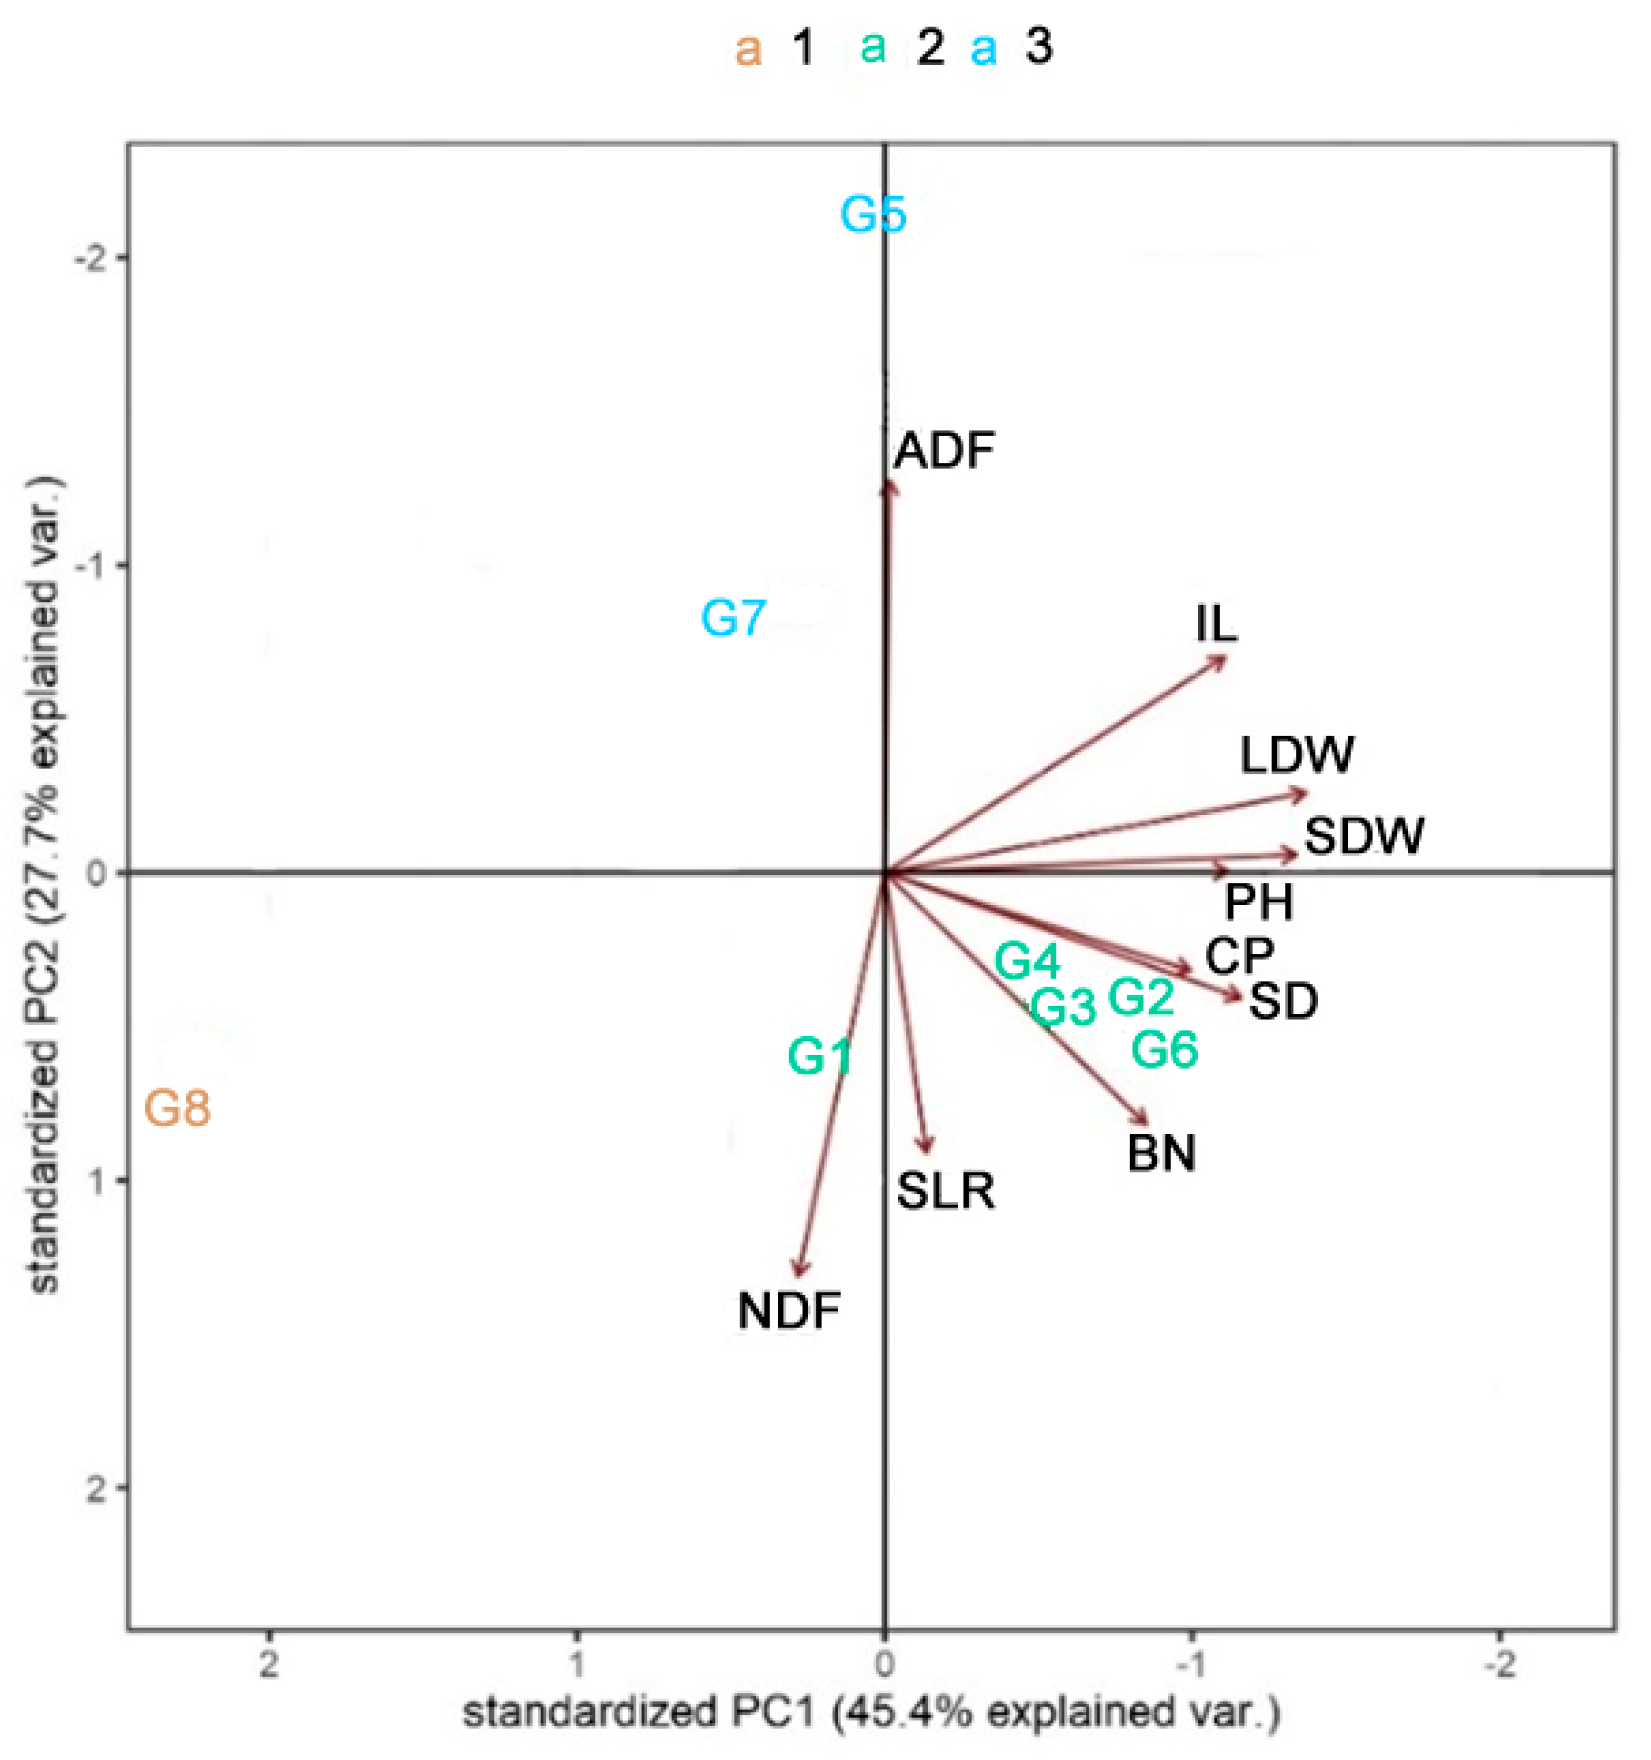
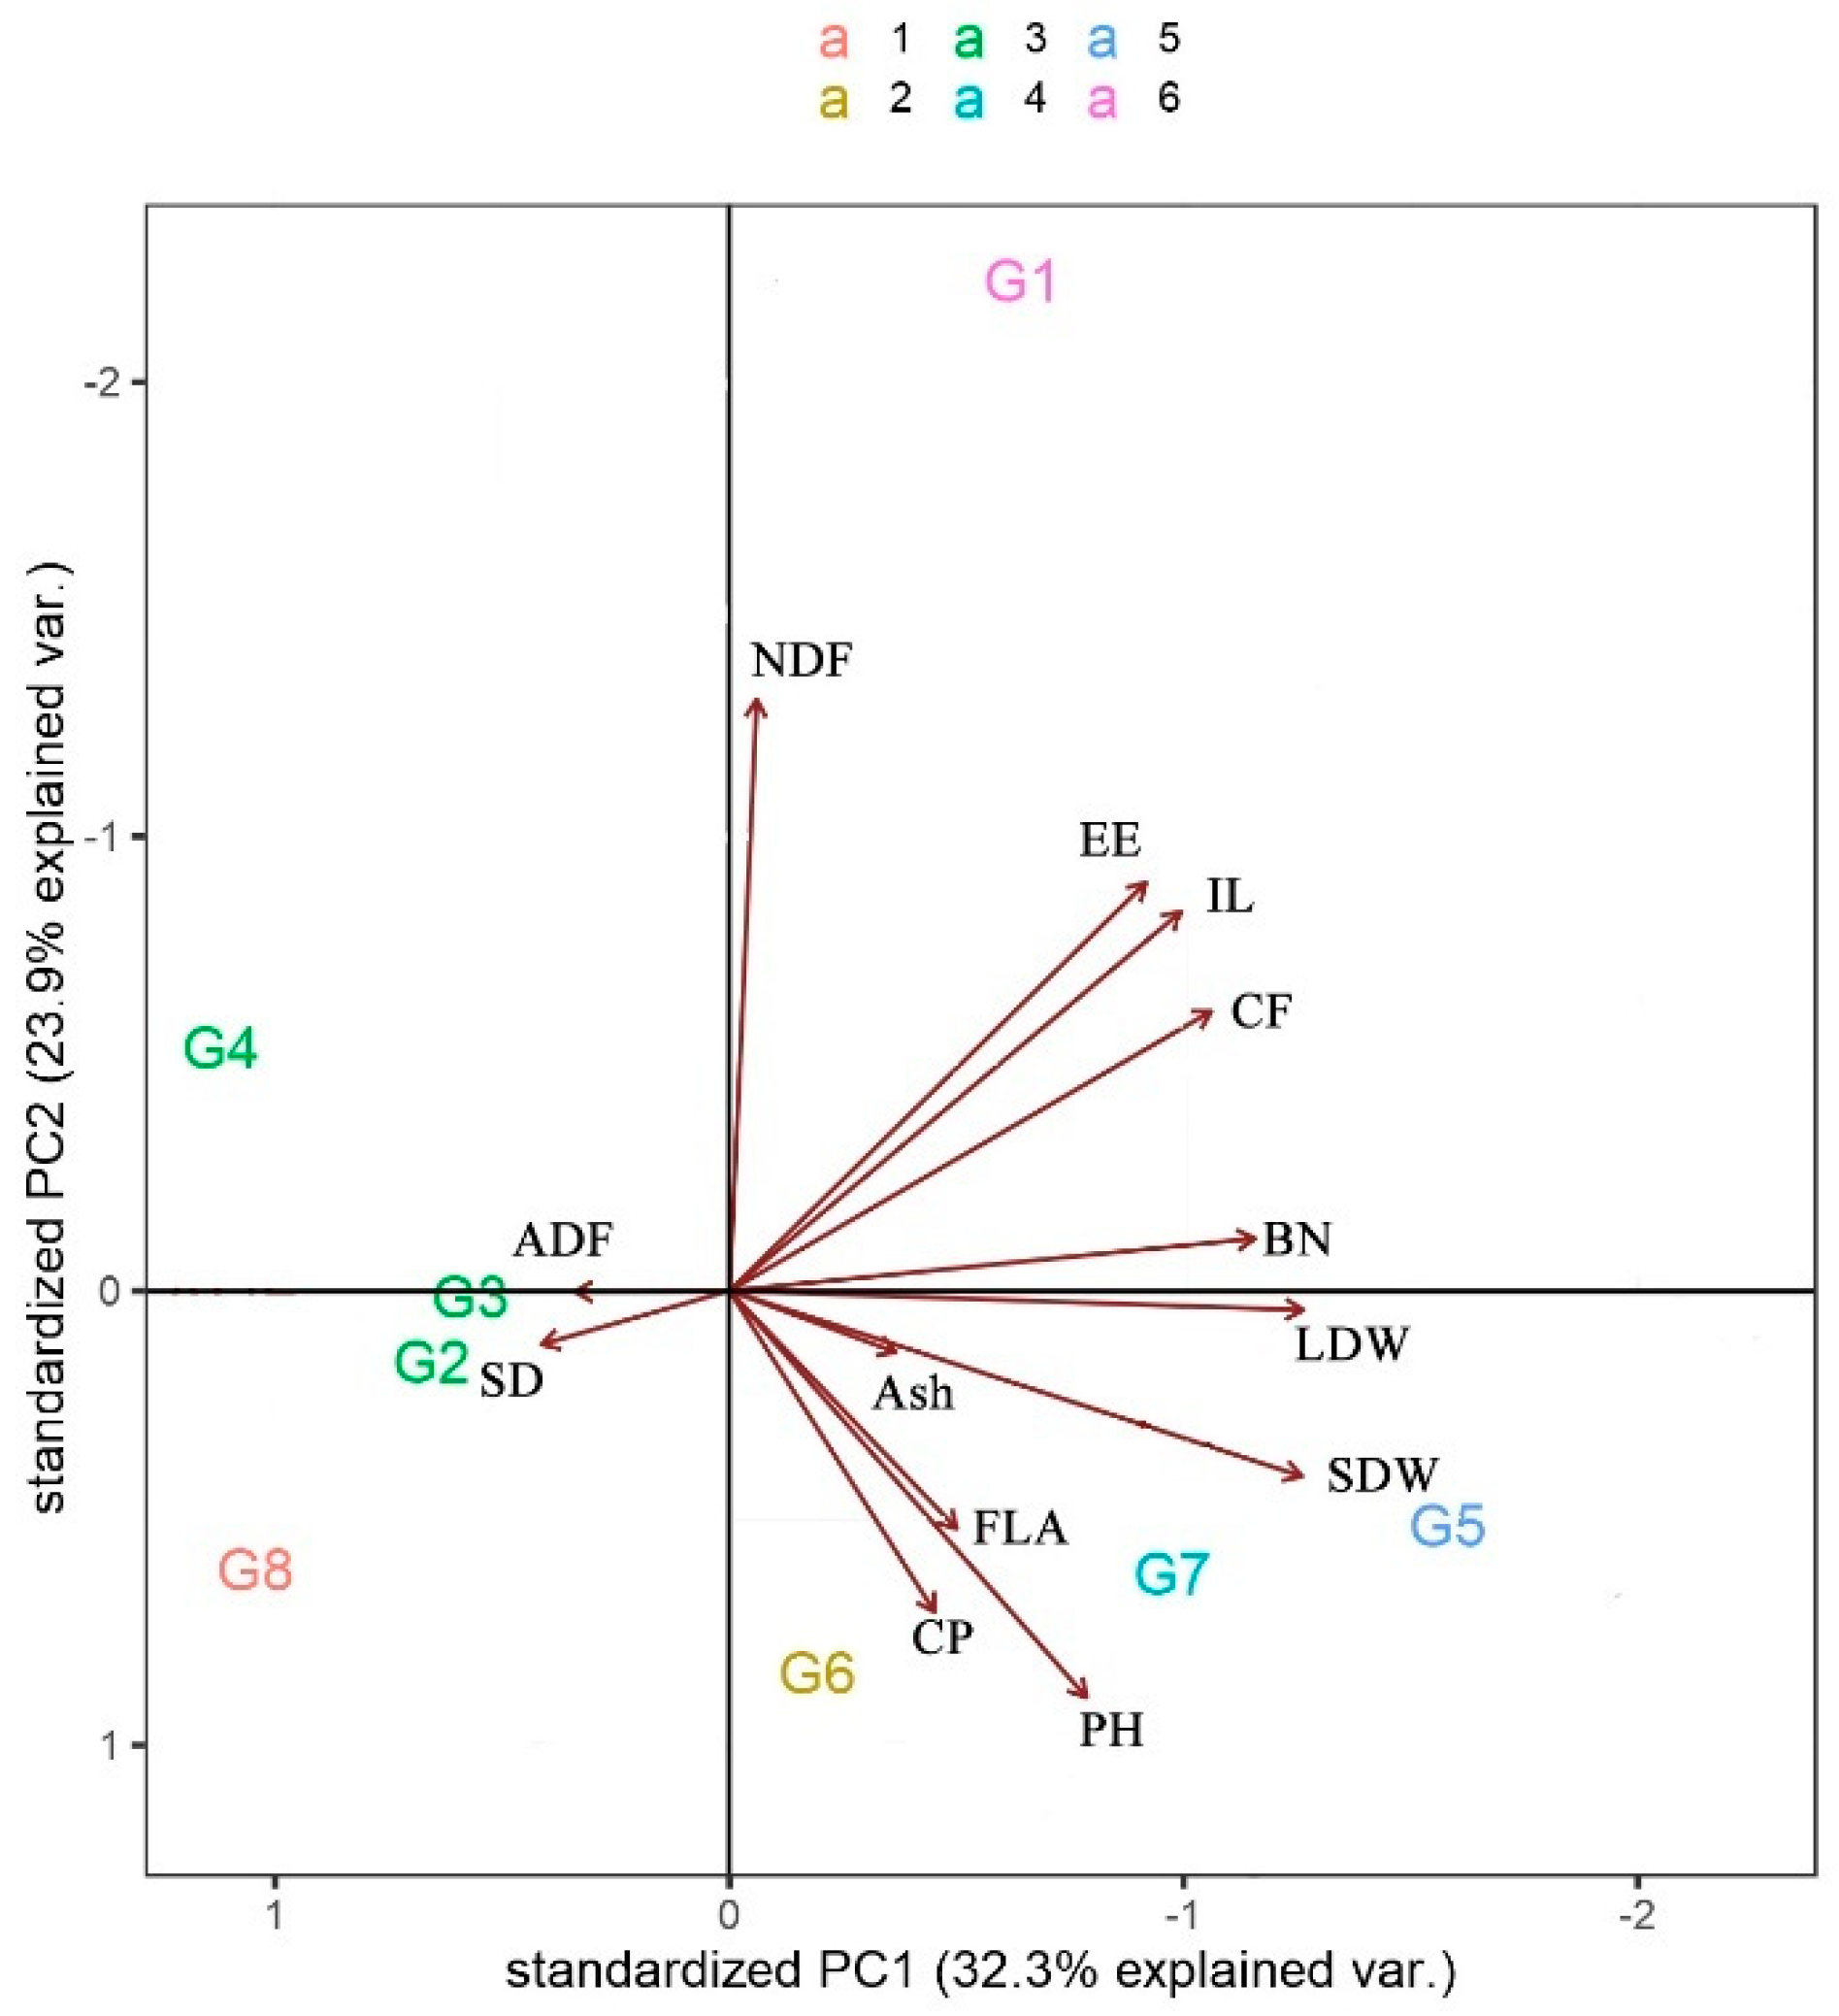
3.3. Pattern Analysis
3.4. Phenotypic Correlation
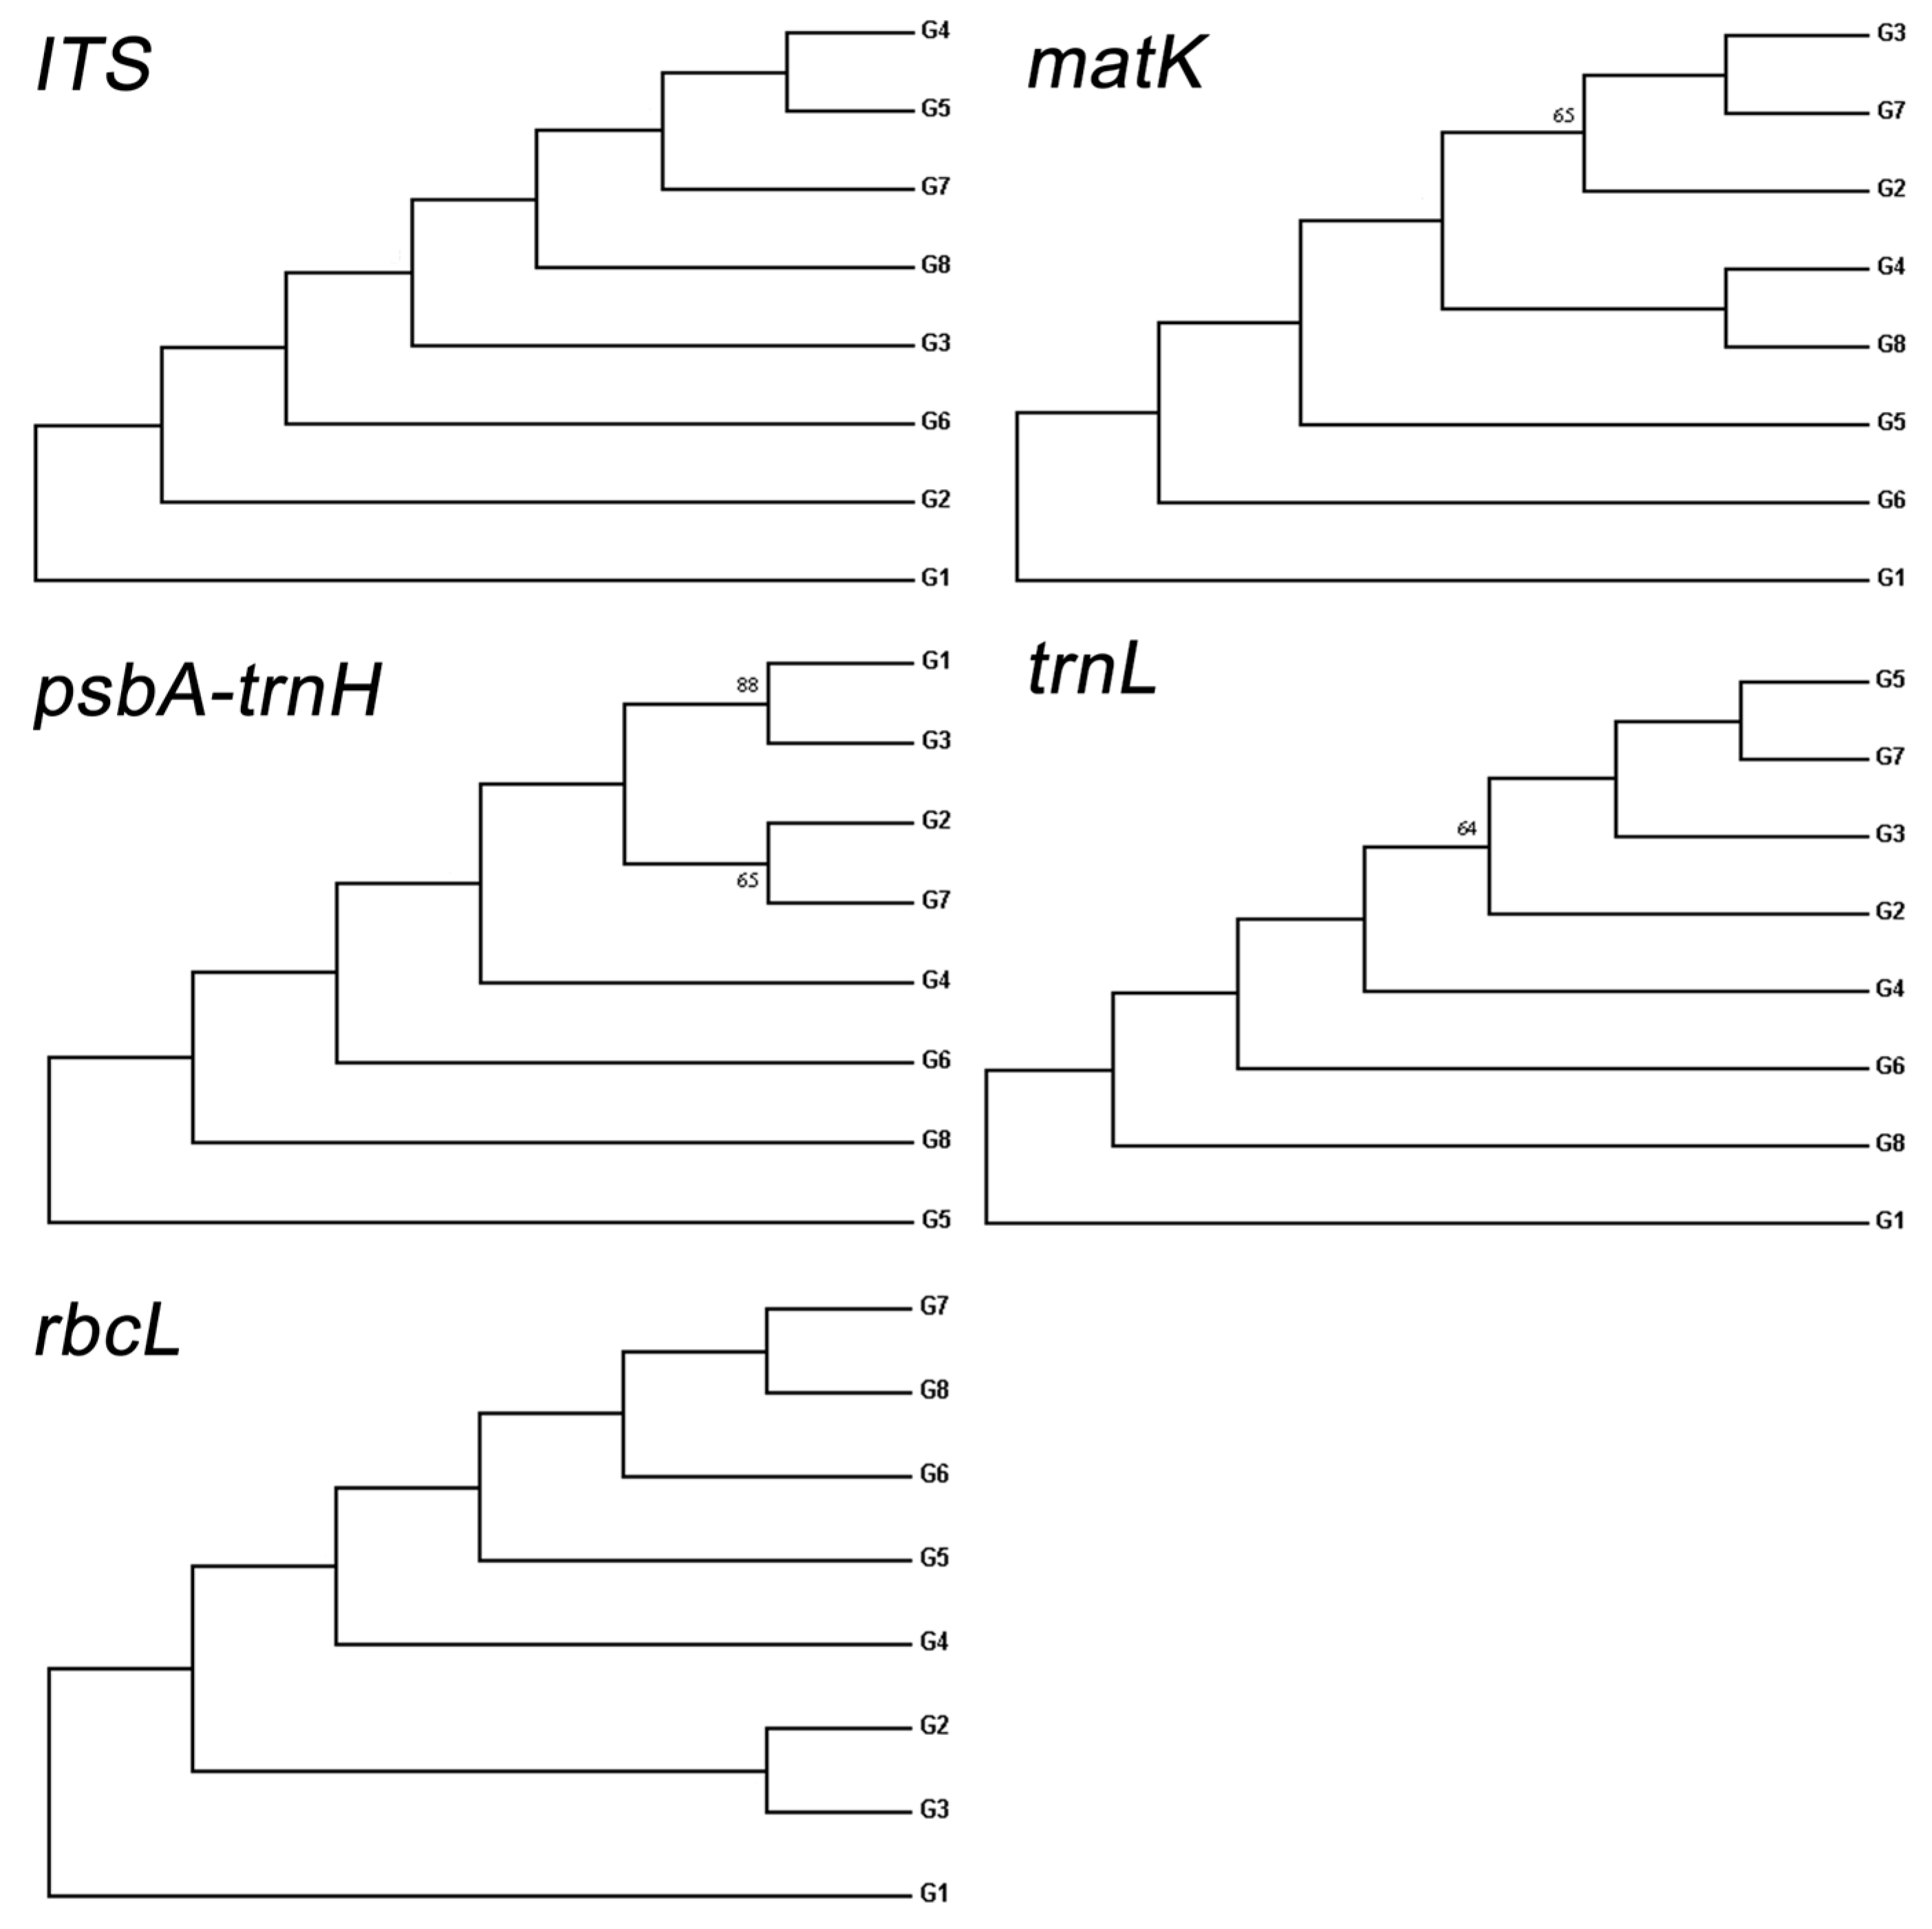
3.5. Genotypic Variance Components of Molecular Markers
4. Discussion
5. Conclusions
Supplementary Materials
Author Contributions
Funding
Institutional Review Board Statement
Data Availability Statement
Acknowledgments
Conflicts of Interest
References
- Kobayashi, M.; Saitoh, H.; Seo, S.; Butterweck, V.; Nishibe, S. Apocynum venetum extract does not induce CYP3A and P-glycoprotein in rats. Biol. Pharm. Bull. 2004, 27, 1649–1652. [Google Scholar] [CrossRef]
- Wang, L.L.; Han, G.T.; Zhang, Y.M. Comparative study of composition, structure and properties of Apocynum venetum fibers under different pretreatments. Carbohydr. Polym. 2007, 69, 391–397. [Google Scholar] [CrossRef]
- Guo, H.; Kuang, Z.P.; Zhang, J.; Zhao, X.; Pu, P.; Yan, J.F. The preventive effect of Apocynum venetum polyphenols on D-galactose-inducedoxidative stress in mice. Exp. Ther. Med. 2020, 19, 113–119. [Google Scholar]
- Li, C.; Huang, J.B.; Tan, F.; Zhou, X.R.; Mu, J.F.; Zhao, X. In vitro analysis of antioxidant, anticancer, and bioactive components of Apocynum venetum tea extracts. J. Food Qual. 2019, 2019, 346–359. [Google Scholar] [CrossRef]
- Geng, Y.W. Study on Genetic Diversity and Quality Evaluation of Wild Apocynum venetum Population. Master’s Thesis, Inner Mongolia Agricutural University, Huhhot, China, 2021. [Google Scholar]
- Zhou, J.; Sun, J.B.; Xu, X.Y.; Cheng, Z.H.; Zeng, P.; Wang, F.Q.; Zhang, Q. Application of mixed cloud point extraction for the analysis of six flavonoids in Apocynum venetum leaf samples by high performance liquid chromatography. J. Pharm. Biomed. Anal. 2015, 107, 273–279. [Google Scholar] [CrossRef] [PubMed]
- Xie, W.Y.; Chen, C.; Jiang, Z.H.; Wang, J.; Melzig, M.F.; Zhang, X.Y. Apocynum venetum attenuates acetaminophen-induced liver injury in Mice. Am. J. Chin. Med. 2015, 43, 457–476. [Google Scholar] [CrossRef] [PubMed]
- Zhang, Y.; Ma, X.Y.; Zhang, T.; Qin, M.; Sun, B.; Li, Q.; Hu, D.W.; Ren, L.Q. Protective effects of Apocynum venetum against pirarubicin-induced cardiotoxicity. Am. J. Chin. Med. 2019, 47, 1075–1097. [Google Scholar] [CrossRef]
- Li, M.H.; Han, G.T.; Chen, H.; Yu, J.Y.; Zhang, Y.M. Chemical compounds and antimicrobial activity of volatile oils from bast and fibers of Apocynum venetum. Fibers Polym. 2012, 13, 322–328. [Google Scholar] [CrossRef]
- Halim, F.M.; Lv, Z.Y.; Chen, Y.D.; Ma, M.B.; Liu, H.F.; Zhou, W.L. Fidelity of new chemical degumming method for obtaining superior properties of Bast fiber from Apocynum venetum. Text. Res. J. 2019, 31, 112–120. [Google Scholar] [CrossRef]
- Gong, J.X.; Zhang, Q.Y.; Lou, J.F.; Zhang, T.; Li, Z.; Li, Q.J.; Li, H.Q.; Zhang, J.F. Investigation of the degradation of bio-recalcitrance in Apocynum venetum fiber biodegumming. J. Nat. Fibers 2019, 16, 1–12. [Google Scholar] [CrossRef]
- Wang, L.L.; Zhang, X.F.; Niu, Y.Y.; Ahmed, A.F.; Wang, J.M.; Kang, W.Y. Anticoagulant activity of two novel polysaccharides from flowers of Apocynum venetum L. Int. J. Biol. Macromol. 2019, 124, 1230–1237. [Google Scholar] [CrossRef] [PubMed]
- Gao, P.; Duan, T.Y.; Christensen, M.J.; Nan, Z.B.; Liu, Q.T.; Meng, F.J.; Huang, J.F. The influence of irrigation frequency on the occurrence of rust disease (Melampsora apocyni) and determination of the optimum irrigation regime in organic Apocynum venetum production. Agric. Water Manag. 2018, 205, 81–89. [Google Scholar] [CrossRef]
- Gao, P.; Nan, Z.B.; Christensen, M.J.; Barbetti, M.J.; Duan, T.Y.; Liu, Q.T.; Meng, F.J.; Huang, J.F. Factors Influencing Rust (Melampsora apocyni) Intensity on Cultivated and Wild Apocynum venetum in Altay Prefecture, China. Phytopathology 2019, 109, 593–606. [Google Scholar] [CrossRef] [PubMed]
- Viana, P.; Riaz, S.; Walker, M.A. Genetic dissection of agronomic traits within a segregating population of breeding table grapes. Genet. Mol. Res. GMR 2013, 12, 951–964. [Google Scholar] [CrossRef] [PubMed]
- Abebe, M.; Melaku, G.; Sherry, T.; Adegoke, A.; Bunmi, B. Carotenoid accumulation and agronomic performance of maize hybrids involving parental combinations from different marker-based groups. Food Chem. 2013, 148, 131–137. [Google Scholar]
- Kouamé, C.N.; Quesenberry, K.H. Cluster analysis of a world collection of red clover germplasm. Genet. Resour. Crop Evol. 1993, 40, 112–118. [Google Scholar] [CrossRef]
- Ramadan, M.; Gamal, S.M.A.; Selim, F.A. Mechanical properties, radiation mitigation and fire resistance of OPC-recycled glass powder composites containing nanoparticles. Constr. Build. Mater. 2020, 251, 12–21. [Google Scholar] [CrossRef]
- Ponnilavan, V.; Alam, M.M.; Ezhilan, M.; Pandian, K.; Kannan, S. Structural, mechanical, morphological and optical imaging characteristics of Yb3+ substituted zirconia toughened alumina. Mater. Today Commun. 2020, 24, 78–85. [Google Scholar]
- Liu, L.Z.; Zhu, B.; Si, J.P.; Zhang, X.L.; Gao, T.T.; Zhu, Y.Q. Studies on agronomic traits of seedlings from different F1 generations of Dendrobium officinale. China J. Chin. Mater. Medica 2013, 38, 498–503. [Google Scholar]
- Zhang, J.Y.; Di, H.Y.; Luo, K.; Jahufer, M.Z.Z.; Wu, F.; Duan, Z.; Stewart, A.; Yan, Z.Z.; Wang, Y.R. Coumarin content, morphological variation, and molecular phylogenetics of Melilotus. Molecules 2018, 23, 810. [Google Scholar] [CrossRef]
- Luo, K.; Jahufer, M.Z.Z.; Zhao, H.; Zhang, R.; Wu, F.; Yan, Z.Z.; Zhang, J.Y.; Wang, Y.R. Genetic improvement of key agronomic traits in Melilotus albus. Crop Sci. 2018, 58, 285–294. [Google Scholar] [CrossRef]
- Xie, W.Y.; Zhang, X.Y.; Wang, T.; Hu, J.J. Botany, traditional uses, phytochemistry and pharmacology of Apocynum venetum L.: A review. J. Ethnopharmacol. 2012, 141, 1–8. [Google Scholar] [CrossRef] [PubMed]
- Luo, K.; Jahufer, M.Z.Z.; Wu, F.; Di, H.Y.; Zhang, Y.F.; Meng, X.C.; Zhang, J.Y.; Wang, Y.R. Genotypic variation in a breeding population of yellow sweet clover (Melilotus officinalis). Front. Plant Sci. 2016, 7, 234–241. [Google Scholar] [CrossRef]
- Liu, J.; Gao, L.M.; Li, D.Z. Integrating a comprehensive DNA barcode reference library with a global map of yews (Taxus L.) for forensic identification. Mol. Ecol. Resour. 2018, 18, 1115–1131. [Google Scholar] [CrossRef]
- Wu, F.; Ma, J.X.; Meng, Y.Q.; Pascal Muvunyi, B.; Luo, K.; Zhang, J. Potential DNA barcodes for Melilotus species based on five single loci and their combinations. PLoS ONE 2017, 12, 69–82. [Google Scholar] [CrossRef] [PubMed]
- Zhou, H.; Ma, S.J.; Song, J.Y.; Lin, Y.L.; Wu, Z.J.; Han, Z.Z.; Yao, H. QR code labeling system for Xueteng-related herbs based on DNA barcode. Chin. Herb. Med. 2019, 11, 52–59. [Google Scholar] [CrossRef]
- Solano, J.; Anabalón, L.; Encina, F.; Esse, C.; Penneckamp, D. Hybrid identification in Nothofagus subgenus using high resolution melt with ITS and trnL approach. PeerJ 2019, 7, 67–79. [Google Scholar] [CrossRef]
- Guo, X.; Wang, Z.; Cai, D.; Song, L.; Bai, J. The chloroplast genome sequence and phylogenetic analysis of Apocynum venetum L. PLoS ONE 2022, 17, 0261710. [Google Scholar] [CrossRef]
- Tanaka, S.; Ito, M. DNA barcoding for identification of agarwood source species using trnL-trnF and matK DNA sequences. J. Nat. Med. 2019, 19, 42–50. [Google Scholar] [CrossRef]
- Wang, Y.S.; Feng, D.L.; Xue, H.; Nie, C.; Li, E.; Wu, X. Universal DNA primers for amplification of complete mitochondrial protein-coding genes and ribosomal RNA genes from Crocodilia. Conserv. Genet. Resour. 2013, 5, 873–877. [Google Scholar] [CrossRef]
- Zheng, C.; Fan, J.; Caraballo-Ortiz, M.A.; Liu, Y.; Liu, T.; Fu, G.; Su, X. The complete chloroplast genome and phylogenetic relationship of Apocynum pictum (Apocynaceae), a Central Asian shrub and second-class national protected species of western China. Gene 2022, 830, 146517. [Google Scholar] [CrossRef]
- GB/T 23387-2009; Evaluation of Forage Nutritional Quality-Grading Index (GI) Method. Chinese National Standard: Beijing, China, 2009. (In Chinese)
- Harville, D.H. Maximum likelihood approaches to variance component estimation and related problems. J. Am. Stat. Assoc. 1977, 72, 320–340. [Google Scholar] [CrossRef]
- Patterson, H.D.; Thompson, R. Recovery of inter-block information when block sizes are unequal. Biometrika 1971, 58, 445–554. [Google Scholar] [CrossRef]
- Patterson, H.D.; Thompson, R. Maximum likelihood estimation of components of variance. In Proceedings of the 8th International. Biometrical Conference, Constanta, Romania, 25–30 August 1977; pp. 197–207. [Google Scholar]
- Jahufer, M.Z.Z.; Luo, D.W. DeltaGen: A comprehensive decision support tool for plant breeders. Crop Sci. 2018, 58, 1251–1257. [Google Scholar] [CrossRef]
- Jahufer, M.Z.Z.; Cooper, M.; Bray, R.A.; Ayres, J.F. Evaluation of white clover (Trifolium repens L.) populations for summer moisture stress adaptation in Australia. Aust. J. Agric. Res. 1999, 50, 561–574. [Google Scholar] [CrossRef]
- Jahufer, M.Z.Z.; Luo, D.W. Pattern analysis; New pattern analysis study findings have been reported by researchers at AgResearch (DeltaGen: A comprehensive decision support tool for plant breeders). J. Eng. 2018, 67, 87–93. [Google Scholar]
- Excoffier, L.; Lischer, H.E.L. Arlequin suite ver 3.5: A new series of programs to perform population genetics analyses under Linux and Windows. Mol. Ecol. Res. 2010, 10, 564–567. [Google Scholar] [CrossRef]
- Asiya, M.; Sun, T.; Selike, D.; Cui, H.X. Resources and development and Utilization Prospect of Daye white hemp in Xinjiang. J. China Agric. Resour. Reg. Plan. 2003, 24, 27–30. [Google Scholar]
- Cooper, M.; Messina, C.D.; Podlich, D.; Totir, L.R.; Baumgar-ten, A.; Hausmann, N.J. Predicting the future of plant breeding: Complementing empirical evaluation with genetic prediction. Crop Past. Sci. 2014, 65, 311–336. [Google Scholar] [CrossRef]
- Zhang, X.W.; Cao, Y.; Zhang, W. Adenine·cytosine substitutions are an alternative pathway of compensatory mutation in angiosperm ITS2. RNA 2020, 26, 123–128. [Google Scholar] [CrossRef]
- Zhang, Y.X.; Li, G.Q.; Zhang, Q.; Zhang, H.; Zhu, L.; Wan, H.X. The preliminary research on photosynthetic characteristics of Apocynum venetum under different shading. Northwest Bot. 2007, 27, 2555–2558. [Google Scholar]
- Ma, Q.; Su, J.J.; Ning, X.Z.; Li, J.L.; Liu, P.; Chen, H.; Lin, H.; Deng, F.J. Genetic diversity analysis on phenotypic traits of sea island cotton (G. barbadense) germplasm resources in Xinjiang. Xinjiang Agric. Sci. 2016, 53, 197–206. [Google Scholar]
- Pu, Y.Y.; Gong, Y.C.; Li, N.N.; Liu, Y.; Wang, Q.L.; Song, D.T.; Yan, T.J.; Ding, H.F. The progress in genetic diversity of the soybean germplasm in China. Soy Sci. 2018, 37, 315–321. [Google Scholar]
- Yang, J.; Yu, H.Y.; Li, X.J.; Dong, J.G. Genetic diversity and population structure of Commelina communis in China based on simple sequence repeat markers. J. Integr. Agric. 2018, 17, 2292–2301. [Google Scholar] [CrossRef]
- Sun, L.C. Genetic Diversity Analysis of Early Japonica Rice Germplasm in Ningxia and Northeast Reigon of China; Ningxia University: Yinchuan, China, 2016. [Google Scholar]
- Shi, Y.C.; Tang, J.M.; Chai, S.F.; Zou, R.; Chen, Z.Y.; Wei, X. Genetic diversity and relationship of endangered plant Heteroplexis microcephala assessed with ISSR polymorphisms. Guangxi Plants 2017, 37, 9–14. [Google Scholar]
- Yu, B.; Liu, J.; Li, M.H.; Duan, H.M.; Wang, P.F.; Yuan, J.L.; Ye, X.M. Evaluation on the color characters of tuber and flour of introduced potato germplasm resources. J. Gansu Agric. Univ. 2019, 54, 37–47. [Google Scholar]
- Zhang, S.J.; Li, X.H.; Liu, C.J.; Tang, L.Y.; Zhang, X.Y.; Zhang, J.Y.; Wang, H.T. Analysis and evaluation on nutritive quality indicators of different varieties of radish. Orthern Hortic. 2018, 11, 8–14. [Google Scholar] [CrossRef]
- Sancin, P. The phenolic compounds of underground parts of Apocynum venetum. Planta Medica 1971, 20, 123–127. [Google Scholar] [CrossRef]
- Li, M.H.; Han, G.T.; Yu, J.Y. Microstructure and mechanical properties of Apocynum venetum fibers extracted by alkali-assisted ultrasound with different frequencies. Fibers Polym. 2010, 11, 112–119. [Google Scholar] [CrossRef]
- Song, C.H.; Zhang, C.Q.; Li, G.L.; Zhang, X.L.; Chen, G.; You, J.M. Highly selective and sensitive determination of free and total amino acids in Apocynum venetum L. (Luobuma tea) by a developed HPLC–FLD method coupled with pre-column fluorescent labelling. Int. J. Food Sci. Nutr. 2012, 63, 78–86. [Google Scholar] [CrossRef]
- Lei, J.Q. Quantitative determination of quercetin in the leaves of Luo-Bu-Ma (Apocynum venetum). Zhong Yao Tong Bao 1982, 7, 145–152. [Google Scholar]
- Wei, Z.; Zheng, D.; Chang, X.J.; Zhang, C.H.; Rong, G.H.; Gao, X.D.; Zeng, Z.; Wang, C.P.; Chen, Y.; Rong, Y.H.; et al. Protective effect of the total flavonoids from Apocynum venetum L. on carbon tetrachloride-induced hepatotoxicity in vitro and in vivo. J. Physiol. Biochem. 2018, 74, 301–312. [Google Scholar]
- Grundmann, O.; Mnakajima, J.; Seo, S.J.; Butterweck, V. Anti-anxiety effects of Apocynum venetum L. in the elevated plus maze test. J. Ethnopharmacol. 2006, 110, 406–411. [Google Scholar] [CrossRef]
- Tan, Z.J.; Yi, Y.J.; Wang, H.Y.; Zhou, W.L.; Wang, C.Y. Extraction, preconcentration and isolation of flavonoids from Apocynum venetum L. leaves using lonic liquid-based ultrasonic-assisted extraction coupled with an aqueous biphasic system. Molecules 2016, 21, 262. [Google Scholar] [CrossRef] [PubMed]
- Cao, Y.H.; Zhang, X.; Fang, Y.Z.; Ye, J.N. Determination of active ingredients of Apocynum venetum by capillary electrophoresis with electrochemical detection. Mikrochim. Acta 2001, 137, 57–62. [Google Scholar] [CrossRef]
- Xu, Y.C.; Wang, C.; Liu, H.S.; Zhu, G.L.; Fu, P.; Wang, L.P.; Zhu, W.M. Meroterpenoids and isocoumarinoids from a myrothecium fungus associated with Apocynum venetum. Mar. Drugs 2018, 16, 363. [Google Scholar] [CrossRef] [PubMed]
- Hale, R.W.; Coey, W.E. Genotype-environment interactions in a herd of bacon pigs. J. Agric. Sci. 1963, 61, 81–87. [Google Scholar] [CrossRef]
- Herrera-Ojeda, J.B.; Parra-Bracamonte, G.M.; Lopez-Villalobos, N.; Martínez-González, J.C.; Magaña-Monforte, J.G.; Morris, S.T.; López-Bustamante, L.A. Genetic variances and covariances of live weight traits in Charolais cattle by multi-trait analysis. J. Appl. Genet. 2019, 60, 385–391. [Google Scholar] [CrossRef] [PubMed]
- Wade, L.J.; Mclaren, C.G.; Quintana, L.; Harnpichitvitaya, D.; Rajatasereekul, S.; Sarawgia, K.; Kumar, A.; Ahmed, H.U.; Singha, K.; Rodriguez, R.; et al. Genotype by environment interactions across diverse rainfed lowland rice environments. Field Crops Res. 1999, 64, 35–50. [Google Scholar] [CrossRef]
- Susan, D. The Response to differing selection on plant physiological traits: Evidence for Local Adaptation. Evolution 1996, 50, 103–110. [Google Scholar]
- Williams, T.A.; Abberton, M.T.; Rhodes, I. Performance of white clover varieties combined in blends and alone when grown with perennial ryegrass under sheep and cattle grazing. Grass Forage Sci. 2003, 58, 90–93. [Google Scholar] [CrossRef]
- Kim, H.M.; Oh, S.H.; Bhandari, G.S.; Kim, C.S.; Park, C.W. DNA barcoding of Orchidaceae in Korea. Mol. Ecol. Resour. 2013, 8, 18–24. [Google Scholar] [CrossRef] [PubMed]
- Qiu, Y.X.; Huang, A.J.; Fu, C.X. Studies on genetic diversity in Changium smyrnioides Wolff (Umbelliferae). Acta Phytotaxon. Sin. 2000, 38, 111–120. [Google Scholar]
- Qu, M.; Tang, W.; Liu, Q.H.; Wang, D.; Ding, S. Genetic diversity within grouper species and a method for interspecific hybrid identification using DNA barcoding and RYR3 marker. Mol. Phylogenet. Evol. 2017, 121, 46–51. [Google Scholar] [CrossRef]
- Mo, Y.H.; Liang, J.; Xie, J.L.; Lin, L.; Li, C.N. A review of sugarcane genetics and breeding based on molecular markers. South China Agric. 2021, 15, 233–234. [Google Scholar]


| Accession Number | Species | Phenotype |
|---|---|---|
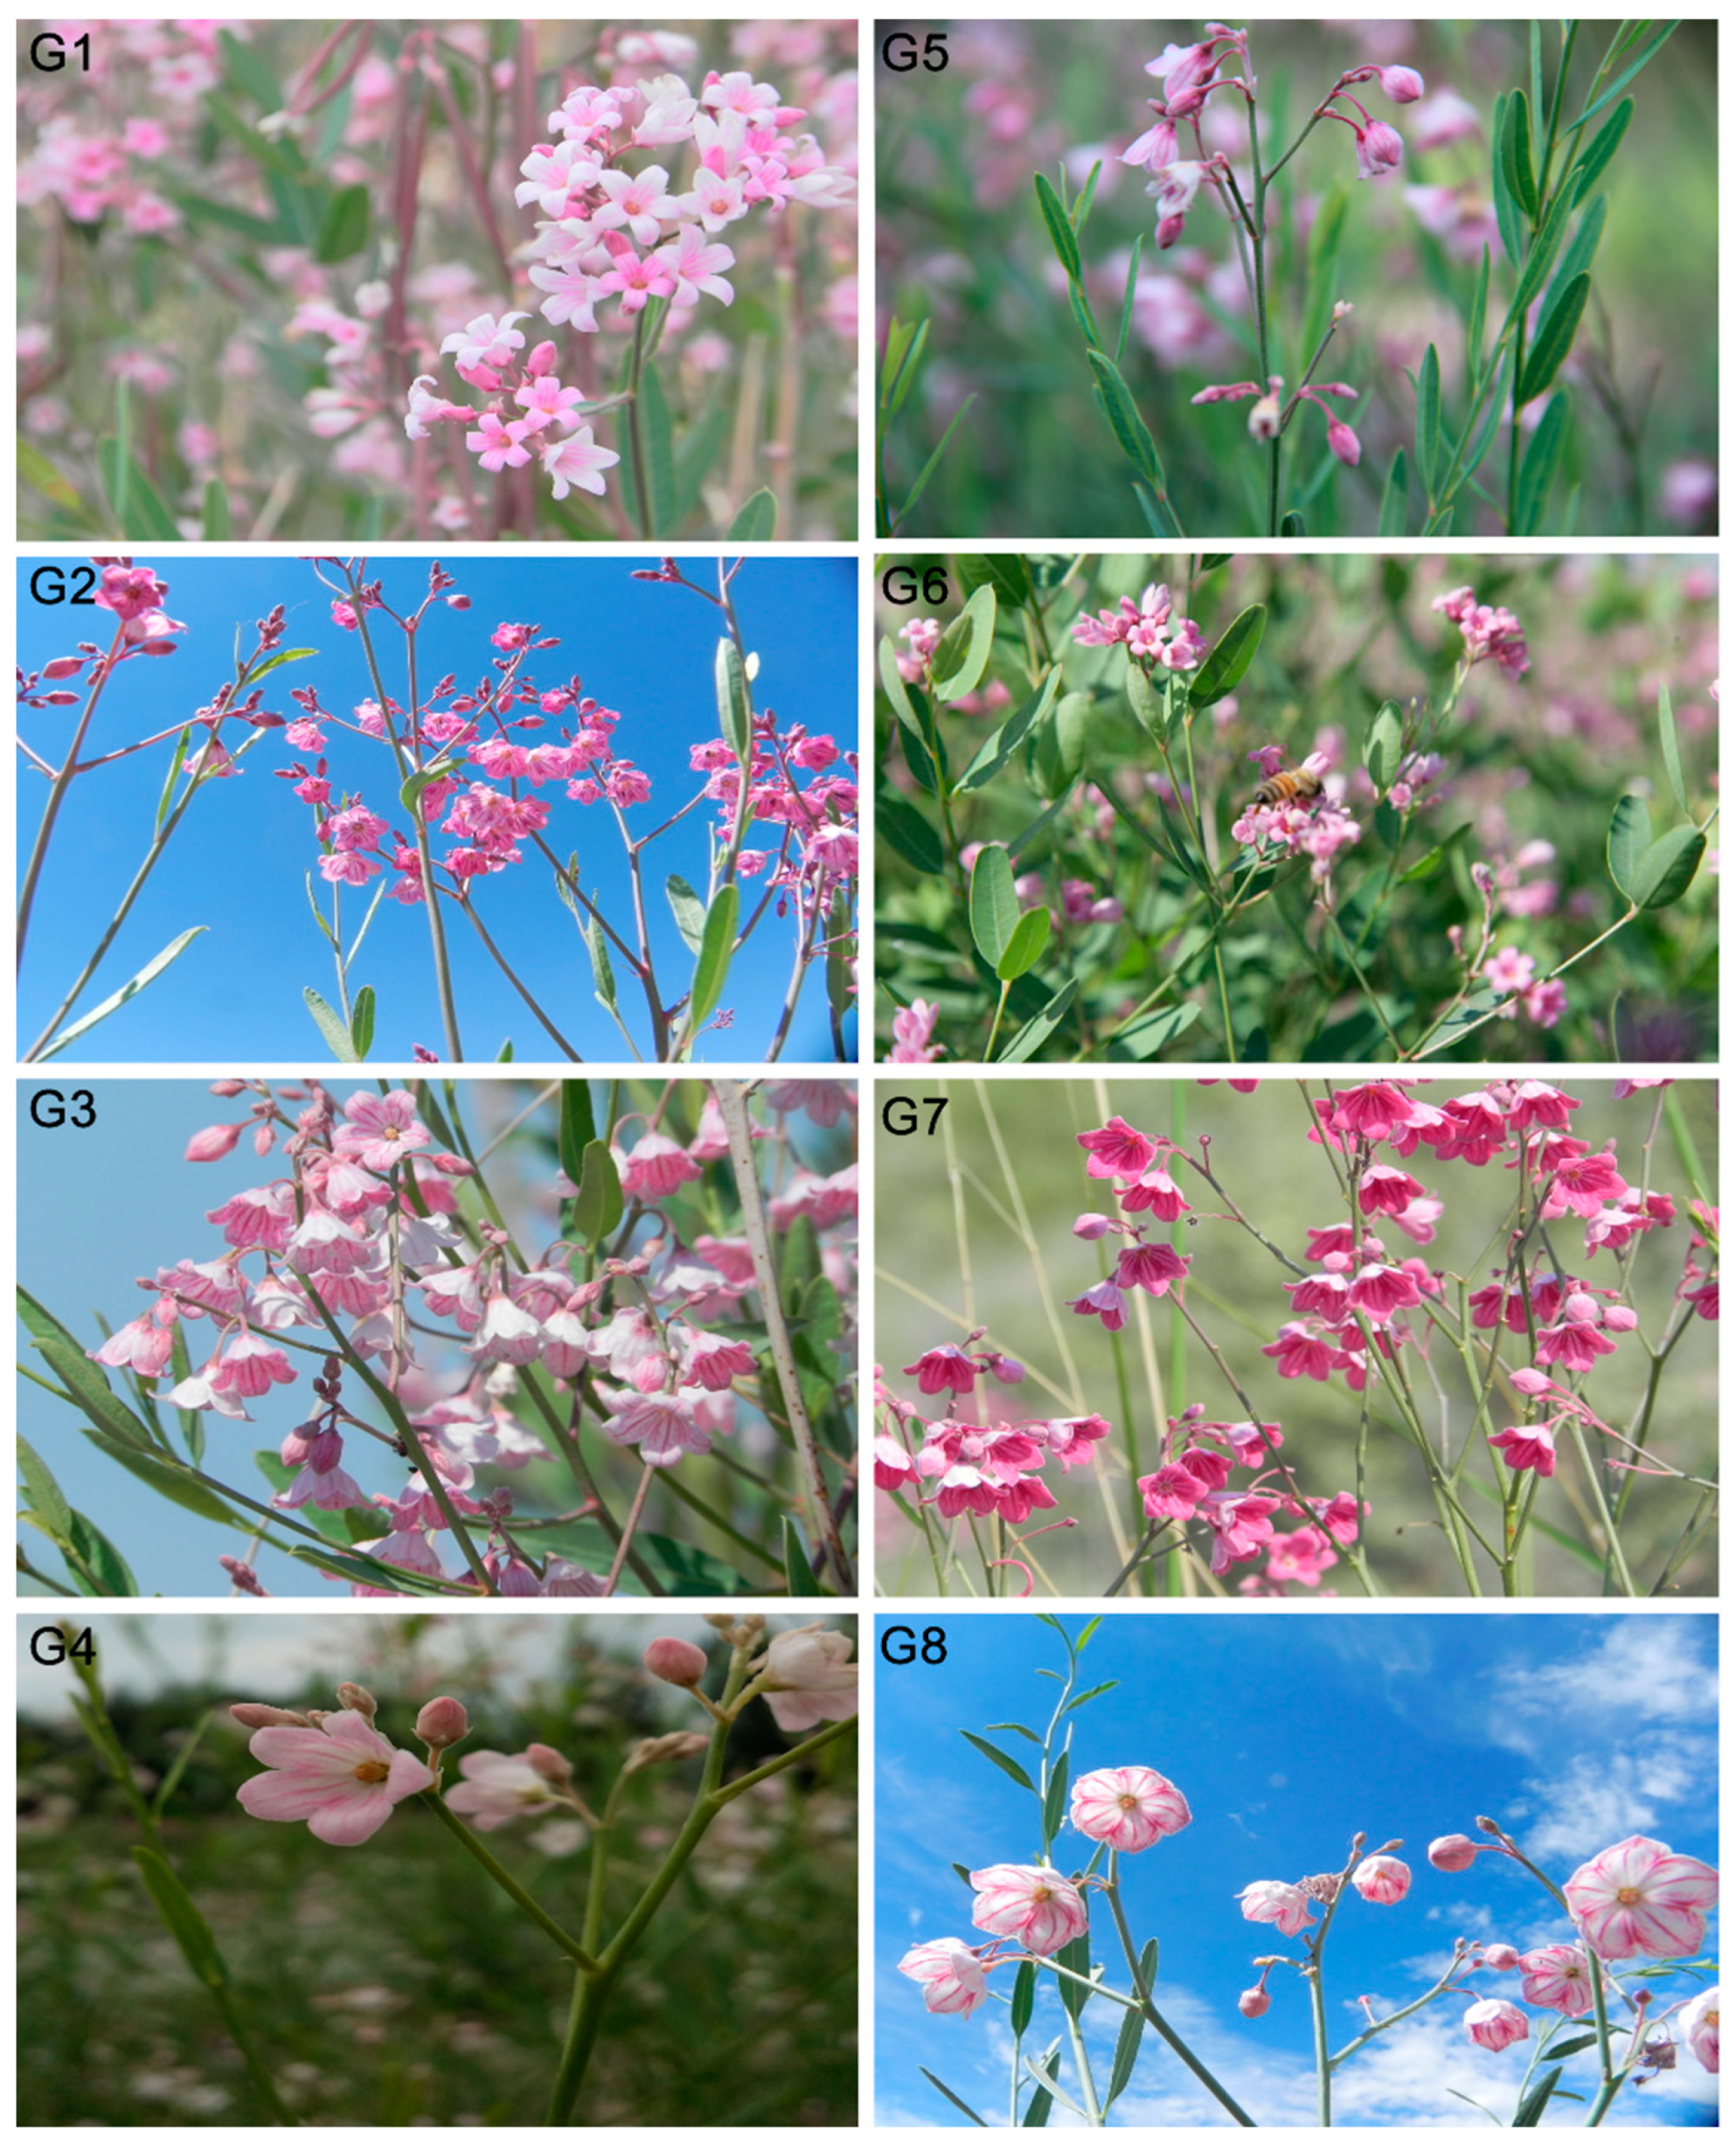
| G1 | A. venetum | Red stems and little flowers |
| G2 | A. pictum | Red stems and medium-sized flowers |
| G3 | Purple spotted medium-sized flowers | |
| G4 | Thick leaves and medium-sized flowers | |
| G5 | Slender leaves and medium-sized flowers | |
| G6 | Green stems and medium-sized flowers | |
| G7 | Green stems and medium-sized flowers | |
| G8 | Green stems and big flowers |
| PH (mm) | SD (mm) | IL (mm) | BN | LDW (g) | SDW (g) | SLR | |
|---|---|---|---|---|---|---|---|
| Mean | 714.5 | 4.3 | 37.3 | 4.39 | 20.13 | 18.45 | 0.86 |
| Range | 664.1–779.8 | 3.9–4.5 | 34.5–40.9 | 3.75–4.88 | 19.15–21.77 | 17.52–19.09 | 0.79–0.96 |
| LSD0.05 | 88.11 | 0.26 | 1.41 | 11.03 | 20.12 | 13.77 | 0.86 |
| σ2g | 841.23 ± 95.56 | 5.57 ± 0.36 | 1.87 ± 0.28 | 3.63 ± 0.62 | 29.07 ± 14.48 | 0.07 ± 0.001 | 0.04 ± 0.005 |
| σ2y | ns | ns | ns | ns | ns | ns | ns |
| σ2gy | 29.05 ± 12.73 | 0.06 ± 0.03 | ns | ns | 17.21 ± 8.49 | 21.97 ± 7.94 | ns |
| σ2gl | ns | ns | ns | ns | ns | ns | ns |
| σ2gly | 46.02 ± 19.50 | 0.09 ± 0.04 | 0.22 ± 0.07 | 0.42 ± 0.20 | ns | ns | 0.0009 ± 0.0003 |
| σ2Ɛ | 591.57 ± 33.99 | 2.92 ± 0.17 | 8.09 ± 0.45 | 9.78 ± 0.54 | 79.28 ± 5.31 | 77.21 ± 6.22 | 0.02 ± 0.002 |
| PH (mm) | SD (mm) | IL (mm) | BN | LDW (g) | SDW (g) | SLR | |
|---|---|---|---|---|---|---|---|
| Mean | 685.6 | 3.9 | 40.3 | 5.08 | 14.90 | 15.37 | 0.90 |
| Range | 543.4–827.7 | 3.3–4.8 | 33.4–43.4 | 3.98–5.99 | 10.19–16.45 | 10.00–17.63 | 0.74–1.06 |
| LSD0.05 | 88.95 | 0.21 | 1.08 | 10.32 | 26.83 | 70.81 | 0.66 |
| σ2g | 890.40 ± 77.45 | 0.003 ± 0.001 | ns | 11.71 ± 1.44 | 80.25 ± 8.17 | 574.91 ± 27.31 | 0.04 ± 0.008 |
| σ2y | ns | 0.04 ± 0.02 | ns | ns | ns | ns | ns |
| σ2gy | 44.70 ± 13.86 | 0.003 ± 0.0008 | 0.23 ± 0.07 | 0.92 ± 0.38 | 5.17 ± 1.73 | 8.97 ± 2.79 | ns |
| σ2Ɛ | 121.03 ± 7.18 | 0.01 ± 0.0006 | 0.75 ± 0.04 | 10.60 ± 0.62 | 12.68 ± 0.88 | 16.58 ± 1.15 | 0.16 ± 0.01 |
| CP (%) | NDF (%) | ADF (%) | EE (%) | CF (%) | Ash (%) | FLA (mg/100 g) | |
|---|---|---|---|---|---|---|---|
| Mean | 15.36 | 26.83 | 69.14 | 7.48 | 22.16 | 11.28 | 2.12 |
| Range | 12.18–16.77 | 22.88–30.39 | 66.05–73.81 | 4.88–13.54 | 18.68–24.73 | 9.73–12.09 | 1.94–2.36 |
| LSD0.05 | 18.32 | 9.09 | 21.21 | 40.08 | 7.71 | 16.18 | 0.73 |
| σ2g | 37.79 ± 3.26 | 8.05 ± 2.46 | 44.19 ± 11.32 | 174.07 ± 30.56 | 0.02 ± 0.02 | 29.57 ± 2.45 | 0.03 ± 0.01 |
| σ2l | ns | ns | ns | ns | ns | ns | ns |
| σ2gl | 1.48 ± 0.69 | ns | ns | ns | ns | ns | 0.05 ± 0.02 |
| σ2Ɛ | 2.01 ± 0.42 | 12.07 ± 2.13 | 43.62 ± 7.58 | 87.69 ± 15.03 | 45.29 ± 8.16 | 1.71 ± 0.37 | 0.05 ± 0.01 |
| Trait | SD | IL | BN | LDW | CP | NDF | ADF | EE | CF | FLA | Ash |
|---|---|---|---|---|---|---|---|---|---|---|---|
| PH | 0.23 | 0.56 | 0.66 * | 0.40 | −0.50 | 0.03 | −0.14 | 0.39 | −0.51 | −0.86 ** | 0.39 |
| SD | 0.38 | −0.41 | 0.63 | −0.20 | −0.10 | 0.08 | −0.17 | 0.13 | −0.47 | 0.18 | |
| IL | 0.26 | 0.39 | −0.51 | −0.64 | −0.13 | 0.31 | −0.72 * | −0.71 * | 0.53 | ||
| BN | 0.08 | −0.48 | −0.09 | −0.44 | 0.03 | −0.38 | −0.53 | 0.27 | |||
| LDW | 0.68 * | 0.18 | 0.33 | −0.17 | −0.23 | −0.39 | 0.63 | ||||
| CP | 0.19 | −0.15 | 0.20 | 0.31 | 0.47 | −0.93 ** | |||||
| NDF | −0.53 | 0.18 | 0.16 | 0.37 | −0.18 | ||||||
| ADF | 0.38 | −0.22 | 0.46 | 0.41 | |||||||
| EE | −0.72 | −0.08 | 0.00 | ||||||||
| CF | 0.33 | −0.42 | |||||||||
| FLA | −0.31 |
| Sequence | Source of | d.f. | Sum of Squares | Variance Components | Percentage of Variation | Fst |
|---|---|---|---|---|---|---|
| Variation | ||||||
| Nuclear sequence ITS | Among groups | 1 | 0.45 | 0.12 | 33.33 | 0.33 |
| Within groups | 6 | 1.43 | 0.24 | 66.67 | ||
| Chloroplast DNA sequences (matK+psbA-trnH+rbcL+trnlL) | Among groups | 1 | 7.13 | 1.24 | 26.57 | 0.27 |
| Within groups | 6 | 20.5 | 3.42 | 73.43 |
Disclaimer/Publisher’s Note: The statements, opinions and data contained in all publications are solely those of the individual author(s) and contributor(s) and not of MDPI and/or the editor(s). MDPI and/or the editor(s) disclaim responsibility for any injury to people or property resulting from any ideas, methods, instructions or products referred to in the content. |
© 2024 by the authors. Licensee MDPI, Basel, Switzerland. This article is an open access article distributed under the terms and conditions of the Creative Commons Attribution (CC BY) license (https://creativecommons.org/licenses/by/4.0/).
Share and Cite
Zhao, Y.; Feng, R.; Li, T.; Zulfiqhar, J.M.Z.; Wang, L.; Zhang, J. Genotypic Variation in Agronomic Traits and Molecular Markers among Chinese Luobuma (Apocynum spp.) Germplasm Accessions. Agriculture 2024, 14, 332. https://doi.org/10.3390/agriculture14030332
Zhao Y, Feng R, Li T, Zulfiqhar JMZ, Wang L, Zhang J. Genotypic Variation in Agronomic Traits and Molecular Markers among Chinese Luobuma (Apocynum spp.) Germplasm Accessions. Agriculture. 2024; 14(3):332. https://doi.org/10.3390/agriculture14030332
Chicago/Turabian StyleZhao, Yufeng, Runqiu Feng, Tao Li, Jahufer Mohamed Zain Zulfiqhar, Li Wang, and Jiyu Zhang. 2024. "Genotypic Variation in Agronomic Traits and Molecular Markers among Chinese Luobuma (Apocynum spp.) Germplasm Accessions" Agriculture 14, no. 3: 332. https://doi.org/10.3390/agriculture14030332
APA StyleZhao, Y., Feng, R., Li, T., Zulfiqhar, J. M. Z., Wang, L., & Zhang, J. (2024). Genotypic Variation in Agronomic Traits and Molecular Markers among Chinese Luobuma (Apocynum spp.) Germplasm Accessions. Agriculture, 14(3), 332. https://doi.org/10.3390/agriculture14030332