


Exploring Sustainability in Wineries: Evaluating Food Safety and Environmental Management Aligning with the Farm to Fork Strategy

 , and
, and
Abstract
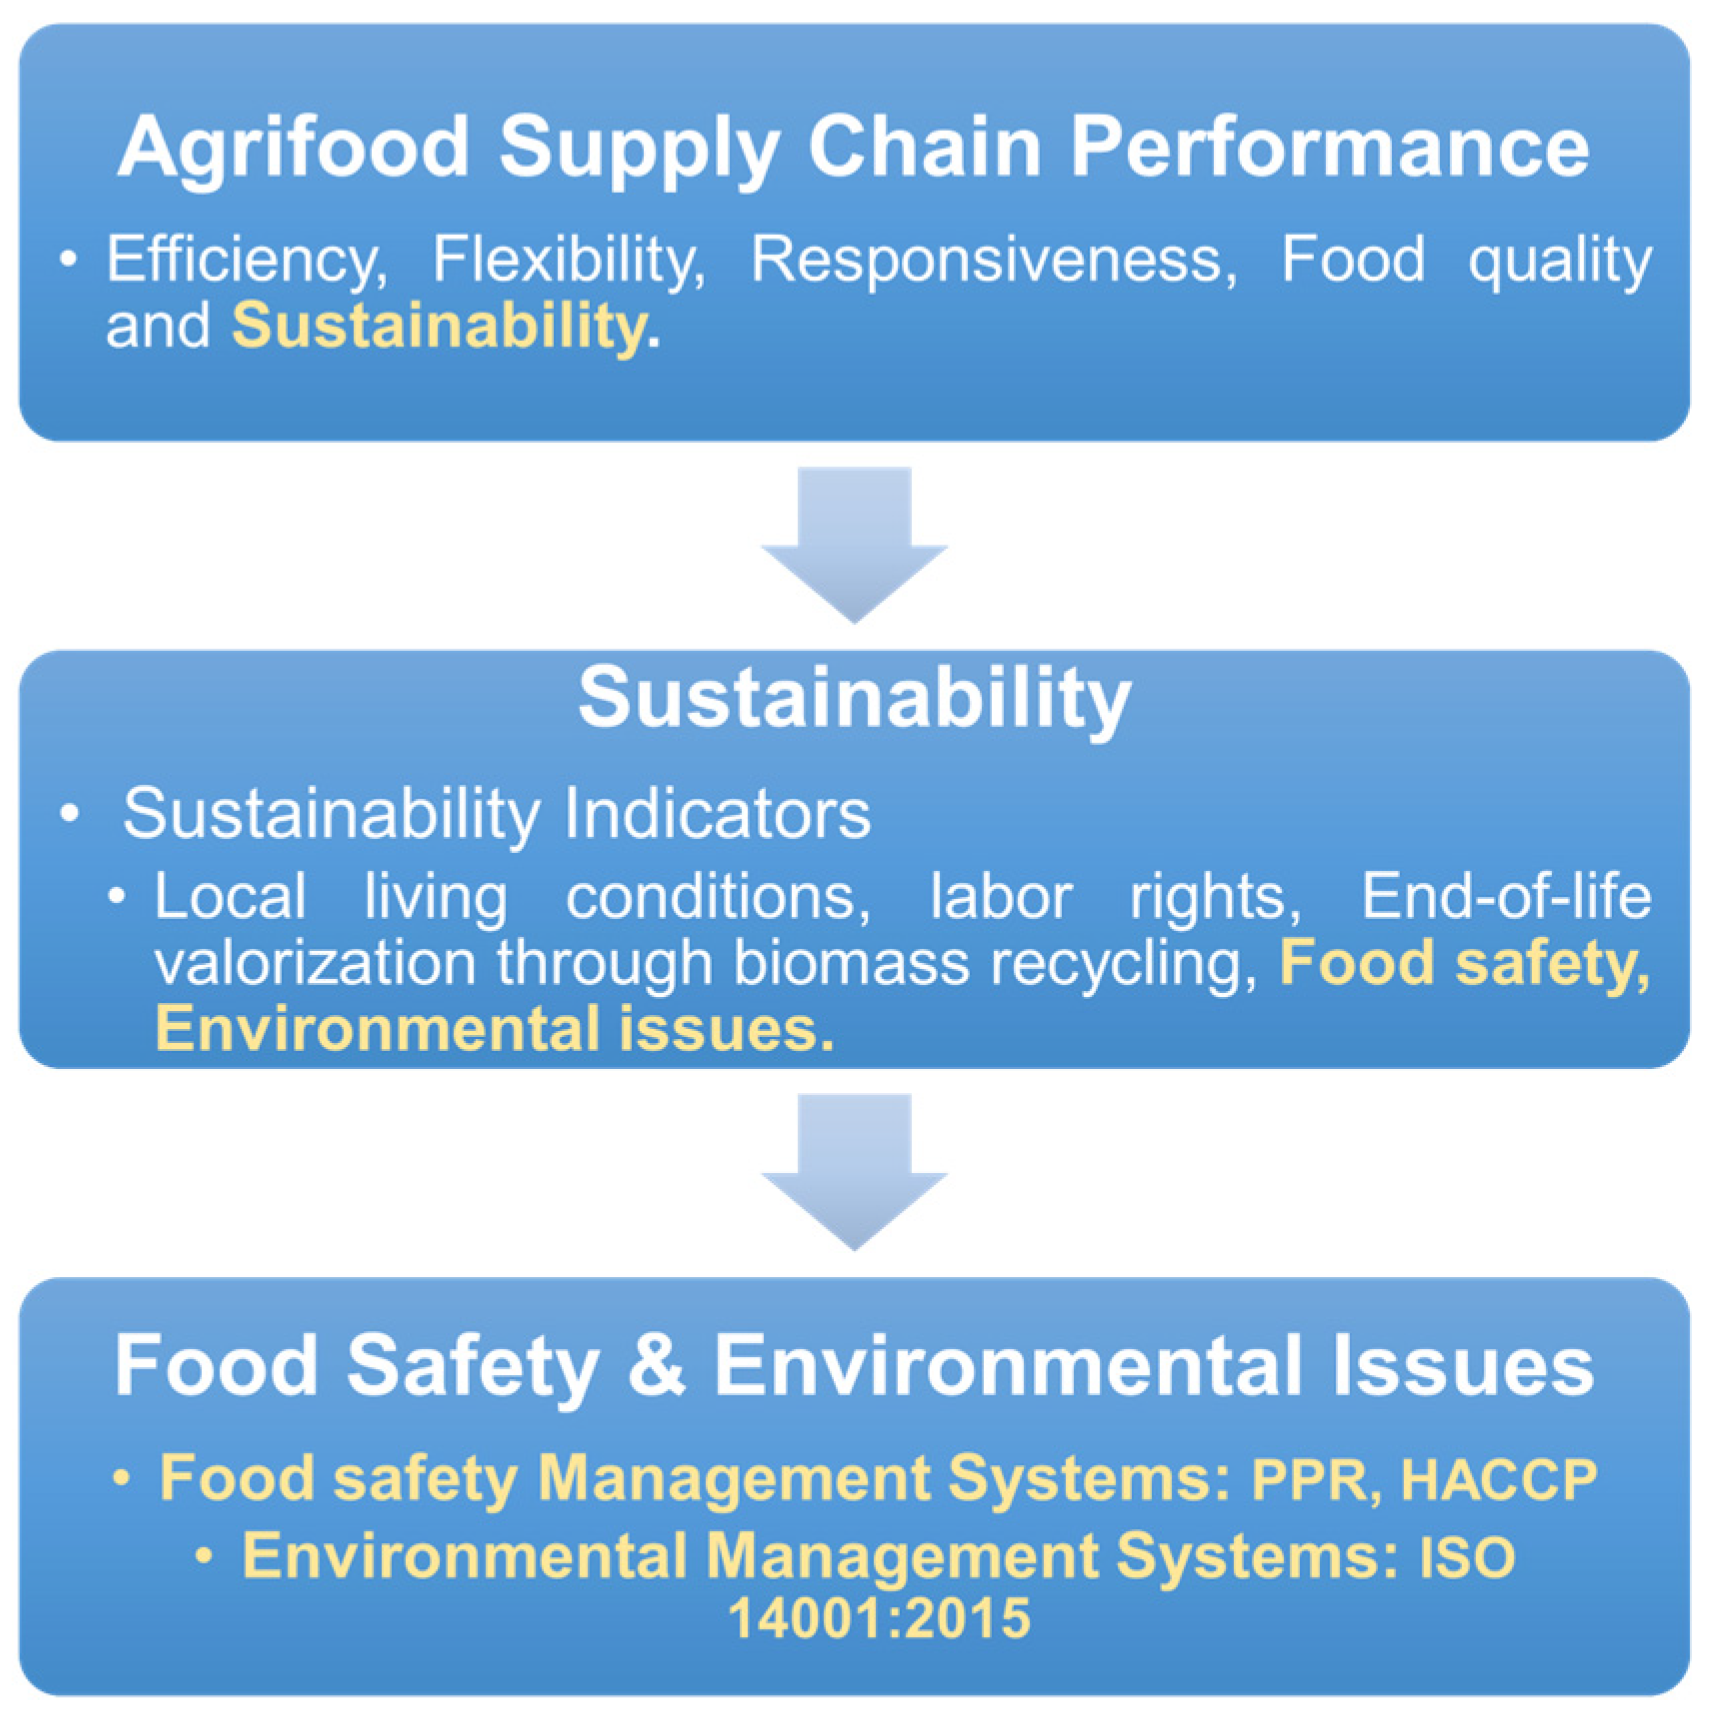
1. Introduction
2. Materials and Methods
2.1. First Step
2.2. Second Step
2.3. Third Step
2.4. Four Step
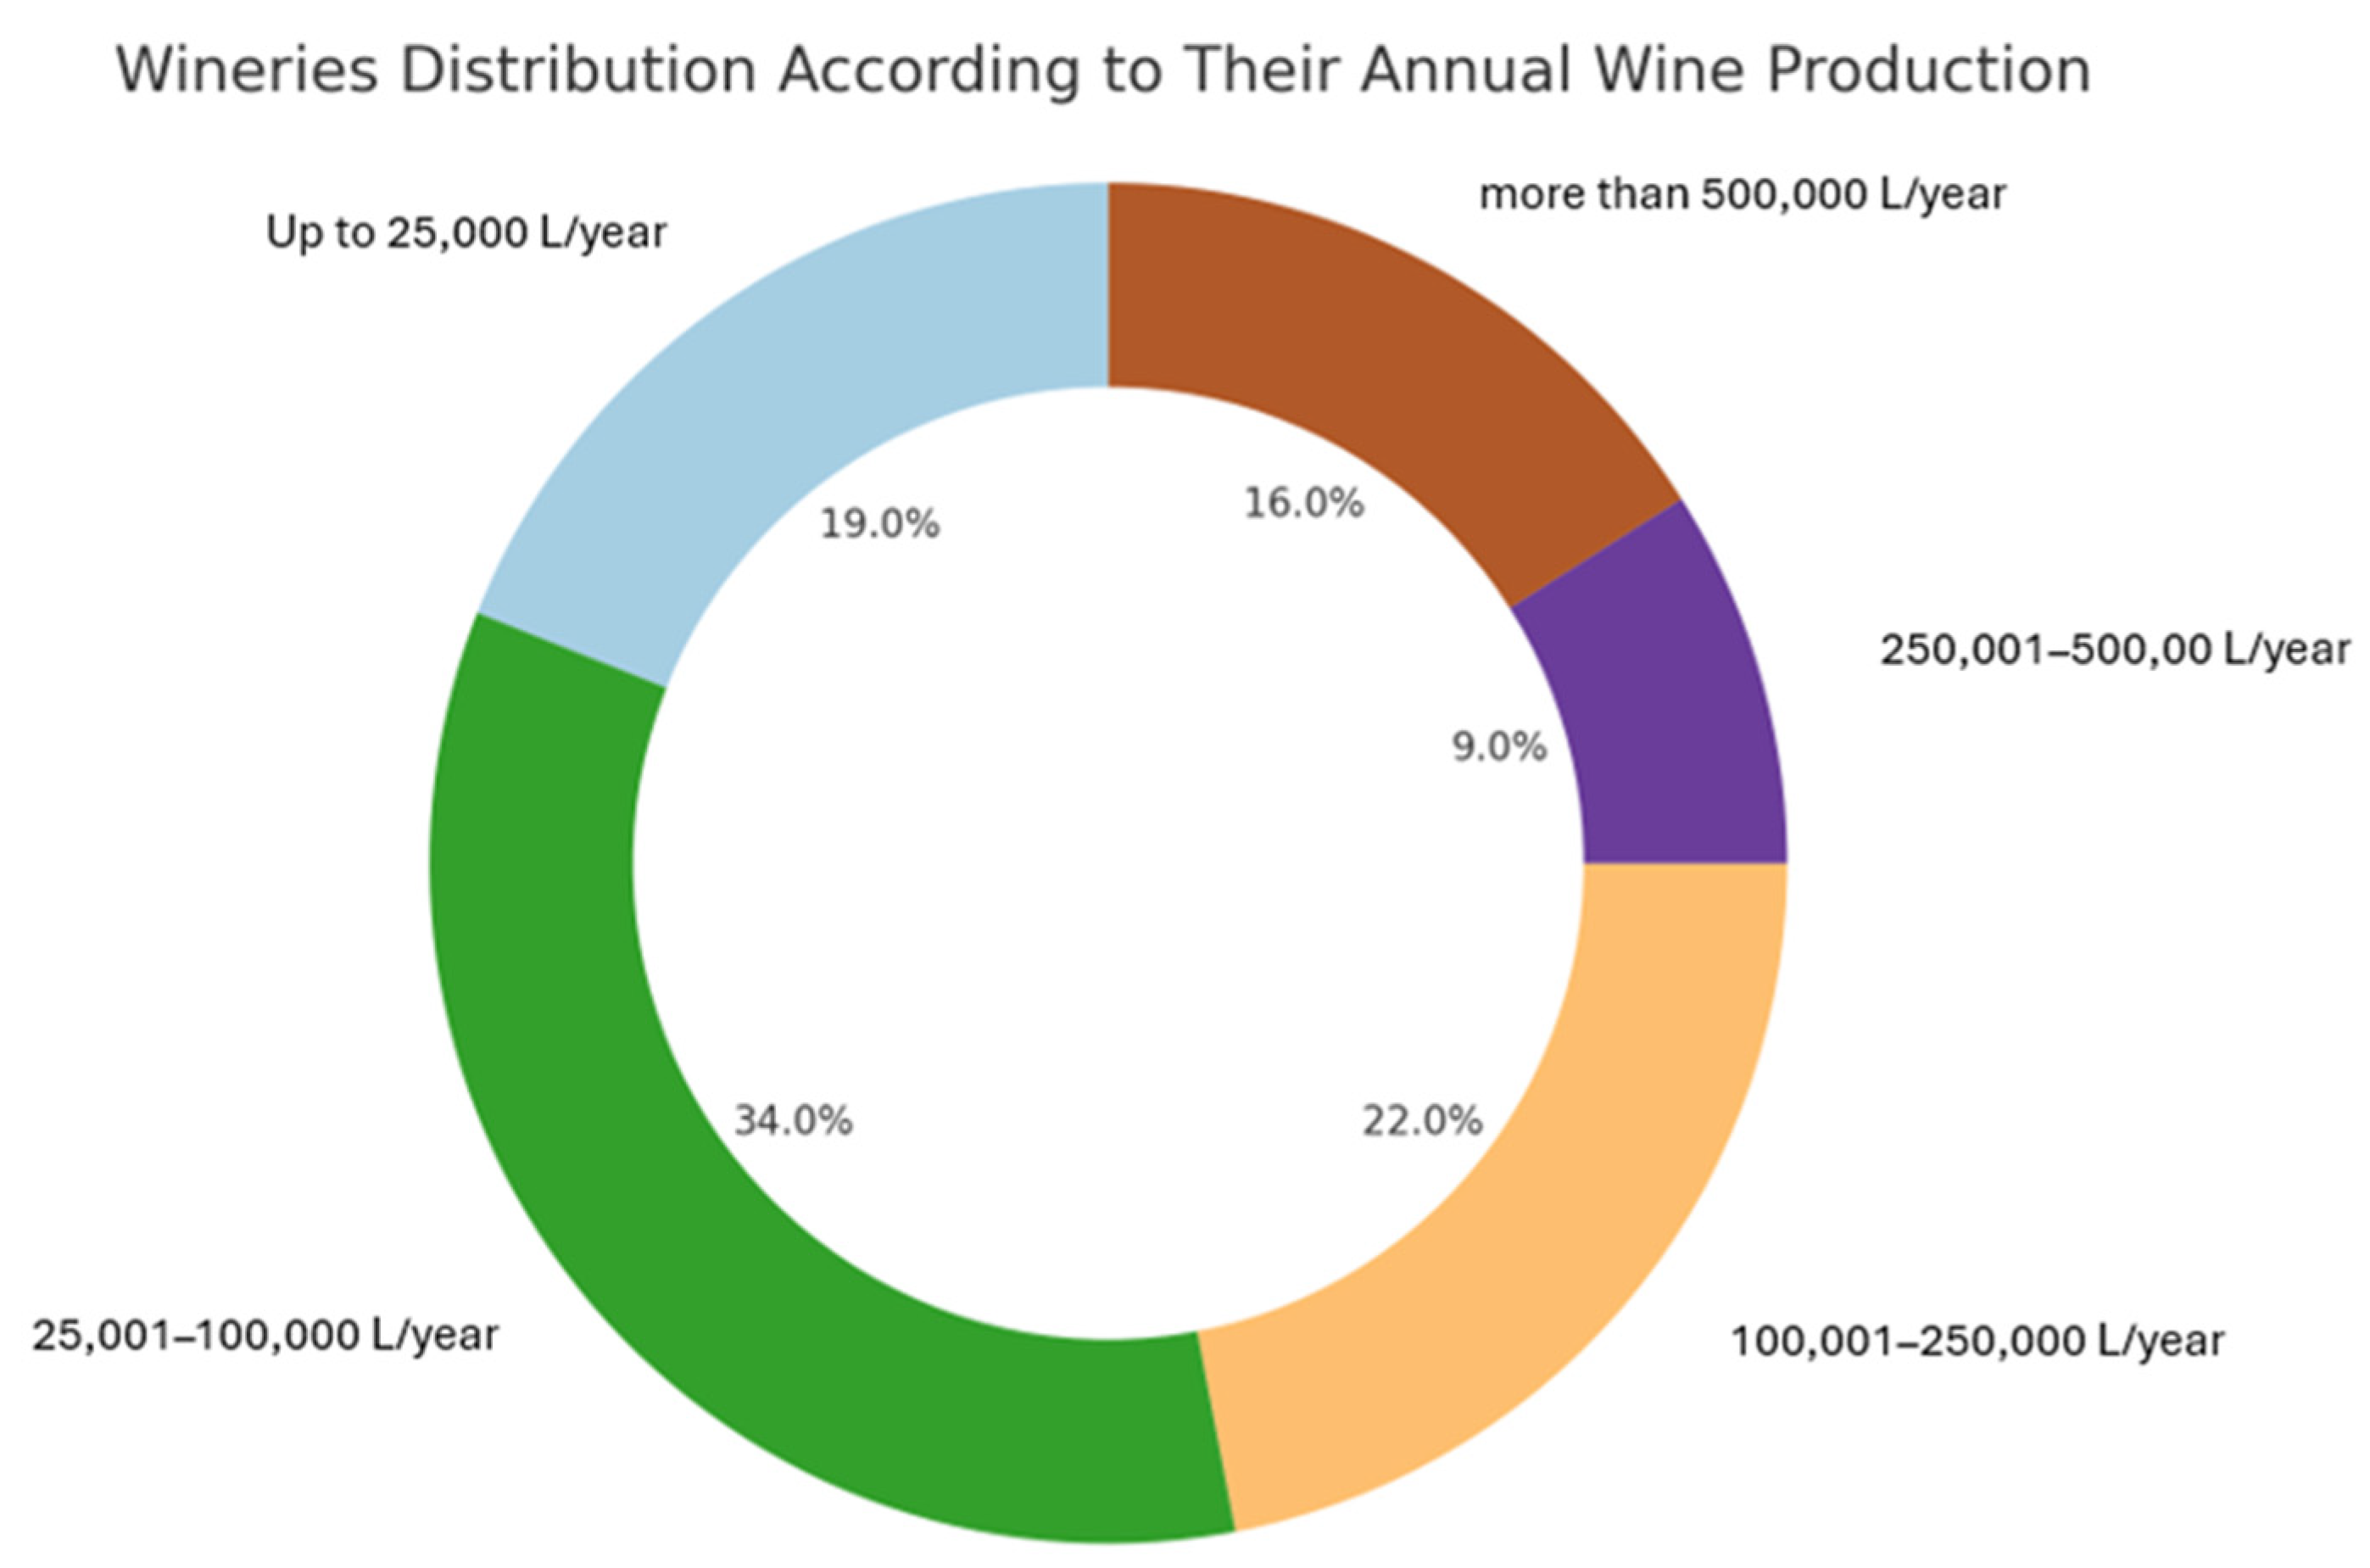
3. Results
3.1. FS Management Performance
3.2. CCP Control Performance
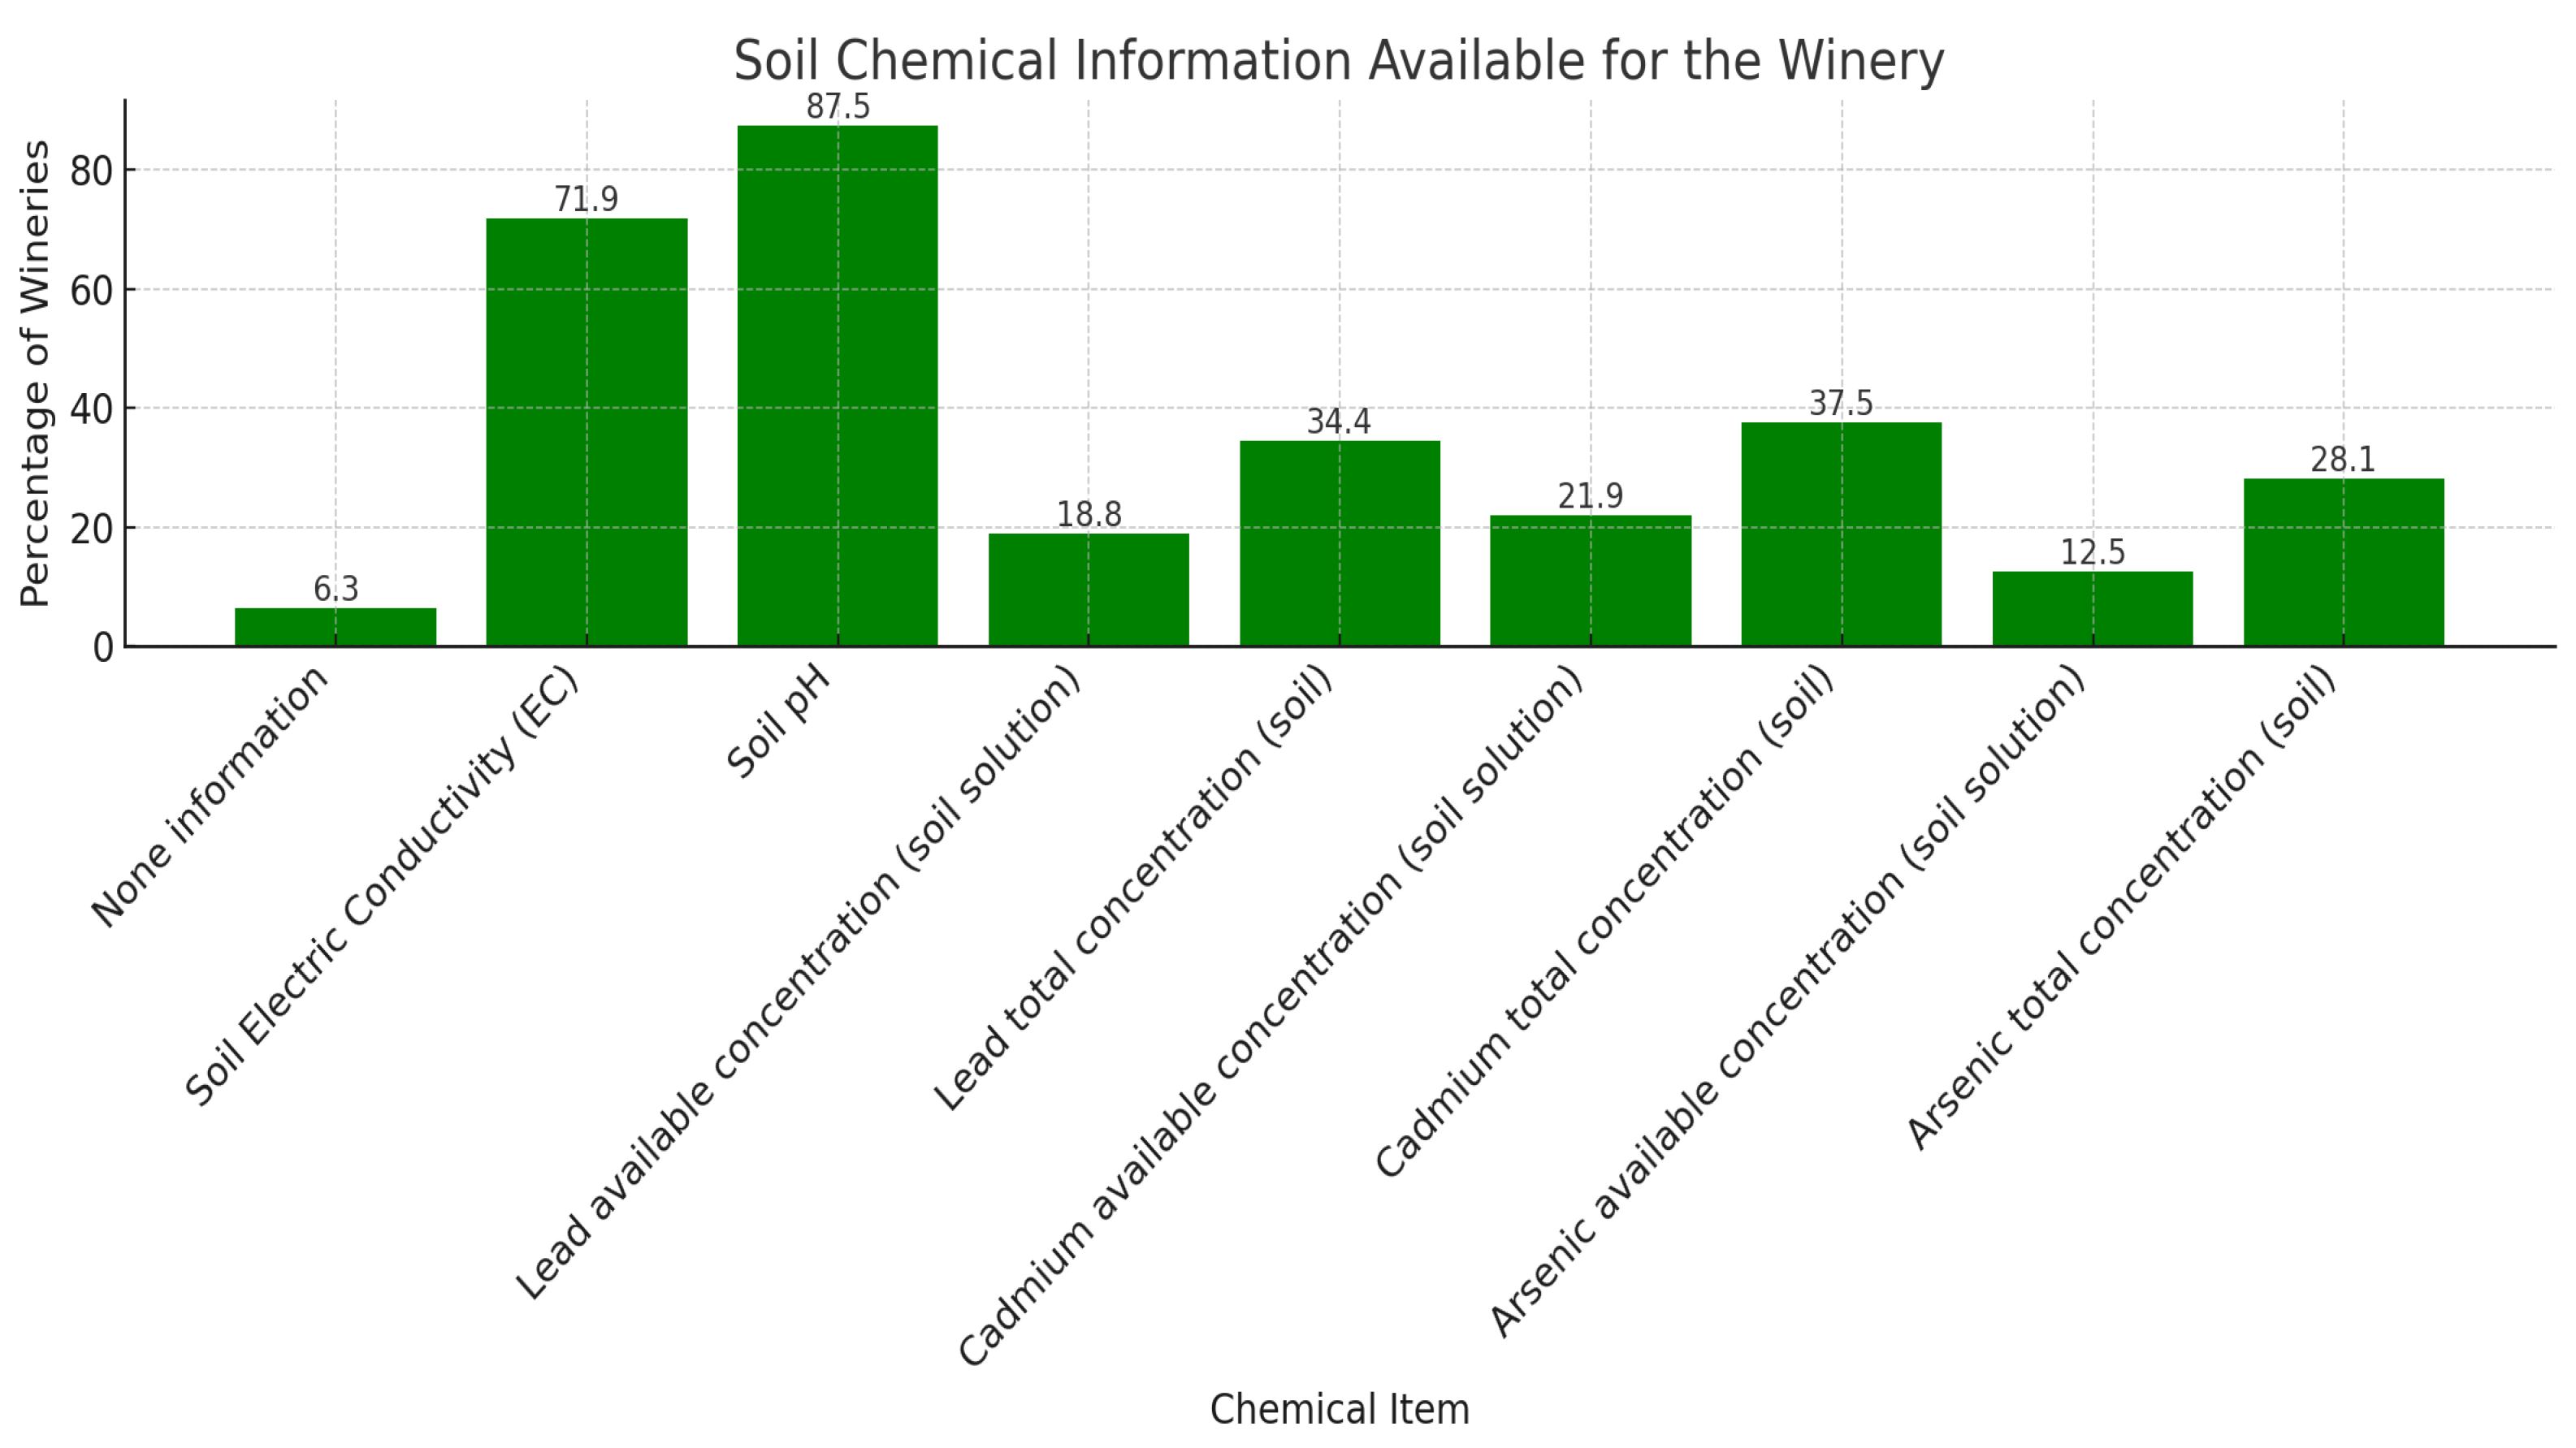
3.3. EM Performance
3.4. FSMS Performance Indicators
- is the aggregated FSWT variable for the winery;
- is a variable that stands for the level of workers trained in GMPs and takes values 0.33, 0.66, or 1;
- is the variable that represents the level of workers trained in CCPs and takes values 0.33, 0.66, or 1;
- is the number of variables that have been aggregated, and its value is 2.
- is the aggregated LIU variable for the winery;
- is a variable that stands for winery performance on legislation identification about arsenic, cadmium, and lead and takes values 0.33, 0.66, or 1;
- is a variable that represents winery performance on updated legislation information through AESAN and takes values 0 or 1;
- is the number of variables that have been aggregated, and its value is 2.
- is the aggregated CCP-MCHEM variable for the winery;
- is a variable that stands for chemical information about arsenic, cadmium, and lead concentrations in the soil that a winery had; is each item of this multiple-choice question (yes = 0.125, no = 0);
- is a variable that represents the wineries’ capacity to hold a chemical analysis by their own or external means. if , otherwise, ;
- is a variable that stands for the wineries’ capacity to hold arsenic, cadmium, and lead chemical analysis by their own or external means. if , otherwise, ;
- is the number of variables that have been aggregated, and its value is 3.
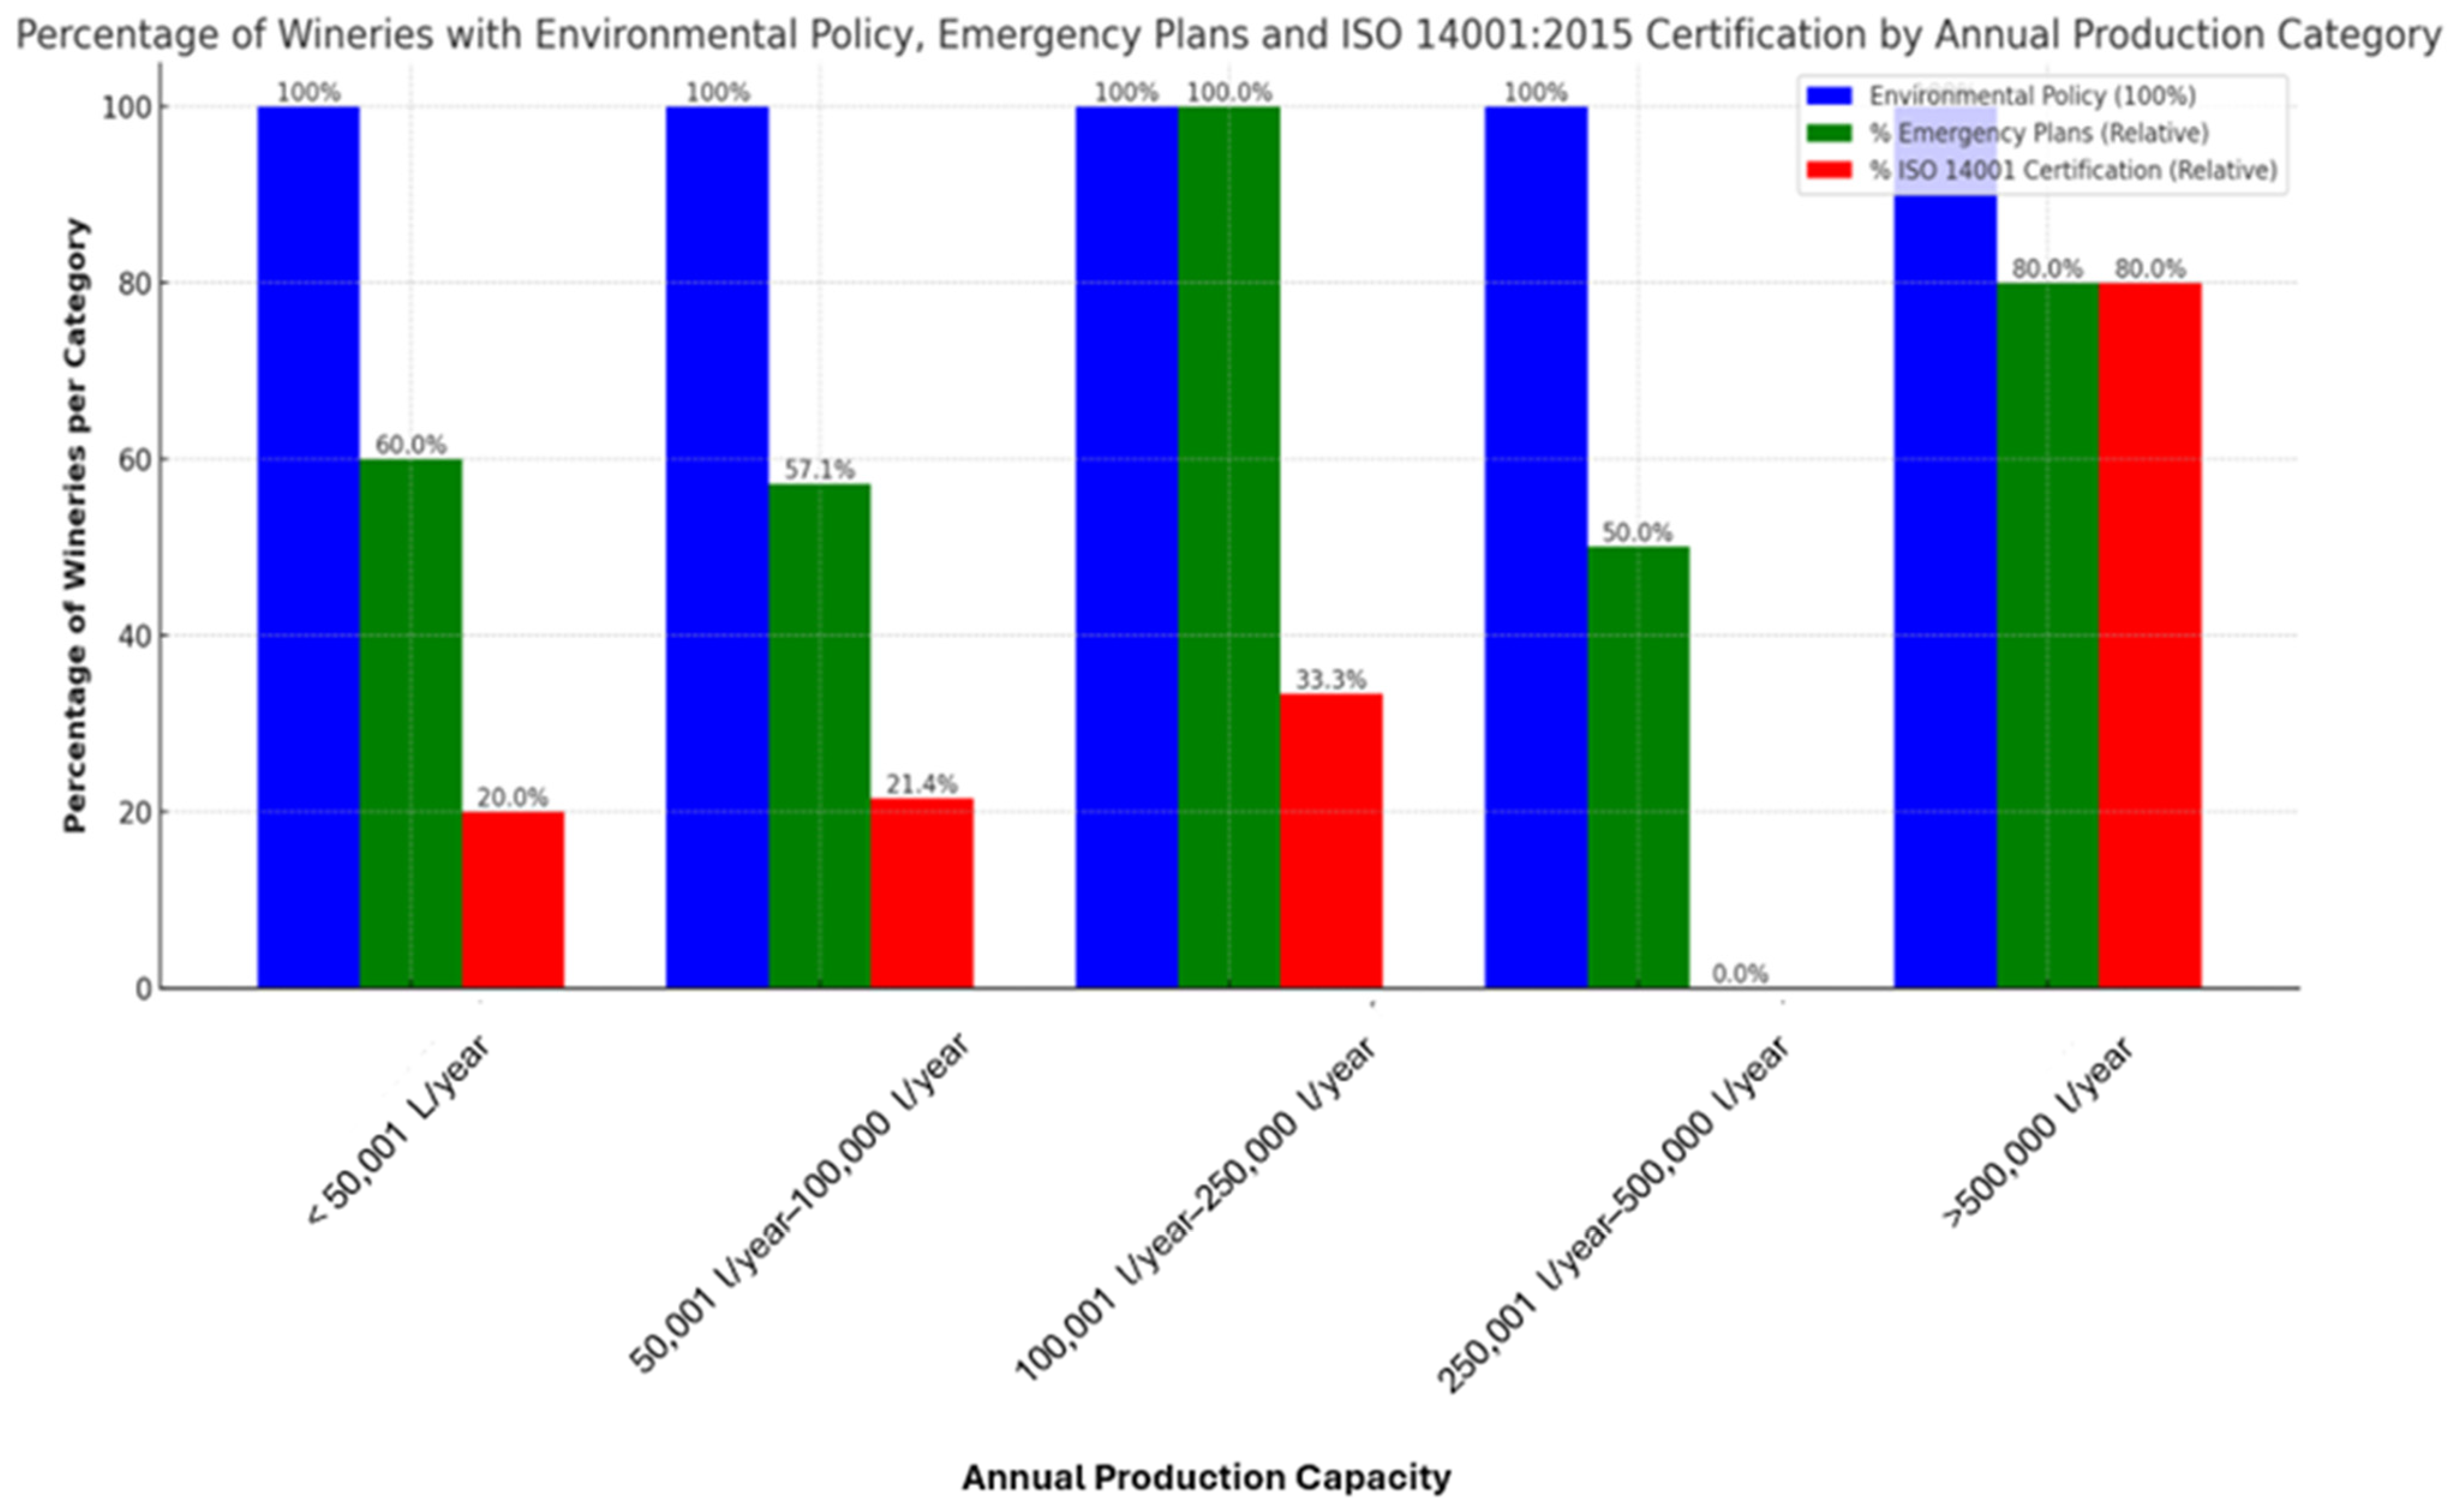
3.5. EMS Performance Indicators
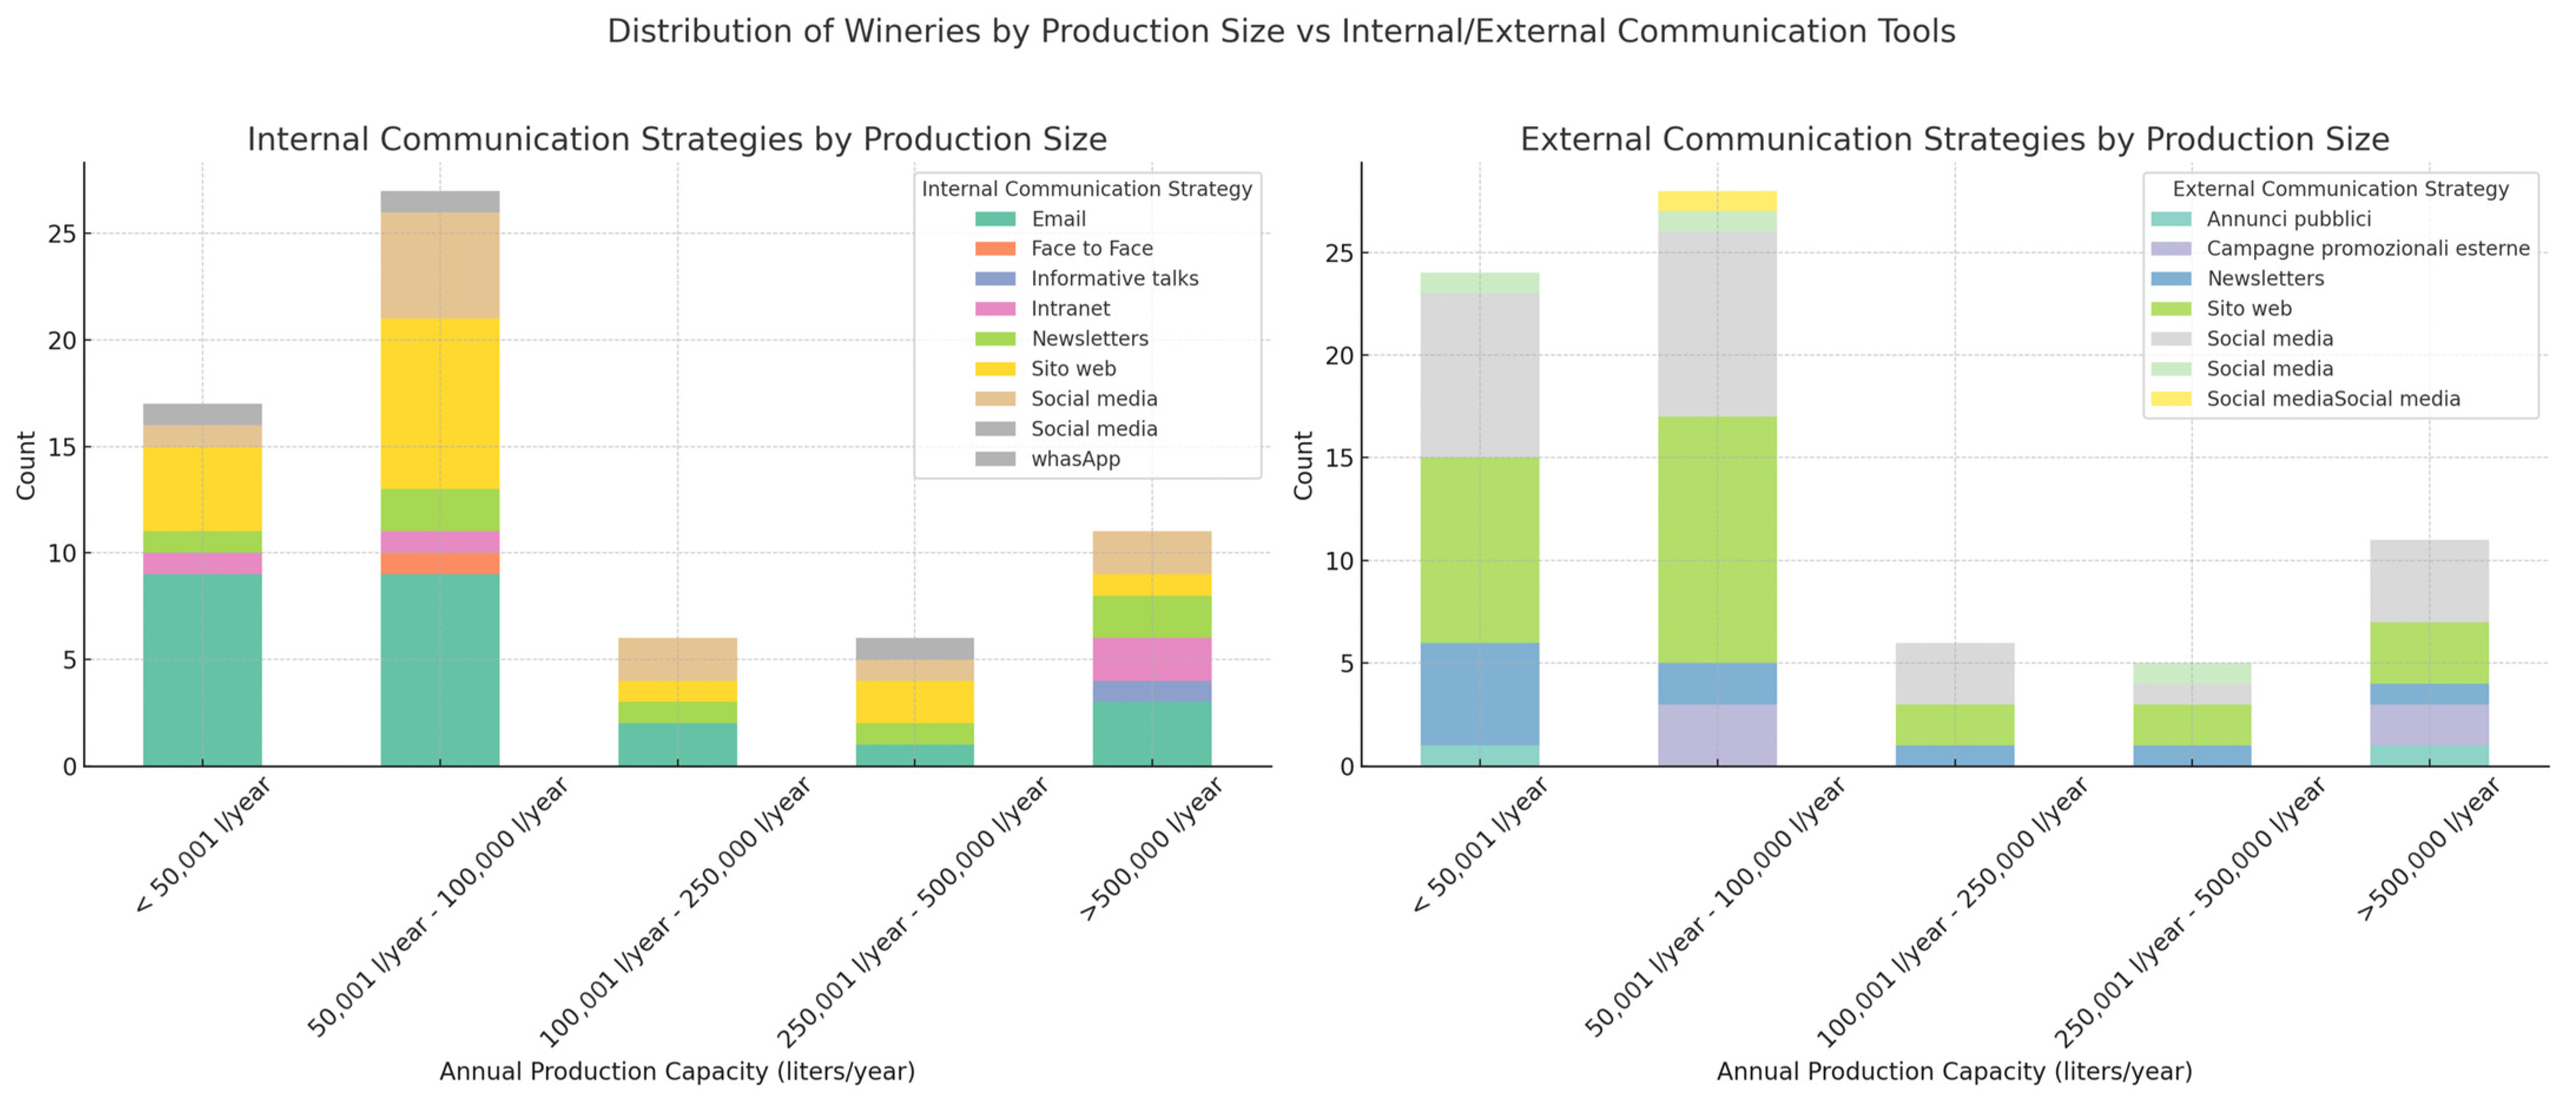
- is the aggregated communication variable for the winery;
- is the internal communication strategy variable of the winery; is each item of this multiple-choice question (yes = 0.167, no = 0);
- is the external communication strategy variable of the winery; is each item of this multiple-choice question (yes = 0.167, no = 0);
- is the stakeholder’s variable to whom the winery communicates its environmental information of the winery; is each item of this multiple-choice question (yes = 0.167, no = 0);
- is the environmental policy communication variable of the winery; is each item of this multiple-choice question (yes = 0.125, no = 0);
- is the number of variables that have been aggregated, and its value is 4.
- is the aggregated commitment variable for each winery;
- is the winery environmental policy variable of the winery (yes = 1, no = 0);
- is the environmental director variable of the winery (yes = 1, no = 0);
- measures the senior management environmental system evaluation frequency (it could take one of next four values, 1 if (at least every six months), 0.75 (more than once a year), 0.50 (annually), and 0 (never reviewed));
- is the environmental evaluation procedure variable of the winery (yes = 1, no = 0);
- is the number of variables that have been aggregated, and its value is 4.
- is the aggregated EM planning variable for each winery;
- measures the wineries’ primary environmental objectives of the winery; is each item of this multiple-choice question (yes = 0.112, no = 0);
- is the EM specific areas variable of the winery; is each item of this multiple-choice question (yes = 0.112, no = 0);
- is the environmental commitments variable of the winery; is each item of this multiple-choice question (yes = 0.125, no = 0);
- is the life cycle aspects variable; is each item of this multiple-choice question (yes = 0.334, no = 0);
- is the winery energy consumption environmental aspect variable of the winery (yes = 1, no = 0);
- is the waste management performance environmental aspect variable of the winery (yes = 1, no = 0);
- is the fermentation emissions performance environmental aspect variable of the winery (yes = 1, no = 0);
- is the legal environmental requirements variable of the winery (yes = 1, no = 0);
- is the risk assessment variable (it could take one of the following three values: 1 if (quantitative method), 0.50 (qualitative method), and 0 (none));
- is the opportunity assessment variable (it could take one of the following three values: 1 if (quantitative method), 0.50 (qualitative method), and 0 (none));
- is the number of variables that have been aggregated, and its value is 10.
- is the aggregated other environmental requirements variable for each winery;
- is the EEP availability variable of the winery (yes = 1, no = 0);
- measures the kind of emergencies in the EEP of the winery; is each item of this multiple-choice question (yes = 0.167, no = 0);
- measures the EEP evaluation frequency (it could take one of the following four values: 1 if (at least every six months), 0.75 (more than once a year), 0.50 (annually), and 0 (never reviewed));
- is the EMS document availability variable of the winery (yes = 1, no = 0);
- measures how the EMS information is recorded in the winery; is each item of this multiple-choice question (yes = 0.2, no = 0);
- measures the document control frequency (it could take one of the following four values: 1 if (at least every six months), 0.75 (annually), 0.50 (more than once a year), and 0 (never reviewed));
- is the legal environmental requirements variable of the winery (yes = 1, no = 0);
- is the number of variables that have been aggregated, and its value is 7.
- is the aggregated environmental worker training variable for each winery;
- is the EMS workers training availability variable of the winery (yes = 1, no = 0);
- measures the workers training frequency (it could take one of the following four values: 1 if (at least every six months), 0.75 (annually), 0.50 (more than once a year), and 0 (never));
- measures the number of employees who participate in environmental training courses annually (it could take one of the following four values: 1 (more than 75%), 0.75 (between 50% and 75%), 0.50 (between 25% and 50%), and 0.25 (less than 25%));
- is the number of variables that have been aggregated, and its value is 3.
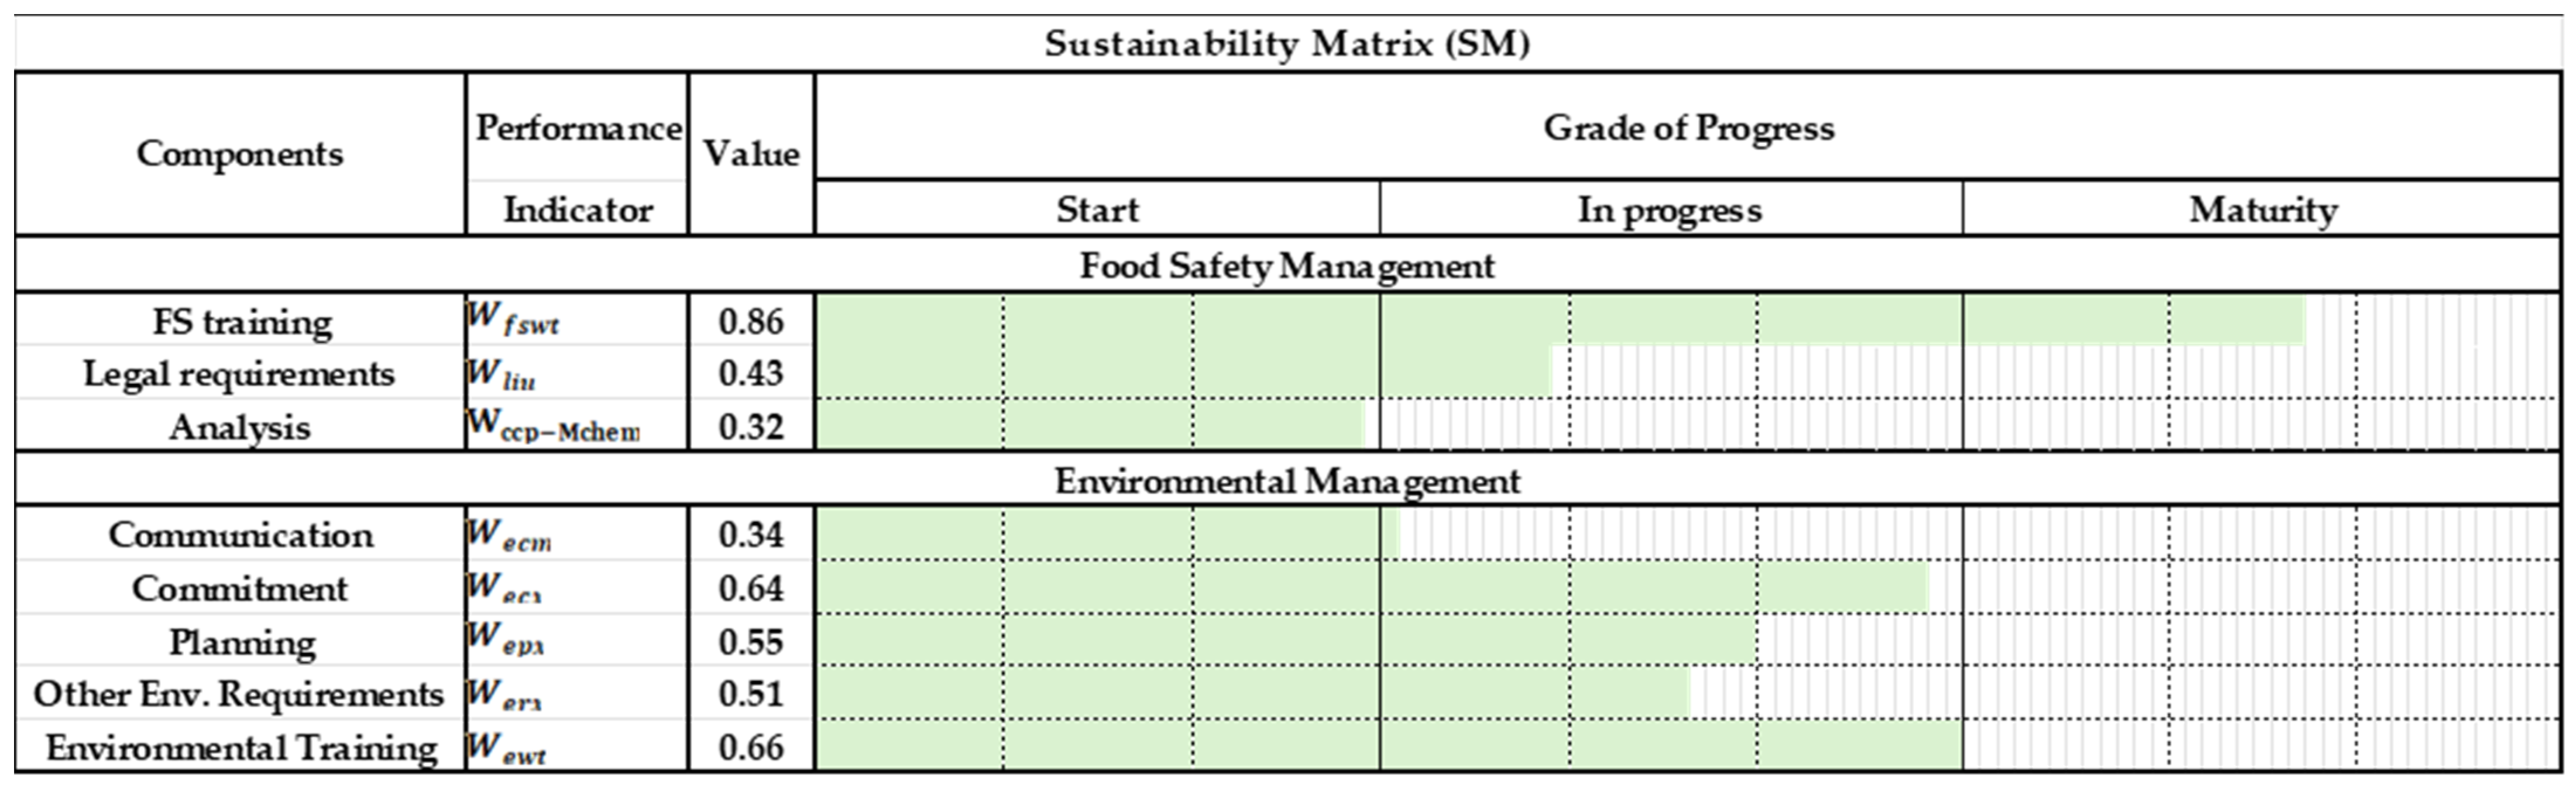
3.6. Matrix of Sustainability Based on FS and EM
4. Discussion
5. Conclusions
Author Contributions
Funding
Institutional Review Board Statement
Informed Consent Statement
Data Availability Statement
Conflicts of Interest
Appendix A
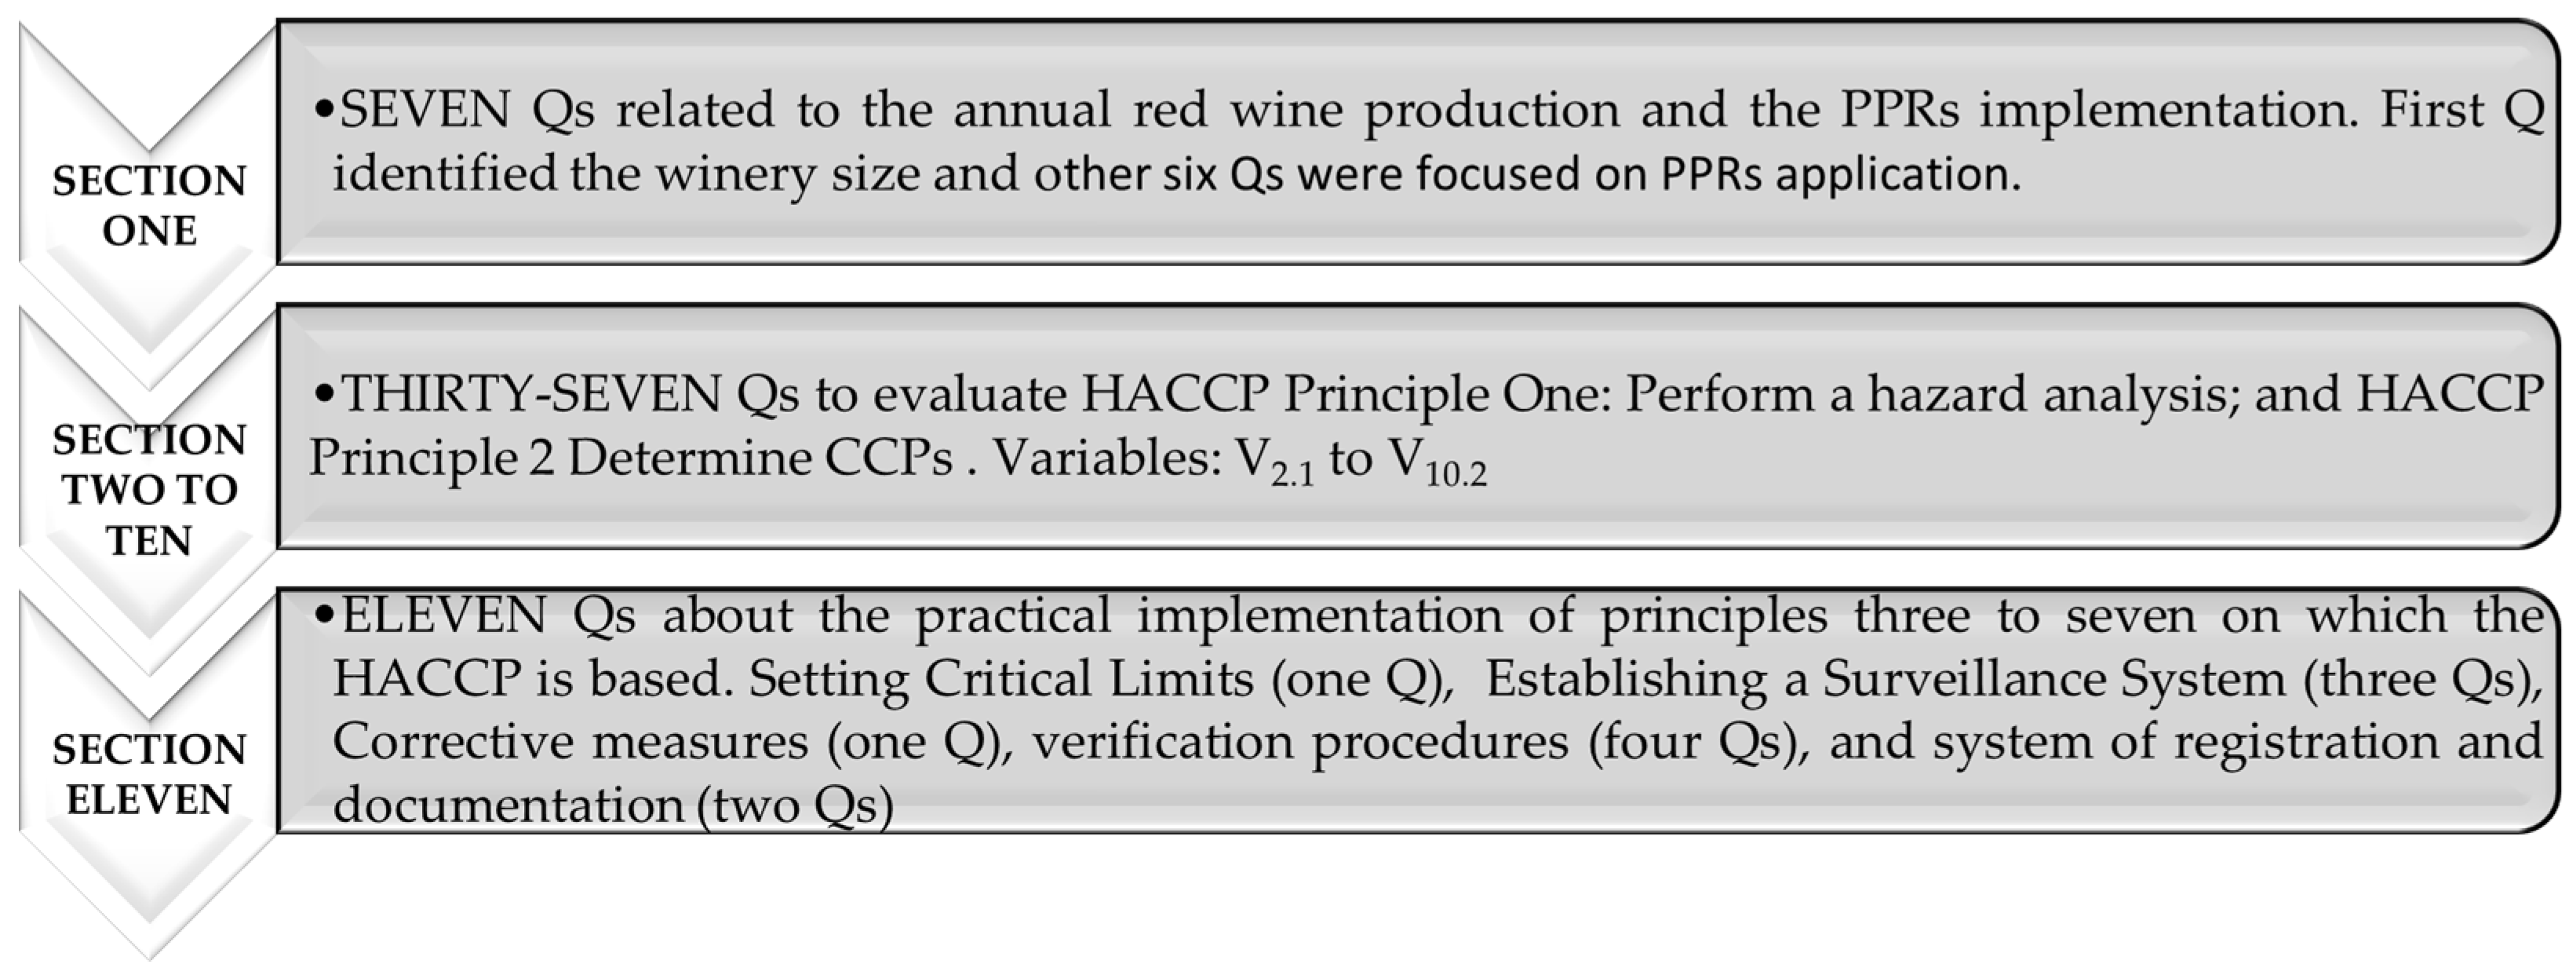
Appendix A.1. Survey for the Analysis of Implementation and Deployment of HACCP System in Wineries Producing Red Wine
- * Indicates That the Question is Mandatory
- Email Address *
- G.0
- What is your annual production level of young red wine? Mark only one oval.
- ○
- up to 25,000 L/year
- ○
- between 25,001 and 100,000 L/year
- ○
- between 100,001 and 250,000 L/year
- ○
- between 250,001 and 500,000 L/year
- ○
- more than 500,001 L/year
- G.1
- Have you implemented a prerequisite program according to the food hygiene legislation?* Mark only one oval.
- ○
- Yes
- ○
- No
- G.2
- Indicate which type of prerequisite plans you have implemented. * Select all that apply.
- □
- G.2.1 Maintenance of premises, facilities, and equipment
- □
- G.2.2 Good Manufacturing Practices Plan
- □
- G.2.3 Cleaning and disinfection plan
- □
- G.2.4 Waste control plan
- □
- G.2.5 Pest control plan
- □
- G.2.6 Control plan for water supply
- □
- G.2.7 Traceability control plan
- □
- G.2.8 Supplier control plan
- □
- G.2.9 Allergen control plan
- □
- G.2.10 Worker training plan
- G.3
- Do winery operators have training related to good viticulture practices (BPV)?* Mark only one oval.
- ○
- No operator has BPV training.
- ○
- More than half of the operators have BPV training.
- ○
- All operators have BPV training.
- G.4
- Do winery operators know the prerequisite plans implemented in the winery? Mark only one oval.
- ○
- No operator is aware of the implemented prerequisite plans.
- ○
- More than half of the operators are aware of the implemented prerequisite plans.
- ○
- All operators are aware of the implemented prerequisite plans.
- G.5
- Does the winery have a specific annual budget for the execution of the prerequisite plans?* Mark only one oval.
- ○
- The winery does not have an annual budget for this matter.
- ○
- The winery carries out plans as needed but does not have a detailed annual budget.
- ○
- The winery has a detailed annual budget, which it executes in a planned manner.
- G.6
- Has the winery implemented a Hazard Analysis and Critical Control Point (HACCP) System?* Mark only one oval.
- ○
- Yes
- ○
- No
- Harvest and Transportation
- 2.1
- Are periodic inspections carried out in the vineyards prior to the harvest?* Mark only one oval.
- 2.2
- Are inspections conducted in the vineyards during the harvest to control hygiene measures during this stage?* Mark only one oval.
- 2.3
- Is the time taken to transport grapes destined for the production of red wine measured from the vineyard to the winery?* Mark only one oval.
- Receipt of the harvest at the winery
- 3.1
- Is the measurement of residues of fungicides and/or pesticides in grapes destined for the production of red wine carried out when received at the winery?* Mark only one oval.
- 3.2
- Is the presence of mycotoxins from rotting grapes checked?* Mark only one oval.
- 3.3
- Is the presence of contamination by metals (cadmium, lead, arsenic) in grapes checked?* Mark only one oval.
- 3.4
- Is the presence of contamination by vegetable residues, dust, and/or metallic elements in grapes checked?* Mark only one oval.
- Pre-fermentation Treatments
- 4.1
- Is the cleanliness of tanks controlled to eliminate residues of microorganisms?* Mark only one oval.
- 4.2
- Is the absence of cleaning and disinfection products from performing these tasks in the tanks controlled?* Mark only one oval.
- Grape Crushing and Paste Pumping
- 5.1
- Is it controlled that the maintenance time of the must in the crusher is less than two hours?* Mark only one oval.
- 5.2
- Is the cleanliness of the crushing equipment controlled with a frequency not exceeding two days?* Mark only one oval.
- 5.3
- Is the absence of cleaning and disinfection products from performing these tasks in the tanks, press, and/or pumping equipment controlled?* Mark only one oval.
- Sulfiting and Fermentation
- 6.1
- Is the safety and purity of additives controlled?* Mark only one oval.
- 6.2
- Is the absence of microorganisms in the equipment and tanks controlled?* Mark only one oval.
- Alcoholic Fermentation, Maceration, Racking, Pressing of Grape Pomace, Malolactic Fermentation, and Finishing Fermentation
- 7.1
- Is the concentration of ethyl carbamate in the fermented must controlled?* Mark only one oval.
- 7.2
- Is the concentration of sulfur dioxide in the fermented must controlled?* Mark only one oval.
- 7.3
- Is the purity and safety of yeasts controlled?* Mark only one oval.
- 7.4
- Is the temperature controlled during fermentation?* Mark only one oval.
- 7.5
- Is the pH of red wine controlled during malolactic fermentation?* Mark only one oval.
- 7.6
- Is hygiene controlled during racking and pressing operations?* Mark only one oval.
- 7.7
- Is the cleanliness of pressing equipment controlled with a frequency not exceeding two days?* Mark only one oval.
- Racking, Clarification, and Filtration
- 8.1
- Are the cleaning procedures for tanks and racking equipment controlled?* Mark only one oval.
- 8.2
- Are the maintenance and cleaning procedures of the facilities controlled during the racking stage?* Mark only one oval.
- 8.3
- Is the purity and safety of the agents used as clarifiers in red wine controlled?* Mark only one oval.
- 8.4
- Is the absence of residues from the agents used as clarifiers in red wine controlled?* Mark only one oval.
- 8.5
- Is the absence of foreign elements from the filters in red wine controlled?* Mark only one oval.
- 8.6
- Are hygiene operations controlled during clarification and filtration operations?* Mark only one oval.
- 8.7
- Is the absence of cleaning and disinfection products from racking, clarification, and filtration tasks in tanks and/or equipment controlled?* Mark only one oval.
- Cold Stabilization
- 9.1
- Are the limit concentrations of metals (traces of As, Cu, Pb) in red wine controlled?* Mark only one oval.
- 9.2
- Is it controlled that the additives used are those allowed by current food legislation?* Mark only one oval.
- Bottling and Labeling
- 10.1
- Are bottle cleaning procedures controlled?* Mark only one oval.
- 10.2
- Are maintenance and cleaning procedures for the red wine bottling line controlled?* Mark only one oval.
- 10.3
- Is there microbiological control of the red wine bottling line and bottles?* Mark only one oval.
- 10.4
- Is it controlled that the cork or a similar plug used for closing the bottles has undergone microbiological control?* Mark only one oval.
- 10.5
- Is it controlled that the label used is correctly coded?* Mark only one oval.
- 10.6
- Is it controlled that the label used correctly describes mandatory information about allergens?* Mark only one oval.
- 10.7
- Is it controlled that the label used correctly describes information about the Denomination of Origin Vinos de Madrid?* Mark only one oval.
- Application of HACCP Principles
- 11.1
- Have the winery’s managers set objective and critical limit levels for each of the identified critical points?* Mark only one oval.
- ○
- No, for none of them.
- ○
- Yes, but only for those where applicable mandatory regulations exist.
- ○
- Yes, for each and every one of them following applicable mandatory regulations and/or professional technical recommendations.
- 11.2
- Has the winery established a monitoring system for critical control points?* Mark only one oval.
- ○
- Yes
- ○
- No
- 11.3
- If a CCP monitoring system is established, what checking methods are used?* (Check all that apply from the following list). Select all that apply.
- ○
- Visual observation
- ○
- Sensory evaluation (smell, taste, aroma, texture)
- ○
- Physical determinations (temperature, relative humidity, pH)
- ○
- Chemical analysis
- ○
- Microbiological analysis
- 11.4.
- Does the winery have a written monitoring program detailing the surveillance activities of hazards and their CCPs at each stage of red wine production? ?* Mark only one oval.
- ○
- Yes
- ○
- No
- 11.5
- Does the winery have a written procedure for establishing corrective measures to be applied in case of deviations in each critical control point (CCP)?* Mark only one oval.
- ○
- Yes
- ○
- No
- 11.6
- Does the winery have a procedure for verifying the effectiveness of the CCP control system? ?* Mark only one oval.
- ○
- Yes
- ○
- No
- 11.7
- If yes, does this verification procedure detail the frequency of control for each critical control point (CCP) and the person in charge of performing it? ?* Mark only one oval.
- ○
- Yes
- ○
- No
- 11.8
- If yes, please indicate which people are involved in verifying the effectiveness of the CCP system. Check all options that apply.
- ○
- Winery owner
- ○
- Winery manager
- ○
- Quality manager or similar
- ○
- Winemaker
- ○
- Operators
- ○
- Others
- 11.9
- Does the winery conduct an annual internal audit of the Critical Control Points (CCPs) and control analysis?* Mark only one oval.
- ○
- No
- ○
- Yes, but with a frequency greater than one year.
- ○
- Yes, annually.
- 11.10
- Does the winery have a record and documentation system for the HACCP system? ?* Mark only one oval.
- ○
- There are no records or written documents.
- ○
- Yes, there are records and written documents, but they are not complete or not updated periodically.
- ○
- Yes, there is a complete and periodically updated record and documentation system.
- 11.11
- If yes, what documents does the winery’s HACCP system contain? (Check all options that apply)
- ○
- List of HACCP system team members
- ○
- Description of stages and production process of red wine
- ○
- Analysis of hazards and determination of preventive measures
- ○
- Identification of Critical Control Points (CCP)
- ○
- Surveillance program containing surveillance activities
- ○
- Corrective measures procedure
- ○
- Results of verifications and internal audits
- ○
- Document and record management procedure
- ○
- Records generated by the HACCP system.
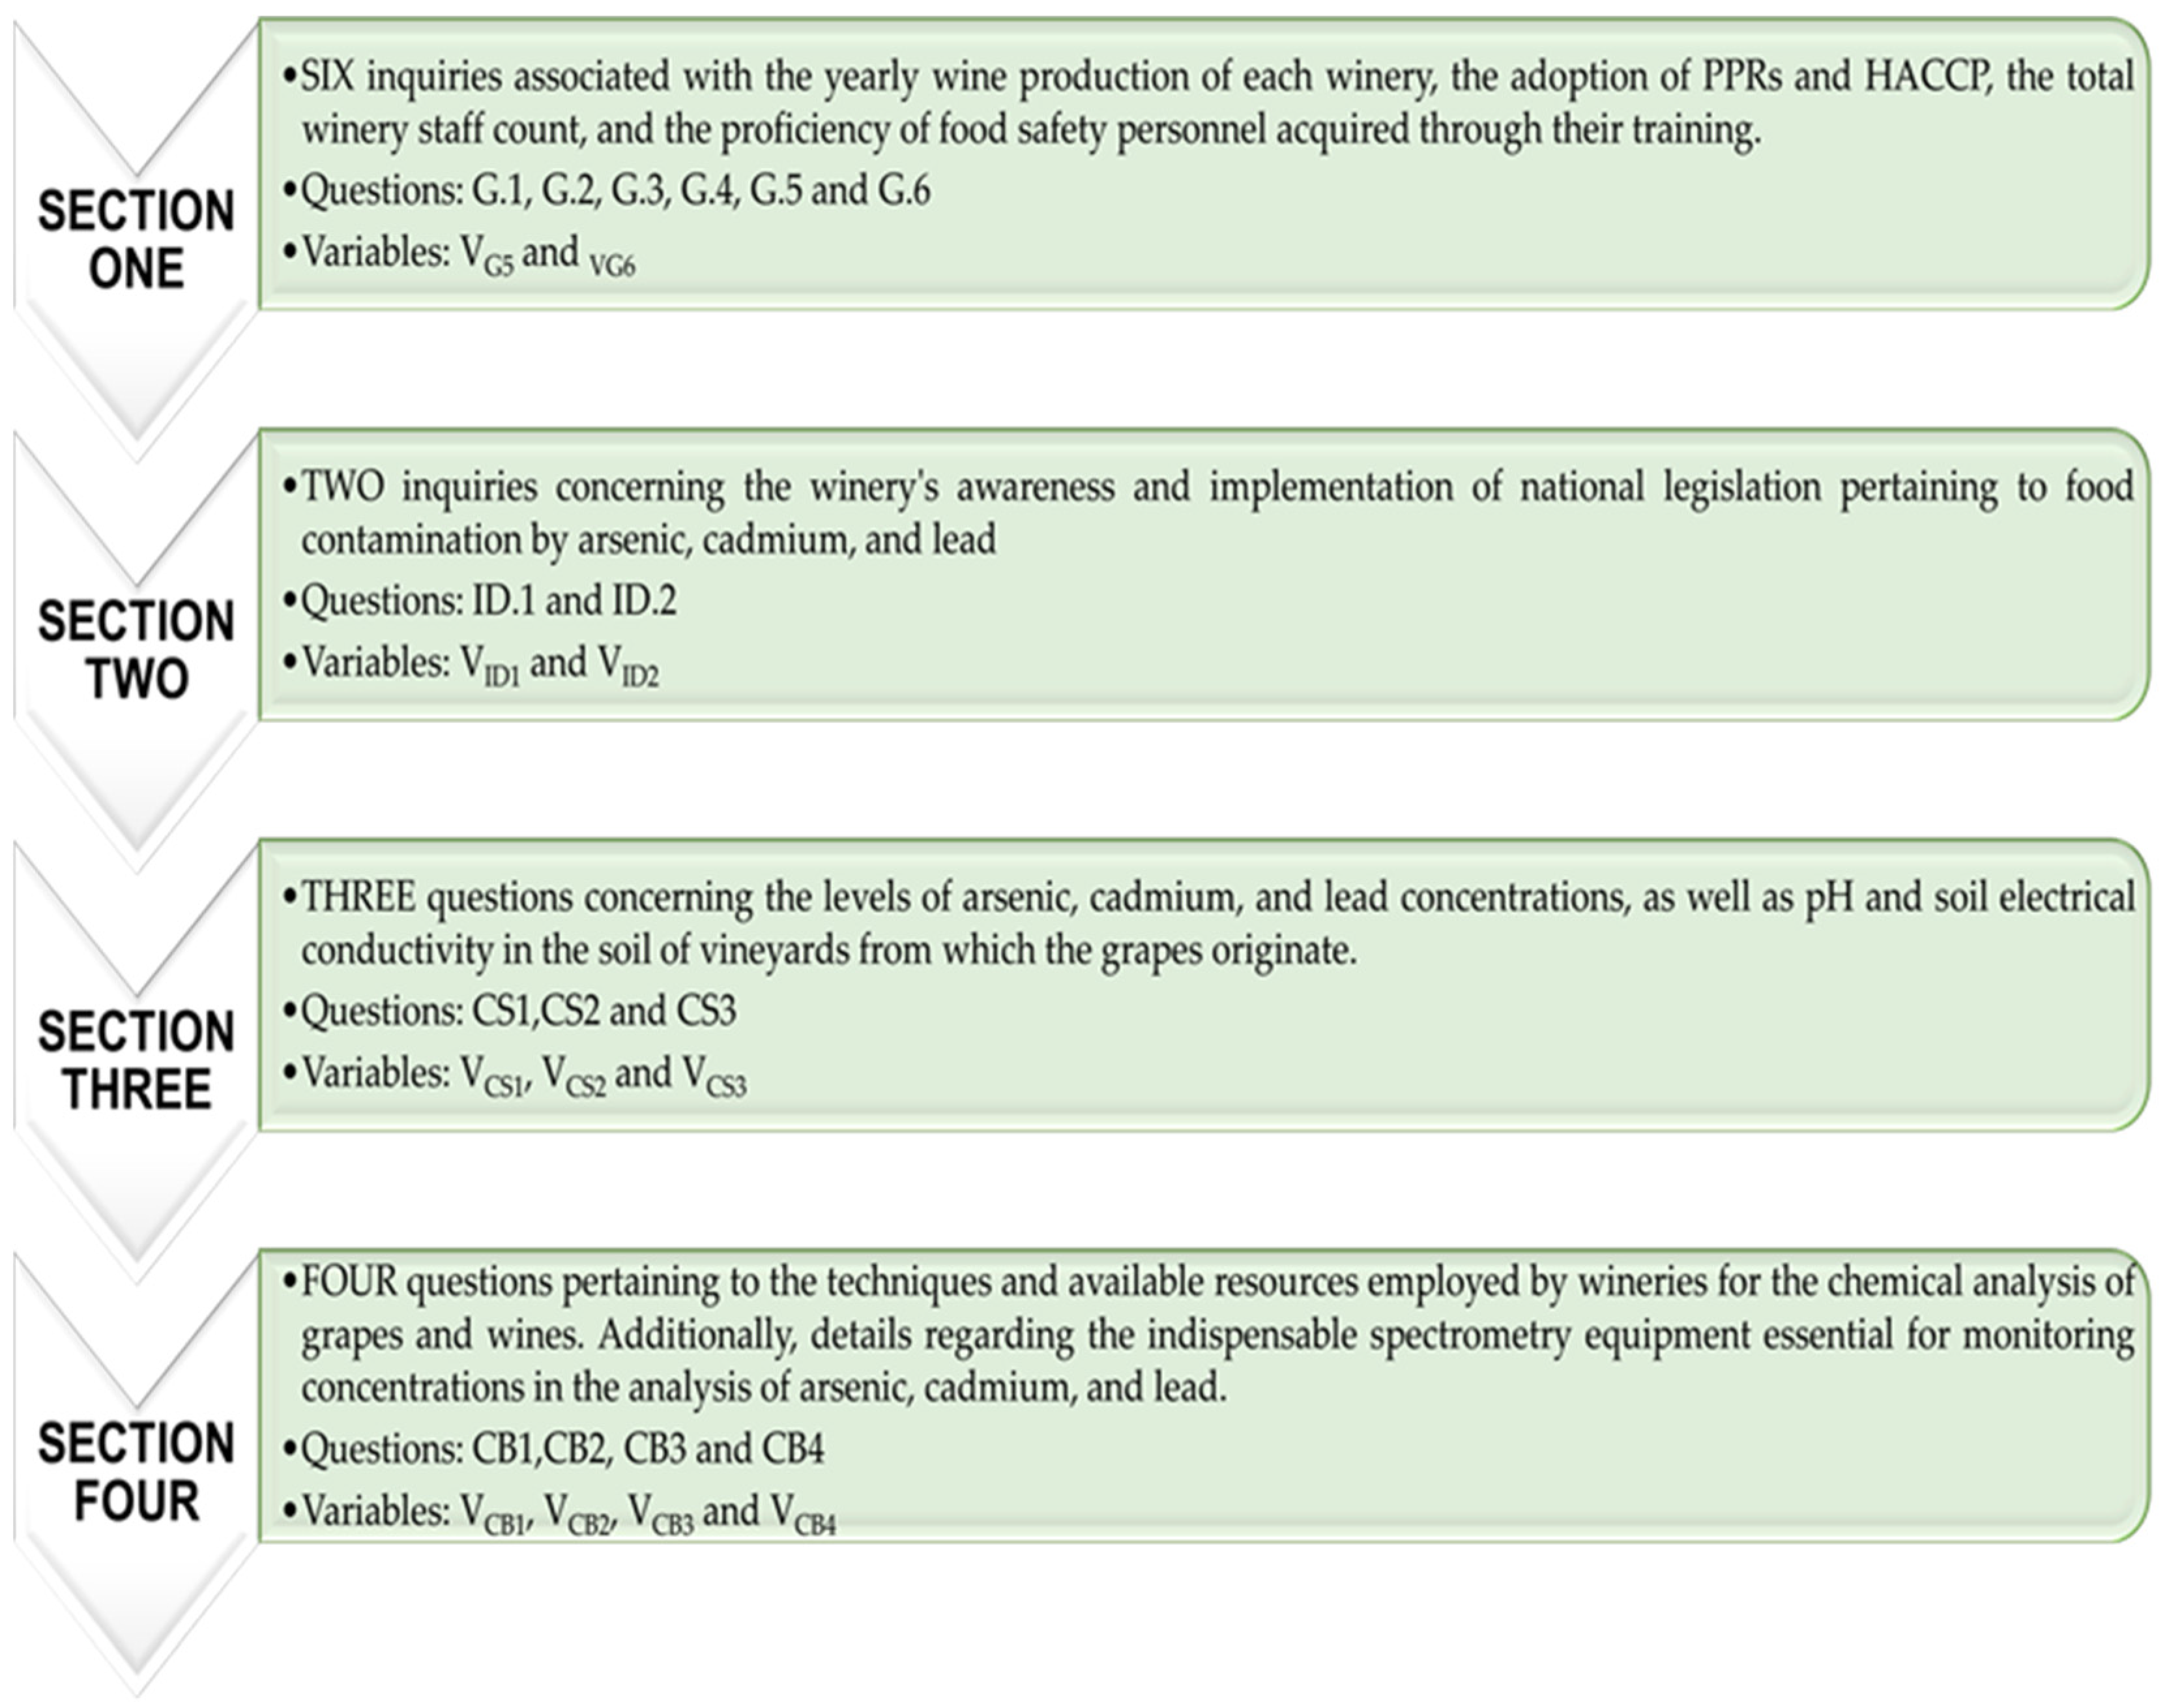
Appendix A.2. Analysis of Wineries Performance about Critical Control Points Related to Risk Control Contamination by Arsenic, Cadmium, and Lead in Grapes/Wines during Winemaking
- * Obligatory
- General data of the winery
- G.1
- What is your annual level of red wine production?* (Mark only one)
- G.2
- Do you have a prerequisite program in place, according to the legislation on food hygiene?* (Mark only one)
- G.3
- Does the winery have a Hazard Analysis and Critical Control Point (HACCP) system in place?* (Mark only one)
- G.4
- How many people work in wine production operations in the winery?*
- G.5
- Do winery workers have training about good manufacturing practices (GMPs)?* (Mark only one)
- G.6
- Do winery workers have control training and monitoring of critical points (CCPs)?* (Mark only one)
- Information available on arsenic, cadmium, and leads in the raw material (Critical Control Point)
- ID 1.
- The winery has identified the legislation relating to food contamination by the following: (check all those you consider).
- ID 2.
- The winery uses the updated information available from the Spanish Agency for Food Safety and Nutrition (AESAN) on heavy metals food risk. * (Mark only one)
- CS 1.
- Does the winery have information related to the physical-chemical analysis of where do the grapes used in winemaking come from?* (Mark only one)
- CS 2.
- Does the winery have information on the fertilizers used in the fertilization of the soil from which the grapes used in winemaking come from?* (Mark only one)
- Information available on the concentration of arsenic, cadmium, and lead in the soil
- CS 3.
- The available information on the analysis of vineyard arable soil holds data on the following:
- Select all that apply.
- Control of the raw material (analysis procedures in the winery)
- CB 1.
- Does the winery have its own laboratory to perform a chemical analysis of grapes and wines?* (Mark only one)
- CB 2.
- If you do NOT have your own laboratory, do you use an external laboratory to perform a chemical analysis of grapes and wines?* (Mark only one)
- CB 3.
- Does the warehouse have the technology and personnel to perform a metal analysis using atomic absorption spectrometry?* (Mark only one)
- CB 4.
- If you do NOT have your own laboratory, do you use an external laboratory to perform a metal analysis using atomic absorption spectrometry on grapes and wines?*
- Professional profile that performs the survey
- You can tell us about your job inside the winery. (Mark only one)
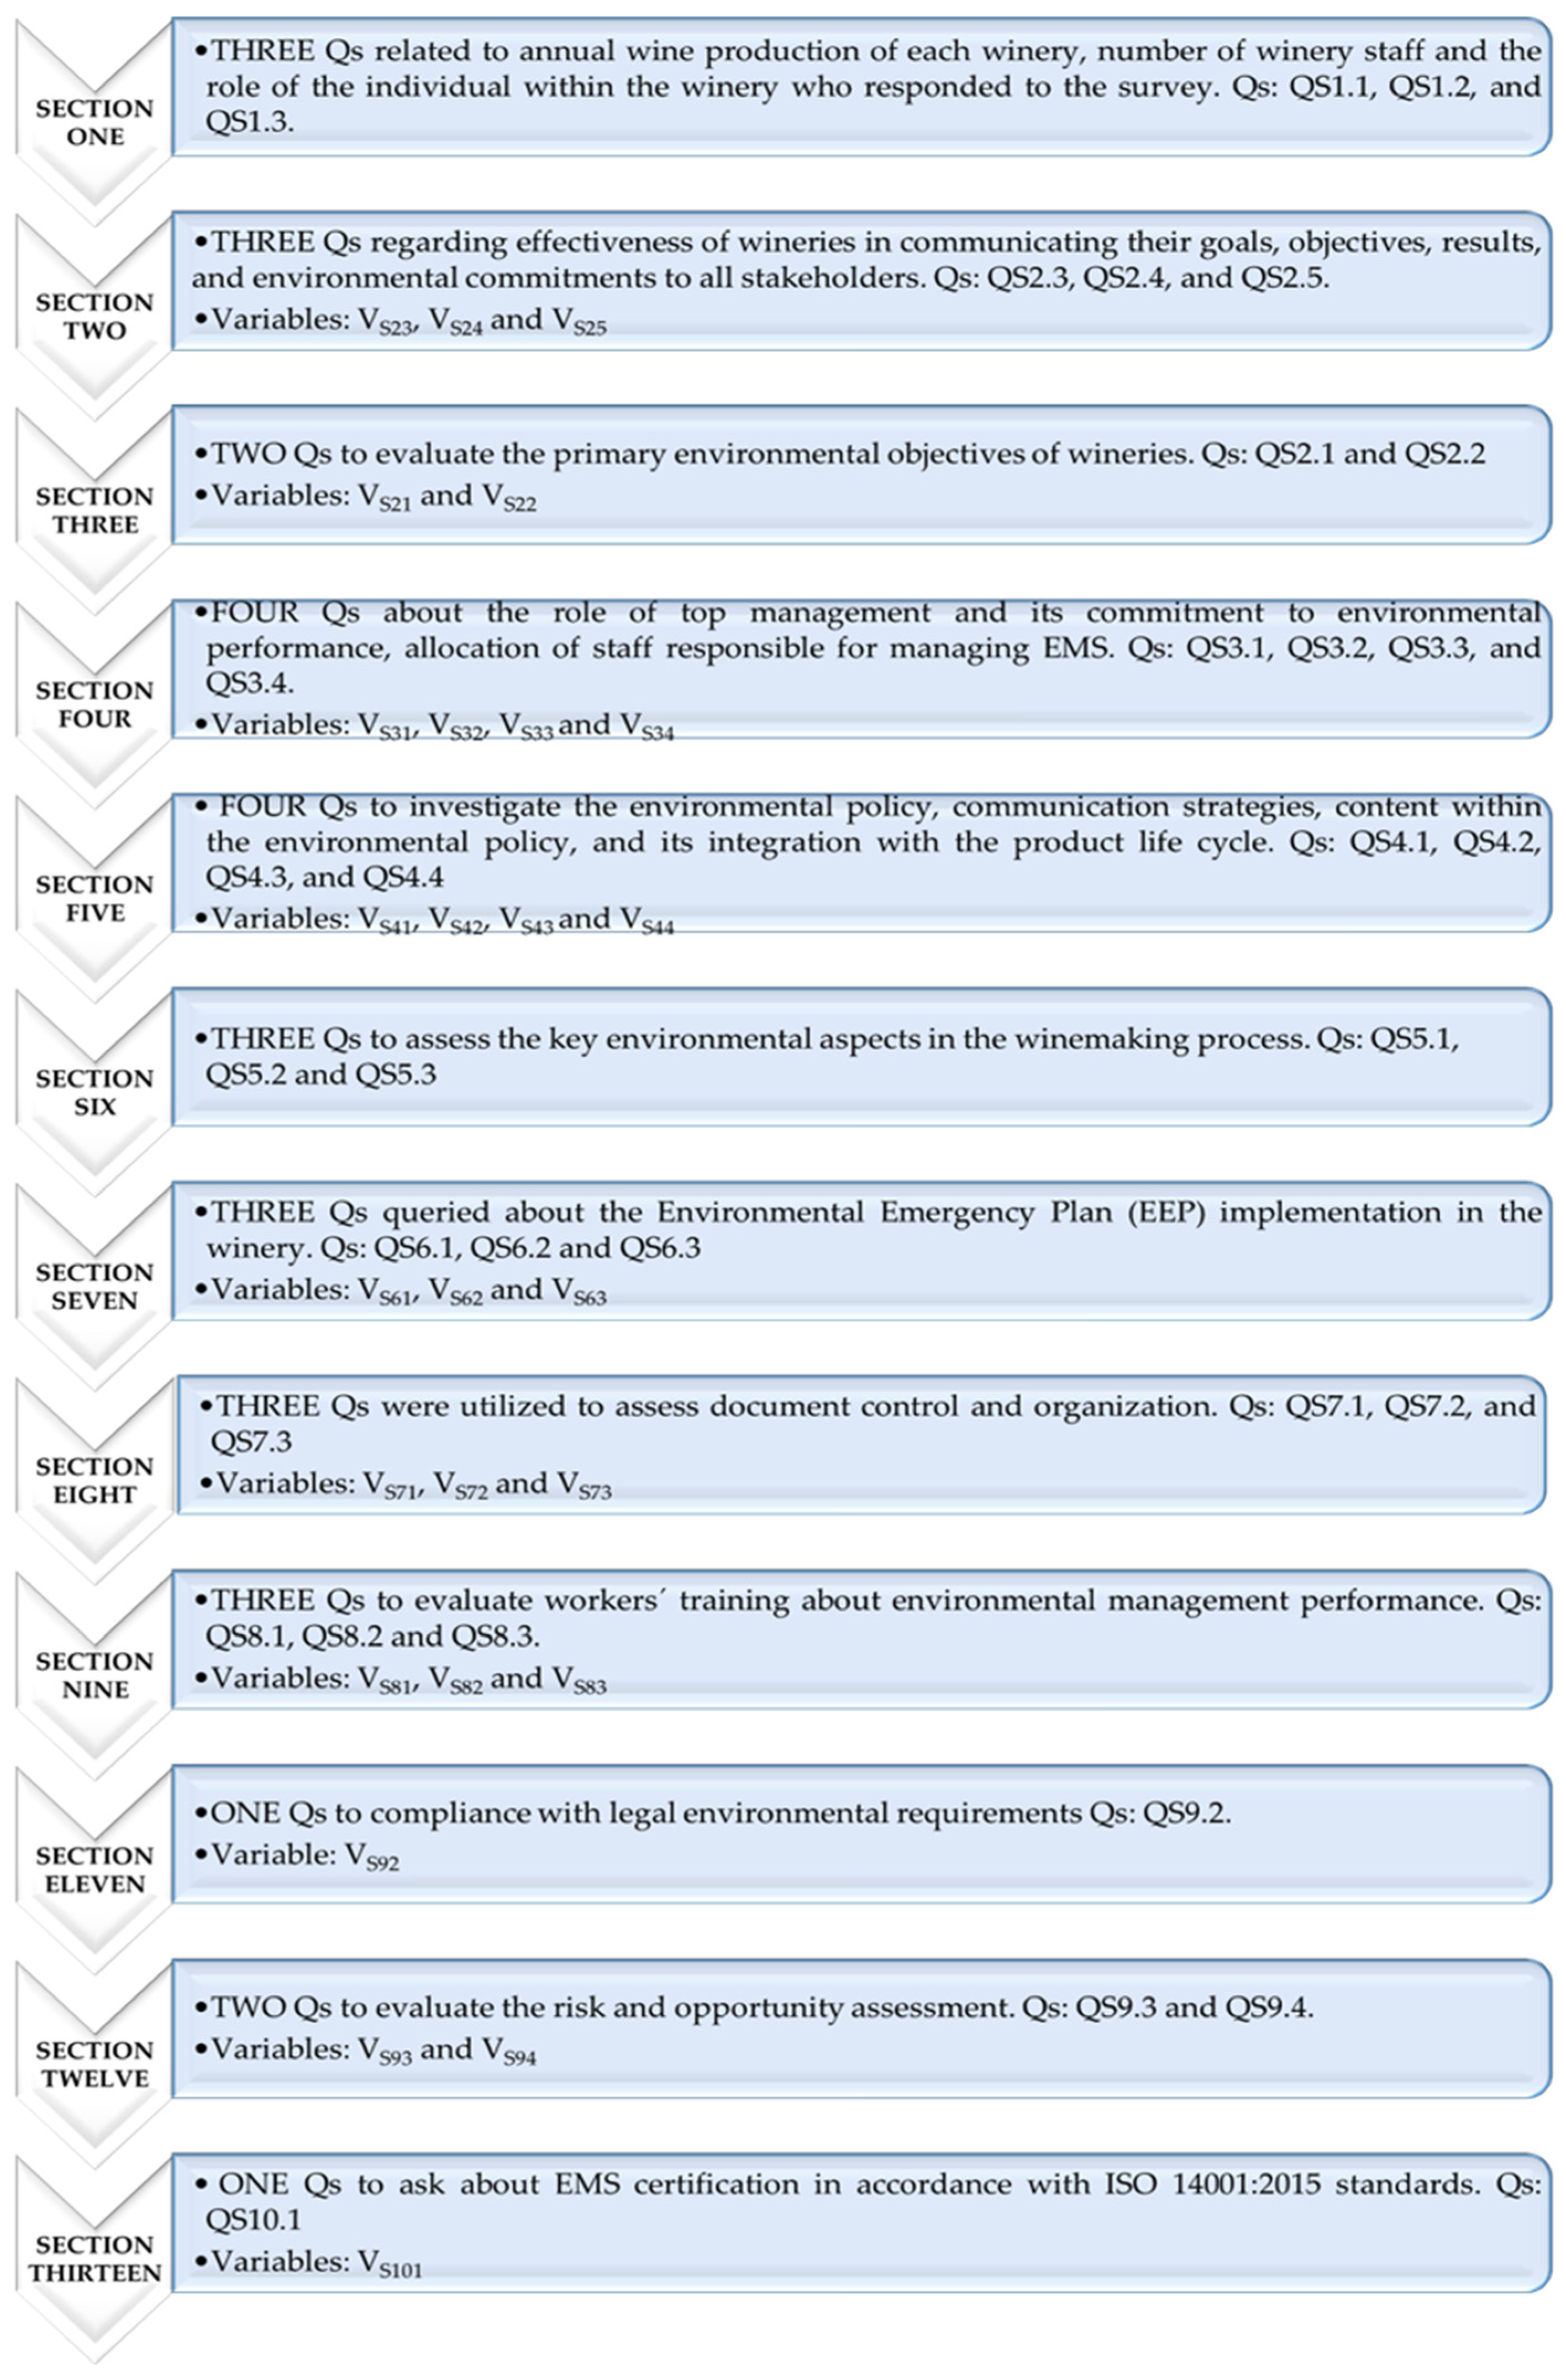
Appendix A.3. Environmental Management System Questionnaire (Italy)
- * Obligatory
- Company name *
- E-mail address *
- S1.1 Annual production capacity. Mark only one oval.
- ○
- Less than 50,001 L/year.
- ○
- 50,001 L/year—100,000 L/year.
- ○
- 100,001 L/year—250,000 L/year.
- ○
- 250,001 L/year—1,000,000 L/year.
- ○
- More than 1,000,000 L/year.
- S1.2 Number of employees. Mark only one oval.
- ○
- <10.
- ○
- 10 to 49.
- ○
- 50 to 249.
- ○
- 250.
- S1.3 Job position in the company. Mark only one oval.
- ○
- General Manager.
- ○
- Owner Manager.
- ○
- Ecological Manager.
- ○
- Administration Officer.
- ○
- Vineyard Manager Executive Director.
- ○
- Other
- S2.1 What are the company’s main environmental objectives? Select all that apply.
- ○
- Electricity consumption reduction.
- ○
- Water consumption reduction.
- ○
- Land use reduction.
- ○
- Greenhouse gas emissions reduction.
- ○
- Other gas emissions reduction.
- ○
- Waste production reduction.
- ○
- Use of raw materials reduction.
- ○
- Substances released into the soil reduction.
- ○
- Other
- S2.2 Does the company have any of the following areas/departments? Select all that apply.
- ○
- Environmental Management.
- ○
- Leadership.
- ○
- Planning of environmental objectives.
- ○
- Environmental risk and opportunities.
- ○
- Resources and environmental support.
- ○
- Communication.
- ○
- Operation and environmental control.
- ○
- Emergency response.
- ○
- Monitoring, analysis, and evaluation of EMS performance.
- S2.3 What is the company’s internal communication strategy? Select all that apply.
- ○
- Website.
- ○
- Email.
- ○
- Social media (Facebook, Instagram, etc.).
- ○
- Newsletters.
- ○
- Internal staff site.
- ○
- Other
- S2.4 What is the company’s external communication strategy? Select all that apply.
- ○
- Website.
- ○
- Social media (Facebook, Instagram, etc.).
- ○
- Newsletters.
- ○
- Advertisement.
- ○
- Marketing campaigns.
- ○
- Other
- S2.5 Does the company disclose environmental information to any stakeholders? Select all that apply.
- ○
- Clients.
- ○
- Ecology associations.
- ○
- Public administrations.
- ○
- Suppliers.
- ○
- Shops.
- ○
- Other
- S3.1 Has the organization clearly identified the Environmental Director in the company? Mark only one oval.
- ○
- Yes.
- ○
- No.
- S3.2 How often does the senior management review the organization’s environmental management system? Mark only one oval.
- ○
- At least every six months.
- ○
- Annually.
- ○
- Over a year.
- ○
- Never.
- S3.3 Has the company established processes to achieve annual environmental results? Mark only one oval.
- ○
- Yes.
- ○
- No.
- S4.1 Has the company established an environmental policy? Mark only one oval.
- ○
- Yes.
- ○
- No.
- S4.2 How does the company communicate and/or promote its environmental policy? Select all that apply.
- ○
- Website. Newsletter. Social Media. Advertisement.
- ○
- E-mail promotional. Marketing campaigns.
- ○
- Courses
- ○
- None of these
- ○
- Other
- S4.3 Does the company’s environmental policy include any of these commitments? Select all that apply.
- ○
- Reduce the use of water.
- ○
- Reduce the use of fossil combustible.
- ○
- Control of electricity use.
- ○
- Reduce fertilizer and pesticide use.
- ○
- Reduce gas emissions.
- ○
- Increasing land use efficiency.
- ○
- Improvement in packaging (glass bottles).
- ○
- Improvement in wine distribution.
- S4.4 What aspects of the life cycle are included in environmental policy? Select all that apply.
- ○
- Environmental impacts of the supply chain.
- ○
- Environmental impacts of product use.
- ○
- Environmental impacts of waste generation.
- S3.4 Who is responsible for environmental management? Mark only one oval.
- ○
- Owner
- ○
- General Manager
- ○
- Environmental Manager
- ○
- Administrative Manager
- ○
- Vineyard Director
- ○
- Executive Director
- ○
- Other:
- S5.1 Considering that wineries have a high energy consumption, what actions or measures does the company take to reduce the environmental impact?
- S5.2 Wineries generate a lot of solid waste, which, once disposed of, has a high environmental impact. How is this high amount of waste managed?
- S5.3 Wineries generate gases that are usually impregnated with fruit or machinery. What processes should be in place to reduce these emissions and therefore generate less impact?
- S6.1 Has the company prepared plans to prevent or mitigate negative environmental impacts resulting from emergency situations? Mark only one oval.
- ○
- Yes.
- ○
- No.
- 6.2 If so, which environmental emergency is the company prepared for? (Select one or more). Select all that apply.
- ○
- Fire
- ○
- Water uncontrolled discharge with a cleaning product or organic matter residues.
- ○
- Water drains with chemical contaminants.
- ○
- Landfilling of waste and/or abandoned waste.
- ○
- Leakage of dangerous substances.
- ○
- Other
- S6.3 Does the company periodically review planned response actions for emergency situations? Mark only one oval.
- ○
- At least every six months.
- ○
- Annually.
- ○
- Over a year.
- ○
- Never.
- S7.1 Does the organization have documented information to demonstrate that it monitors, measures, and evaluates its environmental performance? Mark only one oval.
- ○
- Yes.
- ○
- No.
- S7.2 How does the organization record information to demonstrate that it evaluates the effectiveness of its environmental management system? Select all that apply.
- ○
- Data records.
- ○
- Reports.
- ○
- Technical Instructions.
- ○
- Procedures.
- ○
- None of these.
- ○
- Other.
- S7.3 How often does the company create and update documented information consistent with its environmental management system? Mark only one oval.
- ○
- At least every six months.
- ○
- Annually.
- ○
- Over a year.
- ○
- Never.
- S9.2 Does the company have legal requirements from government bodies or other relevant authorities in relation to environmental impacts? Mark only one oval.
- ○
- Yes.
- ○
- No.
- S8.1 Is training offered to staff on environmental management systems? Mark only one oval.
- ○
- Yes.
- ○
- No.
- S8.2 If so, how often do staff take these environmental trainings? Mark only one oval.
- ○
- At least every six months.
- ○
- Annually.
- ○
- Over a year.
- ○
- Never.
- S8.3 How many workers have already undergone environmental management training? Mark only one oval.
- ○
- Less than 25%
- ○
- Between 25–50%
- ○
- Between 50–75%
- ○
- More than 75%
- S9.3 What method does the organization use to carry out risk analysis? Mark only one oval.
- ○
- Quantitative method
- ○
- Qualitative method
- ○
- None
- S9.4 What method does the organization use to perform the opportunity analysis? Mark only one oval.
- ○
- Quantitative method
- ○
- Qualitative method
- ○
- None
- S10.1 Has the company certified its EMS with ISO 14001:2015? Mark only one oval.
- ○
- Yes.
- ○
- No.
References
- Wesseler, J. The EU’s farm-to-fork strategy: An assessment from the perspective of agricultural economics. Appl. Econ. Perspect. Policy 2022, 44, 1826–1843. [Google Scholar] [CrossRef]
- Schebesta, H.; Candel, J.J. Game-changing potential of the EU’s Farm to Fork Strategy. Nat. Food 2020, 1, 586–588. [Google Scholar] [CrossRef]
- European Commission. The European Green Deal; Communication from the Commission to the European Parliament, The Council, The European Economic and Social Committe and The Committe of the Regions. COM(2019) 640 final; European Union: Brussels, Belgium, 2019. [Google Scholar]
- Schebesta, H.; Bernaz, N.; Macchi, C. The European Union Farm to Fork Strategy. Eur. Food Feed Law Rev. 2020, 15, 420–427. [Google Scholar]
- Billen, G.; Aguilera, E.; Einarsson, R.; Garnier, J.; Gingrich, S.; Grizzetti, B.; Lassaletta, L.; Le Noë, J.; Sanz-Cobena, A. Beyond the Farm to Fork Strategy: Methodology for designing a European agro-ecological future. Sci. Total Environ. 2024, 908, 168160. [Google Scholar] [CrossRef]
- Sadiku, M.N.; Musa, S.M.; Ashaolu, T.J. Food industry: An introduction. Int. J. Trend Sci. Res. Dev. 2019, 3, 128–130. [Google Scholar] [CrossRef]
- Yadav, V.S.; Singh, A.R.; Gunasekaran, A.; Raut, R.D.; Narkhede, B.E. A systematic literature review of the agro-food supply chain: Challenges, network design, and performance measurement perspectives. Sustain. Prod. Consum. 2022, 29, 685–704. [Google Scholar] [CrossRef]
- Hammoudi, A.; Hoffmann, R.; Surry, Y. Food safety standards and agri-food supply chains: An introductory overview. Eur. Rev. Agric. Econ. 2009, 36, 469–478. [Google Scholar] [CrossRef]
- Lezoche, M.; Hernandez, J.E.; Díaz, M.d.M.E.A.; Panetto, H.; Kacprzyk, J. Agri-food 4.0: A survey of the supply chains and technologies for the future agriculture. Comput. Ind. 2020, 117, 103187. [Google Scholar] [CrossRef]
- Luo, J.; Ji, C.; Qiu, C.; Jia, F. Agri-Food Supply Chain Management: Bibliometric and Content Analyses. Sustainability 2018, 10, 1573. [Google Scholar] [CrossRef]
- Amin-Chaudhry, A.; Young, S.; Afshari, L. Sustainability motivations and challenges in the Australian agribusiness. J. Clean Prod. 2022, 361, 132229. [Google Scholar] [CrossRef]
- Gold, S.; Kunz, N.; Reiner, G. Sustainable Global Agrifood Supply Chains: Exploring the Barriers. J. Ind. Ecol. 2017, 21, 249–260. [Google Scholar] [CrossRef]
- Ross, R.B.; Pandey, V.; Ross, K.L. Sustainability and strategy in US agri-food firms: An assessment of current practices. Int. Food Agribus. Manag. Rev. 2015, 18, 17–47. [Google Scholar]
- Barth, H.; Ulvenblad, P.; Ulvenblad, P. Towards a conceptual framework of sustainable business model innovation in the agri-food sector: A systematic literature review. Sustainability 2017, 9, 1620. [Google Scholar] [CrossRef]
- Gómez Orea, D. Evaluación de Impacto Ambiental: Un Instrumento Preventivo para la Gestión Ambiental; Mundi-Prensa Libros: Madrid, Spain, 2002; pp. 85–86. [Google Scholar]
- Collier, Z.A.; Wang, D.; Vogel, J.T.; Tatham, E.K.; Linkov, I. Sustainable roofing technology under multiple constraints: A decision-analytical approach. Environ. Syst. Decis. 2013, 33, 261–271. [Google Scholar] [CrossRef]
- Aramyan, L.H.; Oude Lansink, A.G.J.M.; van der Vorst, J.G.A.J.; van Kooten, O. Performance measurement in agrifood supply chains a case study. Supply Chain Manag. Int. J. 2007, 12, 304–315. [Google Scholar] [CrossRef]
- Joshi, S.; Singh, R.K.; Sharma, M. Sustainable agri-food supply chain practices: Few empirical evidences from a developing economy. Glob. Bus. Rev. 2020, 24, 451–474. [Google Scholar] [CrossRef]
- Varsei, M.; Soosay, C.; Fahimnia, B.; Sarkis, J. Framing sustainability performance of supply chains with multidimensional indicators. Supply Chain Manag. 2014, 19, 242–257. [Google Scholar] [CrossRef]
- Schäufele, I.; Hamm, U. Consumers’ perceptions, preferences and willingness-to-pay for wine with sustainability characteristics: A review. J. Clean. Prod. 2017, 147, 379–394. [Google Scholar] [CrossRef]
- Rondoni, A.; Grasso, S. Consumers behaviour towards carbon footprint labels on food: A review of the literature and discussion of industry implications. J. Clean. Prod. 2021, 301, 127031. [Google Scholar] [CrossRef]
- Liu, G. Food Safety Regulation in Perspective of Environmental Sustainability. In Proceedings of the ICITEE ‘18: Proceedings of the International Conference on Information Technology and Electrical Engineering, Xiamen, China, 7–8 December 2018; pp. 1–4. [Google Scholar] [CrossRef]
- Kumar, A.; Mangla, S.K.; Kumar, P. An integrated literature review on sustainable food supply chains: Exploring research themes and future directions. Sci. Total Environ. 2022, 821, 153411. [Google Scholar] [CrossRef]
- Giuliani, E.; Morrison, A.; Rabellotti, R. Innovation and Technological Catch-Up: The Changing Geography of Wine Production; Edward Elgar Publishing: Cheltenham, UK, 2011. [Google Scholar]
- Santini, C.; Cavicchi, A.; Casini, L. Sustainability in the wine industry: Key questions and research trendsa. Agric. Food Econ. 2013, 1, 1–14. [Google Scholar] [CrossRef]
- Szolnoki, G. A cross-national comparison of sustainability in the wine industry. J. Clean. Prod. 2013, 53, 243–251. [Google Scholar] [CrossRef]
- Pickering, G.J. Consumer engagement with sustainable wine: An application of the Transtheoretical Model. Food Res. Int. 2023, 174, 113555. [Google Scholar] [CrossRef] [PubMed]
- Gabzdylova, B.; Raffensperger, J.F.; Castka, P. Sustainability in the New Zealand wine industry: Drivers, stakeholders and practices. J. Clean. Prod. 2009, 17, 992–998. [Google Scholar] [CrossRef]
- Marshall, R.S.; Cordano, M.; Silverman, M. Exploring individual and institutional drivers of proactive environmentalism in the US wine industry. Bus. Strategy Environ. 2005, 14, 92–109. [Google Scholar] [CrossRef]
- De Steur, H.; Temmerman, H.; Gellynck, X.; Canavari, M. Drivers, adoption, and evaluation of sustainability practices in Italian wine SMEs. Bus. Strategy Environ. 2020, 29, 744–762. [Google Scholar] [CrossRef]
- Meissenheimer, J.; Karaan, A.; Vink, N. Sources of Transaction Costs in the South African Wine Supply Chain: Implications for Enhancing Chain Competitiveness; Department of Agricultural Economics, University of Stellenbosch: Stellenbosch, South Africa, 2001. [Google Scholar]
- Goncharuk, A.G. Wine value chains: Challenges and prospects. J. Appl. Manag. Investig. 2017, 6, 11–27. [Google Scholar]
- Luzzani, G.; Lamastra, L.; Valentino, F.; Capri, E. Development and implementation of a qualitative framework for the sustainable management of wine companies. Sci. Total Environ. 2021, 759, 143462. [Google Scholar] [CrossRef]
- OIV Resolution CST 1/2008—OIV Guidelines for Sustainable Vitiviniculture: Production, Processing and Packaging of Products. Available online: https://www.oiv.int/public/medias/2089/cst-1-2008-en.pdf (accessed on 16 May 2023).
- Kamboj, S.; Gupta, N.; Bandral, J.D.; Gandotra, G.; Anjum, N. Food safety and hygiene: A review. Int. J. Chem. Stud. 2020, 8, 358–368. [Google Scholar] [CrossRef]
- World Health Organization. Guidance on Regulatory Assessment of HACCP: Report of a Joint FAO/WHO Consultation on the Role of Government Agencies in Assessing HACCP, Geneva, 2–6 June 1998; WHO: Geneva, Switzerland, 1998. [Google Scholar]
- European Commission. Commission Notice (2022/C 355/01) on the Implementation of Food Safety Management Systems Covering Good Hygiene Practices and Procedures Based on the HACCP Principles, Including the Facilitation/Flexibility of the Implementation in Certain Food Businesses; 2022/C 355/01; European Commission: Brussels, Belgium, 2022; pp. 1–58.
- European Commission. Commission Notice on the implementation of food safety management systems covering prerequisite programs (PRPs) and procedures based on the HACCP principles, including the facilitation/flexibility of the implementation in certain food businesses. OJC 2016, 278, 1–32. [Google Scholar]
- Mortimore, S.; Wallace, C. HACCP: A Practical Approach; Springer Science & Business Media: Berlin/Heidelberg, Germany, 2013. [Google Scholar]
- Chen, H.; Liou, B.; Hsu, K.; Chen, C.; Chuang, P. Implementation of food safety management systems that meets ISO 22000:2018 and HACCP: A case study of capsule biotechnology products of chaga mushroom. J. Food Sci. 2021, 86, 40–54. [Google Scholar] [CrossRef]
- Codex Alimentarius Commission Recommended international code of practice general principles of food hygiene. CAC/RCP Rev. 2003, 4, 1–1969.
- Christaki, T.; Tzia, C. Quality and safety assurance in winemaking. Food Control 2002, 13, 503–517. [Google Scholar] [CrossRef]
- ISO 14001:2015; Environmental Management Systems: Requirements with Guidance for Use. International Organization for Standardization: Geneva, Switzerland, 2015.
- Gilinsky, A., Jr.; Newton, S.K.; Vega, R.F. Sustainability in the global wine industry: Concepts and cases. Agric. Agric. Sci. Procedia 2016, 8, 37–49. [Google Scholar] [CrossRef]
- Barla, P. ISO 14001 certification and environmental performance in Quebec’s pulp and paper industry. J. Environ. Econ. Manag. 2007, 53, 291–306. [Google Scholar] [CrossRef]
- Marimon, F.; Llach, J.; Bernardo, M. Comparative analysis of diffusion of the ISO 14001 standard by sector of activity. J. Clean. Prod. 2011, 19, 1734–1744. [Google Scholar] [CrossRef]
- de Neves, F.O.; Salgado, E.G.; Beijo, L.A. Analysis of the Environmental Management System based on ISO 14001 on the American continent. J. Environ. Manag. 2017, 199, 251–262. [Google Scholar] [CrossRef]
- International Organization for Standardization (ISO). Introduction to ISO 14001:2015. Available online: https://www.iso.org/files/live/sites/isoorg/files/store/en/PUB100371.pdf (accessed on 25 December 2023).
- Salim, H.K.; Padfield, R.; Hansen, S.B.; Mohamad, S.E.; Yuzir, A.; Syayuti, K.; Tham, M.H.; Papargyropoulou, E. Global trends in environmental management system and ISO14001 research. J. Clean. Prod. 2018, 170, 645–653. [Google Scholar] [CrossRef]
- Summers Raines, S. Implementing ISO 14001—An International Survey Assessing the Benefits of Certification. Corp. Environ. Strategy 2002, 9, 418–426. [Google Scholar] [CrossRef]
- ISO/TC 207/SC 1; Environmental Management Systems. International Organization for Standardization: Geneva, Switzerland, 1993.
- González-Benito, J.; González-Benito, O. An analysis of the relationship between environmental motivations and ISO14001 certification. Br. J. Manag. 2005, 16, 133–148. [Google Scholar] [CrossRef]
- Baiano, A. An overview on sustainability in the wine production chain. Beverages 2021, 7, 15. [Google Scholar] [CrossRef]
- Pomarici, E.; Amato, M.; Vecchio, R. Environmental Friendly Wines: A Consumer Segmentation Study. Agric. Agric. Sci. Procedia 2016, 8, 534–541. [Google Scholar] [CrossRef]
- DeGroot, M.H. Probability and Statistics, 2nd ed.; Addison-Wesley: Reading, MA, USA, 2002. [Google Scholar]
- Kwak, S.G.; Kim, J.H. Central limit theorem: The cornerstone of modern statistics. Korean J. Anesthesiol. 2017, 70, 144–156. [Google Scholar] [CrossRef] [PubMed]
- López-Santiago, J.; García, A.I.G.; Gómez-Villarino, M.T. An Evaluation of Food Safety Performance in Wineries. Foods 2022, 11, 1249. [Google Scholar] [CrossRef]
- Cloquell-Ballester, V.; Monterde-Díaz, R.; Cloquell-Ballester, V.; Torres-Sibille, A.d.C. Environmental education for small- and medium-sized enterprises: Methodology and e-learning experience in the Valencian region. J. Environ. Manag. 2008, 87, 507–520. [Google Scholar] [CrossRef]
- Campos, L.M.S.; de Melo Heizen, D.A.; Verdinelli, M.A.; Cauchick, M.P.A. Environmental performance indicators: A study on ISO 14001 certified companies. J. Clean. Prod. 2015, 99, 286–296. [Google Scholar] [CrossRef]
- López-Santiago, J.; García, A.I.G.; Villarino, A.G.; Som, A.M.; Gómez-Villarino, M.T. Assessing wineries’ performance in managing critical control points for arsenic, lead, and cadmium contamination risk in the wine-making industry: A survey-based analysis utilizing performance indicators as a results tool. Heliyon 2024, 10, e22962. [Google Scholar] [CrossRef]
- Epuran, G.; Bratucu, G.; Bărbulescu, O.U.; Neacşu, N.A.; Madar, A. Food Safety and Sustainability—An Exploratory Approach at the Level of the Romanian Wine Production Companies. Amfiteatru Econ. 2018, 20, 151–167. [Google Scholar] [CrossRef]
- Flores, S.S. What is sustainability in the wine world? A cross-country analysis of wine sustainability frameworks. J. Clean. Prod. 2018, 172, 2301–2312. [Google Scholar] [CrossRef]
- Magan, N. Mycotoxin contamination of food in Europe: Early detection and prevention strategies. Mycopathologia 2006, 162, 245–253. [Google Scholar] [CrossRef] [PubMed]
- Martinez-Rodriguez, A.J.; Carrascosa, A.V. HACCP to control microbial safety hazards during winemaking: Ochratoxin A. Food Control 2009, 20, 469–475. [Google Scholar] [CrossRef]
- Lee, J.C.; Neonaki, M.; Alexopoulos, A.; Varzakas, T. Case Studies of Small-Medium Food Enterprises around the World: Major Constraints and Benefits from the Implementation of Food Safety Management Systems. Foods 2023, 12, 3218. [Google Scholar] [CrossRef]
- Lee, J.C.; Daraba, A.; Voidarou, C.; Rozos, G.; El Enshasy, H.A.; Varzakas, T. Implementation of Food Safety Management Systems along with Other Management Tools (HAZOP, FMEA, Ishikawa, Pareto). The Case Study of Listeria monocytogenes and Correlation with Microbiological Criteria. Foods 2021, 10, 2169. [Google Scholar] [CrossRef]
- Zhang, L.; Ye, F.; Yang, L.; Zhou, G. Impact of political connections on corporate environmental performance: From a green development perspective. Sustainability 2019, 11, 1317. [Google Scholar] [CrossRef]
- Laca, A.; Gancedo, S.; Laca, A.; Díaz, M. Assessment of the environmental impacts associated with vineyards and winemaking. A case study in mountain areas. Environ. Sci. Pollut. Res. 2021, 28, 1204–1223. [Google Scholar] [CrossRef]
- Iannone, R.; Miranda, S.; Riemma, S.; De Marco, I. Improving environmental performances in wine production by a life cycle assessment analysis. J. Clean. Prod. 2016, 111, 172–180. [Google Scholar] [CrossRef]
- Fiore, M.; Giacomarra, M.; Crescimanno, M.; Galati, A. Quality certifications’ impact on wine industry assets performance. Bulg. J. Agric. Sci. 2020, 26, 257–267. [Google Scholar]
- Giacomarra, M.; Galati, A.; Crescimanno, M.; Tinervia, S. The integration of quality and safety concerns in the wine industry: The role of third-party voluntary certifications. J. Clean. Prod. 2016, 112, 267–274. [Google Scholar] [CrossRef]
- Carrillo-Higueras, F.; Prajogo, D.; Smith, L. Environmental commitment and its drivers in the Australian wine industry: A behavioural approach. Australas. J. Environ. Manag. 2018, 25, 439–458. [Google Scholar] [CrossRef]
- Gierling, F.; Blanke, M. Carbon reduction strategies for regionally produced and consumed wine: From farm to fork. J. Environ. Manag. 2021, 278, 111453. [Google Scholar] [CrossRef]
- Carroquino, J.; Garcia-Casarejos, N.; Gargallo, P. Classification of Spanish wineries according to their adoption of measures against climate change. J. Clean. Prod. 2020, 244, 118874. [Google Scholar] [CrossRef]


| Winemaking Steps | CCPs & oPRPs | Always (3) | Usually (2) | Hardly Ever (1) | Never (0) |
|---|---|---|---|---|---|
| 1. Harvest and grape transportation | oPRP 2.1 Vineyard inspection prior to the harvest to know the general condition of the grapes. | ||||
| oPRP 2.2 Vineyard inspection during the harvest to know the state of grapes. | |||||
| oPRP 2.3 Control of the time it takes to transport the harvest to the winery. | |||||
| 2. Harvest reception in the winery | oPRP 3.1 Control of residues of fungicides and/or pesticides existing in grapes intended for winemaking. | ||||
| oPRP 3.2 Mycotoxin control from grape rot. | |||||
| oPRP 3.3 Control of the presence of contamination by plant debris, dust, and/or metallic elements. | |||||
| CCP 3.1 Control of the presence of contamination by metals (Cd, Pb, As) in the grapes. | |||||
| 3. Pre-hatching treatments | oPRP 4.1 Control of the cleanliness of the tanks to eliminate residues of microorganisms. | ||||
| oPRP 4.2 Control of the absence of cleaning and disinfection products in the tanks. | |||||
| 4. Grapes crushing and must pumping | oPRP 5.1 Control of the cleanliness of crushing equipment. | ||||
| oPRP 5.2 Control of the absence of cleaning and disinfection products in tanks and press and pumping equipment. | |||||
| CCP 5.1 Control of the must maintenance time in the crusher. | |||||
| 5. Sulphited and vatted | oPRP 6.2 Control of the absence of microorganisms in the equipment and tanks. | ||||
| CCP 6.1 Control of the safety and purity of additives | |||||
| 6. Alcoholic fermentation, maceration, vat emptying, pressing, malolactic fermentation | oPRP 7.1 Control of the concentration of ethylocarbamate in fermented must. | ||||
| oPRP 7.2 Control of hygiene during racking and pressing operations. | |||||
| oPRP 7.3 Control of the cleanliness of pressing equipment. | |||||
| CCP 7.1 Control of sulphur dioxide in fermented must. | |||||
| CCP 7.2 Control of the purity and safety of yeasts. | |||||
| CCP 7.3 Temperature control during fermentation. | |||||
| CCP 7.4 Control of the pH of red wine during malolactic fermentation. | |||||
| 7.Racking, clarification, and filtration | oPRP 8.1 Control of the cleaning procedures of tanks and transfer equipment. | ||||
| oPRP 8.2 Control of maintenance and cleaning procedures of the facilities. | |||||
| oPRP 8.3 Control of hygiene operations during clarification and filtering operations. | |||||
| oPRP 8.4 Control of the absence of cleaning and disinfection products in tanks and equipment. | |||||
| oPRP 8.5 Control of the absence of foreign elements from the filters in red wine. | |||||
| CCP 8.1 Control of the purity and safety of agents used as clarifiers in red wine. | |||||
| CCP 8.2 Control of the absence of residues of agents used as clarifiers in red wine. | |||||
| 8. Cold stabilization | CCP 9.1 Control of limit concentrations of metals (traces of As, Cu, Pb) in red wine. | ||||
| CCP 9.2 Control that the additives used are those allowed by current food legislation. | |||||
| 9. Bottling and labelling | oPRP 10.1 Control of bottle cleaning procedures. | ||||
| oPRP 10.2 Control of maintenance and cleaning procedures of the red wine bottling line. | |||||
| oPRP 10.3 Control of the correct coding of the labels used on the bottles. | |||||
| oPRP 10.4 Control of correct allergen information on labels used on bottles. | |||||
| CCP 10.1 Microbiological control of the bottling line of red wine and bottles. | |||||
| CCP 10.2 Microbiological control of the cork stopper or similar used for closing the bottles. | |||||
| oPRP 2.1 Vineyards inspection prior to the harvest to know the general condition of the grapes. |
| Wine Annual Production L/Year | Percentage of Wineries Over Total | GMP Workers Training (%) | CCPs Workers Training (%) | Number of Workers | |||||
|---|---|---|---|---|---|---|---|---|---|
| All | More Than 50% | None | All | More Than 50% | None | Median | Arithmetic Mean | ||
| up to 25,000 | 18.8 | 66.7 | 33.3 | 0.0 | 66.7 | 33.3 | 0.0 | 2.5 | 2.3 |
| 25,001–100,000 | 34.4 | 60.0 | 20.0 | 20.0 | 40.0 | 50.0 | 10,0 | 4.0 | 3.3 |
| 100,001–250,000 | 21.9 | 28.6 | 57.1 | 14.3 | 28.6 | 57.1 | 14.3 | 5.0 | 5.1 |
| 250,001–500,000 | 9.4 | 100.0 | 0.0 | 0.0 | 66.7 | 33.3 | 0.0 | 7.0 | 7.3 |
| more than 500,000 | 15.6 | 100.0 | 0.0 | 0.0 | 100.0 | 0.0 | 0.0 | 10.0 | 21.7 |
| Total wineries Percentage | 100.0 | 65.6 | 21.9 | 12.5 | 53.1 | 37.5 | 9.4 | 4.0 | 6.1 |
| Wine Annual Production L/Year | Percentage of Wineries Over Total | HMFCR Legislation Identification (%) | HMFCR Legislation Updating through AESAN (%) | ||||
|---|---|---|---|---|---|---|---|
| As | Cd | Pb | None | Yes | No | ||
| up to 25,000 | 18.8 | 33.3 | 33.3 | 50.0 | 50.0 | 50.0 | 50.0 |
| 25,001–100,000 | 34.4 | 33.3 | 33.3 | 33.3 | 66.7 | 33.3 | 66.7 |
| 100,001–250,000 | 21.9 | 28.6 | 28.6 | 28.6 | 71.4 | 28.6 | 71.4 |
| 250,001–500,000 | 9.4 | 66.7 | 66.7 | 66.7 | 33.3 | 66.7 | 33.3 |
| more than 500,000 | 15.6 | 66.7 | 66.7 | 66.7 | 33.3 | 66.7 | 33.3 |
| Total wineries Percentage | 100.0 | 31.2 | 31.2 | 37.5 | 62.5 | 37.5 | 62.5 |
| Annual Production | Environmental Commitments | Environmental Emergency Scenarios |
|---|---|---|
| <50,001 L/year | Reduce water use, reduce fuel use, control electricity use, reduce the use of fertilizers and pesticides | Presence of waste and/or abandoned waste, substance spill, fire |
| 50,001 L/year–100,000 L/year | Reduce fuel use, reduce water use, control electricity use, Reduce the use of fertilizers and pesticides | Presence of waste and/or abandoned waste, substance spill, fire |
| 100,001 L/year–250,000 L/year | Reduce water use, reduce fuel use, control electricity use, reduce the use of fertilizers and pesticides, reduce gas emissions, increase land use efficiency | Presence of waste and/or abandoned waste, irregular water discharge, fire |
| 250,001 L/year–500,000 L/year | Reduce water use, control land use, reduce the use of fertilizers and pesticides, reduce gas emissions, packaging improvements (lighter bottles) | Presence of waste and/or abandoned waste, substance spill, irregular water discharge, fire |
| >500,000 L/year | Reduce water use, packaging improvements (lighter bottles), reduce paper use, control land use, reduce gas emissions, increase land use efficiency, improvements in wine distribution | Presence of waste and/or abandoned waste, irregular water discharge, substance spill, fire |
Disclaimer/Publisher’s Note: The statements, opinions and data contained in all publications are solely those of the individual author(s) and contributor(s) and not of MDPI and/or the editor(s). MDPI and/or the editor(s) disclaim responsibility for any injury to people or property resulting from any ideas, methods, instructions or products referred to in the content. |
© 2024 by the authors. Licensee MDPI, Basel, Switzerland. This article is an open access article distributed under the terms and conditions of the Creative Commons Attribution (CC BY) license (https://creativecommons.org/licenses/by/4.0/).
Share and Cite
López-Santiago, J.; Md Som, A.; Asyadi Bin Md Yusof, F.; Mazarrón, F.R.; Gómez-Villarino, M.T. Exploring Sustainability in Wineries: Evaluating Food Safety and Environmental Management Aligning with the Farm to Fork Strategy. Agriculture 2024, 14, 330. https://doi.org/10.3390/agriculture14030330
López-Santiago J, Md Som A, Asyadi Bin Md Yusof F, Mazarrón FR, Gómez-Villarino MT. Exploring Sustainability in Wineries: Evaluating Food Safety and Environmental Management Aligning with the Farm to Fork Strategy. Agriculture. 2024; 14(3):330. https://doi.org/10.3390/agriculture14030330
Chicago/Turabian StyleLópez-Santiago, Jesús, Amelia Md Som, Fahmi Asyadi Bin Md Yusof, Fernando R. Mazarrón, and María Teresa Gómez-Villarino. 2024. "Exploring Sustainability in Wineries: Evaluating Food Safety and Environmental Management Aligning with the Farm to Fork Strategy" Agriculture 14, no. 3: 330. https://doi.org/10.3390/agriculture14030330
APA StyleLópez-Santiago, J., Md Som, A., Asyadi Bin Md Yusof, F., Mazarrón, F. R., & Gómez-Villarino, M. T. (2024). Exploring Sustainability in Wineries: Evaluating Food Safety and Environmental Management Aligning with the Farm to Fork Strategy. Agriculture, 14(3), 330. https://doi.org/10.3390/agriculture14030330