
Impact of Heat Stress on the In-Line Registered Milk Fat-to-Protein Ratio and Metabolic Profile in Dairy Cows

 ,
,  ,
,
Abstract
1. Introduction
2. Materials and Methods
2.1. Facilities, Cows, and Research Methodology
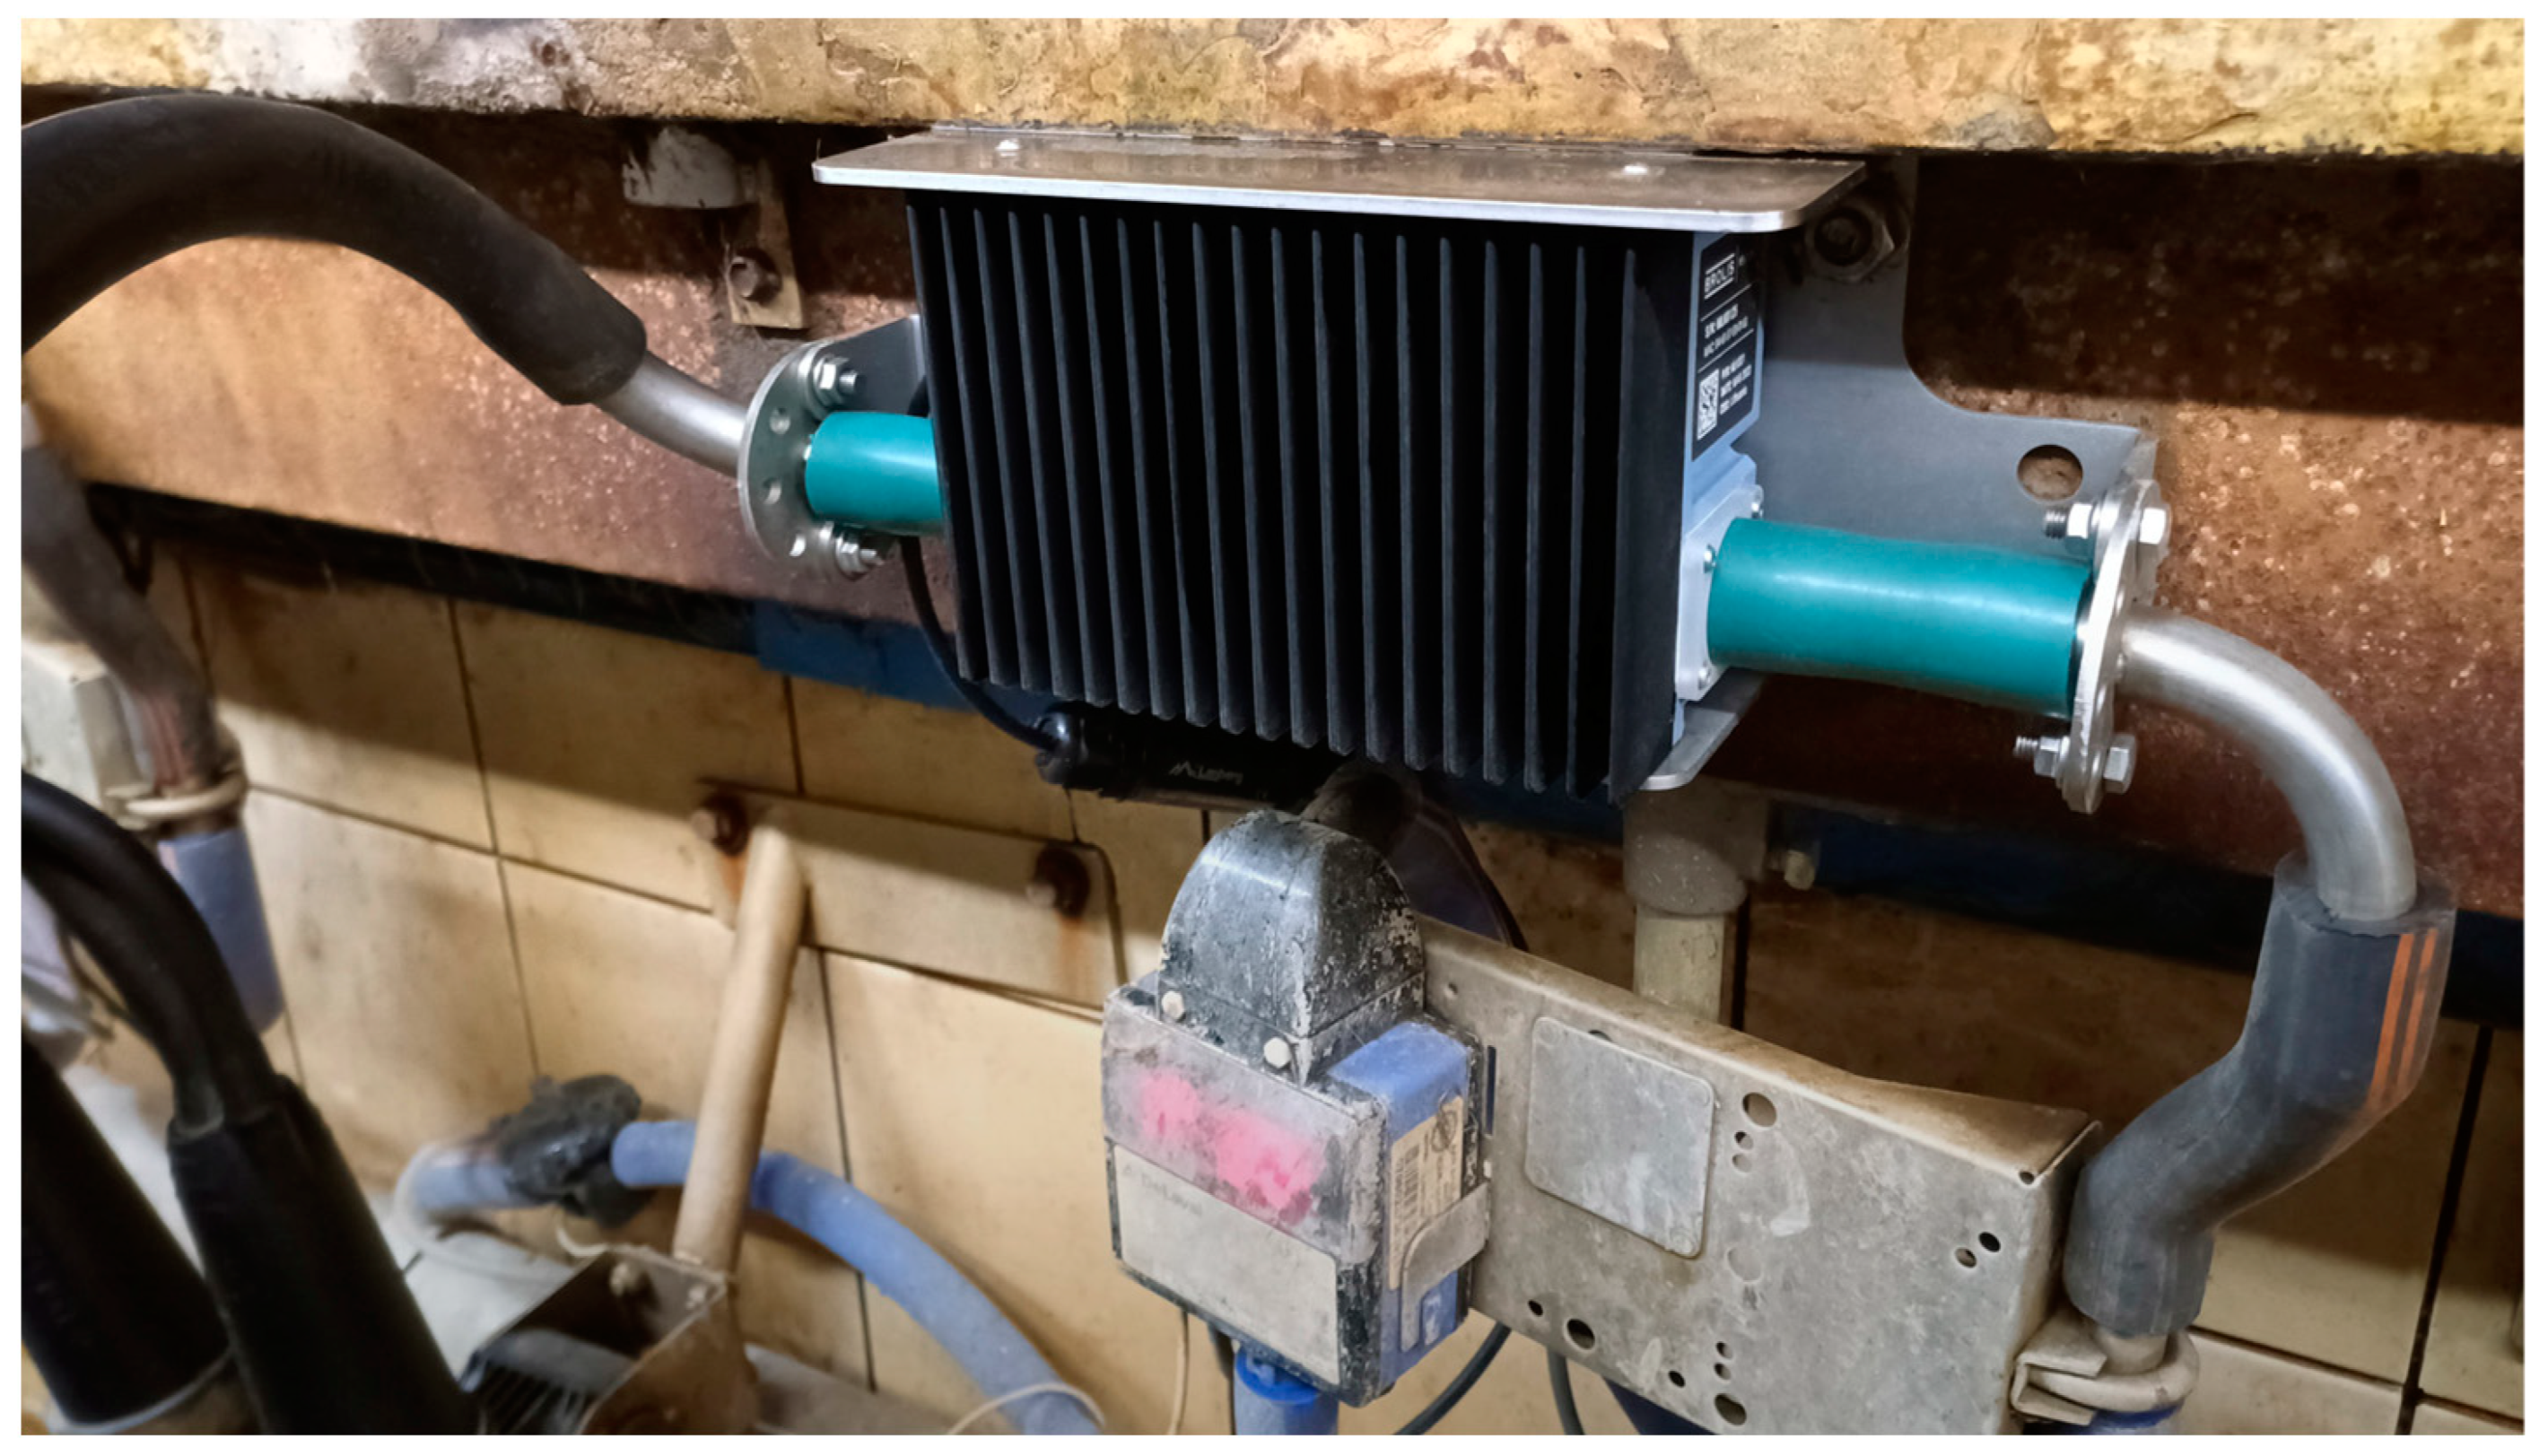
2.2. Measurements
2.3. Group Creation and THI Calculation
2.4. Statistical Analysis
3. Results
3.1. Summary Statistics for the Examined Parameters
3.2. Correlation of the Examined Parameters
4. Discussion
5. Conclusions
Author Contributions
Funding
Institutional Review Board Statement
Data Availability Statement
Conflicts of Interest
References
- Fuquay, J.W. Heat Stress as It Affects Animal Production. J. Anim. Sci. 1981, 52, 164–174. [Google Scholar] [CrossRef]
- Belhadj Slimen, I.; Najar, T.; Ghram, A.; Abdrrabba, M. Heat Stress Effects on Livestock: Molecular, Cellular and Metabolic Aspects, a Review. J. Anim. Physiol. Anim. Nutr. 2016, 100, 401–412. [Google Scholar] [CrossRef]
- Bernabucci, U.; Lacetera, N.; Baumgard, L.H.; Rhoads, R.P.; Ronchi, B.; Nardone, A. Metabolic and Hormonal Acclimation to Heat Stress in Domesticated Ruminants. Animal 2010, 4, 1167–1183. [Google Scholar] [CrossRef]
- Habimana, V.; Nguluma, A.S.; Nziku, Z.C.; Ekine-Dzivenu, C.C.; Morota, G.; Mrode, R.; Chenyambuga, S.W. Heat Stress Effects on Milk Yield Traits and Metabolites and Mitigation Strategies for Dairy Cattle Breeds Reared in Tropical and Sub-Tropical Countries. Front. Vet. Sci. 2023, 10, 1121499. [Google Scholar] [CrossRef]
- Dauria, B.D.; Sigdel, A.; Petrini, J.; Bóscollo, P.P.; Pilonetto, F.; Salvian, M.; Rezende, F.M.; Pedrosa, V.B.; Bittar, C.M.M.; Machado, P.F.; et al. Genetic Effects of Heat Stress on Milk Fatty Acids in Brazilian Holstein Cattle. J. Dairy Sci. 2022, 105, 3296–3305. [Google Scholar] [CrossRef]
- Sungkhapreecha, P.; Misztal, I.; Hidalgo, J.; Steyn, Y.; Buaban, S.; Duangjinda, M.; Boonkum, W. Changes in Genetic Parameters for Milk Yield and Heat Tolerance in the Thai Holstein Crossbred Dairy Population under Different Heat Stress Levels and over Time. J. Dairy Sci. 2021, 104, 12703–12712. [Google Scholar] [CrossRef]
- Boonkum, W.; Misztal, I.; Duangjinda, M.; Pattarajinda, V.; Tumwasorn, S.; Sanpote, J. Genetic Effects of Heat Stress on Milk Yield of Thai Holstein Crossbreds. J. Dairy Sci. 2011, 94, 487–492. [Google Scholar] [CrossRef]
- Beede, D.K.; Collier, R.J. Potential Nutritional Strategies for Intensively Managed Cattle during Thermal Stress. J. Anim. Sci. 1986, 62, 543–554. [Google Scholar] [CrossRef]
- West, J.W. Effects of Heat-Stress on Production in Dairy Cattle. J. Dairy Sci. 2003, 86, 2131–2144. [Google Scholar] [CrossRef]
- Fan, C.; Su, D.; Tian, H.; Li, X.; Li, Y.; Ran, L.; Hu, R.; Cheng, J. Liver Metabolic Perturbations of Heat-Stressed Lactating Dairy Cows. Asian-Australas. J. Anim. Sci. 2018, 31, 1244–1251. [Google Scholar] [CrossRef]
- Thom, E.C. The Discomfort Index. Weatherwise 1959, 12, 57–61. [Google Scholar] [CrossRef]
- Kibler, H.H. Environmental Physiology and Shelter Engineering with Special Reference to Domestic Animals. LXVII, Thermal Effects of Various Temperature-Humidity Combinations on Holstein Cattle as Measured by Eight Physiological Responses. Available online: https://mospace.umsystem.edu/xmlui/bitstream/handle/10355/58200/AESResearchBulletin.pdf?sequence=1 (accessed on 11 January 2024).
- Yousaf, A.; Sarfaraz, I.; Zafar, M.; Abbas, R.; Hussain, A.; Manzoor, D. Effect of Treatment with Tri-Sodium Citrate Alone and in Combination with Levamisole HCl on Total Milk Bacterial Count in Dairy Buffalo Suffering from Sub-Clinical Mastitis. Rev. Vet. 2010, 21, 187–189. [Google Scholar]
- Mader, T.L.; Davis, M.S.; Brown-Brandl, T. Environmental Factors Influencing Heat Stress in Feedlot Cattle1,2. J. Anim. Sci. 2006, 84, 712–719. [Google Scholar] [CrossRef]
- Yue, S.; Ding, S.; Zhou, J.; Yang, C.; Hu, X.; Zhao, X.; Wang, Z.; Wang, L.; Peng, Q.; Xue, B. Metabolomics Approach Explore Diagnostic Biomarkers and Metabolic Changes in Heat-Stressed Dairy Cows. Animals 2020, 10, 1741. [Google Scholar] [CrossRef]
- Sammad, A.; Wang, Y.J.; Umer, S.; Lirong, H.; Khan, I.; Khan, A.; Ahmad, B.; Wang, Y. Nutritional Physiology and Biochemistry of Dairy Cattle under the Influence of Heat Stress: Consequences and Opportunities. Animals 2020, 10, 793. [Google Scholar] [CrossRef]
- Bruckmaier, R.M.; Gross, J.J. Lactational Challenges in Transition Dairy Cows. Anim. Prod. Sci. 2017, 57, 1471–1481. [Google Scholar] [CrossRef]
- Liu, P.; He, X.; Yang, X.L.; Hou, X.L.; Han, J.B.; Han, Y.H.; Nie, P.; Fang, H.; Du, X.H. Bioactivity Evaluation of Certain Hepatic Enzymes in Blood Plasma and Milk of Holstein Cows. Pak. Vet. J. 2012, 32, 601–604. [Google Scholar]
- Duffield, T. Subclinical Ketosis in Lactating Dairy Cattle. Vet. Clin. N. Am. Food Anim. Pract. 2000, 16, 231–253. [Google Scholar] [CrossRef]
- Jenkins, N.T.; Peña, G.; Risco, C.; Barbosa, C.C.; Vieira-Neto, A.; Galvão, K.N. Utility of Inline Milk Fat and Protein Ratio to Diagnose Subclinical Ketosis and to Assign Propylene Glycol Treatment in Lactating Dairy Cows. Can. Vet. J. 2015, 56, 850–854. [Google Scholar]
- Caja, G.; Castro-Costa, A.; Knight, C.H. Engineering to Support Wellbeing of Dairy Animals. J. Dairy Res. 2016, 83, 136–147. [Google Scholar] [CrossRef]
- Antanaitis, R.; Džermeikaitė, K.; Januškevičius, V.; Šimonytė, I.; Baumgartner, W. In-Line Registered Milk Fat-to-Protein Ratio for the Assessment of Metabolic Status in Dairy Cows. Animals 2023, 13, 3293. [Google Scholar] [CrossRef]
- Reist, M.; Erdin, D.; von Euw, D.; Tschuemperlin, K.; Leuenberger, H.; Chilliard, Y.; Hammon, H.M.; Morel, C.; Philipona, C.; Zbinden, Y.; et al. Estimation of Energy Balance at the Individual and Herd Level Using Blood and Milk Traits in High-Yielding Dairy Cows. J. Dairy Sci. 2002, 85, 3314–3327. [Google Scholar] [CrossRef]
- Nikkhah, A.; Furedi, C.J.; Kennedy, A.D.; Crow, G.H.; Plaizier, J.C. Effects of Feed Delivery Time on Feed Intake, Milk Production, and Blood Metabolites of Dairy Cows. J. Dairy Sci. 2008, 91, 4249–4260. [Google Scholar] [CrossRef]
- Gantner, V.; Mijić, P.; Kuterovac, K.; Barać, Z.; Potočnik, K. Heat stress and milk production in the first parity holsteins cows threshold determination in eastern Croatia. Poljoprivreda 2015, 21, 97–100. [Google Scholar] [CrossRef]
- Armstrong, D.V. Heat Stress Interaction with Shade and Cooling. J. Dairy Sci. 1994, 77, 2044–2050. [Google Scholar] [CrossRef]
- Rhoads, M.L.; Rhoads, R.P.; VanBaale, M.J.; Collier, R.J.; Sanders, S.R.; Weber, W.J.; Crooker, B.A.; Baumgard, L.H. Effects of Heat Stress and Plane of Nutrition on Lactating Holstein Cows: I. Production, Metabolism, and Aspects of Circulating Somatotropin1. J. Dairy Sci. 2009, 92, 1986–1997. [Google Scholar] [CrossRef]
- Buttchereit, N.; Stamer, E.; Junge, W.; Thaller, G. Evaluation of Five Lactation Curve Models Fitted for Fat: Protein Ratio of Milk and Daily Energy Balance. J. Dairy Sci. 2010, 93, 1702–1712. [Google Scholar] [CrossRef]
- Heuer, C.; Schukken, Y.H.; Dobbelaar, P. Postpartum Body Condition Score and Results from the First Test Day Milk as Predictors of Disease, Fertility, Yield, and Culling in Commercial Dairy Herds. J. Dairy Sci. 1999, 82, 295–304. [Google Scholar] [CrossRef]
- Gonzalez-Mejia, A.; Styles, D.; Wilson, P.; Gibbons, J. Metrics and Methods for Characterizing Dairy Farm Intensification Using Farm Survey Data. PLoS ONE 2018, 13, e0195286. [Google Scholar] [CrossRef]
- Gross, J.J.; Bruckmaier, R.M. Review: Metabolic Challenges in Lactating Dairy Cows and Their Assessment via Established and Novel Indicators in Milk. Animal 2019, 13, s75–s81. [Google Scholar] [CrossRef]
- Cowley, F.C.; Barber, D.G.; Houlihan, A.V.; Poppi, D.P. Immediate and Residual Effects of Heat Stress and Restricted Intake on Milk Protein and Casein Composition and Energy Metabolism. J. Dairy Sci. 2015, 98, 2356–2368. [Google Scholar] [CrossRef]
- Shwartz, G.; Rhoads, M.L.; VanBaale, M.J.; Rhoads, R.P.; Baumgard, L.H. Effects of a Supplemental Yeast Culture on Heat-Stressed Lactating Holstein Cows1. J. Dairy Sci. 2009, 92, 935–942. [Google Scholar] [CrossRef]
- Ronchi, B.; Lacetera, N.; Bernabucci, U.; Nardone, A.; Supplizi, A.V. Distinct and Common Effects of Heat Stress and Restricted Feeding on Metabolic Status of Holstein Heifers. Zootec. E Nutr. Anim. Italy 1999, 25, 11–20. [Google Scholar]
- Schneider, P.L.; Beede, D.K.; Wilcox, C.J. Nycterohemeral Patterns of Acid-Base Status, Mineral Concentrations and Digestive Function of Lactating Cows in Natural or Chamber Heat Stress Environments. J. Anim. Sci. 1988, 66, 112–125. [Google Scholar] [CrossRef]
- Kelley, G.A.; Kelley, K.S.; Tran, Z.V. Aerobic Exercise and Lipids and Lipoproteins in Women: A Meta-Analysis of Randomized Controlled Trials. J. Womens Health 2004, 13, 1148–1164. [Google Scholar] [CrossRef]
- Soest, P.J.V. Nutritional Ecology of the Ruminant; Cornell University Press: Ithaca, NY, USA, 2018; ISBN 978-1-5017-3235-5. [Google Scholar]
- Wheelock, J.B.; Rhoads, R.P.; VanBaale, M.J.; Sanders, S.R.; Baumgard, L.H. Effects of Heat Stress on Energetic Metabolism in Lactating Holstein Cows1. J. Dairy Sci. 2010, 93, 644–655. [Google Scholar] [CrossRef]
- O’Brien, M.D.; Rhoads, R.P.; Sanders, S.R.; Duff, G.C.; Baumgard, L.H. Metabolic Adaptations to Heat Stress in Growing Cattle. Domest. Anim. Endocrinol. 2010, 38, 86–94. [Google Scholar] [CrossRef]
- Fox, D.G.; Tylutki, T.P. Accounting for the Effects of Environment on the Nutrient Requirements of Dairy Cattle. J. Dairy Sci. 1998, 81, 3085–3095. [Google Scholar] [CrossRef]


| Descriptives | |||||||||
|---|---|---|---|---|---|---|---|---|---|
| N | Mean | Std. Deviation | Std. Error | 95% Confidence Interval for Mean | Minimum | Maximum | |||
| Lower Bound | Upper Bound | ||||||||
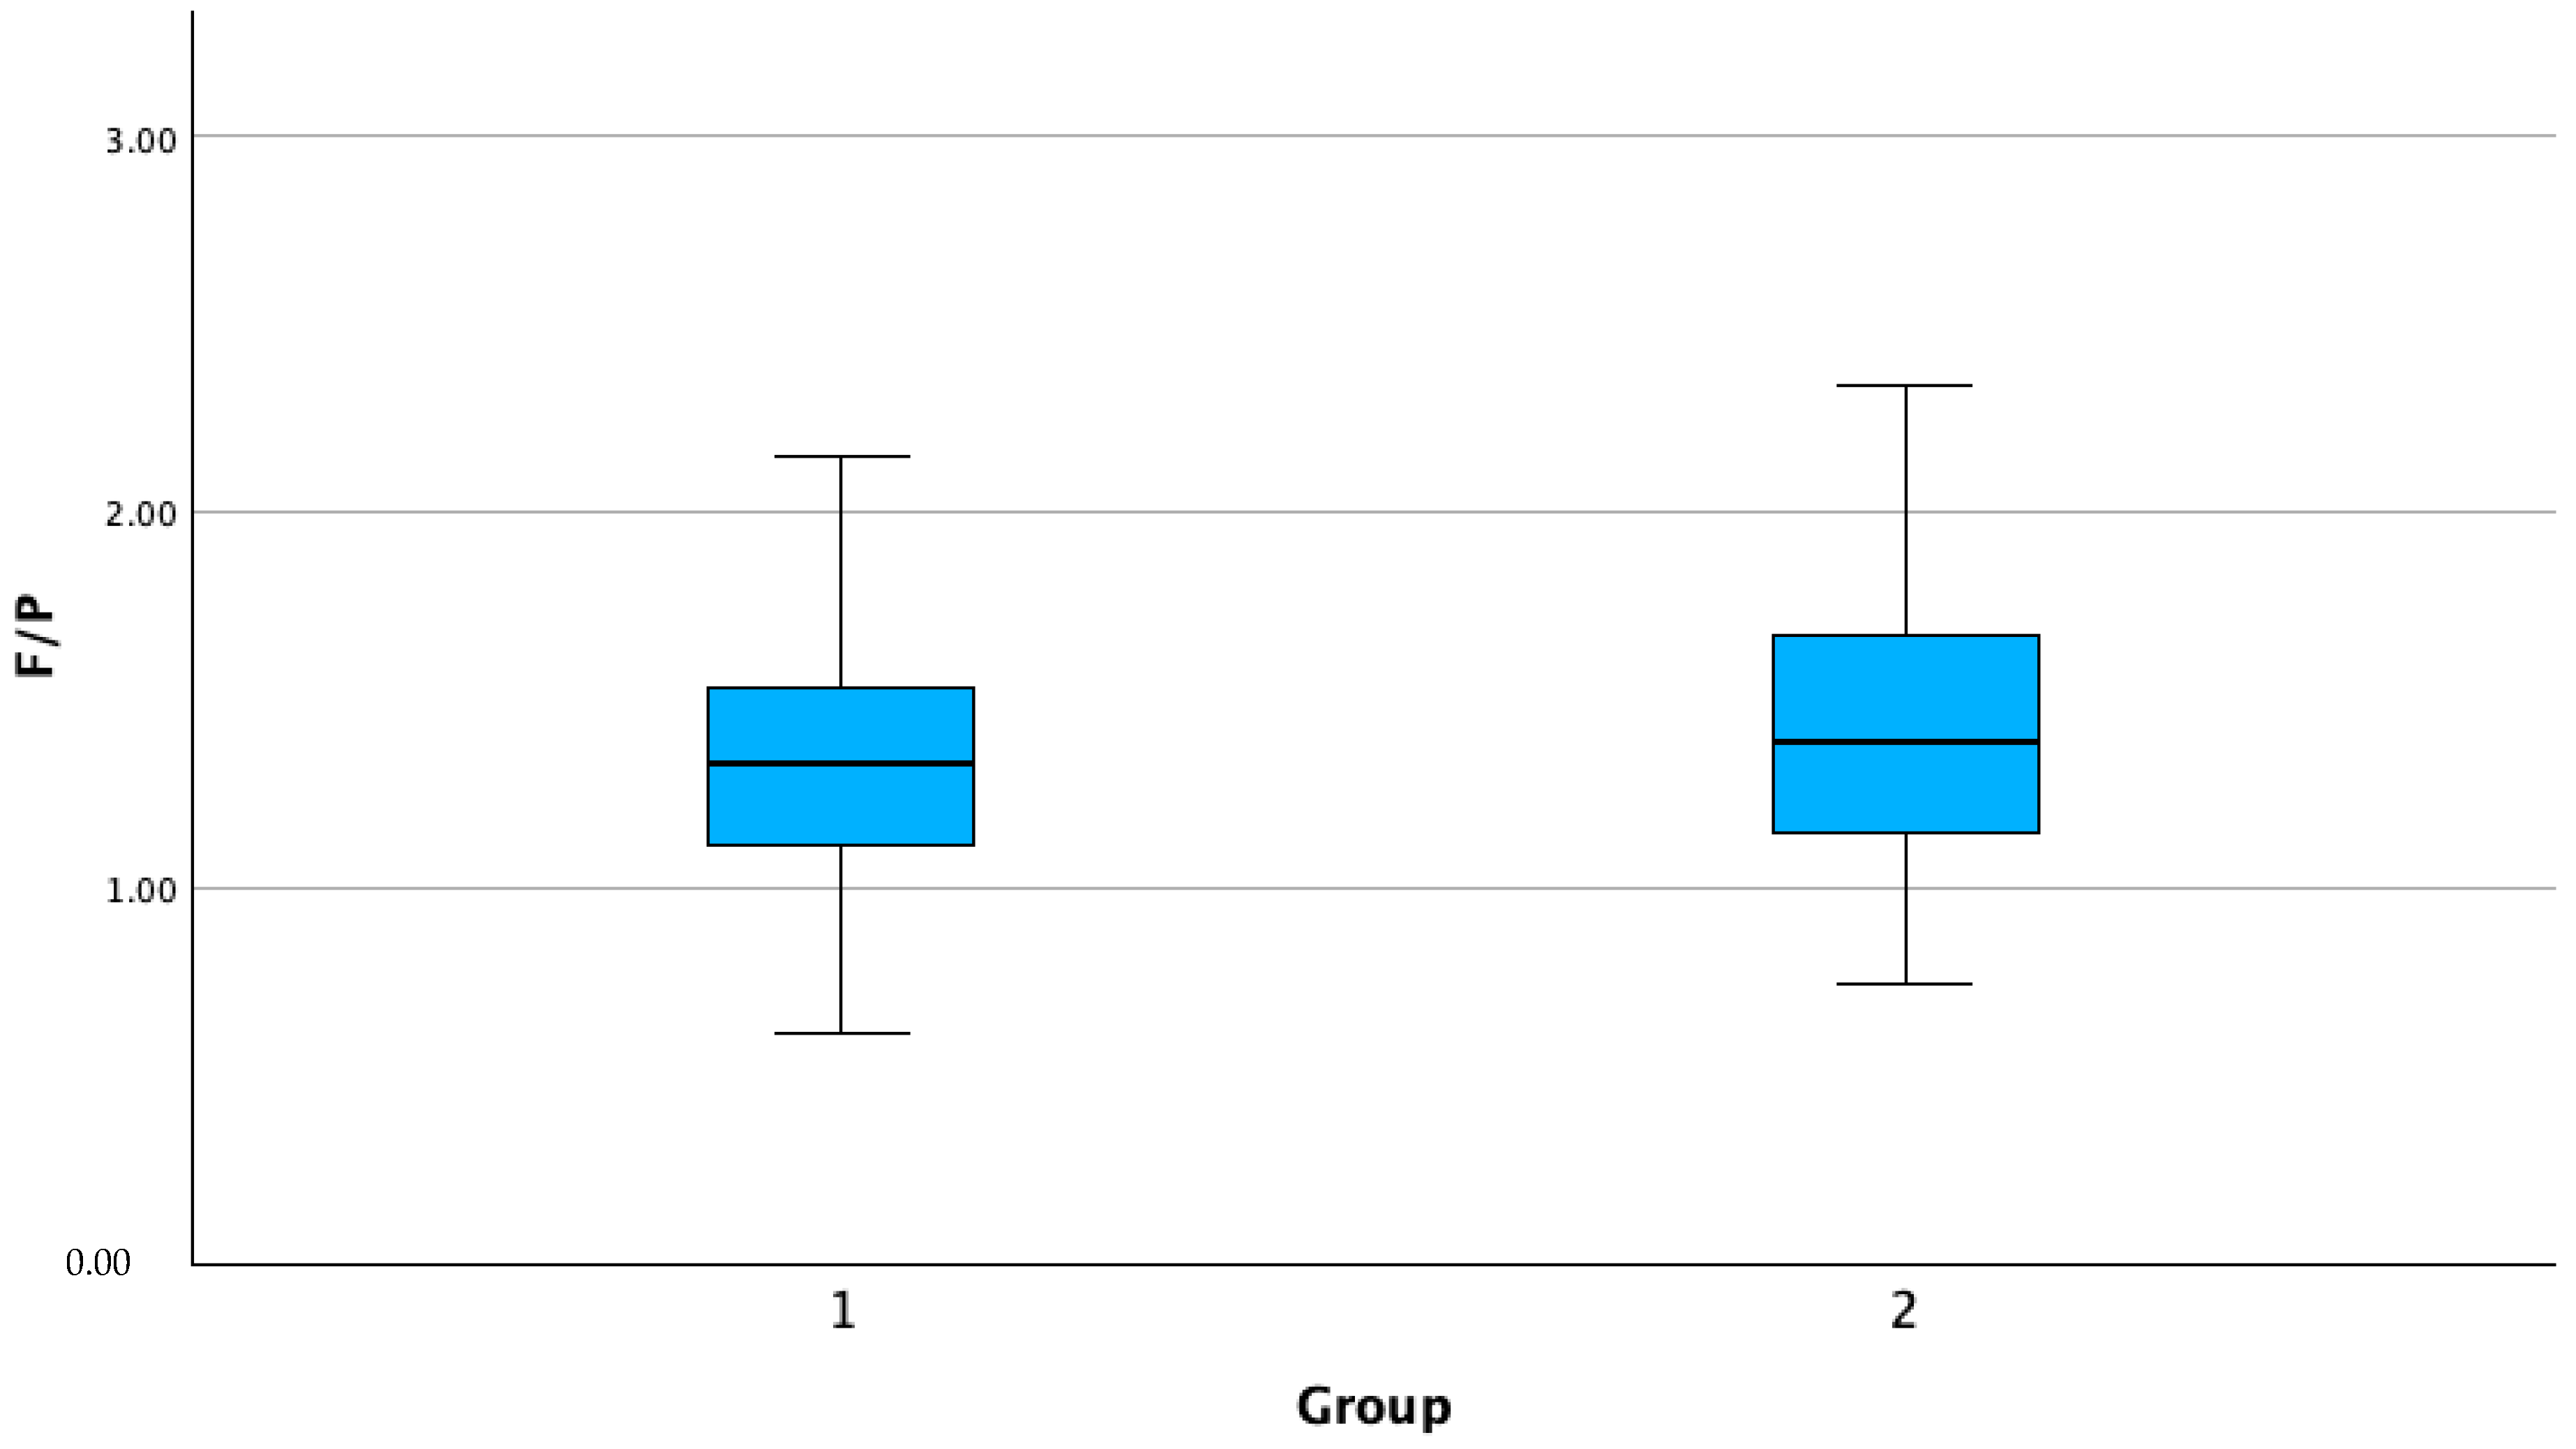
| F/P | 1 | 276 | 1.35 | 0.33 | 0.02 | 1.31 | 1.39 | 0.61 | 2.75 |
| 2 | 43 | 1.47 | 0.42 | 0.06 | 1.33 | 1.60 | 0.74 | 2.63 | |
| Total | 319 | 1.37 | 0.34 | 0.01 | 1.33 | 1.41 | 0.61 | 2.75 | |
| GLU | 1 | 276 | 2.74 | 0.37 | 0.02 | 2.70 | 2.79 | 1.1 | 4.1 |
| 2 | 43 | 2.63 | 0.33 | 0.05 | 2.527 | 2.73 | 2.0 | 3.8 | |
| Total | 319 | 2.73 | 0.36 | 0.02 | 2.69 | 2.77 | 1.1 | 4.1 | |
| BHB | 1 | 276 | 0.41 | 0.29 | 0.01 | 0.38 | 0.45 | 0.1 | 2.5 |
| 2 | 43 | 0.43 | 0.33 | 0.05 | 0.33 | 0.54 | 0.1 | 1.9 | |
| Total | 319 | 0.41 | 0.29 | 0.01 | 0.38 | 0.45 | 0.1 | 2.5 | |
| AST | 1 | 276 | 106.01 | 42.32 | 2.54 | 100.99 | 111.02 | 50.9 | 478.2 |
| 2 | 43 | 95.40 | 23.62 | 3.60 | 88.13 | 102.67 | 61.6 | 177.4 | |
| Total | 319 | 104.58 | 40.44 | 2.26 | 100.12 | 109.03 | 50.9 | 478.2 | |
| GGT | 1 | 276 | 32.82 | 18.47 | 1.11 | 30.63 | 35.01 | 13 | 151 |
| 2 | 43 | 27.28 | 10.30 | 1.57 | 24.11 | 30.45 | 10 | 65 | |
| Total | 319 | 32.07 | 17.68 | 0.99 | 30.12 | 34.02 | 10 | 151 | |
| NEFAs | 1 | 276 | 0.40 | 0.28 | 0.01 | 0.36 | 0.43 | 0.08 | 1.65 |
| 2 | 43 | 0.44 | 0.31 | 0.04 | 0.35 | 0.54 | 0.11 | 1.45 | |
| Total | 319 | 0.40 | 0.29 | 0.01 | 0.37 | 0.44 | 0.08 | 1.65 | |
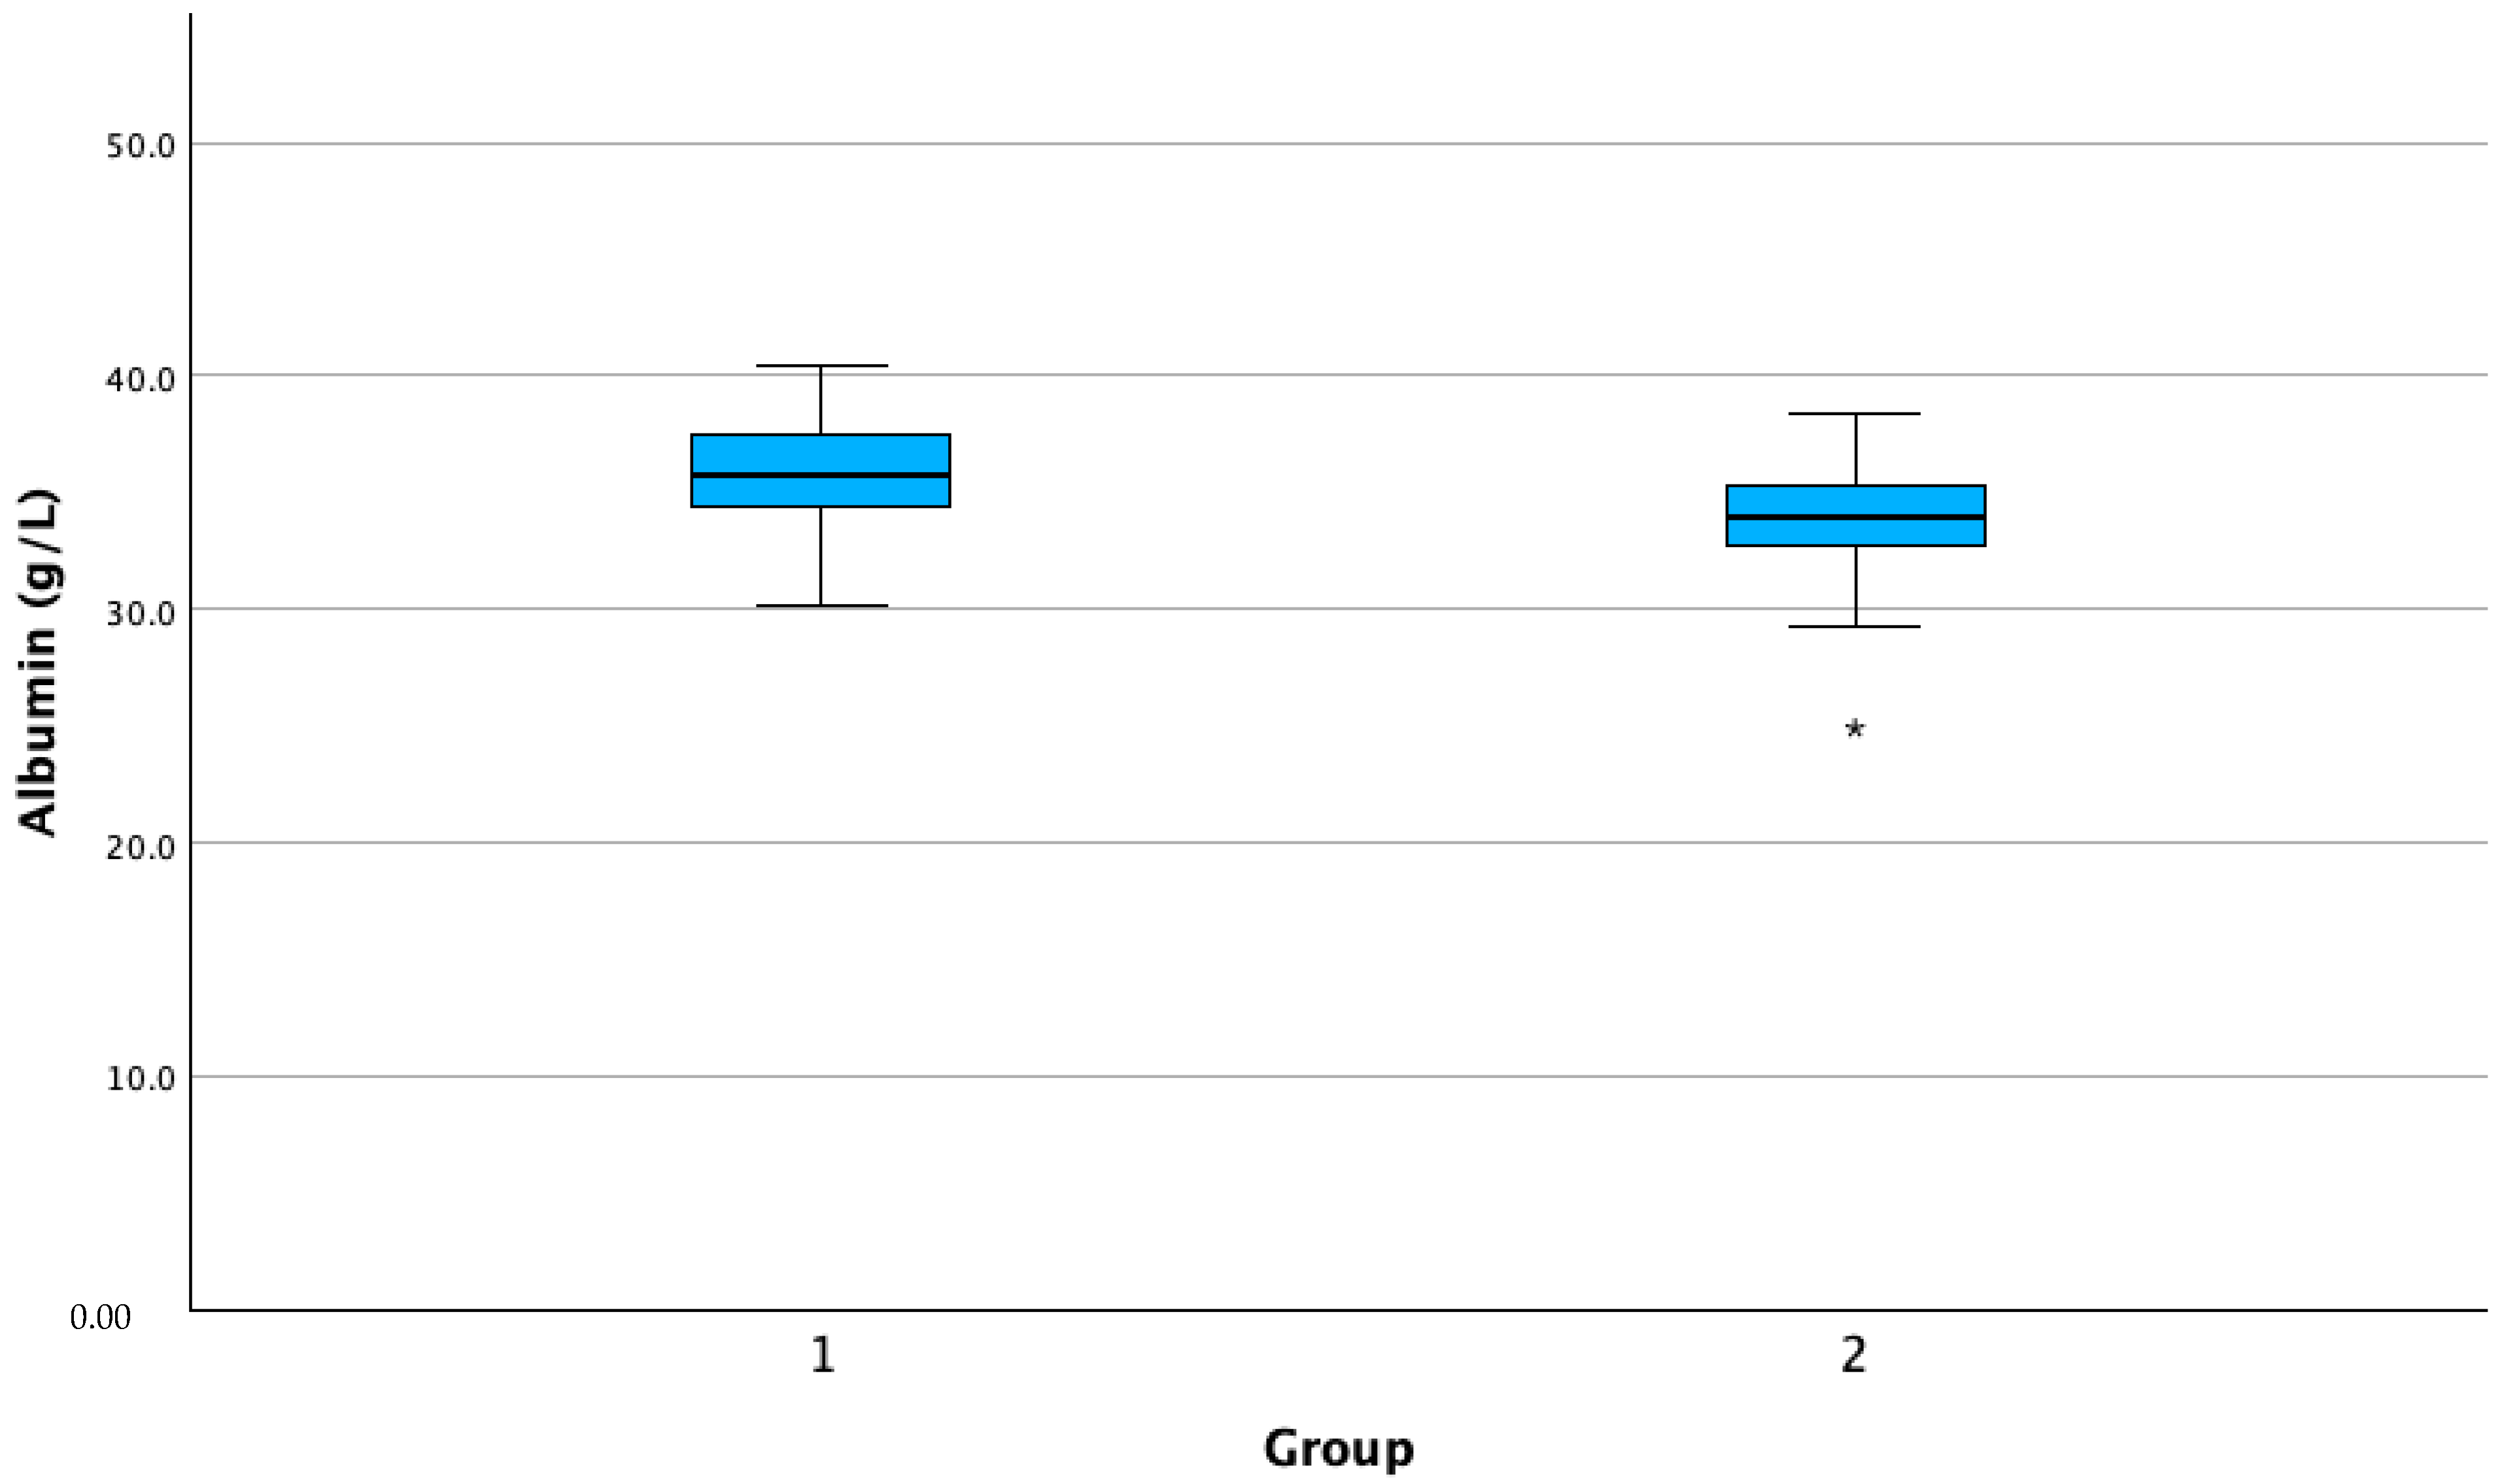
| Albumin | 1 | 276 | 35.76 | 2.29 | 0.13 | 35.48 | 36.03 | 25.3 | 40.4 |
| 2 | 43 | 33.79 | 2.60 | 0.39 | 32.98 | 34.59 | 24.9 | 38.4 | |
| Total | 319 | 35.49 | 2.43 | 0.13 | 35.22 | 35.76 | 24.9 | 40.4 | |
| THI | T | H | F/P | GLU | BHB | AST | GGT | NEFAs | Albumin | ||
|---|---|---|---|---|---|---|---|---|---|---|---|
| THI | Pearson correlation | 1 | 0.977 ** | 0.199 ** | 0.043 | −0.160 ** | −0.046 | −0.035 | −0.060 | 0.054 | −0.284 ** |
| sig. (2-tailed) | <0.001 | <0.001 | 0.447 | 0.005 | 0.417 | 0.538 | 0.286 | 0.333 | <0.001 | ||
| N | 319 | 319 | 319 | 312 | 308 | 309 | 319 | 318 | 319 | 319 | |
| T | Pearson correlation | 0.977 ** | 1 | −0.004 | 0.044 | −0.121 * | −0.077 | 0.005 | −0.040 | 0.045 | −0.263 ** |
| sig. (2-tailed) | <0.001 | 0.946 | 0.440 | 0.034 | 0.176 | 0.936 | 0.480 | 0.423 | <0.001 | ||
| N | 319 | 319 | 319 | 312 | 308 | 309 | 319 | 318 | 319 | 319 | |
| H | Pearson correlation | 0.199 ** | −0.004 | 1 | 0.012 | −0.116 * | 0.168 ** | −0.181 ** | −0.086 | 0.081 | −0.143 * |
| sig. (2-tailed) | <0.001 | 0.946 | 0.836 | 0.041 | 0.003 | 0.001 | 0.124 | 0.151 | 0.011 | ||
| N | 319 | 319 | 319 | 312 | 308 | 309 | 319 | 318 | 319 | 319 | |
| F/P | Pearson correlation | 0.043 | 0.044 | 0.012 | 1 | 0.150 ** | 0.206 ** | −0.057 | −0.038 | 0.583 ** | −0.220 ** |
| sig. (2-tailed) | 0.447 | 0.440 | 0.836 | 0.009 | <0.001 | 0.318 | 0.505 | <0.001 | <0.001 | ||
| N | 312 | 312 | 312 | 312 | 302 | 303 | 312 | 311 | 312 | 312 | |
| GLU | Pearson correlation | −0.160 ** | −0.121 * | −0.116 * | 0.150 ** | 1 | −0.294 ** | −0.028 | −0.016 | 0.048 | −0.102 |
| sig. (2-tailed) | 0.005 | 0.034 | 0.041 | 0.009 | <0.001 | 0.622 | 0.782 | 0.400 | 0.075 | ||
| N | 308 | 308 | 308 | 302 | 308 | 308 | 308 | 307 | 308 | 308 | |
| BHB | Pearson correlation | −0.046 | −0.077 | 0.168 ** | 0.206 ** | −0.294 ** | 1 | 0.062 | −0.037 | 0.235 ** | 0.037 |
| sig. (2-tailed) | 0.417 | 0.176 | 0.003 | <0.001 | <0.001 | 0.278 | 0.516 | <0.001 | 0.520 | ||
| N | 309 | 309 | 309 | 303 | 308 | 309 | 309 | 308 | 309 | 309 | |
| AST | Pearson correlation | −0.035 | 0.005 | −0.181 ** | −0.057 | −0.028 | 0.062 | 1 | 0.457 ** | 0.080 | 0.129 * |
| sig. (2-tailed) | 0.538 | 0.936 | 0.001 | 0.318 | 0.622 | 0.278 | <0.001 | 0.156 | 0.021 | ||
| N | 319 | 319 | 319 | 312 | 308 | 309 | 319 | 318 | 319 | 319 | |
| GGT | Pearson correlation | −0.060 | −0.040 | −0.086 | −0.038 | −0.016 | −0.037 | 0.457 ** | 1 | 0.039 | 0.091 |
| sig. (2-tailed) | 0.286 | 0.480 | 0.124 | 0.505 | 0.782 | 0.516 | <0.001 | 0.486 | 0.105 | ||
| N | 318 | 318 | 318 | 311 | 307 | 308 | 318 | 318 | 318 | 318 | |
| NEFAs | Pearson correlation | 0.054 | 0.045 | 0.081 | 0.583 ** | 0.048 | 0.235 ** | 0.080 | 0.039 | 1 | −0.066 |
| sig. (2-tailed) | 0.333 | 0.423 | 0.151 | <0.001 | 0.400 | <0.001 | 0.156 | 0.486 | 0.240 | ||
| N | 319 | 319 | 319 | 312 | 308 | 309 | 319 | 318 | 319 | 319 | |
| Albumin | Pearson correlation | −0.284 ** | −0.263 ** | −0.143 * | −0.220 ** | −0.102 | 0.037 | 0.129 * | 0.091 | −0.066 | 1 |
| sig. (2-tailed) | <0.001 | <0.001 | 0.011 | <0.001 | 0.075 | 0.520 | 0.021 | 0.105 | 0.240 | ||
| N | 319 | 319 | 319 | 312 | 308 | 309 | 319 | 318 | 319 | 319 | |
Disclaimer/Publisher’s Note: The statements, opinions and data contained in all publications are solely those of the individual author(s) and contributor(s) and not of MDPI and/or the editor(s). MDPI and/or the editor(s) disclaim responsibility for any injury to people or property resulting from any ideas, methods, instructions or products referred to in the content. |
© 2024 by the authors. Licensee MDPI, Basel, Switzerland. This article is an open access article distributed under the terms and conditions of the Creative Commons Attribution (CC BY) license (https://creativecommons.org/licenses/by/4.0/).
Share and Cite
Antanaitis, R.; Džermeikaitė, K.; Krištolaitytė, J.; Ribelytė, I.; Bespalovaitė, A.; Bulvičiūtė, D.; Tolkačiovaitė, K.; Baumgartner, W. Impact of Heat Stress on the In-Line Registered Milk Fat-to-Protein Ratio and Metabolic Profile in Dairy Cows. Agriculture 2024, 14, 203. https://doi.org/10.3390/agriculture14020203
Antanaitis R, Džermeikaitė K, Krištolaitytė J, Ribelytė I, Bespalovaitė A, Bulvičiūtė D, Tolkačiovaitė K, Baumgartner W. Impact of Heat Stress on the In-Line Registered Milk Fat-to-Protein Ratio and Metabolic Profile in Dairy Cows. Agriculture. 2024; 14(2):203. https://doi.org/10.3390/agriculture14020203
Chicago/Turabian StyleAntanaitis, Ramūnas, Karina Džermeikaitė, Justina Krištolaitytė, Ieva Ribelytė, Agnė Bespalovaitė, Deimantė Bulvičiūtė, Kotryna Tolkačiovaitė, and Walter Baumgartner. 2024. "Impact of Heat Stress on the In-Line Registered Milk Fat-to-Protein Ratio and Metabolic Profile in Dairy Cows" Agriculture 14, no. 2: 203. https://doi.org/10.3390/agriculture14020203
APA StyleAntanaitis, R., Džermeikaitė, K., Krištolaitytė, J., Ribelytė, I., Bespalovaitė, A., Bulvičiūtė, D., Tolkačiovaitė, K., & Baumgartner, W. (2024). Impact of Heat Stress on the In-Line Registered Milk Fat-to-Protein Ratio and Metabolic Profile in Dairy Cows. Agriculture, 14(2), 203. https://doi.org/10.3390/agriculture14020203