Article

Effects of Straw Incorporation and Decomposition on Soil Preferential Flow Patterns Using the Dye-Tracer Method

1
College of Agricultural Science and Engineering, Hohai University, Nanjing 210098, China
2
Jiangxi Academy of Water Science and Engineering, Nanchang 330029, China
*
Author to whom correspondence should be addressed.
Agriculture 2024, 14(2), 201; https://doi.org/10.3390/agriculture14020201
Submission received: 10 November 2023 / Revised: 10 January 2024 / Accepted: 24 January 2024 / Published: 27 January 2024
(This article belongs to the Section Agricultural Soils)

Abstract

:
Preferential pathways in soil lead to nutrient leaching and groundwater contamination. However, the evolution of preferential flow with straw application remains uncertain. This study aims to experimentally determine the hypothesis that, depending on how it is applied, straw will either promote or inhibit the movement of soil preferential flow. Treatments with straw application rates of 0, 5, 10, and 15 t/ha and decomposition time points of 0, 60, and 240 d were set up for the potassium iodide–starch dye-tracer method. The results showed that the straw decomposition rate slowed down in the later stages. At 0 d, the preferential flow coefficients of straw application of 0, 5, 10, and 15 t/ha were 0.13, 0.14, 0.23, and 0.17, respectively. At 60 d, the preferential flow coefficients were approximately 0.17, 0.11, 0.22, and 0.12. Soil properties and irrigation quality improved at 0 d and 60 d. However, a marked increase of 0.31, 0.35, and 0.17 in the preferential flow coefficient was observed at 240 d. Soil properties and irrigation quality deteriorated at 240 d. These results indicate that the effect of straw incorporation and decomposition on preferential flow was initially inhibited and subsequently promoted. Soil properties and irrigation quality were initially improved and subsequently deteriorated. The study serves as a reference for rational utilization of agricultural residuals and scientific irrigation, suggesting that the optimal method of straw incorporation should be adopted based on the growth cycle of the crops.

1. Introduction

Straw incorporation, which benefits soil both physicochemically and biologically, provides the most effective and practical utilization of agricultural residues. Preferential flow is a rapid, non-equilibrium form of soil moisture movement that bypasses the soil matrix and travels directly downward. Preferential flow exacerbates nutritional loss and eutrophication following irrigation events.
Upon straw incorporation, increases in soil porosity, agglomerate diameter, and stability [1], a decline in soil bulk density [2], the phenomenon of compaction, and impediments to continuous cultivation [3] have been demonstrated. By reducing the shrinkage and hysteresis segments of the soil structure, straw improves the shrinkage-prone properties of the soil [4], increases the capacity of the water and nutrition reservoir [5], and significantly inhibits the preferential flow phenomenon [6]. According to Han et al., the high cellulose content and low bulk density of straw made it a “wedge” in the soil if incorporated into the field [7], which effectively helped ameliorate the three phases and compactness of the soil [8]. Fang et al. explained that the surface of the straw formed numerous new pores due to decomposition [9]. Furthermore, Pan et al. reported that straw was mainly composed of cellulose, hemicellulose, and lignin, which made it a natural carbon source [3]. Decomposition helps soil organic matter to accumulate [10] and activates microbes to form more pore spaces in the soil [11]. Additionally, according to other studies, soil organic matter acts as a crucial cementing agent that promotes macroaggregate formation [12] and porosity elevation [13].
Incorporating straw decomposes and releases nutrients with the assistance of soil microbes; thus, the volume, activity, and environment of the microbial community can affect the process [14]. The spatial heterogeneity of soils determines the microbial activity and habitat and thereby affects the decomposition process of organic matter. Furthermore, it has also been found that the straw decomposition rate varies significantly across pore sizes or magnitudes [15]. Around macropore spaces, decaying roots or stalks produce additional organic matter and nutrient content, which provides a habitat for more microorganisms and speeds up decomposition. Straw incorporation and associated microbial decomposition activities prominently alter pore morphology [16]. To decompose organic matter, fungal mycelium invades the pore space during decomposition as the CO2 reaction product is emitted, and macropores gradually develop [16]. Liu et al. noted that the characteristics of soil pores, particularly macropores that regulate preferential flow, have a direct impact on moisture–nutrient transport and the conservation capacity of the soil, which renders them critical factors affecting soil moisture features [17]. Studies have also shown that straw decomposition tends to form a macroporous structure, which leads to preferential flow and nutrient leaching during and after irrigation and results in inefficient field water utilization, nutrient leaching, and groundwater contamination. Specific adverse consequences include elevated N and P concentrations on the water surface during the drowning period [18] and nutrient leaching losses in deep seepage [19].
The apparent increase in soil water potential cannot be detected in the preferential flow movement through densely connected macropores [20], which demonstrates that macropore flow is not directly related to the initial soil water content and soil water potential during moisture migration. Thus, it cannot be described by the conventional Darcy–Richards equation. Instead, dual-pore models and dual-domain (matrix domain and macropore domain) models [21] combined with the dye-tracer method [22], breakthrough curve method [23], and CT scanning method [24] have been utilized to describe the macropore flow mechanism. Nevertheless, knowledge concerning the evolution of soil moisture retention characteristics and preferential flow during the straw decomposition process is relatively limited.
In this context, it is reasonable to assume that the effects of straw incorporation and decomposition on soil preferential flow movement are two-sided, and may relate to the straw application rate and the duration of decomposition. The primary objectives of this study were as follows: (1) to experimentally investigate the straw decomposition process, (2) to observe the dyed patterns of preferential flow, and (3) to evaluate soil moisture retention capacity and irrigation quality with straw incorporation.

2. Materials and Methods

2.1. Dye-Tracer Experiment

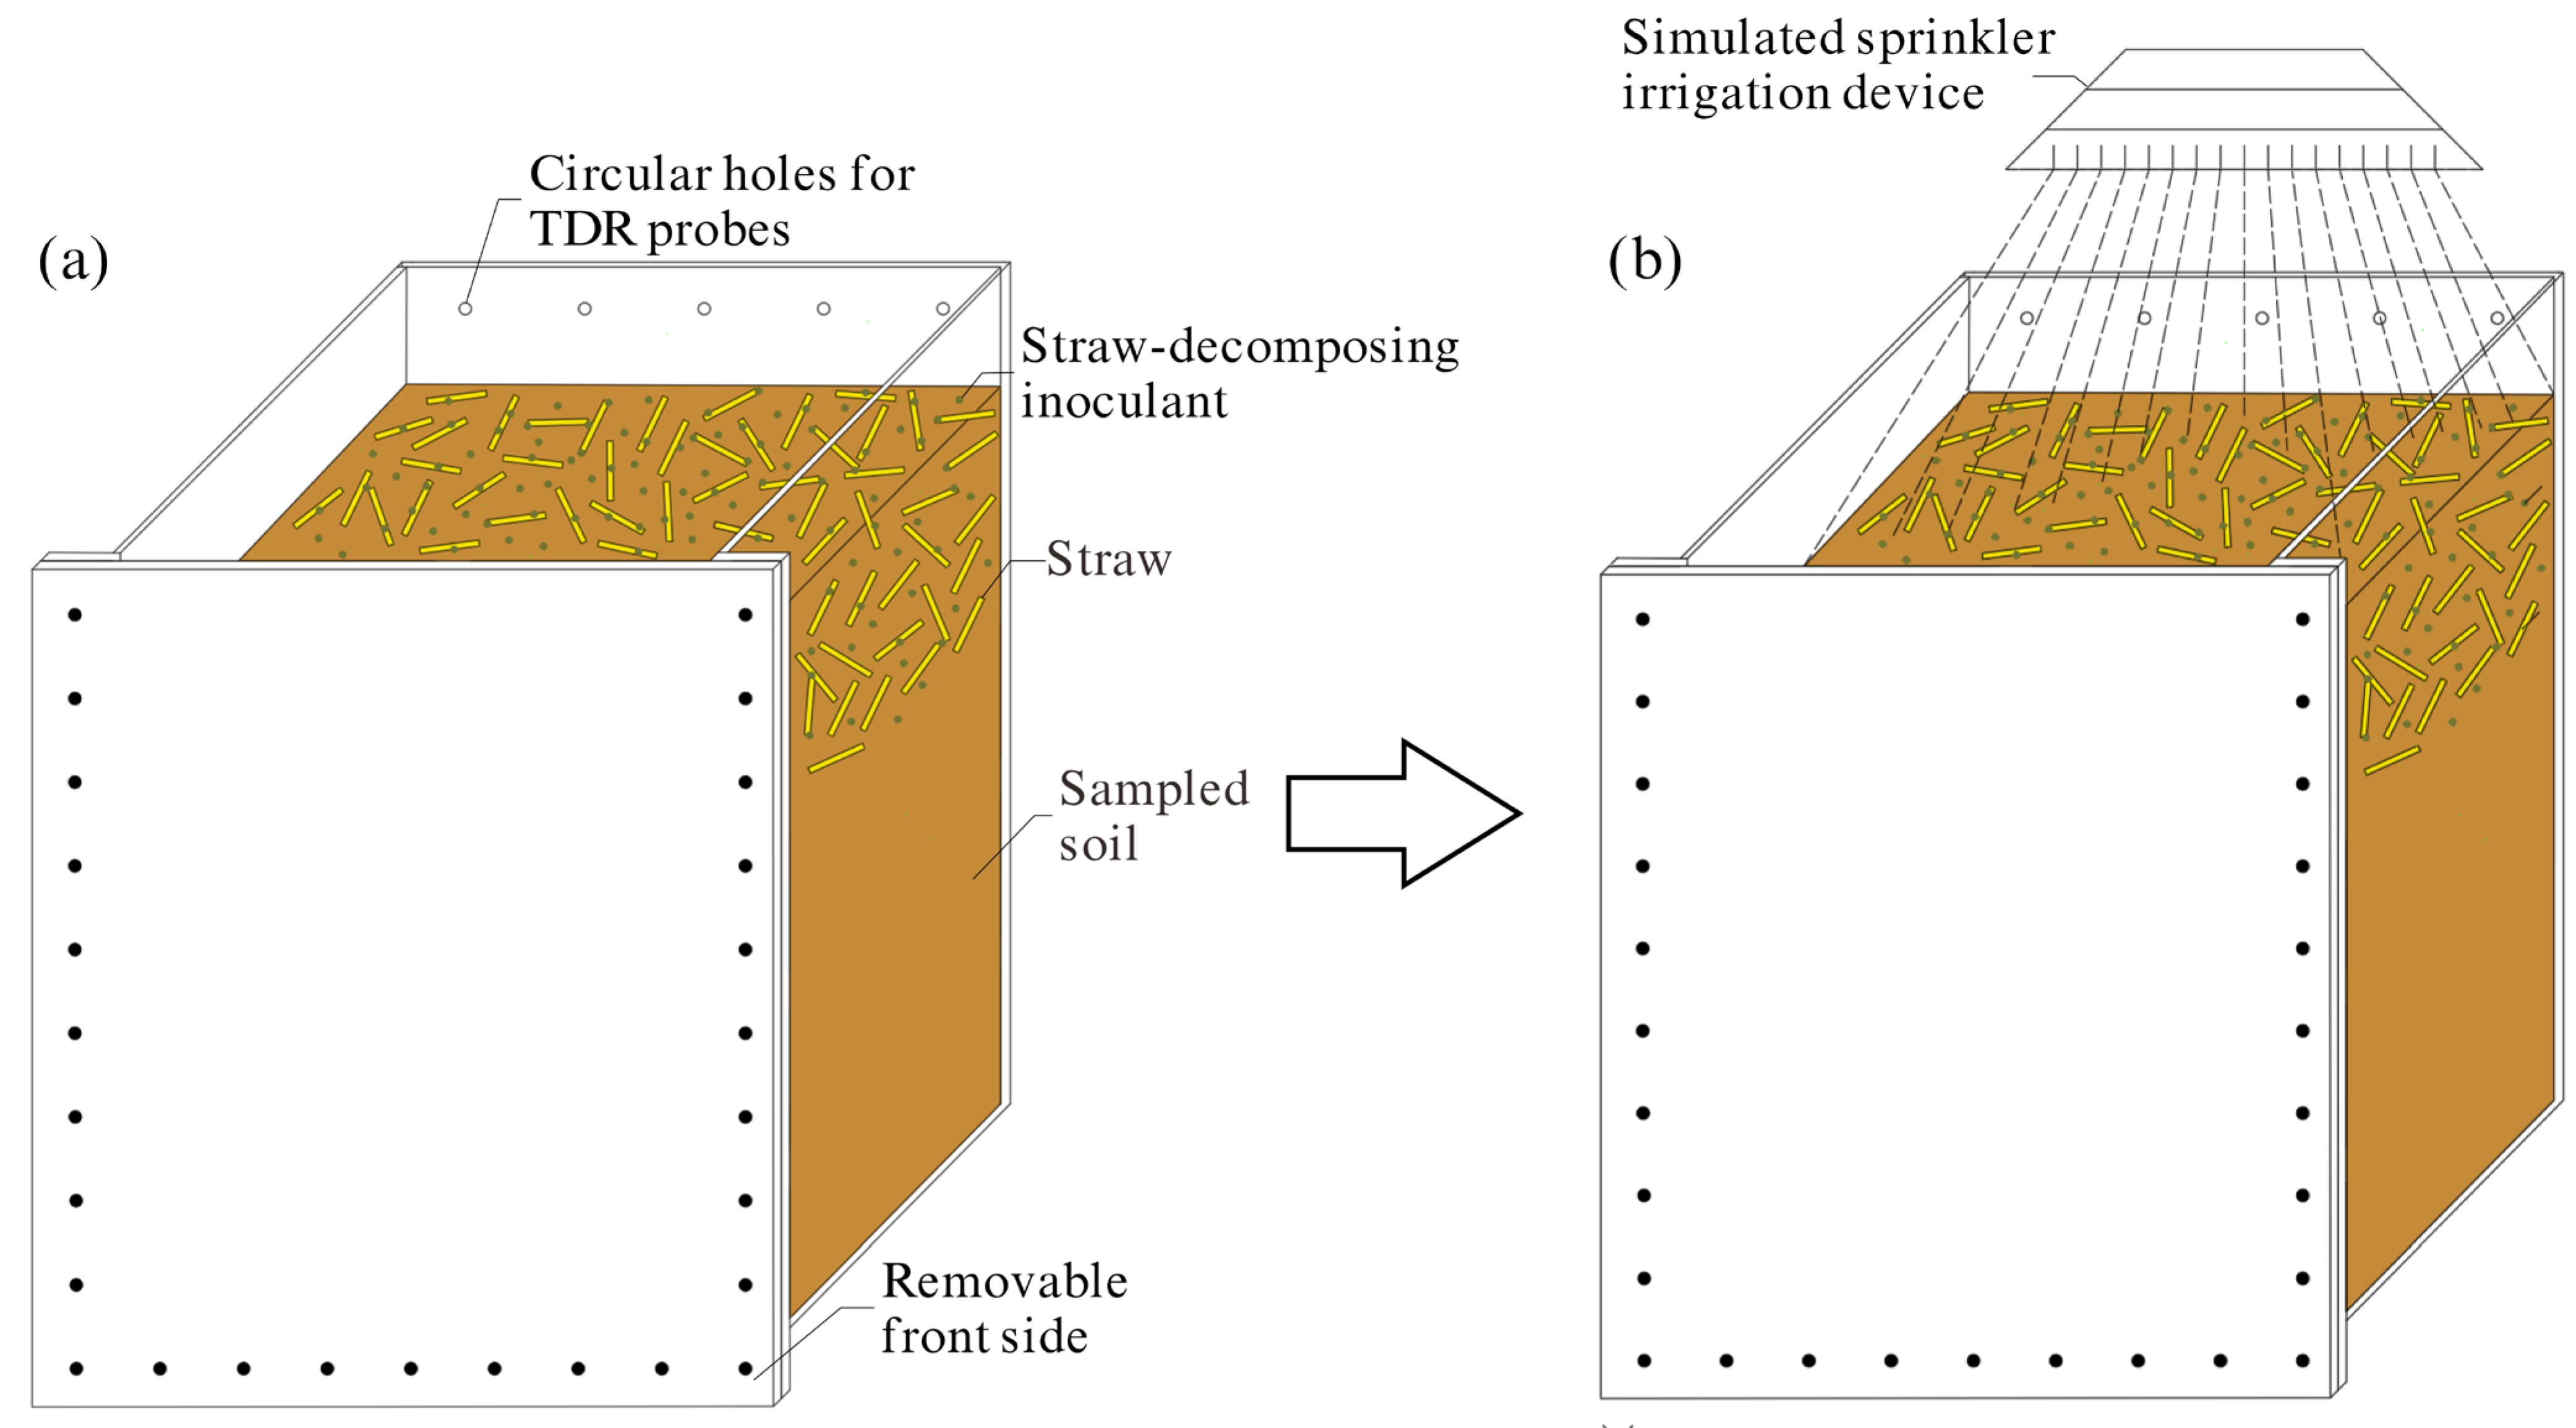
2.1.1. Experimental Setup and Treatments

This experiment was conducted in the experimental field at Jiangning Campus of Hohai University, Nanjing, eastern China (31°92′ N, 118°79′ E), which is sheltered from rain and has a northern subtropical monsoon climate. The long-term annual mean precipitation, evaporation, sunshine duration, and temperature in this region were 1051 mm, 900 mm, 2017.2 h, and 15.7 degrees Celsius, respectively. The sampled soil was first collected from the upper layer (0~20 cm) of clay loam (Supplementary Materials S1) in a dry field in which rice and wheat were cyclically cultivated and consisted of 43% clay (≤0.002 mm), 32% silt (0.002~0.02 mm), and 25% sand (≥0.02 mm). The soil properties were determined for disturbed samples (Table 1) (Supplementary Materials S2). The soil was sieved through a 5 mm aperture sieve to exclude impurities and then air-dried and stored under dry and well-ventilated conditions for later use (Supplementary Materials S3).
This study investigated the evolution of preferential flow characteristics during the straw decomposition process. The claimed straw was first collected in Nanjing after the early rice harvest in July and then air-dried, trimmed into 5 cm equal segments by guillotine, and stored under dry and ventilated conditions for later use. The experiment was developed with different straw application rates and decomposition time points. First, based on straw yield per unit of planted area in production, 4 straw application rate treatments were prepared as follows: (1) no straw addition (CK), (2) straw addition at a density of 5 t/ha (5 T), (3) straw addition at a density of 10 t/ha (10 T), and (4) straw addition at a density of 15 t/ha (15 T). The straw application rate was defined as the weight of straw per unit soil area with a homogeneous incorporation depth of 20 cm. Second, according to the growth cycle of different crops in production, 3 straw decomposition time points were designed as follows: (1) 0 days (0 d), (2) 60 days (60 d), and (3) 240 days (240 d). There were two identical specimens for each experimental treatment, and a total of 24 specimens were prepared for the experiment. The experiment apparatuses were square Plexiglas soil containers with an inner diameter of 0.5 × 0.5 × 0.7 m3, the front side of which could be removed for surveying the longitudinal profile and analyzing the dye-tracing pattern (The experiment was conducted with repacked samples due to limitations of the study site and only theoretically analyzed the straw as a factor. It is more reasonable to conduct experiments in situ with undisturbed soil in the field when conditions permit). Circular holes of 1.0 cm diameter were set at 10 cm intervals on the rear side of the container for deploying TDR (time-domain reflectometry, developed by the Institute of Agrophysics, Polish Academy of Sciences) probes to monitor the volumetric water content of the soil. The TDR equipment was calibrated for the experimental conditions studied. Prior to straw incorporation, we manually removed impurities, such as root weeds, from the sampled soil and then backfilled the air-dried soil into the container in layers (10 cm per layer) with an average soil dry bulk density of 1.25 g/cm3. After adding 4 layers of subsoil with a total height of 40 cm, we thoroughly mixed soil samples and the straw-decomposing inoculant with or without straw segments and homogeneously and subsequently filled the upper layers of the containers (Figure 1a). It was necessary to guarantee the same initial bulk density for each soil layer of each treatment to avoid initial differences in preferential flow patterns. The straw-decomposing inoculant was purchased from Zhengzhou Wangnongbao Biotechnology Co., Ltd. (Zhengzhou, China), and consisted of several microbial agents and compound enzymes. The practical element was Bacillus subtilis with limited water-absorbing capacity, and the usage was accurately based on the product description. Small nylon mesh bags containing sampled straw and soil were also backfilled into the specimens to facilitate later measurements of the decomposed proportion. The surface of each layer was roughly scrubbed before filling in the subsequent layer to eliminate unexpected soil discontinuity and ensure the homogeneity of soil hydraulic properties between layers. To avoid initial variances in macropore structure and hydraulic characteristics, essential precautions were taken when backfilling to ensure the consistency of dry bulk density inside and outside the straw domain (Supplementary Materials S4).
After backfilling, the soil was entirely moistened with a simulated sprinkler irrigation device (Figure 1b). The soil moisture and temperature were maintained at approximately 80% of the field capacity [25] and 5~35 °C [26], respectively, and under these conditions, the Bacillus subtilis activity and straw decomposition efficiency were greater. Field capacity varies with straw incorporation and decomposition. Therefore, we kept the moisture content at 80% of the initial soil field capacity, which was approximately 20%. The experiment began in July 2022 and ended in March 2023 (a period with an average high temperature of 21 °C and low temperature of 11 °C) with current-season straw following the early rice harvest. The volumetric water content of the sampled soil was regularly measured via TDR without disturbance. Additionally, proper irrigation and weeding were fundamental until the end of the experiment (Supplementary Materials S5).

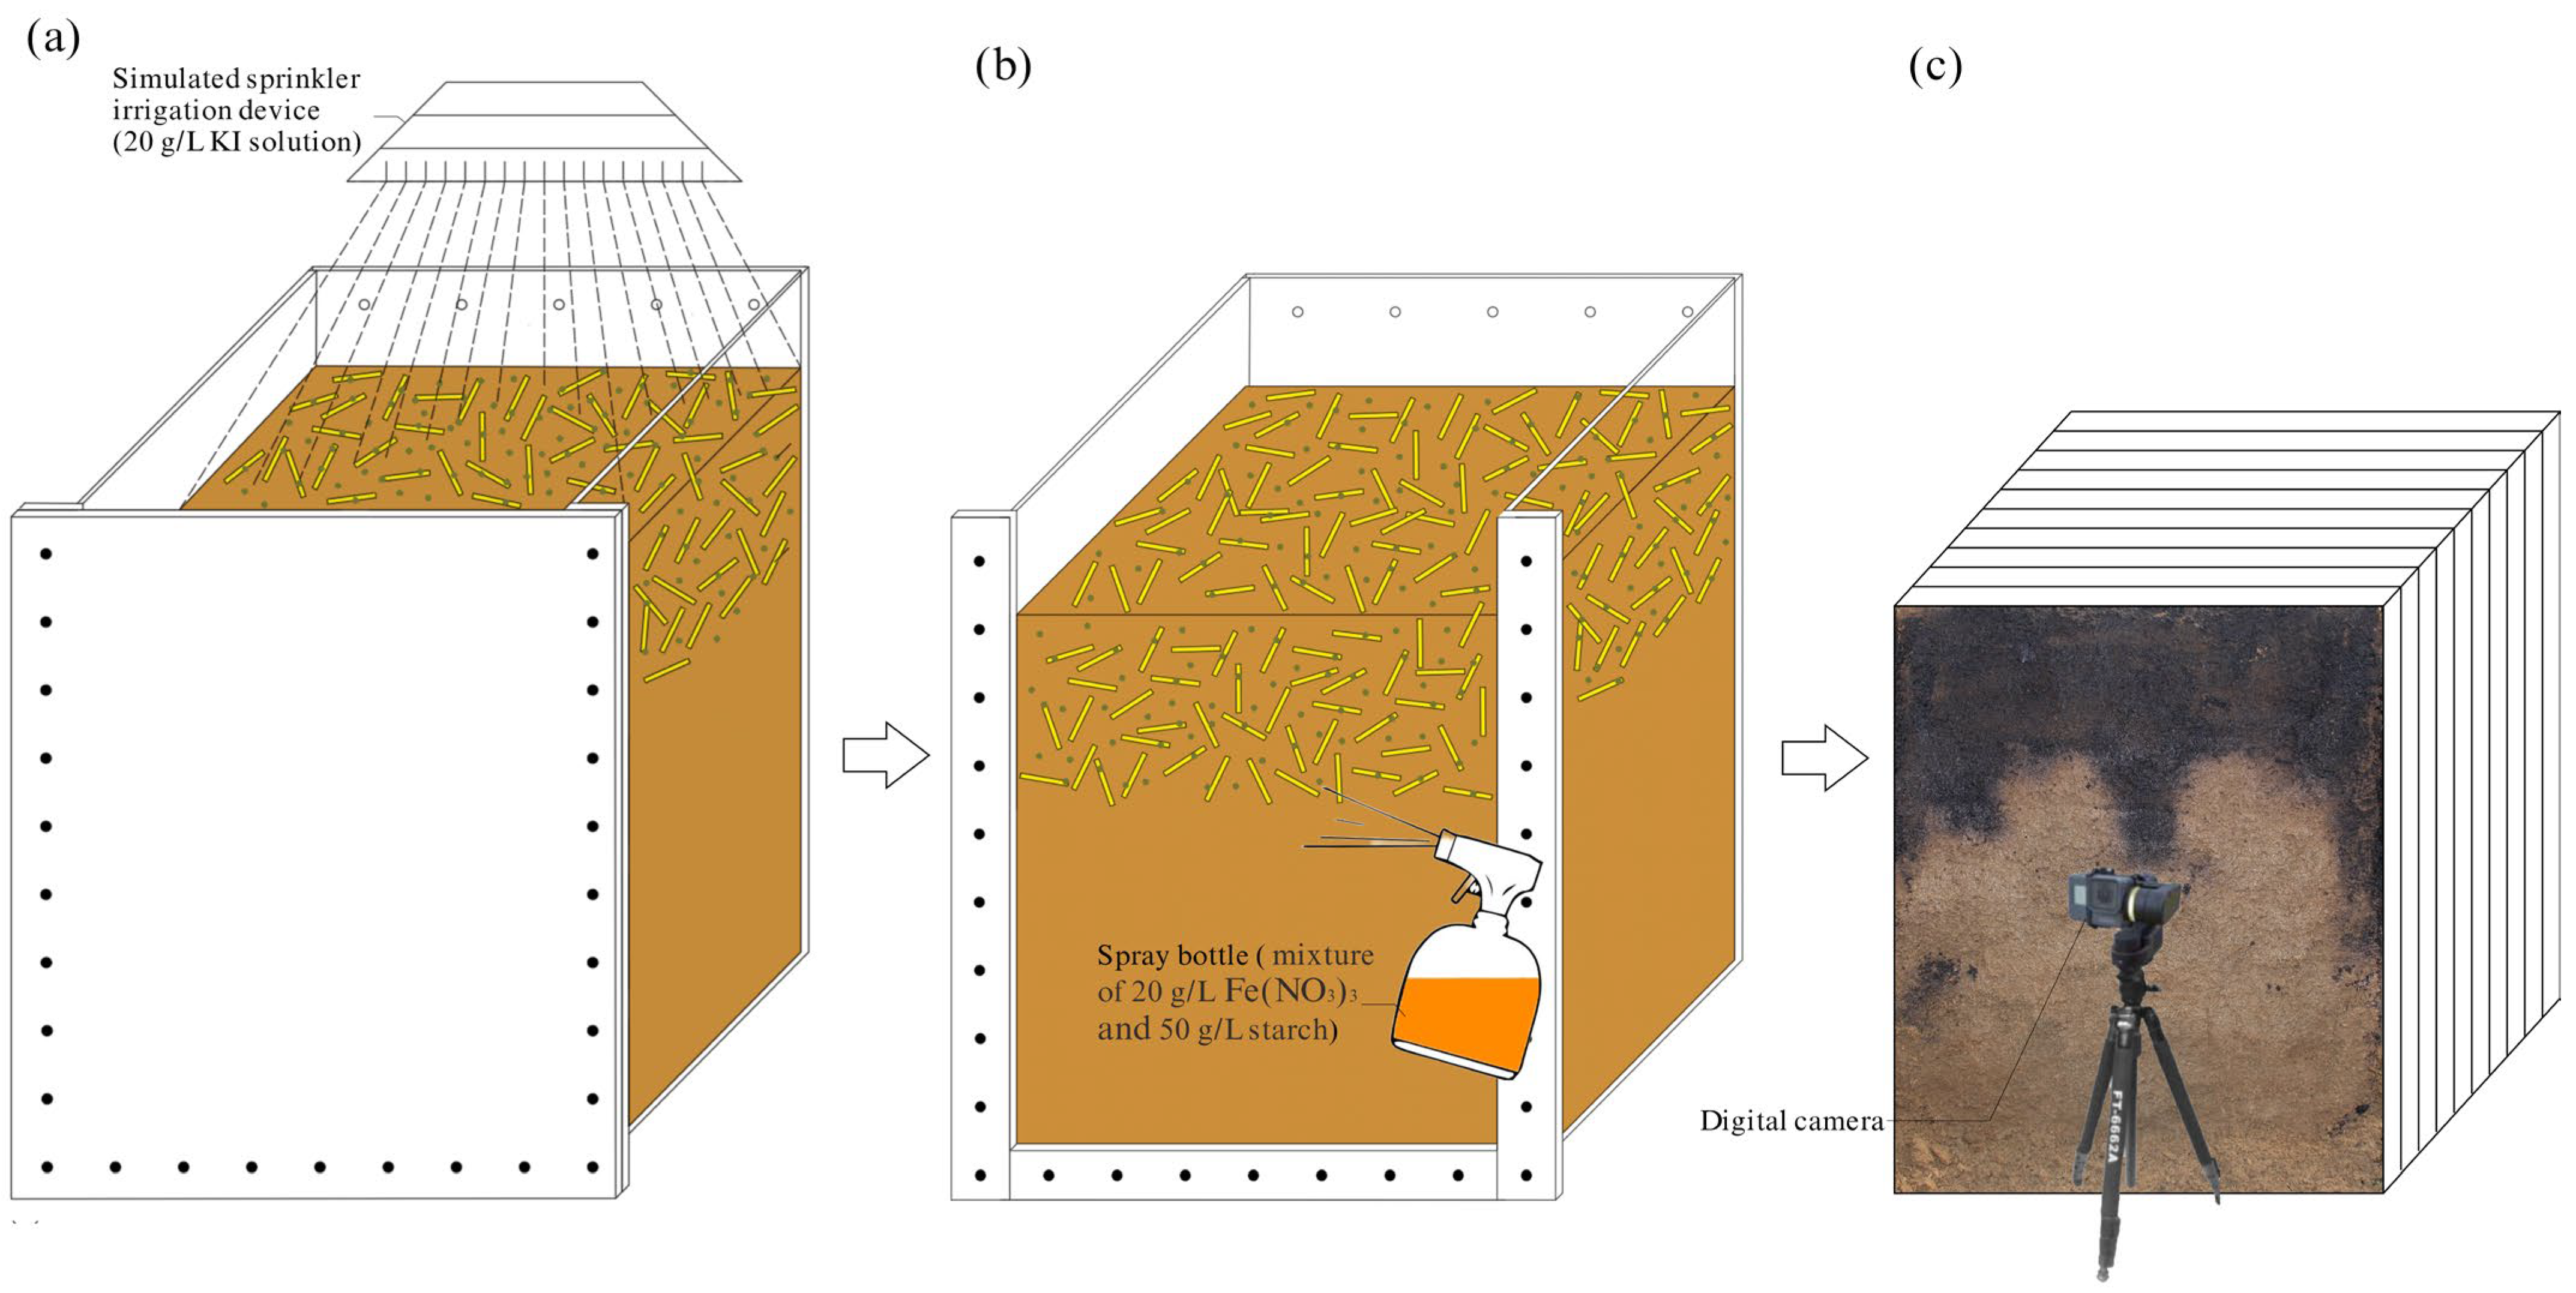
2.1.2. Experimental Processes

The potassium iodide-starch dye-tracer technique in combination with longitudinal profile analysis was used to observe the preferential flow characteristics. The experiment was conducted at an initial average moisture content of 20% in the designed moist soil depth, and all specimens exhibited uniform moisture distribution over their depth. The specimens were irrigated with a quota of 50 mm containing a potassium iodide KI tracer with a mass concentration of 20 g/L (Figure 2a). Since the charge of I in the irrigation water was the same as the outer soil particles, it could not be absorbed by the soil. Then, 24 h after irrigation, the specimens were longitudinally dissected at 5 cm intervals in sequence, and each profile was sprayed with a mixture of iron nitrate Fe NO 3 3 (mass concentration of 20 g/L) and starch (mass concentration of 50 g/L) (Figure 2b). The trivalent iron ion Fe 3 + , which is a potent oxidizing agent, can oxidize I of irrigation water to iodine molecule I 2 , which then reacts with soluble starch to form an indigo substance. Thus, the moisture transport pattern could be traced. Each profile was photographed with a Canon EOS 60D camera (manufactured by Canon Inc. in Tokyo, Japan and purchased from official sales channels) 20 min after spraying (Figure 2c). At the end of the experiment, the remaining straw was collected from the nylon bags and washed, dried, and weighed to calculate the decomposed proportion of straw in each specimen. The moisture content of the designed moist soil depth, average bulk density, porosity, and field capacity were also measured or calculated.

2.2. Measurement Indices and Methods

(1) Soil bulk density and field capacity were measured using the cutting ring method (Supplementary Materials S6, Supplementary Materials S7, Supplementary Materials S8).
(2) Soil moisture content was measured using the weighing method for both unfilled and dissected soil and using TDR the rest of the time.
(3) Straw decomposed proportion:
R d = W i W f W i × 100 %
where W i is the initial straw dry mass and W f is the dry mass of the remaining straw after the experiment.
(4) Soil porosity:
n = 1 ρ d ρ w · G s × 100 %
where ρ d is the density of naturally dried soil, ρ w is the density of water at the same temperature, and G s is the specific gravity of soil.

2.3. Image Processing and Preferential Flow Parameterization

First, the initial photographs were imported into the ERDAS IMAGINE 2014 software for geometric correction. Then, the processed images were processed with Photoshop 2022 to eliminate the irrelevant parts (Supplementary Materials S9). To eradicate the boundary effects, the leftmost and rightmost 5 cm of the profiles were considered protective layers and not subjected to subsequent analysis. Furthermore, classification templates were created using ERDAS IMAGINE 2014 and area delineation, noise reduction, and rasterization correction were completed to obtain binary images containing only 0 and 255 values (Figure 3). As no spatial inconsistencies existed in the initial state, the differences in the dyed patterns could fully illustrate the effect of straw on the soil preferential flow. Ultimately, the following indicators were calculated and analyzed with MATLAB R2022a software:
(1) Matrix flow depth D (cm) is defined as the depth from the upper surface of the profile to the z layer, above which the dyed proportion of each layer is no less than 95%.
R dye z = z Δ z z + Δ z 1 N β x , z 2 Δ zN D = z λ
where z is a row number in the z direction of the profile pixel image, β x , z is the assigned value at any position (x, z) on the profile, when not dyed β x , z = 0 and when dyed β x , z = 1, N is the total number of profile pixel image columns, λ is the conversion coefficient for converting pixels to dimensions and taken as 60 pixel/cm.
(2) Preferential flow coefficient R pf is defined as the ratio of the preferential flow area to the profile dyed area and is estimated as:
R pf = A dye L N D A dye
where A dye is the area of the dyed part of the profile (cm2) and LN is the corresponding column width of the pixel image (cm), whose value equals the number of columns multiplied by λ.
(3) Maximum depth of infiltration H M (cm) refers to the maximum depth of the dyed solution’s infiltration. The depth of infiltration H 1 x at any point (x, z) on the profile can be expressed as:
H 1 x = λ z = 1 M β x , z H M = m a x H 1
where M is the total number of profile pixel image rows.
(4) Dyed coverage R dye z , which is commonly used for macropore or crack flow, quantifies the depth of soil dyed between different layers, describes the vertical dyed uniformity, and can be expressed as:
R dye = z Δ z z + Δ z i N β x , z 2 Δ zN × 100 %
(5) Dyed area proportion (%), which refers to the proportion of the dyed portion area to the whole profile, describes the moisture volume and movement of the profile, and can be expressed as:
R C = A dye A t

2.4. Irrigation Quality Evaluation Indices

Common indices for evaluation of irrigation quality include irrigation uniformity, irrigation efficiency, and irrigation storage rate.
(1) Irrigation uniformity E u reflects the uniformity of the distribution of dyed areas. The estimation equation is:
E u = 1 Δ H H - × 100 % Δ H = i N H 1 x H - N H - = 1 N i N H 1 x
where H - is the average depth of infiltration in the profile (cm).
(2) Irrigation efficiency E a characterizes the degree of effective utilization of irrigation water. The estimation equation is:
E a = V s V × 100 %
where Vs is the moisture stored in the designed moist soil depth after irrigation and V is the total water irrigated.
(3) Irrigation storage rate E s is the proportion of moisture stored in the designed moist soil depth after irrigation to the total water needed to intentionally wet the soil prior to irrigation, i.e.:
E s = V s V n × 100 %
where Vn is the total water needed to intentionally wet the soil prior to irrigation.
(4) The overall evaluation index of irrigation quality E m refers to the geometric mean of the indices above, i.e.:
  E m = E u × E a × E s 3 × 100 %

2.5. Statistical Analysis and Methods

SPSS 27 was adopted for statistical analysis. One-way ANOVA was used for the variance analysis, and multiple comparisons were performed via LSD with a significance level of 0.05. The error bars in the graphs refer to standard deviations.

3. Results

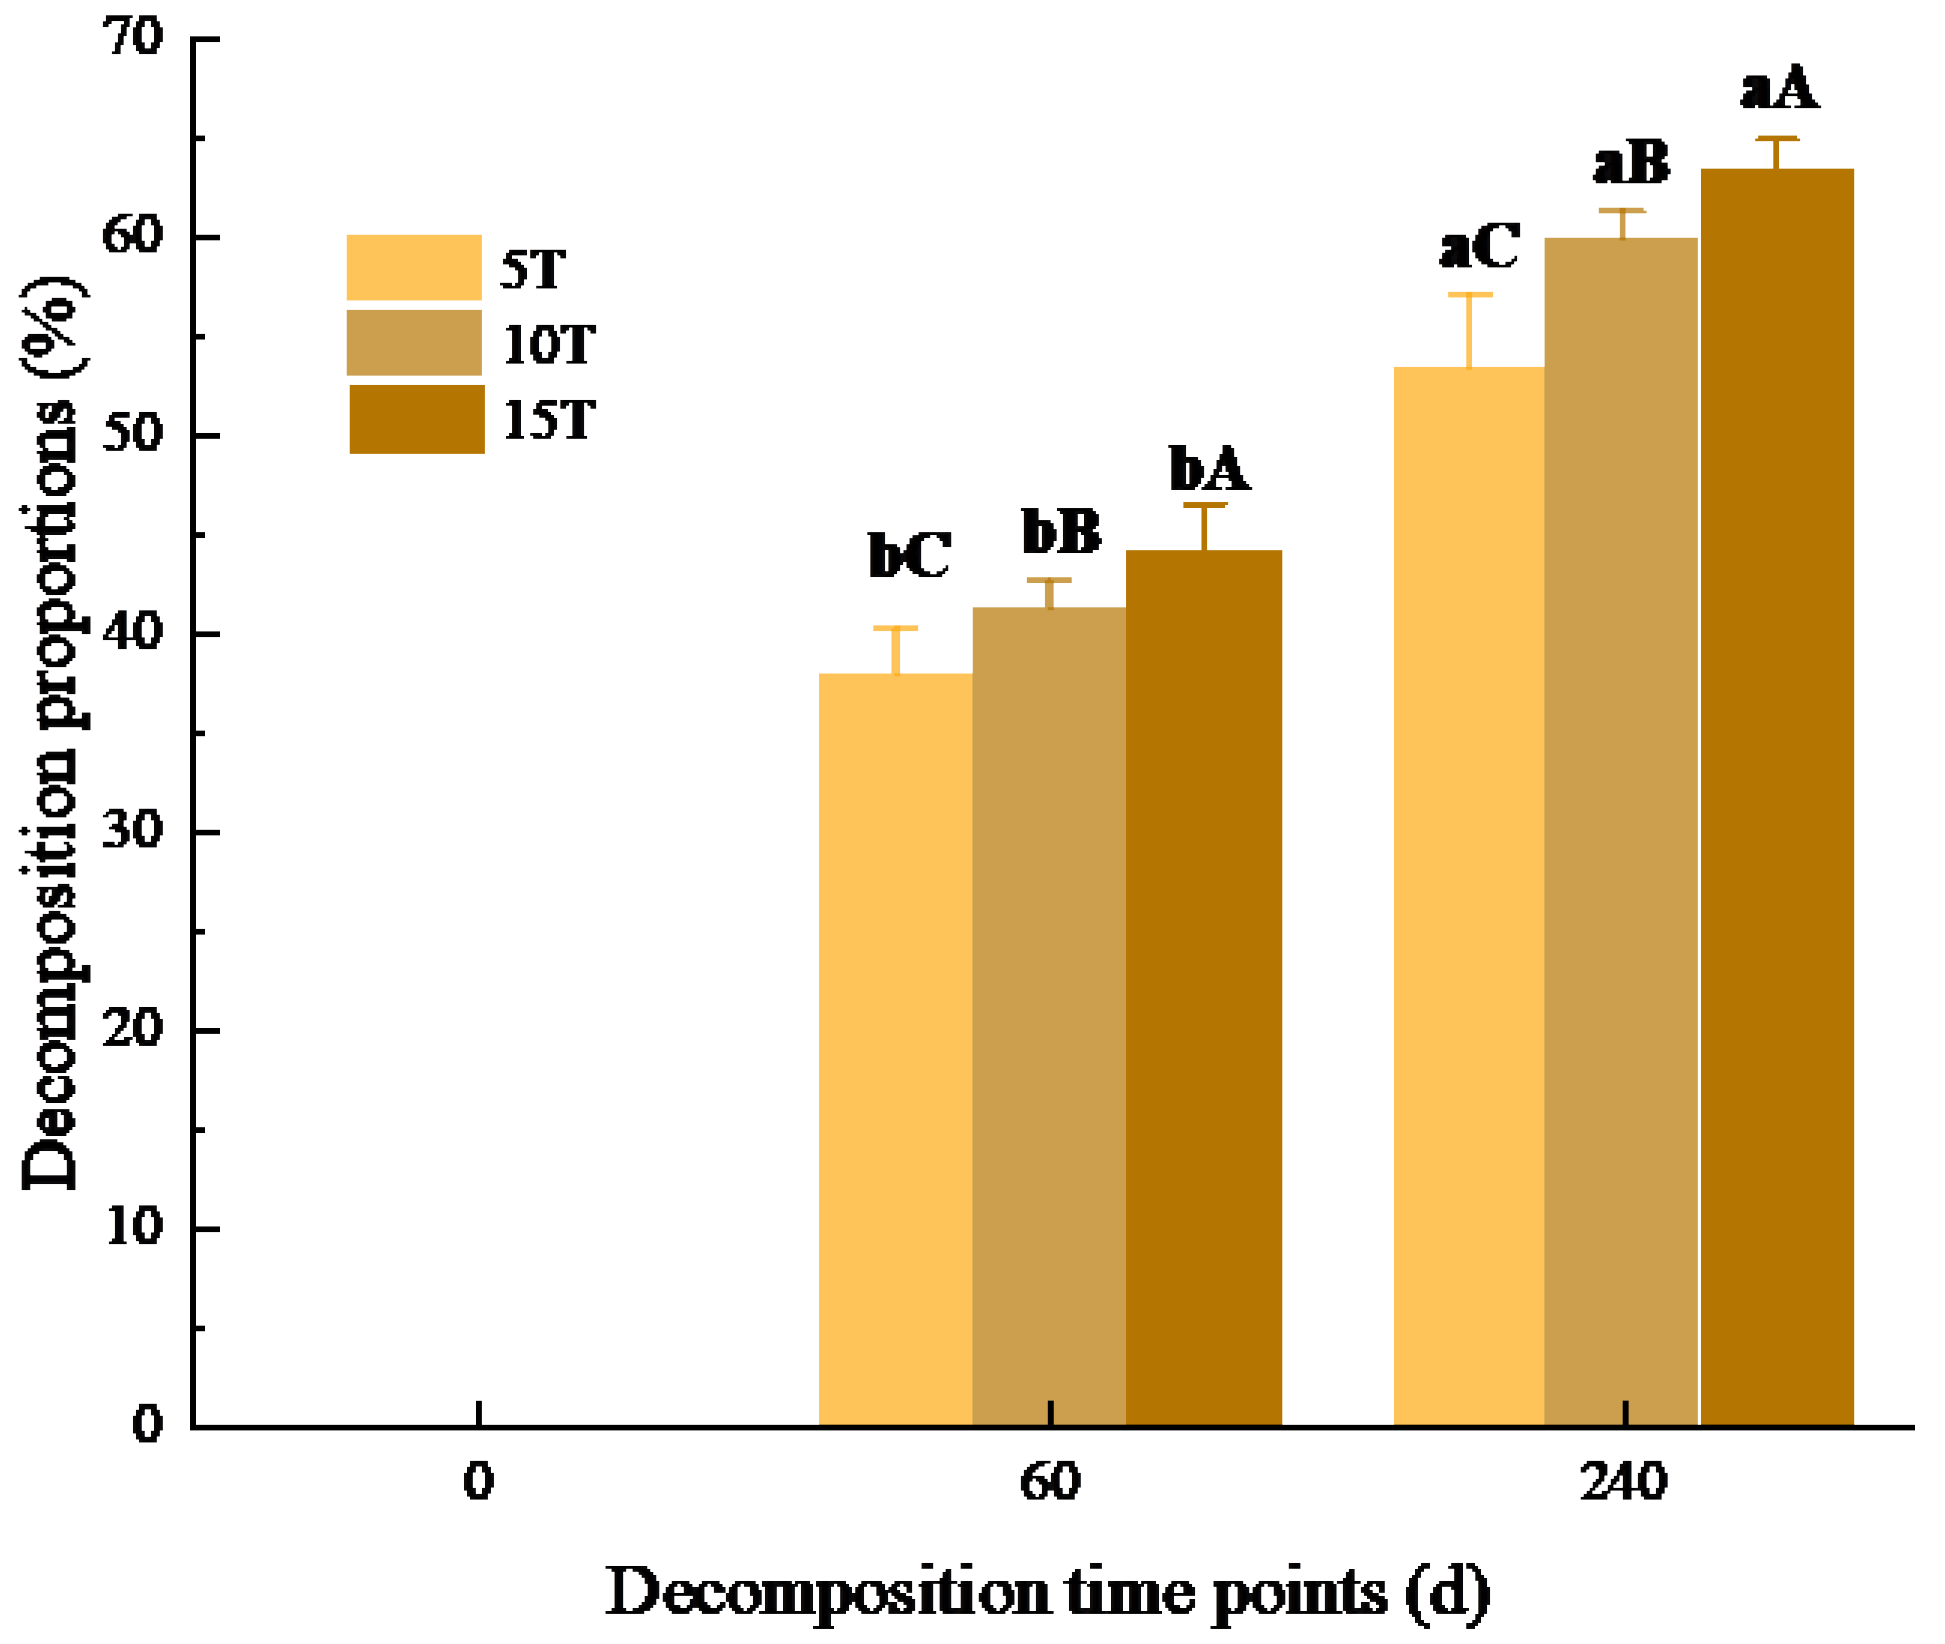
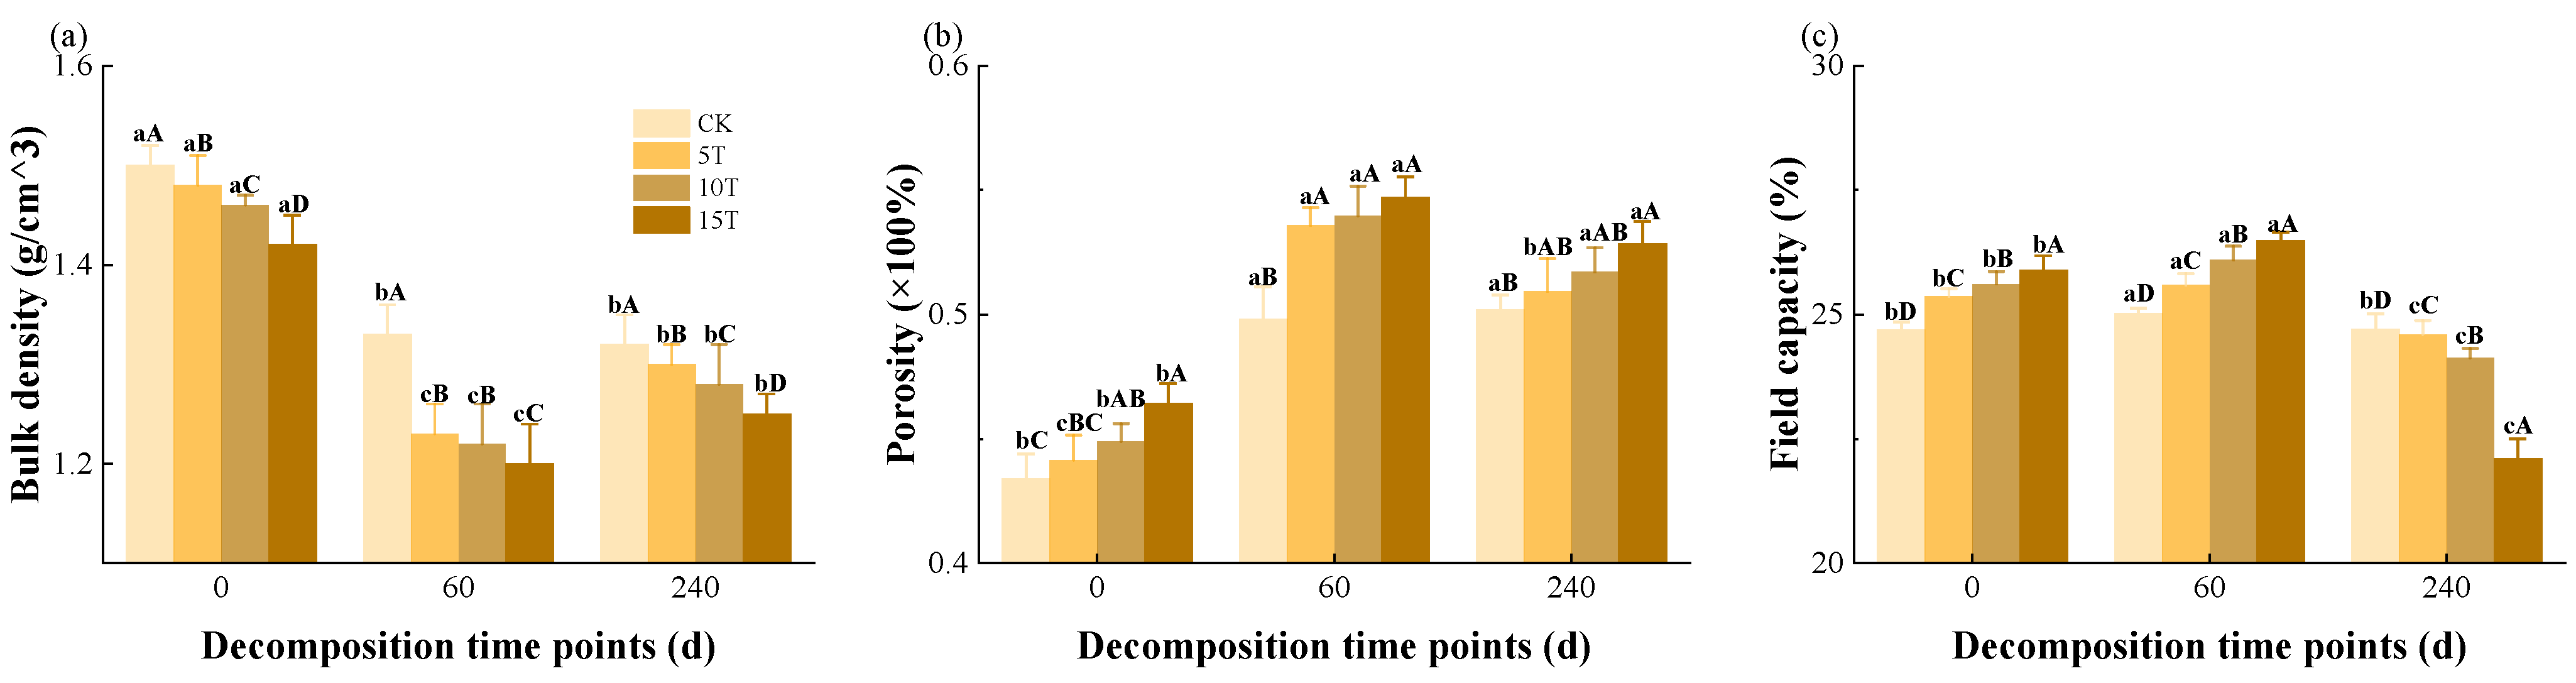
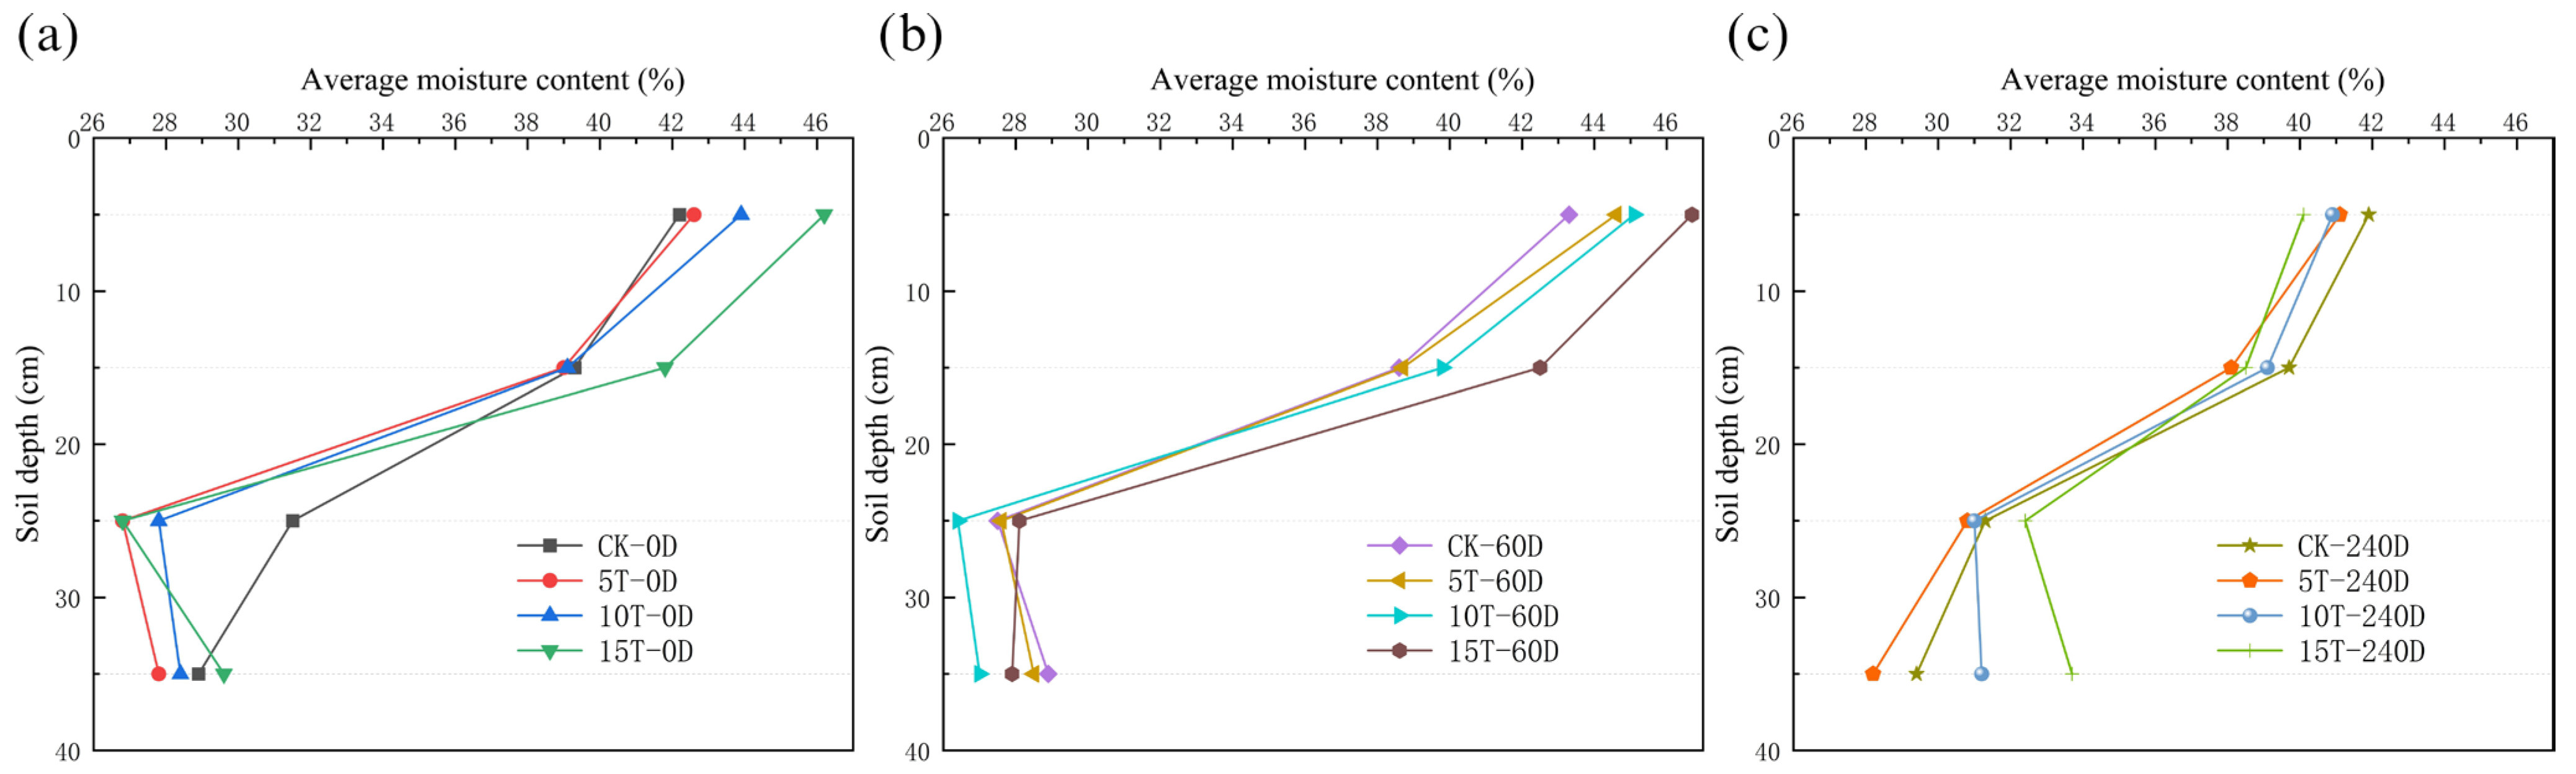
3.1. Decomposition Process and Evolution of Soil Properties

The proportions of decomposed straw for varying straw application rates and decomposition time points are depicted in Figure 4.
The decomposed proportions were pronouncedly different between 60 and 240 d. From 0 to 60 d, the decomposed proportions were approximately 40% compared with approximately 20% from 60 to 240 d. In addition, the decomposed proportions tended to increase with an increasing straw application rate.
Pores are reservoirs for soil moisture. Accordingly, porosity characterizes the saturated moisture content of the soil. The results in Figure 5a indicate that the soil bulk density exhibited a downward trend as time elapsed in the early stage, while porosity and saturated moisture content increased with straw incorporation (Figure 5b). The effect was more noticeable with higher rates of straw application, and this phenomenon is analogous to the findings of Zou et al. [27]. The aforementioned phenomenon might be amplified after 60 d of straw decomposition. However, reduced porosity and an increasing bulk density were manifested after 240 d. The soil settlement after multiple wet-dry cycles might account for this unexpected finding. The order of initial field capacity with straw incorporation was: 15 T > 10 T > 5 T > CK, which followed the same magnitude order as porosity (Figure 5c). Hence, incorporated straw helped improve soil moisture storage capacity, and the effect became more considerable with a higher rate of straw incorporation. The field capacity first increased and then decreased during the decomposition process. Ultimately, the order of field capacity became CK > 5 T > 10 T > 15 T.

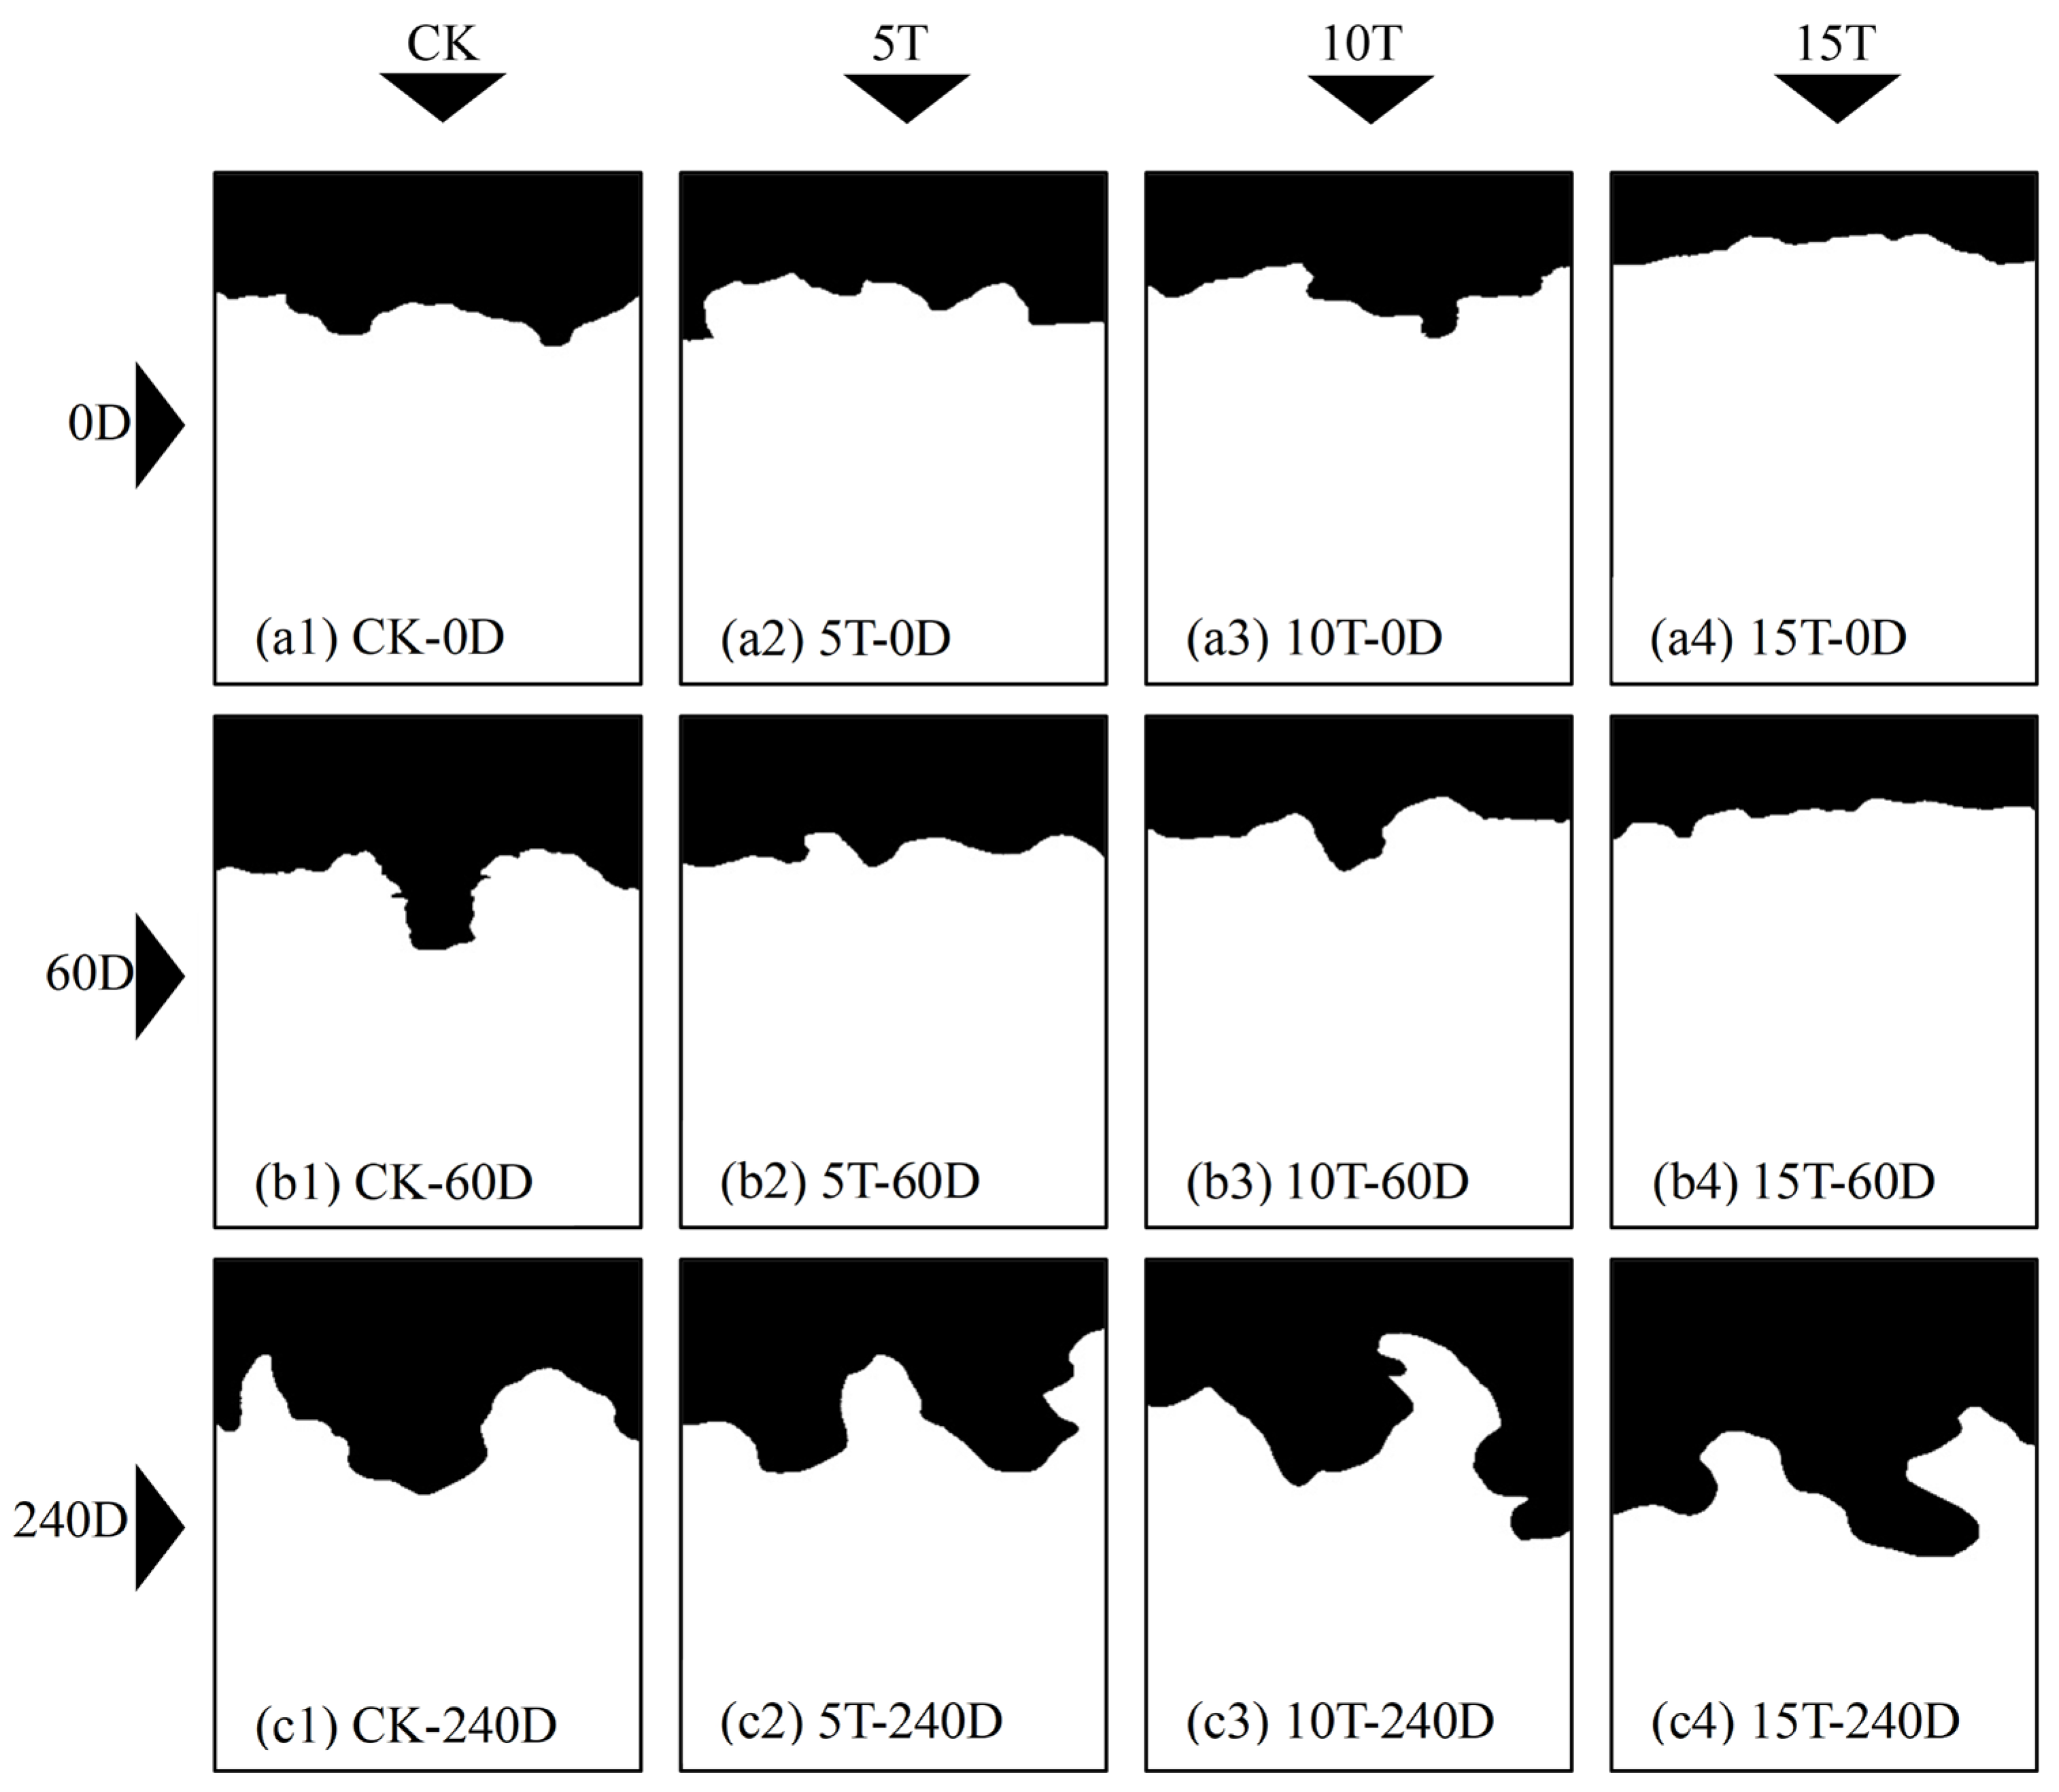
3.2. Preferential Flow Patterns in Different Decomposition Processes
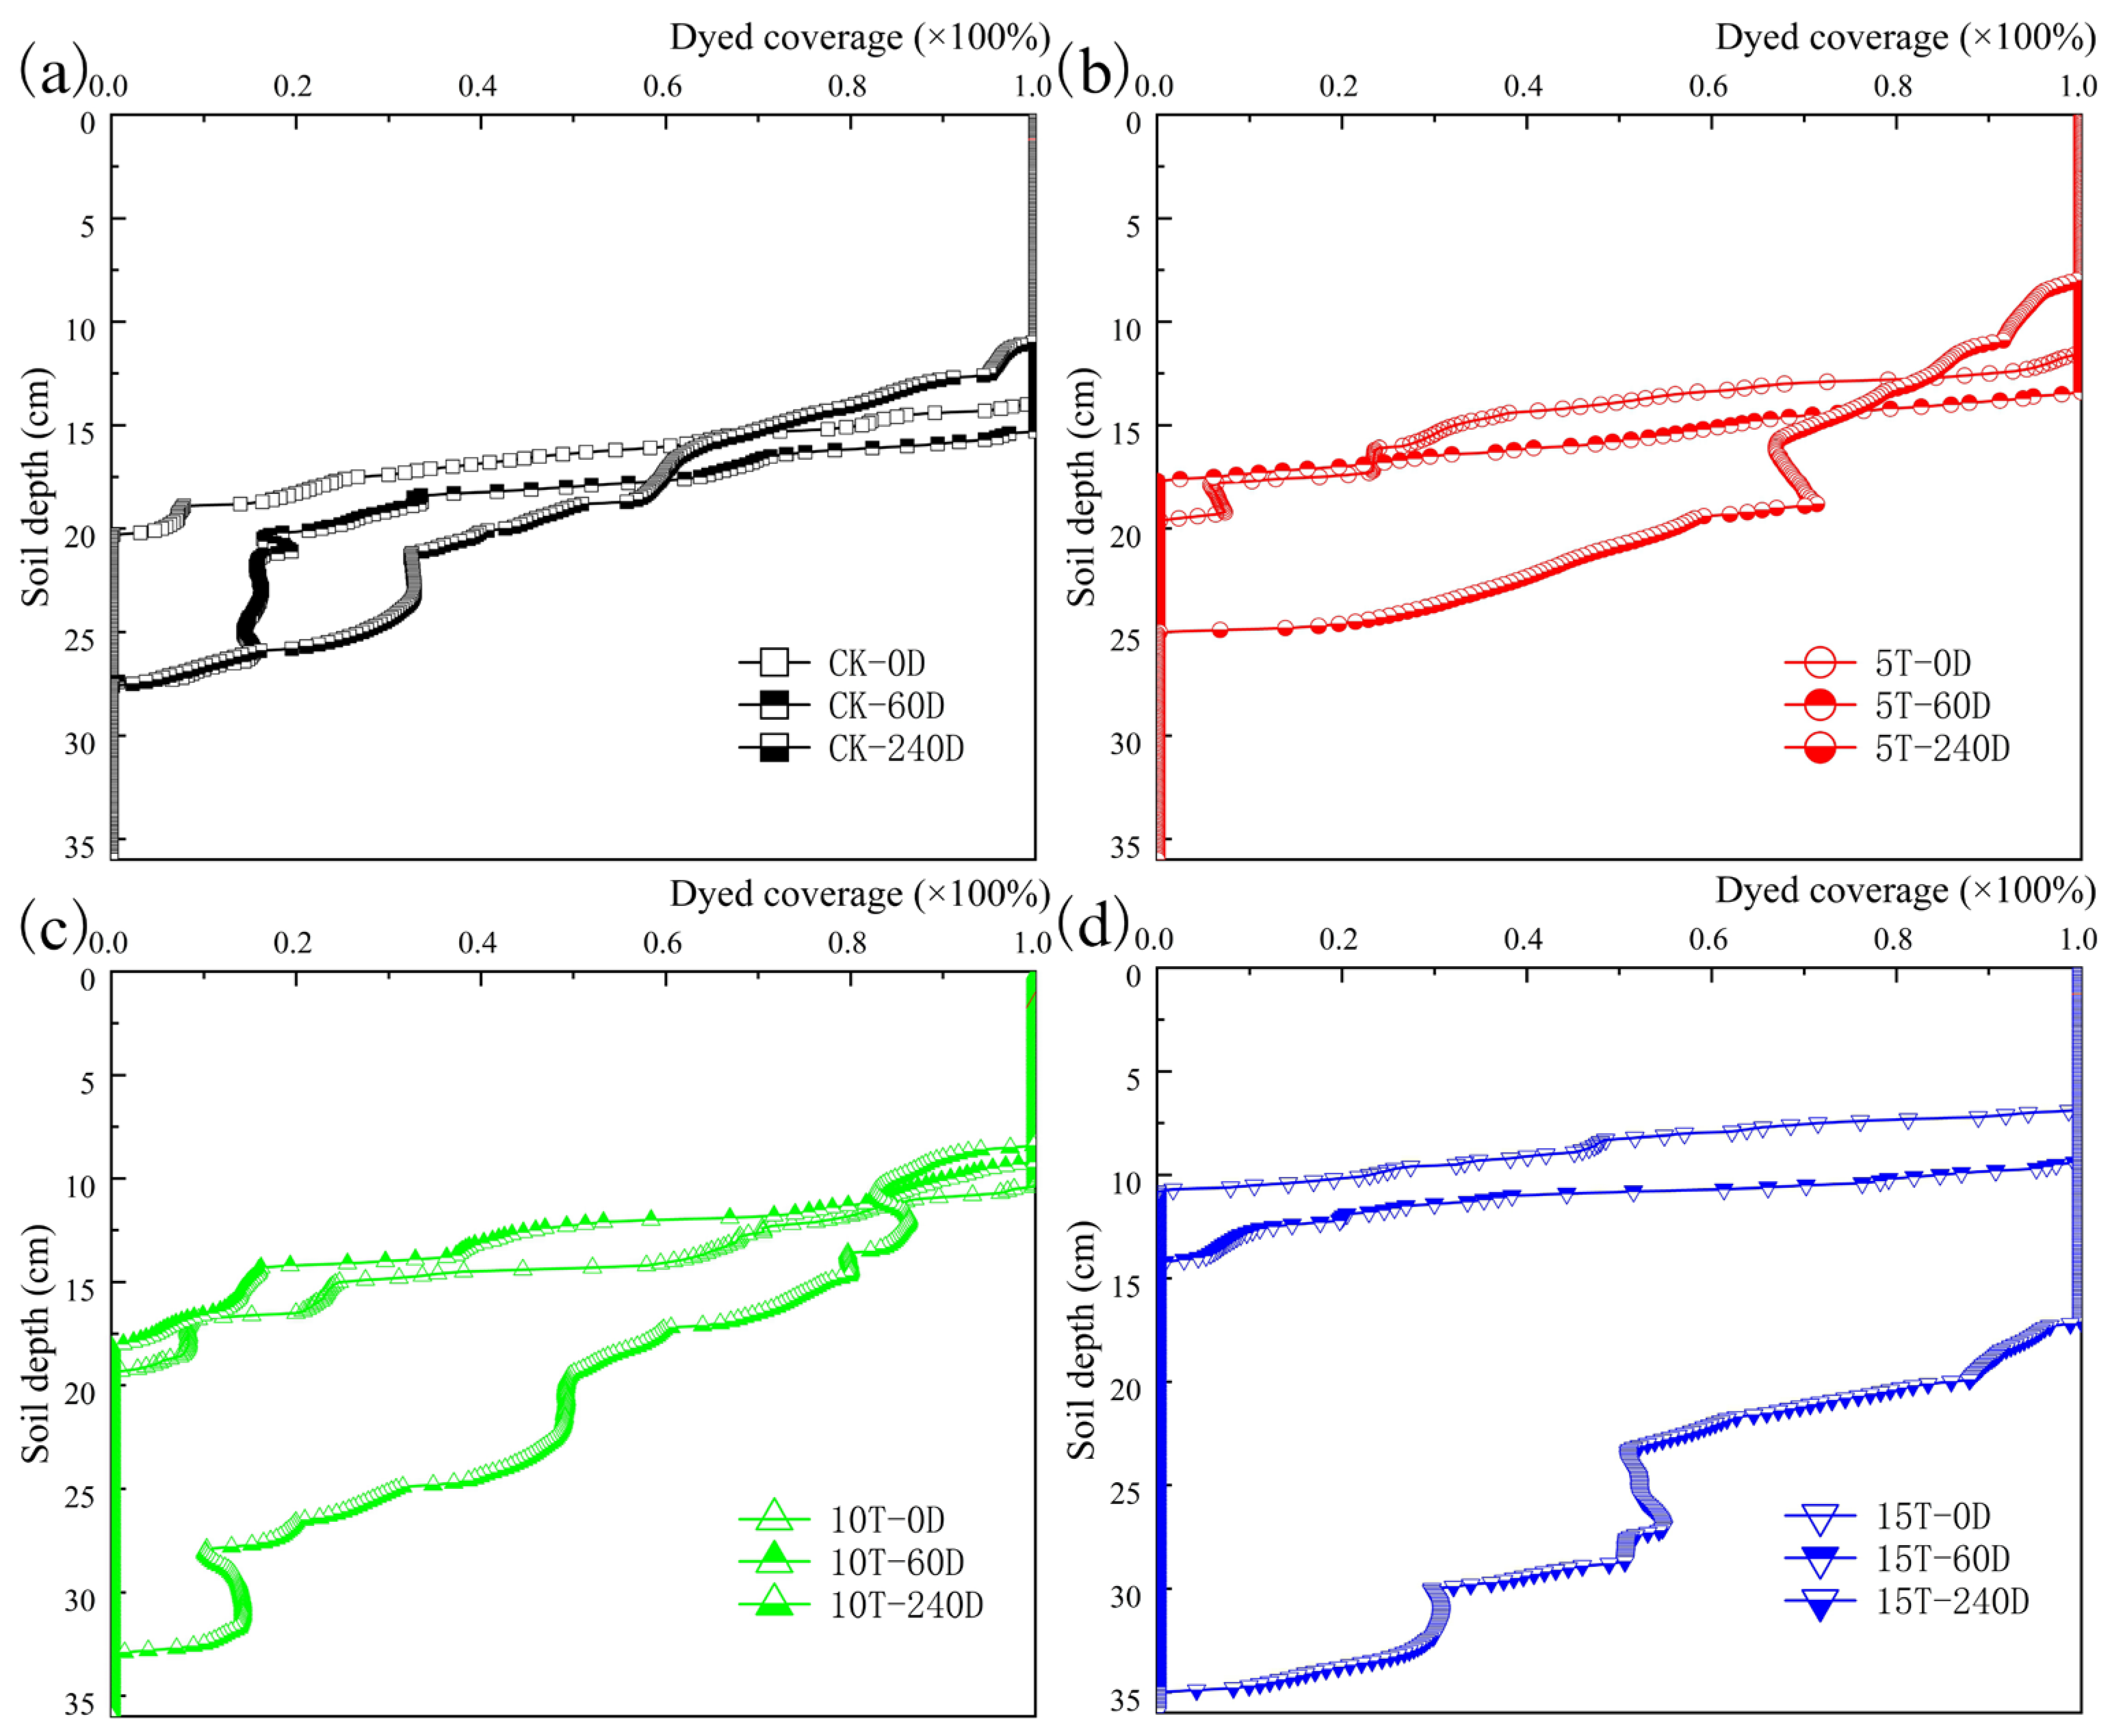
Soil samples from different depths of the soil layers were collected in aluminum boxes when sectioning longitudinally, and the average moisture content was measured to draw a curve that correlated with soil depth (Figure 6).
Soil moisture content reflects cumulative moisture infiltration and moisture storage capacity. In the 0 and 60 d treatments, the moisture content of the upper soil in the experimental group was higher than that of the control group. In comparison, in the 240 d treatments, the moisture content of the upper soil in the experimental group was lower than that in the control group, which indicated that straw decomposition promoted soil moisture storage at the early stages but inhibited it at the late stages.
A total of 240 dyed longitudinal profile images were obtained in the experiment. For analysis of the spatial distribution and movement of preferential flow, the proportion of the dyed area in each image was compared with the mean value of that particular treatment, and the most typical of each treatment was selected (Figure 7). Spatial development was analyzed by preferential flow evaluation indices, which were obtained from all dyed images. The fractal dimensions of the wetting front were calculated using Image J 1.8 (Table 2).
As shown in Figure 7, the dyed area, which indicated the range of the soil moisture movement, was comparatively small after 0 and 60 d, and decreased with increasing straw application rates. The 240 d dyed profiles showed a different trend. In the process of straw decomposition, the spatial distribution range of preferential flow expanded as time elapsed. The wetting fronts of the 0 and 60 d dyed profiles were relatively smooth, and the dyed portions showing the preferential flow were either finger patterned or shallow, narrow, and strip-shaped. Moreover, the preferential flow movement was more concentrated, mainly in the form of perpendicular downward nonuniform flow with fewer lateral transport pathways. In contrast, the dyed portions showing the preferential flow in the 240 d images appeared as deep and extensive clumps with more transport channels and dispersed movement. The fractal dimension values of the wetting front were maximized at 240 d. Additionally, greater tortuosity of the wetting fronts and more active lateral movement could also be observed. Wildly separated dyed clumps indicated poor integrity and connectivity of soil moisture movement and further illustrated the low intensity of the preferential flow’s spatial movement. In general, during straw decomposition, the spatial movement of preferential flow evolved from concentration to dispersion and from stability to instability.
After 240 d of straw decomposition, the dyed area of the experimental group promptly increased and reached the maximum, indicating that there were more soil moisture transport pathways and more fully developed preferential flow (Figure 8a). After a modest change in the preferential flow coefficient at 60 d, there was a conspicuous increase at 240 d, which indicated that preferential flow entered the stage of rapid development after 60 d (Figure 8b). In the control group, the maximum infiltration depth remained stable after a significant increase at 60 d. In the experimental group, there was a mild change in the maximum infiltration depth at 60 d and a prominent increase at 240 d, which indicates that incorporated straw delayed the longitudinal development of preferential flow (Figure 8c). Meanwhile, a more extensive index error value at 240 d was indicative of distinct heterogeneity of soil moisture transport and unstable spatial evolution of preferential flow. The matrix flow depth of all treatments generally reached its minimum value after 240 d of decomposition, indicating that preferential flow developed from a shallower depth after 240 d (Figure 8d). In other words, the presence of straw retarded the development of preferential flow, which evolved rapidly after 60 d and exhibited an earlier, fuller, and more unstable development after 240 d. Straw hindered moisture migration during the initial phase of decomposition, and the soil retained more moisture with less preferential flow. In contrast, straw promoted moisture migration and preferential flow movement at the later phase of decomposition. The matrix flow depth of the 15 T group was approximately 19 cm at 240 d, which was close to the depth of straw return and indicated that after a long period of straw decomposition under a high application rate, soil moisture was mainly transported in the form of a matrix flow regime within the layer incorporating straw and in a preferential flow regime below that layer. This might be because even in the later stages of high-density incorporated straw decomposition, there was a large amount of undecomposed straw, which still inhibited preferential flow.

3.3. Dyed Coverage

The dyed coverage rates of soil layers of different depths at different decomposition time points were calculated for all the dyed images, and curves were drawn corresponding to soil depth (Figure 9).
According to Figure 9, as time elapsed, the curve progressively shifted downward and became steeper with a larger amplitude of fluctuation, indicating deeper and more fully developed preferential flow, more uneven moisture infiltration, and more prominent heterogeneity of soil. At 0 and 60 d, the curve of the CK group lay below those for the straw addition treatments, while the curve of the 15 T incorporation group was at the top (Figure 9a,b). In the CK group after 60 d of decomposition, a “steep change” phenomenon occurred at the end of the curve beneath a soil depth of 20 cm (defined starting and ending points as dyed coverage of 1.0 and 0.0, respectively), which was distinct from all the experimental groups. This phenomenon corresponded well with the large and concentrated dyed cluster in the corresponding dyed image in Figure 7(b1). Accordingly, after 60 d of wet–dry cycles, the preferential flow was already discernible in the absence of straw, and the incorporated straw helped alleviate the effect. This elucidated that the straw incorporated during the early stage of decomposition played a role in moisture storage and inhibition of preferential flow, and this effect was more pronounced with a larger density of incorporated straw, which corresponds to the preceding analysis and the study by Wu et al. [6]. At 240 d, the curve of the CK group was at the top of the graph, while the curve of the 15 T group was at the bottom, opposite to the results at 0 and 60 d (Figure 9c). This indicates that the incorporated straw could no longer contain moisture at the later stage of decomposition.
The experimental results demonstrated that the 0 and 60 d curves for various incorporation densities were incredibly close (Figure 10). At 240 d, the curve typically had a higher beginning and a lower ending, with the majority part located below the 0 and 60 d curves. This indicates that as more straw decomposed, the soil matrix flow became shallower, whereas the preferential flow developed deeper and more completely from a shallower depth. After 240 d of decomposition, the curve of the 15 T group had a lower start and the entire curve was located below the 0 and 60 d curves. The dyed area was 3.08 and 2.39 times those of the 0 and 60 d curves, respectively. This elucidated that both matrix and preferential flow significantly developed at the late stage of straw decomposition following a high rate of application, whereas the soil moisture storage capacity was extremely inferior.

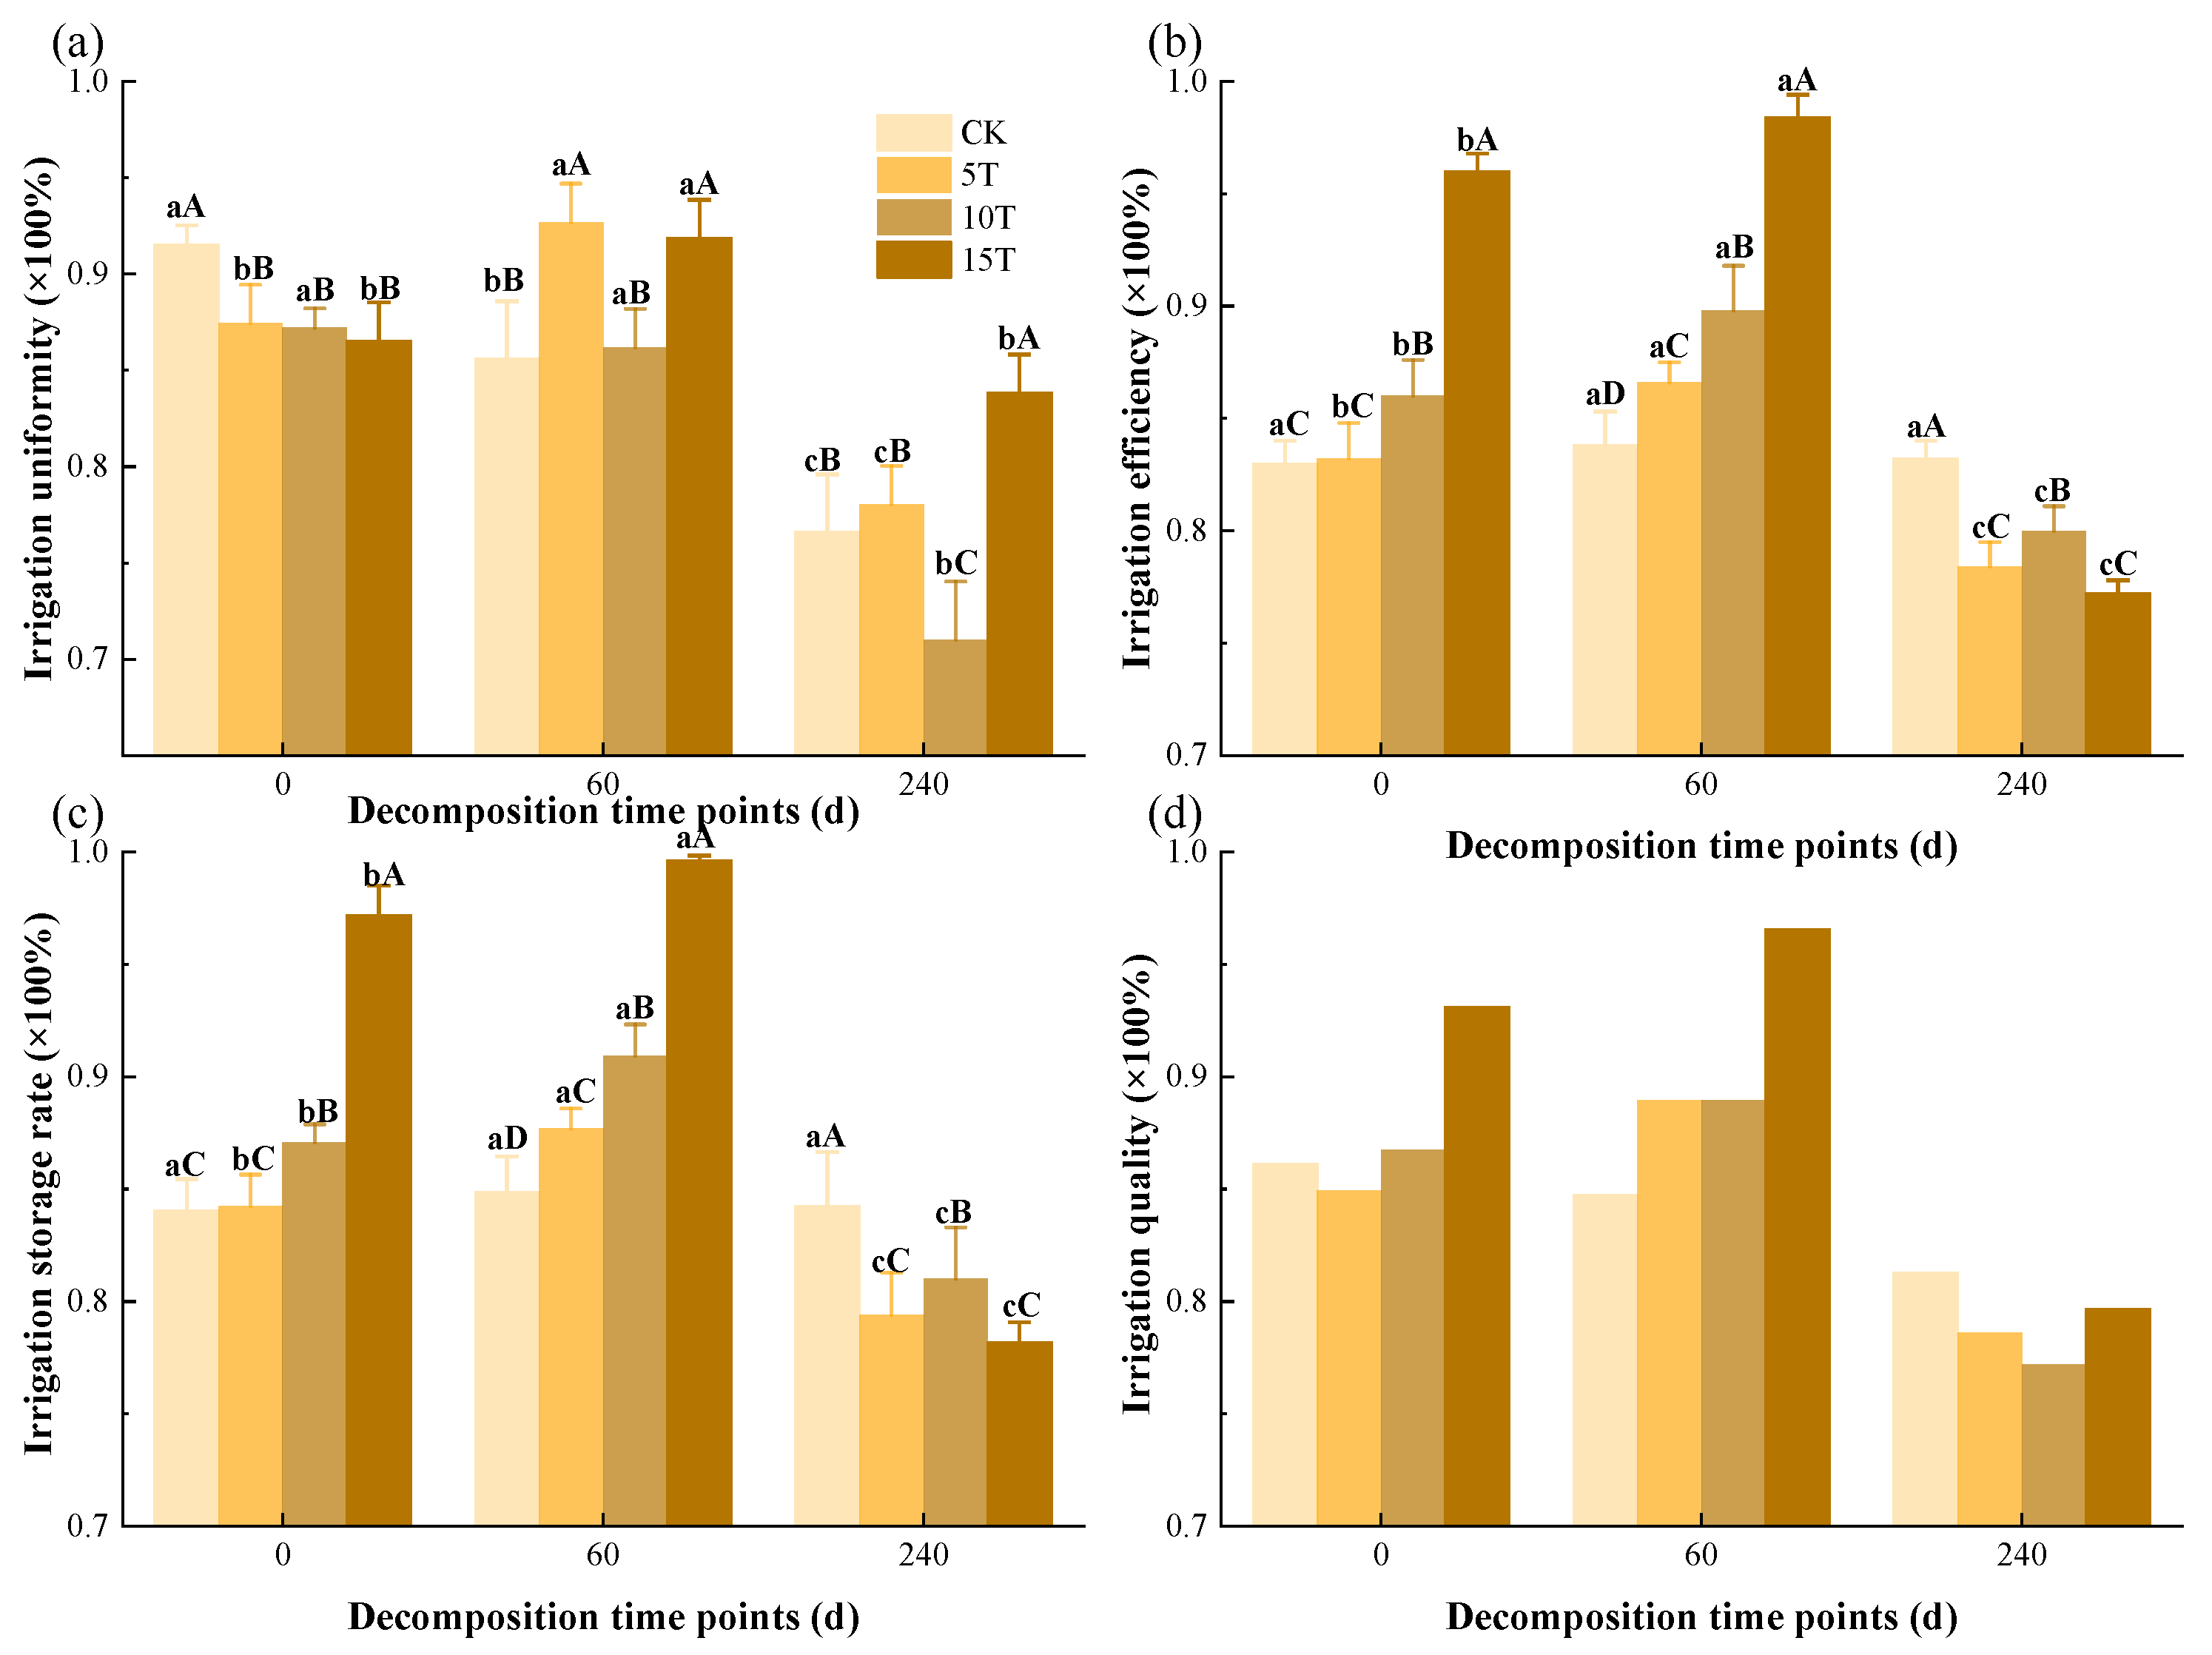
3.4. Irrigation Quality

Each evaluation index of irrigation quality was calculated according to the previous formula, and the results are plotted in Figure 11.
Through preferential pathways, irrigation water can rapidly and unevenly migrate into deep soil and cause a decrease in irrigation uniformity, irrigation efficiency, irrigation storage rate, and other indicators. Thus, irrigation can characterize the pore structure and hydraulic properties of the soil. At 60 d, the indicators generally increased and irrigation quality improved. This result indicates that when little straw decomposed in the early stages, the soil porosity increased and the soil structure improved with greater homogeneity, which corresponds to previous analysis and the results of Zhang et al. [28]. When observed in combination with the dyed images and average moisture content–soil depth curves, it became evident that there was little preferential flow with more lateral but less vertical transport at that time, and soil moisture was primarily transported in the form of matrix flow and kept in the designed moist layer of the soil, which ensured the quality of irrigation. At 240 d, the indices dropped sharply and irrigation quality deteriorated. Again, this demonstrated that as more straw decomposed in the late stages, the preferential flow was dispersed over a more extensive range and developed more sufficiently from a shallower depth. In the meantime, the moisture movement was dispersed and unstable. This phenomenon was related to factors including higher hydraulic conductivity of soil due to more macropores after long-term straw decomposition [29]. As shown in Table 3, there was a significant negative correlation found between irrigation quality and the fractal dimension values of the wetting front, as well as between irrigation quality and preferred flow coefficient. This indicates that the irrigation quality decreased with the degree of preferential flow development and the degree of wetting front inhomogeneity.

4. Discussion

Under straw-free conditions, factors including wet-dry cycles triggered a decrease in the soil shrinkage capacity [30], and nonuniform changes in soil structure induced spatiotemporal heterogeneity of the soil’s physical–hydraulic characteristics [21], which resulted in preferential flow pathways [31]. With the incorporation of straw, positive changes including increases in porosity and field capacity, a rise in saturated water content, enhanced moisture retention capacity, and improved soil physical properties were found at the early phase of decomposition. These results are in good agreement with previous investigations conducted by Sasal et al. [32] and Wuest [33]. The current study revealed that the straw decomposition proceeded from rapidness to slowness and that the decomposing efficiency had an extremum, which is similar to the findings of Wang et al. [34]. This phenomenon could be explained by the varying decomposition difficulties of multifarious straw components, as proposed by Yan [35], who conducted experiments with clay loam consisting of 40% clay. Further investigation [36] showed that the straw decomposition process is analogous to the exponential attenuation model of plant matter decay proposed by Olson: x = x0e−kt, where x0 is the initial amount of material, x is the amount of straw remaining at time t, and k is the decomposition rate. However, in the study by Ma et al. [37], the rate of straw decomposition was slow, then fast, and finally slowed again. This is probably because the experiment started in October in northeastern China at a low temperature and with little precipitation, where the soil environment was extremely unfavorable for straw decomposition. Many studies have demonstrated that the soil environment has a prominent impact on straw decomposition, and specifically, a warm and humid environment could expedite straw decomposition. Consistent with the findings of Sa et al. [38], who conducted experiments with loam consisting of 14% clay, the current study also found a more efficient decomposition rate with a larger amount of incorporated straw. The results indicate that proportions of decomposed straw and application rates were positively correlated within a certain range. This might be attributed to the fact that a larger amount of straw altered the microbial community structure and activated most hydrolytic enzymes, whereas the straw at a low application rate did not have this effect [39]. However, it must be verified whether this result is generalizable. Among the different kinds of crop straw, the decomposition process varied slightly but still had the same pattern despite different straw compositions and structures [40].
In this study, we found that the initial soil moisture retention capacity increased with increasing application rates of straw by measuring the average soil moisture content. Nevertheless, this finding has not been universal. For example, Wu et al. [41] indicated an increased soil moisture retention capacity with 1.6% wheat straw incorporation, while the capacity reversed with more than 2.25% corn straw incorporation. Moisture retention capacity and field capacity increased with higher porosities in the early stages of straw decomposition. Hence, the soil provided a suitable moist environment for microorganisms and inoculants to promote straw decomposition. As decomposition proceeded, the lower soil moisture contents and deteriorative soil properties resulted in lower microbial activities and slower straw decomposition. Therefore, efficient straw decomposition indicated favorable soil properties and a high capacity for moisture retention; inefficient straw decomposition indicated unfavorable soil properties and a low capacity for moisture retention. The decomposition rate and moisture retention capacity characterized each other. The rise and then fall of field capacity during the decomposition process might be interpreted by the following factors: (1) Straw incorporation and decomposition helped increase field capacity only at the beginning; nevertheless, with the transition from existing pores to macropores during decomposition, as proposed by Zhao et al. [42], developing macropores gradually connected to form preferential pathways and reduced the moisture conservation capacity of the soil. (2) As long as the organic matter content accumulated sufficiently by straw decomposition, the transition of the soil from hydrophilicity [43] to repellency [44] was inevitable. (3) Soil organic matter promoted the formation of macroaggregates [12] and thereby facilitated the formation of macropores [13]. (4) Studies have also shown that straw decay reduces soil clay content [45,46], which is also associated with a reduction in field capacity [47]. However, Fan et al. concluded that the field capacity continued to increase during straw decomposition and did not derive a downward trend, which might be attributed to a different soil type and the longer duration of the current study [5].
In this study, the effect of straw incorporation and decomposition on preferential flow was initially inhibited and subsequently promoted. The preferential flow developed more sufficiently from a shallower depth in the late stage of straw decomposition and its movement was more dispersed and unstable. The development of preferential flow depended on the distribution of connected macropores, so the following reasons might account for the phenomenon: (1) The fungal mycelium intensified the adhesion of soil mineral particles and invaded the pore space to decompose organic matter. Decomposition products, such as CO2, were emitted from pores and contributed to the increased numbers and expansion of macropores [48]. Macropores developed continuously [16] with a decrease in throat tortuosity and an increase in connectivity during the process, and new preferential flow pathways constantly formed. (2) Straw functioned as a channel, which promoted soil moisture infiltration and conduction of soil moisture [49], and this effect was amplified during decomposition. (3) Studies have shown the noticeable hygroscopicity of undecomposed straw [50]. As the hardness and volume decreased substantially during decomposition, its ability to absorb moisture was diminished [51]. This was not entirely identical to the conclusion of Wu et al. [6] that straw merely inhibited preferential flow. An experiment of longer duration might explain this discrepancy. Additionally, preferential flow patterns may vary with different methods of straw incorporation. Specifically, with straw powder incorporated, the soil may present a superior initial moisture retention capability [52], but the promotion effect on preferential flow may manifest earlier [48]. This may be attributed to the lesser effect of powdered straw on soil capillaries.
In this paper, the soil characteristics of different straw decomposition processes and the evolution of preferential flow were initially investigated as a reference for rational utilization of agricultural residuals and scientific irrigation. However, an experiment conducted in situ with undisturbed soil in the field would have been more reasonable. Direct investigation of soil pore characteristics after straw application is scarce in this study, particularly with regard to macropores associated with preferential flow. Some parameters were not measured, such as the soil matric potential. Furthermore, some other elements, such as crop root growth, were not taken into account. The subsequent study phase involves conducting field experiments and utilizing the CT scanning technique to elucidate the attributes of the macroporous network generated by straw decomposition.

5. Conclusions

(1) The straw decomposition rate slowed at the late stages, and the capacity of soil moisture retention progressively decreased.
(2) At the early stage of straw decomposition, moisture retention capacity and field capacity increased with higher porosities. At the late stage of decomposition, porosity decreased. Additionally, lower soil moisture content and field capacity developed.
(3) At the early stage of straw decomposition, the preferential flow was impeded. As decomposition progressed, the pattern of preferential flow occurred at shallower soil depths and it was more developed, dispersed, and unstable in the late stage of decomposition.
Overall, excessive duration of straw decomposition (240 d) is not beneficial to the structural improvement of soil or inhibition of preferential flow. Meanwhile, factors such as crop root growth will influence preferential flow in production. Therefore, the straw application rate for crops with long growth cycles should be less than 10 t/ha to avoid development of preferential flow. Due to the positive effect of straw incorporation on soil improvement, crops with short growth cycles may benefit from a higher application rate, such as 15 t/ha. Field experiments and reasonable modifications should be conducted according to the actual production environment.

Supplementary Materials

Supplementary information to this article can be found online at https://www.mdpi.com/article/10.3390/agriculture14020201/s1.

Author Contributions

Conceptualization, C.W. and Z.D.; methodology, Z.D. and X.C.; software, C.W. and X.C.; validation, Y.Z., L.M. and N.S.; formal analysis, Y.F., N.S. and J.C.; investigation, Z.D., N.S., J.C. and Y.F.; resources, C.Z., X.C. and Y.Z.; data curation, C.Z., L.M. and Y.F.; writing—original draft preparation, Z.D. and X.C.; writing—review and editing, C.W. and X.C.; visualization, Z.D.; supervision, C.Z. and X.C.; project administration, C.Z. and C.W.; funding acquisition, C.Z. and C.W. All authors have read and agreed to the published version of the manuscript.

Funding

This research was funded by the Postgraduate Research and Practice Innovation Program of Jiangsu Province, grant number SJCX22_0191; the National Natural Science Foundation of China, grant number 52109053; the Natural Science Foundation of Jiangsu Province, grant number BK20200523; the Key Research and Development Program of Jiangxi Province, grant number 20203BBGL73226; China Postdoctoral Science Foundation, grant number 2021M690874; Open Research Fund of Jiangxi Academy of Water Science and Engineering, grant number 2021SKTR03; the Cultivation Plan for Reserved Project of National Science and Technology Award, grant number 20212AEI91011; Jiangxi Province Science and Technology plus Water Conservancy Joint Program, grant number 2023KSG01002; National Undergraduate Innovation and Entrepreneurship Training Program, grant number 2023102941259.

Institutional Review Board Statement

Not applicable.

Data Availability Statement

Data will be made available on request.

Conflicts of Interest

The authors declare no conflicts of interest.

References

  1. An, W.; Gao, D.; Pan, T.; Zeng, C.; Wang, W. Effect of rice straw returning on paddy soil water-stable aggregate distribution and stability in the paddy field of Fuzhou plain. Acta Sci. Circumstantiae 2016, 36, 1833–1840. [Google Scholar] [CrossRef]
  2. Zhen, W.; Hao, F. Study on the Influence of Different Straw-returning Manners on Soil Structure and Characters of Soil Water Evaporation. J. Soil Water Conserv. 2009, 23, 224–228,251. [Google Scholar] [CrossRef]
  3. Pan, J.; Dai, W.; Shang, Z.; Guo, R. Review of research progress on the influence and mechanism of field straw residue incorporation on soil organic matter and nitrogen availability. Chin. J. Eco-Agric. 2013, 21, 526–535. [Google Scholar] [CrossRef]
  4. Wang, Q.; Chen, J.; Yang, Y.; Chai, R.; Ye, X.; Gao, H.; Ma, D.; Zhang, J.; Zhou, Y. Effect mechanism of long-term straw returning on shrinkage characteristic in typical Shajiang black soil. Trans. Chin. Soc. Agric. Eng. 2019, 35, 119–124. [Google Scholar] [CrossRef]
  5. Fan, Q.; Li, J.; Li, J.; Liu, Z.; Huang, C.; Yang, Z.; Gao, Z. Effect of Different Crop Straw Mulching on Alluvial Soil Structure Improvement. J. Soil Water Conserv. 2020, 34, 230–236. [Google Scholar] [CrossRef]
  6. Wu, H.; Chen, X.-B.; Jiang, B.; Qin, Z.-C.; Liu, S.-J.; Liu, J.-J. Effects of straw returning to movement characteristics of soil preferential flow in sugarcane fields. J. Appl. Ecol. 2022, 33, 141–148. [Google Scholar] [CrossRef]
  7. Han, X.-Z.; Zou, W.-X.; Wang, F.-X.; Wang, F.-J. Construction effect of fertile cultivated layer in black soil. J. Appl. Ecol. 2009, 20, 2996–3002. [Google Scholar] [CrossRef]
  8. Bhattacharyya, R.; Chandra, S.; Singh, R.D.; Kundu, S.; Srivastva, A.K.; Gupta, H.S. Long-term farmyard manure application effects on properties of a silty clay loam soil under irrigated wheat-soybean rotation. Soil Tillage Res. 2007, 94, 386–396. [Google Scholar] [CrossRef]
  9. Fang, H.; Li, Y.; Zhou, H.; Yan, X.; Peng, X. Effects of Straw Incorporation on Paddy Soil Structure in Rice-Wheat Rotation System. Trans. Chin. Soc. Agric. Mach. 2018, 49, 297–302. [Google Scholar] [CrossRef]
  10. Zou, W.X.; Han, X.Z.; Lu, X.C.; Hao, X.X.; You, M.Y.; Zhang, Y.H. Effects of straw incorporated to different locations in soil profile on straw humification coefficient and maize yield. J. Appl. Ecol. 2017, 28, 563–570. [Google Scholar] [CrossRef]
  11. Naveed, M.; Moldrup, P.; Vogel, H.-J.; Lamande, M.; Wildenschild, D.; Tuller, M.; de Jonge, L.W. Impact of long-term fertilization practice on soil structure evolution. Geoderma 2014, 217, 181–189. [Google Scholar] [CrossRef]
  12. Gao, M.; Li, N.; Peng, J.; Chen, K.; Gao, T.; Han, X. Effects of straw and biochar returning on soil aggregates distribution and organic carbon content in brown soil. J. Plant Nutr. Fertitizer 2020, 26, 1978–1986. [Google Scholar] [CrossRef]
  13. Mangalassery, S.; Sjoegersten, S.; Sparkes, D.L.; Sturrock, C.J.; Mooney, S.J. The effect of soil aggregate size on pore structure and its consequence on emission of greenhouse gases. Soil Tillage Res. 2013, 132, 39–46. [Google Scholar] [CrossRef]
  14. Wu, J.; Guo, X.; Lu, J.; Wan, S.; Wang, Y.; Xu, Z.; Zhang, X. Decomposition characteristics of wheat straw and effects on soil biological properties and nutrient status under different rice cultivation. Acta Ecol. Sin. 2013, 33, 565–575. [Google Scholar] [CrossRef]
  15. Strong, D.T.; De Wever, H.; Merckx, R.; Recous, S. Spatial location of carbon decomposition in the soil pore system. Eur. J. Soil Sci. 2004, 55, 739–750. [Google Scholar] [CrossRef]
  16. De Gryze, S.; Jassogne, L.; Six, J.; Bossuyt, H.; Wevers, M.; MerckX, R. Pore structure changes during decomposition of fresh residue: X-ray tomography analyses. Geoderma 2006, 134, 82–96. [Google Scholar] [CrossRef]
  17. Liu, J.; Li, J.; Zhou, Y.; Fu, Q.; Zhang, L.; Liu, L. Effects of Straw Mulching and Tillage on Soil Water Characteristics. Trans. Chin. Soc. Agric. Mach. 2019, 50, 333–339. [Google Scholar] [CrossRef]
  18. Yang, Z.; Chen, Y.; Zhang, Y.; Peng, L.; Chen, Q. Releasing characteristics of nonpoint source pollutants from straws under submerging condition. Acta Ecol. Sin. 2012, 32, 1854–1860. [Google Scholar] [CrossRef]
  19. Cui, S.; Yin, X.; Chen, F.; Tang, H.; Li, F.; Zhang, H. Effects of tillage and straw returning on nitrogen leakage in double rice cropping field. Trans. Chin. Soc. Agric. Eng. 2011, 27, 174–179. [Google Scholar] [CrossRef]
  20. Jarvis, N.J. A review of non-equilibrium water flow and solute transport in soil macropores: Principles, controlling factors and consequences for water quality. Eur. J. Soil Sci. 2020, 71, 279–302. [Google Scholar] [CrossRef]
  21. Beven, K.; Germann, P. Macropores and water flow in soils revisited. Water Resour. Res. 2013, 49, 3071–3092. [Google Scholar] [CrossRef]
  22. Cey, E.E.; Rudolph, D.L. Field study of macropore flow processes using tension infiltration of a dye tracer in partially saturated soils. Hydrol. Processes 2009, 23, 1768–1779. [Google Scholar] [CrossRef]
  23. Zhou, H.; Fang, H.; Mooney, S.J.; Peng, X. Effects of long-term inorganic and organic fertilizations on the soil micro and macro structures of rice paddies. Geoderma 2016, 266, 66–74. [Google Scholar] [CrossRef]
  24. Mooney, S.J.; Morris, C. Morphological approach to understanding preferential flow using image analysis with dye tracers and X-ray computed tomography. Catena 2008, 73, 204–211. [Google Scholar] [CrossRef]
  25. Guntiñas, M.E.; Leirós, M.C.; Trasar-Cepeda, C.; Gil-Sotres, F. Effects of moisture and temperature on net soil nitrogen mineralization: A laboratory study. Eur. J. Soil Biol. 2012, 48, 73–80. [Google Scholar] [CrossRef]
  26. Stanford, G.; Frere, M.H.; Schwaninger, D.H. Temperature coefficient of soil nitrogen mineralization. Soil Sci. 1973, 115, 321–323. [Google Scholar] [CrossRef]
  27. Zou, W.; Han, X.; Yan, J.; Chen, X.; Lu, X.; Qiu, C.; Hao, X. Effects of incorporation depth of tillage and straw returning on soil physical properties of black soil in Northeast China. Trans. Chin. Soc. Agric. Eng. 2020, 36, 9–18. [Google Scholar] [CrossRef]
  28. Zhang, G.S.; Chan, K.Y.; Li, G.D.; Huang, G.B. Effect of straw and plastic film management under contrasting tillage practices on the physical properties of an erodible loess soil. Soil Tillage Res. 2008, 98, 113–119. [Google Scholar] [CrossRef]
  29. Bandyopadhyay, P.K.; Saha, S.; Mani, P.K.; Mandal, B. Effect of organic inputs on aggregate associated organic carbon concentration under long-term rice-wheat cropping system. Geoderma 2010, 154, 379–386. [Google Scholar] [CrossRef]
  30. Zhang, Z.B.; Peng, X.; Wang, L.L.; Zhao, Q.G.; Lin, H. Temporal changes in shrinkage behavior of two paddy soils under alternative flooding and drying cycles and its consequence on percolation. Geoderma 2013, 192, 12–20. [Google Scholar] [CrossRef]
  31. Niu, J.; Yu, X.; Zhang, Z. The present and future research on preferential flow. Acta Ecol. Sin. 2006, 26, 231–243. [Google Scholar] [CrossRef]
  32. Sasal, M.C.; Andriulo, A.E.; Taboada, M.A. Soil porosity characteristics and water movement under zero tillage in silty soils in Argentinian Pampas. Soil Tillage Res. 2006, 87, 9–18. [Google Scholar] [CrossRef]
  33. Wuest, S.B. Surface versus incorporated residue effects on water-stable aggregates. Soil Tillage Res. 2007, 96, 124–130. [Google Scholar] [CrossRef]
  34. Wang, Z.; Chen, W.; Yuan, W.; Ma, X.; Zhou, Z.; Liu, S. Effects of different types of rice straw and returning depth on decomposition course of straw in double cropping rice region. Soil Fert. Sci. China 2022, 2, 170–174. [Google Scholar] [CrossRef]
  35. Yan, C. Study on Decomposition Rule of Rice Straw Returning to Field and Soil Nutrient Characteristics. Ph.D. Thesis, Northeast Agricultural University, Harbin, China, 2015. [Google Scholar]
  36. Shanghong, C.; Zhonglin, Z.H.U.; Jie, W.U.; Dinghui, L.I.U.; Changquan, W. Decomposition Characteristics of Straw Return to Soil and Its Effect on Soil Fertility in Purple Hilly Region. J. Soil Water Conserv. 2006, 20, 141–144. [Google Scholar] [CrossRef]
  37. Ma, Y.; Teng, D.; Yi, S.; Liu, S.; Wang, H. Effects of Straw Mulching and Decomposition Rate on Soil Temperature and Humidity and Maize Yield. Trans. Chin. Soc. Agric. Mach. 2021, 52, 90–99. [Google Scholar] [CrossRef]
  38. Sa, R.; Yang, H.; Fan, F.; Tai, J. Effect of Amount of Straw Returning to Field and Straw-Decomposing Inoculant on Degradation Rate of Straw and Soil Physicochemical Properties. J. Henan Agric. Sci. 2018, 47, 56–61. [Google Scholar] [CrossRef]
  39. Zhao, S.; Li, K.; Zhou, W.; Qiu, S.; Huang, S.; He, P. Changes in soil microbial community, enzyme activities and organic matter fractions under long-term straw return in north-central China. Agric., Ecosyst. Environ. 2016, 216, 82–88. [Google Scholar] [CrossRef]
  40. Dai, Z.; Lu, J.; Li, X.; Lu, M.; Yang, W.; Gao, X. Nutrient release characteristic of different crop straws manure. Trans. Chin. Soc. Agric. Eng. 2010, 26, 272–276. [Google Scholar] [CrossRef]
  41. Wu, F.; Zhang, K.; Zai, S.; Wang, H.; Zhao, C. Impact of mixed straw on soil hydraulic properties. Trans. Chin. Soc. Agric. Eng. 2015, 31, 101–105. [Google Scholar] [CrossRef]
  42. Zhao, L.; Li, L.; Cai, H.; Shi, X.; Xue, S. Comprehensive Effects of Organic Materials Incorporation on Soil Hydraulic Conductivity and Air Permeability. Sci. Agric. Sin. 2019, 52, 1045–1057. [Google Scholar] [CrossRef]
  43. Yue, H.J.; Fan, G.S. Nonlinear prediction model of soil field water capacity. Water Sav. Irrig. 2015, 243, 76–79+84. [Google Scholar] [CrossRef]
  44. Chen, J.; Wu, P.; Zhang, Z.; Gideon, O.; Wang, Z. The Relationship between WDPTand Soil Organic Matter. J. Irrig. Drain. 2012, 31, 96–98+118. [Google Scholar] [CrossRef]
  45. Wang, X.J.; Jia, Z.K.; Liang, L.Y.; Yang, B.P.; Ding, R.X.; Nie, J.F.; Wang, J.P. Maize straw effects on soil aggregation and other properties in arid land. Soil Tillage Res. 2015, 153, 131–136. [Google Scholar] [CrossRef]
  46. Liu, X.Z. Effect of straw returning mode on soil stability of farmland aggregate particle size composition. Northeast Agric. Sci. 2021, 46, 34–37+104. [Google Scholar] [CrossRef]
  47. Qian, S.G. Correlation between field water capacity and mechanical composition of soil bulk density. Soil Bull. 1981, 5, 12–14. [Google Scholar] [CrossRef]
  48. Wang, Y.; Kuang, F.; Ma, S.; Wang, Y.; Li, L.; Tang, J.; Zhu, B. Effects of shredded straw and burned straw returning to the field on soil porosity and organic carbon in cultivated layer of calcareous purple soil. J. Agro-Environ. Sci. 2022, 41, 526–536. [Google Scholar] [CrossRef]
  49. Kasteel, R.; Garnier, P.; Vachier, P.; Coquet, Y. Dye tracer infiltration in the plough layer after straw incorporation. Geoderma 2007, 137, 360–369. [Google Scholar] [CrossRef]
  50. Iqbal, A.; Beaugrand, J.; Garnier, P.; Recous, S. Tissue density determines the water storage characteristics of crop residues. Plant Soil 2013, 367, 285–299. [Google Scholar] [CrossRef]
  51. Li, J.; Hu, M.; Lu, J. Water Absorption Capacity of Straw Returns and Its Decomposing Matters. Bull. Soil Water Conserv. 2016, 36, 85–90. [Google Scholar] [CrossRef]
  52. Zhang, H.; Pang, H.; Lu, C.; Liu, N.; Zhang, X.; Li, Y. Pore characteristics of straw interlayer based on computed tomography images and its influence on soil water infiltration. Trans. Chin. Soc. Agric. Eng. 2019, 35, 114–122. [Google Scholar] [CrossRef]
Figure 1. Experimental setup: (a) experimental apparatuses and contents; (b) prewetting of specimens.
Agriculture 14 00201 g001
Figure 2. Experimental processes: (a) irrigation with KI tracer; (b) spray with a mixture of iron nitrate and starch; (c) photograph with a digital camera.
Agriculture 14 00201 g002
Figure 3. Flowchart of digital image processing.
Agriculture 14 00201 g003
Figure 4. Proportions of decomposed straw for varying straw application rates and decomposition time points. Different lowercase letters indicate significant differences (p < 0.05) between treatments at varying decomposition time points with the same application rate, and different capital letters indicate significant differences (p < 0.05) between treatments with varying application rates at the same decomposition time point (p < 0.05).
Agriculture 14 00201 g004
Figure 5. Soil characteristics under different treatments: (a) bulk density; (b) porosity; (c) field capacity. Different lowercase letters indicate significant differences (p < 0.05) between treatments at varying decomposition time points with the same application rate, and different capital letters indicate significant differences (p < 0.05) between treatments with varying application rates at the same decomposition time point (p < 0.05).
Agriculture 14 00201 g005
Figure 6. Average moisture content–soil depth curve at (a) 0 d; (b) 60 d; (c) 240 d.
Agriculture 14 00201 g006
Figure 7. Dyed images of macropore preferential flow, typical profiles at (a) 0 d; (b) 60 d; (c) 240 d.
Agriculture 14 00201 g007
Figure 8. Evaluation indices of preferential flow under different incorporation densities and decomposition time points: (a) dyed area proportion; (b) preferential flow coefficient; (c) maximum depth infiltration; (d) matrix flow depth. Different lowercase letters indicate significant differences (p < 0.05) between treatments at varying decomposition time points with the same application rate, and different capital letters indicate significant differences (p < 0.05) between treatments with varying application rates at the same decomposition time point (p < 0.05).
Agriculture 14 00201 g008
Figure 9. Dyed coverage–soil depth curve at (a) 0 d; (b) 60 d; (c) 240 d.
Agriculture 14 00201 g009
Figure 10. Dyed coverage–soil depth curve with different straw application rates: (a) no straw application; (b) 5 t/ha; (c) 10 t/ha; (d) 15 t/ha.
Agriculture 14 00201 g010
Figure 11. Evaluation indices of the irrigation quality of different treatments: (a) irrigation uniformity; (b) irrigation efficiency; (c) irrigation storage rate; (d) overall irrigation quality. Different lowercase letters indicate significant differences (p < 0.05) between treatments at varying decomposition time points with the same application rate, and different capital letters indicate significant differences (p < 0.05) between treatments with varying application rates at the same decomposition time point (p < 0.05).
Agriculture 14 00201 g011
Table 1. Physical properties of the sampled soil.
Soil PropertiesValues
Soil typeClay loam
ClassificationHapludalf, alfisols
Specific gravity2.65
Dry bulk density1.17 g/cm3
Initial moisture content3.27% volumetric water content
Initial porosity43%
Field capacity24.69% volumetric water content
Saturated moisture content55.80% volumetric water content
Saturated hydraulic conductivity6.23 × 10−2 cm/min
EC1.2 mS/cm
pH7.23
Table 2. The fractal dimension values of the wetting front.
CK5 t/ha10 t/ha15 t/ha
0 d1.6831.6521.6431.559
60 d1.6911.6711.6211.625
240 d1.6911.6891.7061.762
Table 3. Correlation between irrigation quality and other parameters.
Irrigation QualityIrrigation Quality
Preferential flow coefficient −0.743 **
The fractal dimension values of the wetting front −0.874 **
** represents a significant correlation at the 0.01 level.
Disclaimer/Publisher’s Note: The statements, opinions and data contained in all publications are solely those of the individual author(s) and contributor(s) and not of MDPI and/or the editor(s). MDPI and/or the editor(s) disclaim responsibility for any injury to people or property resulting from any ideas, methods, instructions or products referred to in the content.

