Article

Unlocking Sows’ Welfare: The Farm-Level Economic Impact of Phasing out Farrowing Crates for Sows in the European Union’s Pig Breeding Industry

1
Institute of Economics and Finance, Warsaw University of Life Sciences (SGGW), 02-787 Warsaw, Poland
2
Foundation Science and Education for Agri-Food Sector (FNEA), 01-472 Warsaw, Poland
3
Institute of Agricultural Economics Nonprofit Kft. (AKI), 1093 Budapest, Hungary
*
Author to whom correspondence should be addressed.
Agriculture 2024, 14(2), 187; https://doi.org/10.3390/agriculture14020187
Submission received: 14 December 2023 / Revised: 22 January 2024 / Accepted: 23 January 2024 / Published: 26 January 2024
(This article belongs to the Section Agricultural Economics, Policies and Rural Management)

Abstract

:
The main purpose of this study is to assess the farm-level economic consequences of the planned introduction of a ban on farrowing crates for sows in the EU pig sector, being a response by the European Commission to the ‘End the Cage Age’ Initiative. The impact assessment was carried out in three stages: farm-level analyses based on 225 farm surveys carried out in EU member states and expert consultations, assessments for five alternative scenarios, and the aggregation (scaling-up) of the scenario analysis to the EU-27 sectoral impact. Our findings indicate that the ban on farrowing crates is expected to cause a decrease in the sow population by 21–23%, depending on the scenario, and piglet output in the EU owing to increased sow space requirements, a reduction in production efficiency, and a significant demand for investments. The transition to alternative farrowing systems will lead to increased variable costs related to the farrowing period, namely, veterinary expenses, labour costs, and sow feed costs, as well as expenses associated with higher piglet mortality and increased sow replacement rates. The lower density, resulting from the larger space allowance per sow in free-farrowing systems (approximately 5.5 m2 in free farrowing with temporary confinement and 7 m2 in systems without confinement) will also cause fixed costs per unit (per sow or piglet) to rise in proportion to the decline in the sow herd. Expressed as a percentage of the total production costs per piglet, we can expect a 6–10% increase in the total production costs. The implementation of free-farrowing systems on pig farms will necessitate investments in the modernisation of the existing buildings and new pens for sows. Depending on the scenario, the value of investments ranged from 3.8 to 6.7 billion EUR, at 2021 prices. It should be recognised that beyond the actual improvement in the welfare of sows, there are lingering concerns, including increased production costs, higher piglet mortality rates, and heightened risks to employees. It is essential to consider providing financial assistance to support farms in making a smooth transition to the new systems, as well as an extended transition period to ensure a painless shift.

1. Introduction

Animal welfare issues have gained prominence in the ongoing public debate since the 1990s owing to growing social and political interest. In the European Union, animal welfare requirements were initially incorporated into directives in the 1990s and have been systematically updated in subsequent years. Growing social pressure, bolstered by increasingly active interest groups and non-governmental organisations, has resulted in animal welfare remaining a constant focus in EU strategic documents [1,2,3]. The political consequence of this heightened interest is the ongoing discussion at the level of the European Commission and in EU member states about the possibility for raising animal welfare standards beyond the level set in the current legislation (2008/120/EC Council Directive [4]).
This study focuses on the anticipated changes to the EU’s animal welfare regulations, particularly the introduction of a prohibition on the use of farrowing crates in pig production, which significantly affect the health and general well-being of sows during the farrowing period. This ban is expected to be a response by the European Commission to the ‘End the Cage Age’ initiative [5]. The amendment of the current animal welfare legislation, as outlined in the 2008/120/EC Council Directive, will incorporate new legislative provisions proposed by the EU Commission. The proposed ban will include a transition period, the duration of which will be determined, following the release of the European Food Safety Authority (EFSA) [1] opinion, expected in the first months of 2024.
By taking action ahead of new legislation, Sweden has already entirely prohibited the use of farrowing crates, becoming the first and only member state to do so since 1994. Austria, another country where the debate led to legislative action, introduced minimum space allowances for sows, exceeding EU requirements in 2012 [3]. Austria has set a goal for 2033 to transition to free-farrowing pens with at least 5.5 m2 per sow [6], with confinement allowed for a maximum of five days after farrowing. Similar discussions have taken place in Germany and Denmark. In Germany, a decision was made in 2019 (with a transition period of 15 years) to reduce the sow-confinement period to a maximum of five days after farrowing, with a minimum space requirement of 6.5 m2 per farrowing pen [7,8]. In Denmark, significant investment support for free-farrowing systems has been introduced already in 2014, which tripled in 2022 [9,10]. This is aimed at encouraging farmers to convert their farrowing systems sooner. The other EU countries are adopting a wait-and-see position, anticipating decisions from the EU Commission.
Simultaneously, there is a substantial body of literature discussing the technical performance and economic efficiency of free-farrowing systems. The results are sometimes ambiguous and case-specific, but a majority indicate the lower performance of free-farrowing systems (e.g., higher mortality of piglets, lower number of litters, higher culling-out percentage of sows, higher feed intake, and higher costs) compared to crate-based solutions see literature review in Section 2). At the same time, there is a lack of complex analyses of the economic results for switching to the free pig farrowing systems across different countries.
Given the lack of comprehensive analyses, as highlighted in the literature review in Section 2 of this paper, the main goal of the study is to estimate the farm-level costs associated with implementing indoor, free-farrowing systems throughout the entire EU pig sector. Based on the literature review shown in Section 2, however, treated with caution, we hypothesise that the costs of production in free-farrowing systems might be higher than those in the system based on farrowing crates. The study is based on a farm-level assessment supplemented by a literature review, extensive expert consultations, and discussions with sectoral organisations in the majority of EU member states. To the best of our knowledge, this is the first study in the literature to encompass the entire EU pig sector.

2. Economic Performance of Free-Farrowing Systems—A Literature Review

Extensive research results evaluating the technical efficiency and performance of sows in various housing arrangements can be found in the scientific literature. However, the results differ, depending on various parameters, including the pig breed or hybrid, scale of production, housing systems, feeding methods, and assumptions of the study. Having in mind the main purpose of the paper, related to the assessment of the economic effects associated with implementing free-farrowing systems throughout the entire EU pig sector, as well as the need to estimate the technical performance parameters, being assumptions for our analyses, as presented in Section 3, we conducted a comprehensive, multispectral analysis of the literature, complemented by insights and assessments from pig breeding experts and experiences shared by farmers, who have already adopted free-farrowing systems. In our research, we tried to cover all the studies related to the performance of free-farrowing systems across the globe, covering the last 20 years.
In Table 1, we present the selected references associated with the technical performance parameters, which formed the basis for determining the parameters used for the assessments in our study.
Most studies comparing the performance parameters of free-farrowing and stall/crate farrowing systems have reported increased piglet mortality when sows have unrestricted movement, resulting in a higher incidence of piglet crushing, particularly during the first five days after birth. This parameter, closely related to costs, has consistently been reported as higher in free-farrowing pens in previous studies by [12,19,23,25,30]. For instance, in Denmark, Hales [14] studied piglet mortality at a commercial farm, with randomly accommodated sows in three systems: farrowing crates, a free-farrowing system with four days of sow confinement after giving birth, and free farrowing with no confinement. The study, conducted at a farm with 2139 born litters, found that the total piglet mortality (including stillborn and liveborn dead) was 3.9 p.p. higher in the free-farrowing system with no confinement and 3.3 p.p. higher in the free-farrowing system with temporal confinement compared to crates. The proportions of crushed piglets were 10.7%, 9.7%, and 7.8% of the total births, respectively. Additionally, a meta-analysis conducted by Glencorse et al. [18] comparing crates and free-farrowing systems confirmed a 14% increase in the relative risk of piglet mortality in farrowing pens compared to crates. Similar observations were made in a literature review by Baxter et al. [16].
When we analysed the 2017–2020 average data from the InterPIG (a global network of pig sector economists and experts) 2021 database for pig farms in Sweden (where, since 1994, only free-farrowing systems have been used) and Finland (where 40% of sows are in free-farrowing systems), we also found that the average piglet mortality is higher in Sweden, at 17.4%, compared to other European producers, ranging from 13.3% in the Netherlands to 15.4% in France. Similarly, a lower number of litters per sow per year was reported: 2.23 for Sweden and 2.24 for Finland compared to most leading European producers, where it ranged from 2.27 in Denmark to 2.35 in the Netherlands and France. These findings align with those in previous studies [11,12,30].
Experts involved in our study confirmed the literature’s findings that lactating sows in free-farrowing systems tend to exhibit poorer litter weaning performance. However, they also reported that certain technical solutions may address this issue, such as the Well-Farrowing free-range farrowing pen with a movable ‘balance floor’, as tested in the Netherlands [31]. When the sow stands up, sensors activate the floor to lift, preventing piglets from reaching the sow. This solution is applicable only in farrowing pens with confinement for five days after farrowing. However, the value of the required investments is considerably high (€500–600 per pen).
Anil et al. [14] have indicated a higher percentage of sows being culled in free-farrowing systems owing to lameness, injuries, and poor reproductive performance. This also has an impact on veterinary inputs for both the sow and the piglets. They [14] concluded that in case of sows in pens, when compared with stall-housed sows, the proportion of culled sows was much greater. In the pen system, the proportion of sows culled for lameness and poor reproductive performance was, likewise, significantly greater than in the case of sows kept in crates.
Free-farrowing systems are also expected to be more labour-intensive, as free-farrowing pens require more monitoring, longer daily routines, and specific activities. Quendler et al. [11] and Baxter et al. [16], as well as AHDB (the Agricultural and Horticultural Development Board) [27] confirm these findings in their research on various free-farrowing systems. InterPIG averages for Sweden and Finland also report slightly higher average time usages per sow per year needed for servicing the free-farrowing pens [32]. Polish experts have emphasised the significant role of employees in free-farrowing systems. According to their experience, the hygiene in the pens is a critical aspect of the performance, and owing to the free movement of sows in the free-farrowing system, maintaining the cleanliness of the floor, drinkers, and in the piglet place requires continuous supervision.
The AHDB’s [27] investigation on the impact of alternative farrowing technologies across the British pig sector revealed inconsistent findings. Study results revealed that the rates of pre-weaning mortality comparable with conventional farrowing crates, can be achieved in some but not all situations. However, switching to free-farrowing systems requires, in most cases, an additional floor area and new investments, which increase production costs. It was estimated that production costs would rise owing to the increased use of straw/bedding and feed intake, as well as higher labour input in the free-farrowing systems. The AHDB [27] emphasised that alternative free-farrowing systems are more costly than traditional farrowing crates, ranging from 2.3% higher costs (at a pen size of 4 m2 and a 12.34% piglet mortality) to 5.3% of the total costs per kg/deadweight (at a pen size of 8 m2 and a 18% mortality rate). The AHDB [27] also reported that well-managed alternative indoor free-farrowing systems could provide benefits in production, such as lower piglet mortality and/or one additional piglet born alive per litter. They emphasised the need for employee training and the regular use of the new farrowing techniques, which may help offset the increased costs associated with the greater floor space per sow.
Owing to data problems, particularly issues related to reliability and representation, the majority of the studies that were evaluated relies on expert judgments and simplified assumptions. Results should, therefore, be interpreted cautiously. Specifically, there is limited or no information available on the economic impacts of various housing systems, veterinary procedures, the volume of the litter used in alternative housing systems with partially or entirely covered floors, additional labour input, and the value of the required investments.

3. Materials and Methods

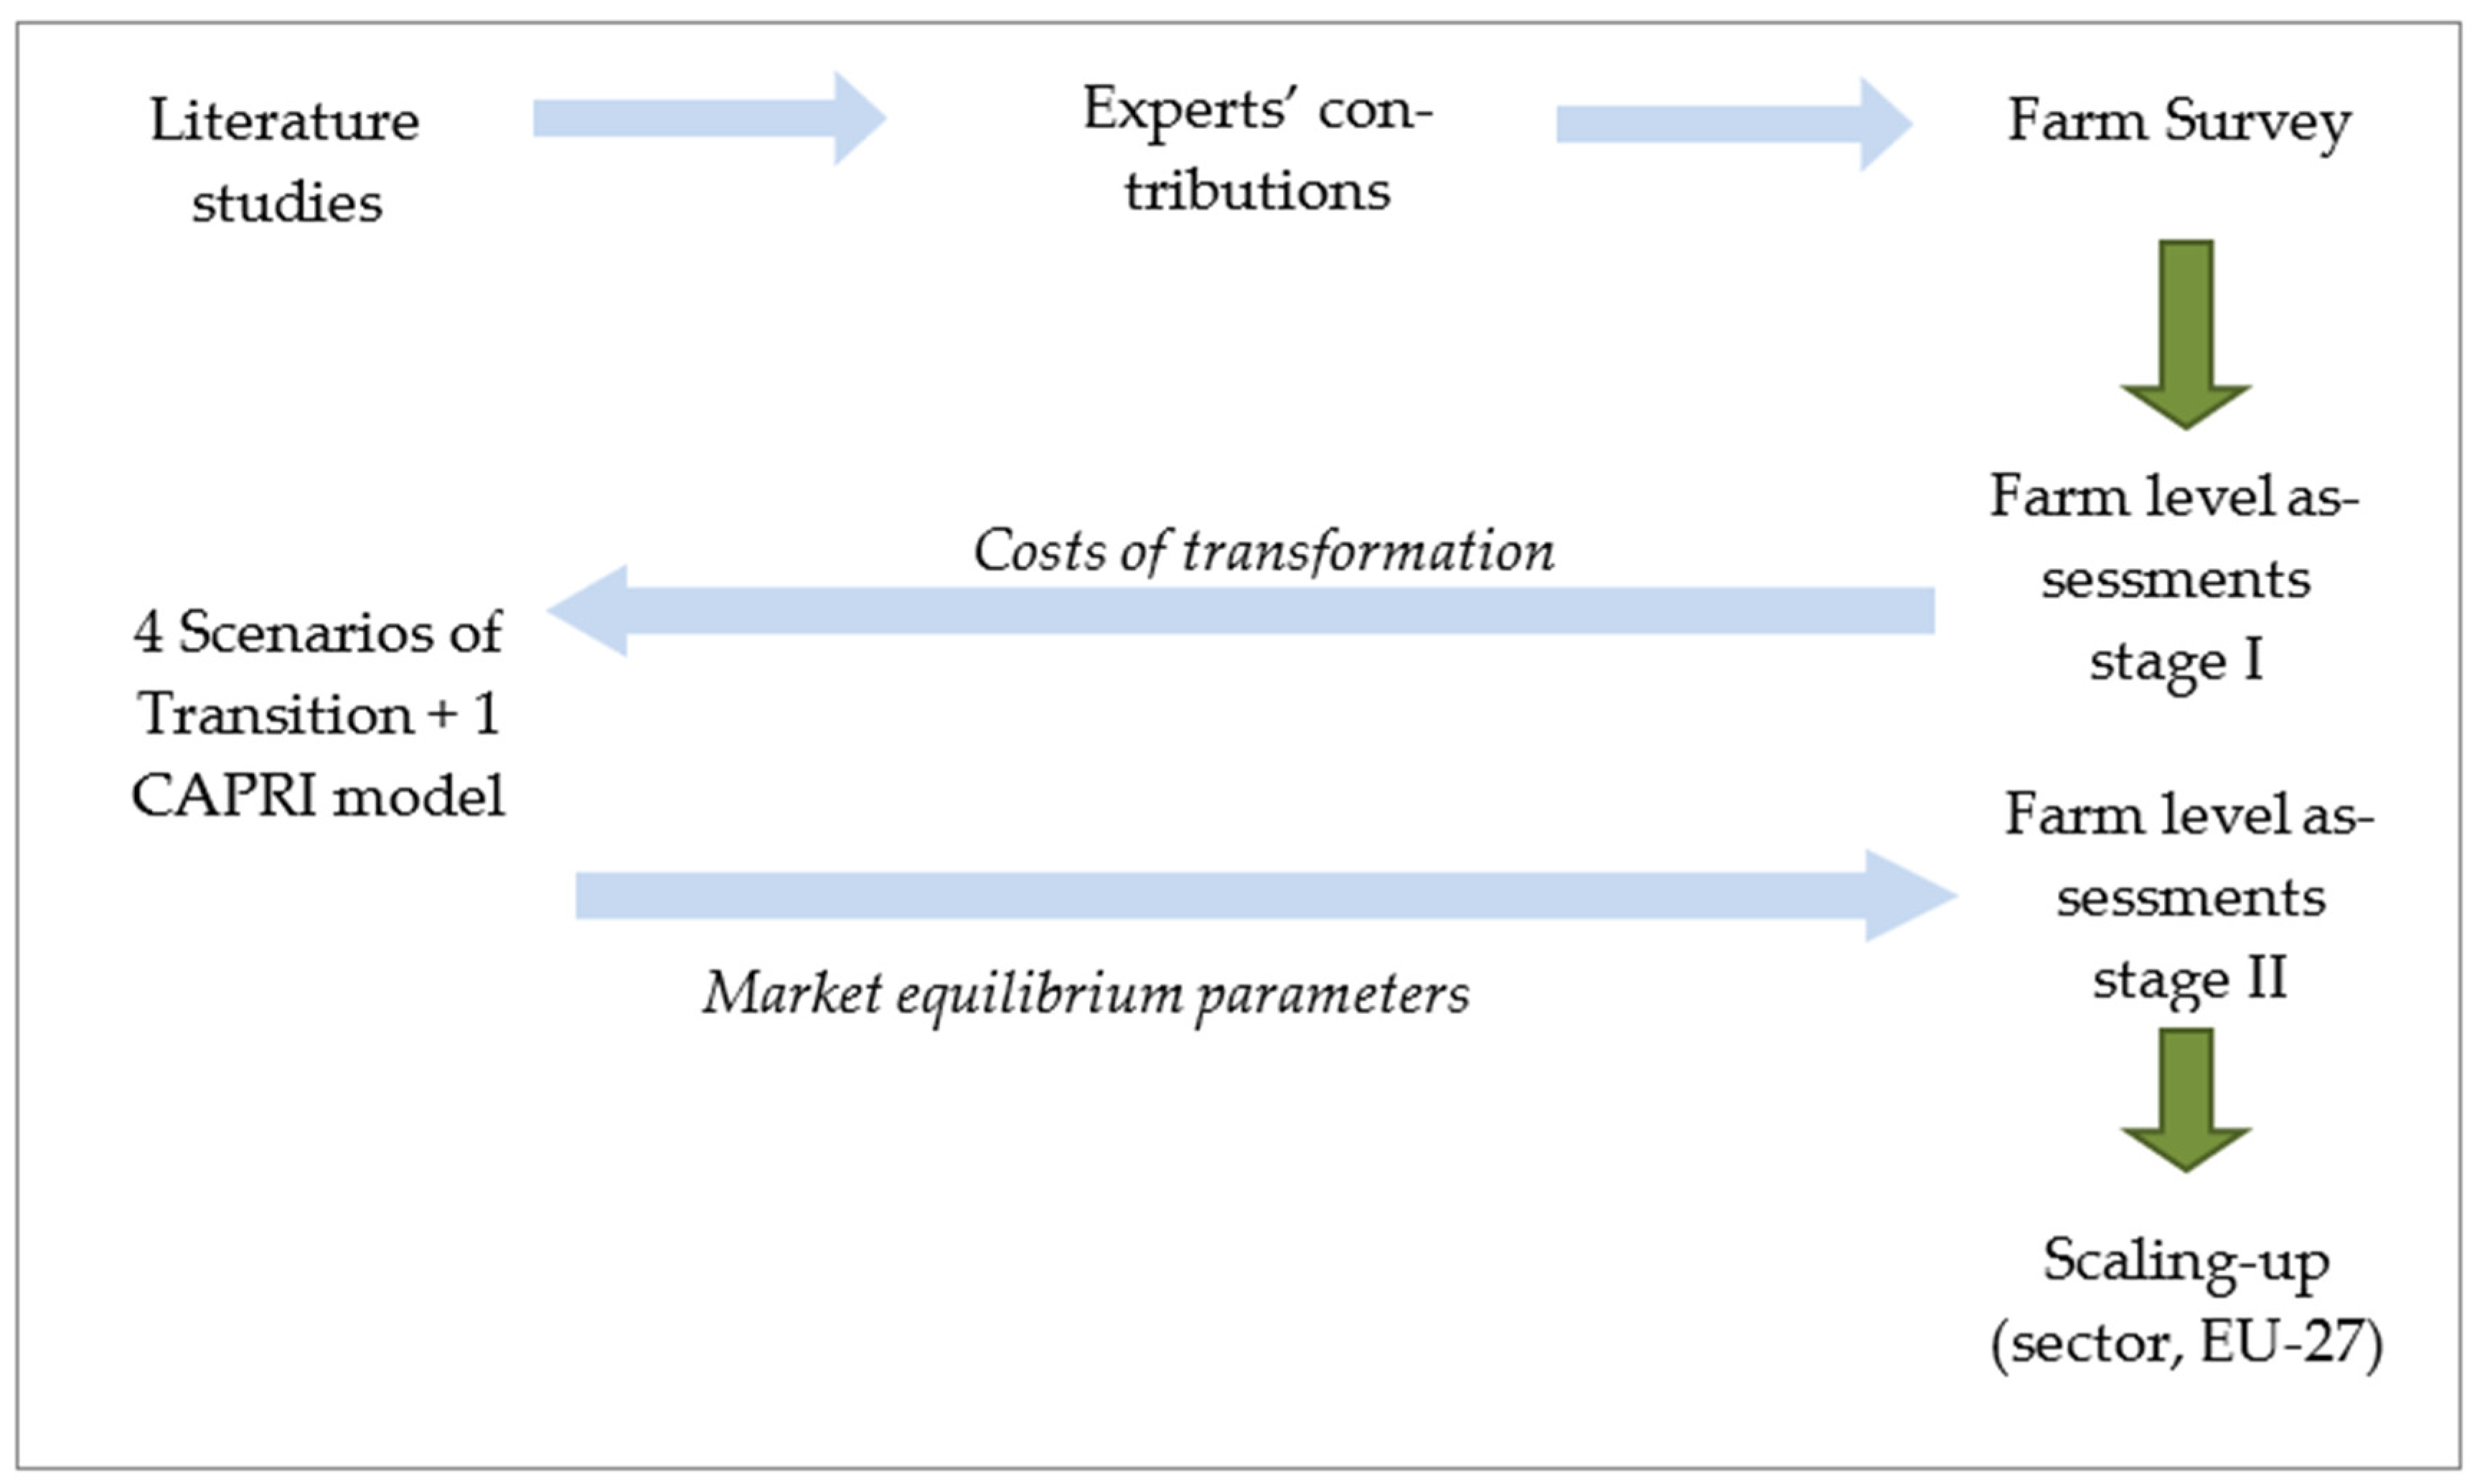
3.1. Conceptual Framework and Sources of Data

The farm-level consequences for switching to free-farrowing systems for sows have been analysed using the conceptual framework presented in Figure 1.
The impact assessment was carried out in three stages, as shown in Figure 1: (1) a farm-level study based on farm surveys and contributions from experts in selected EU member states; (2) the transfer of parameters and farm-level data to the scenario analysis, which included 5 alternative scenarios; and (3) the aggregation (scaling-up) of the scenario analysis to the EU-27 sectoral impact.
The results of the farm survey served as a foundation for the assessments, which were further enriched by additional data and information gathered from various sources, including a review of the literature on the efficiency of different farrowing systems, data from farmers’ organisations in the EU countries, opinions from a group of pig production experts representing Wageningen University (the Netherlands), the InterPIG global network, and Warsaw University of Life Sciences (Poland), as well as pig production companies experienced in the transition.
The farm survey, conducted with a questionnaire specifically designed for this purpose, served as the primary data source for analysing the phasing out of farrowing crates in EU pig production. The questionnaire covered various aspects of pig production, including the following:
  • farm characteristics, such as the size of the sow herd, the number of stands for sows and fattening pigs, and the size of farrowing pens and farrowing areas;
  • technical production parameters, including sales of piglets, sows, and fatteners; the number of litters per sow; the number of piglets born alive/dead; piglet mortality; culling rates; and piglets weaned per litter;
  • prices of inputs, such as labour and feed for the sows and gilt;
  • inputs, including the feed intake for sows during the lactation period, labour during farrowing, and veterinary costs, including medicines;
  • statements from farmers regarding their future decisions if the use of crates is banned.
The survey was conducted using various methods, including online or paper questionnaires and face-to-face or telephone interviews. The primary goal was to collect data characterising the pig farrowing section of the production system and to understand farmers’ plans and preferences regarding alternative free-farrowing systems. The option for farmers to declare an ‘exit’ from pig production and shift to pig fattening was also introduced.
Initially, the survey was intended to be conducted in all the EU member states. However, according to the EU pig sector statistics, several countries with a negligible share in the EU sow herd, (less than 0.3%) were excluded (Cyprus, Estonia, Luxembourg, Malta, Slovakia, and Slovenia), as well as Sweden, which completely transitioned. The questionnaire was delivered through farmers’ organisations and conducted in the following countries:
  • Eastern European countries (Poland, Romania, Bulgaria, Hungary, Latvia, and Croatia);
  • Central and Western Europe (Austria, Belgium, France, Germany, Greece, Ireland, Italy, Portugal, Spain, and The Netherlands).
In addition to the farm survey sample parameters, many assumptions were made, as suggested by pig production experts, the literature, and data on free-farrowing housing systems obtained from pig companies. The assumptions pertained to changes in the efficiency and use of inputs after transitioning to free-farrowing systems. Farmers’ organisations were additional information sources, particularly in countries where the farm survey provided insufficient data. A separate survey for farmers’ organisations in all the studied countries was developed and distributed. Additionally, some parameters (e.g., veterinary costs per sow, labour costs, average prices, investment needs per place for sows) were obtained from the InterPIG 2021 database [32]. The InterPIG group collects country-level physical and financial data using a standardised methodology for comparing the cost of pig production across its member countries, including the main pig-producing countries in Europe and a few Eastern European EU countries (The InterPIG EU member states include Austria, Belgium, the Czech Republic, Denmark, France, Finland, Germany, Hungary, Ireland, Italy, The Netherlands, and Spain). The efficiency parameters from farm surveys were verified with the use of the InterPIG data.

3.2. Housing Systems and Parameters Considered in the Farm-Level Assessments

The reference serving as the basis for all the comparisons was a housing system with farrowing crates at the current space at the farm (every farm has a slightly different space allowance in farrowing pens). The alternative housing systems considered were as follows:
  • free-farrowing pens with temporary confinement (up to 5 days) and a 5.5 m2 space allowance;
  • free-farrowing pens with no confinement and a 7 m2 space allowance.
In the survey, farmers were offered the choice to transition to pig fattening or to announce their withdrawal from pig production (exit).
The key parameters used for the assessments, with values for existing systems with farrowing crates = 100%, included the following:
  • piglet mortality: +15% (in free-farrowing systems with confinement) and +20% (in free-farrowing systems with no confinement;
  • number of litters per sow/year: −1.9%;
  • mortality of sows: +5%;
  • culling-out percentage: +15%;
  • feed consumption during the lactation period (28 days): +7.3%;
  • labour input: +1 min/sow/day during lactation in systems with confinement; +2 min/sow/day in systems with no confinement;
  • veterinary-medicine costs: +7.5%;
  • average basic cost of new farrowing pens: EUR 1700, with a depreciation period of 15 years, plus the costs for reconstructing existing buildings, averaging to EUR 1800 per pen but depending on the scenario and the region (EU-East/EU-West), ranging from EUR 1623 to EUR 2146, depreciated over 25 years;
  • depreciation of the existing buildings in 25 years.
  • Additional costs considered in alternative farrowing systems compared to crates included the following:
  • variable costs: additional labour costs, increased feed costs during the lactation period, increased vet-med costs, and increased cost of sow replacement;
  • cost for investing in new farrowing pens;
  • cost for rebuilding existing places to install new pens (e.g., floor modifications);
  • depreciation of the existing building.

3.3. Scenarios of Transition at Farm Level and EU Sector Level

In the farm-level aggregation of the results, five alternative scenarios to farrowing-rate scenarios were investigated. For all the financial projections in these scenarios, fixed 2021 prices were used. The farm survey served as the basis for the estimation of the technical assessment parameters, which were then projected with inputs according to the literature and provided by experts and farmers’ organisations. Market factors remained constant as of 2021.
All five scenarios depict a hypothetical situation following the transition to alternative housing systems. The scenarios are described as follows:
Baseline (Farrowing Crates): assumes that sows are kept in pens with farrowing crates, as was found at the surveyed farms.
Scenario S1conf: “All farms switch to the free-farrowing system with temporary confinement“. It is assumed that all the farms in the sample will stay in production and that all will switch to the free-farrowing system with temporary confinement (pen size: 5.5 m2).
Scenario S2no-conf: “All farms switch to a free-farrowing system with no confinement”. It is assumed that all the surveyed farms will stay in production and that all will switch to the free-farrowing system with no confinement (pen size: min. 7 m2).
Scenario S3exit: “All the farm declarations of a switch to alternative housing systems were included”. All the declarations regarding farmers’ decisions were taken into account, as reported in Table 2. Farmers were choosing between: (a) the transition to a free-farrowing system with temporary confinement; (b) the transition to a free-farrowing system with no confinement; (c) the transition to pig fattening only; (d) exit from pig production (the respective number of sows was eliminated from the total number of pigs in the sample).
Scenario S4modified: “Modified S3 Scenario”. It is highly possible that several farmers who declared their intention to leave did so because they were frustrated by the anticipated regulatory changes. The extremely high percentage of exits reported by farmers appears to be partially a sign of their disappointment and perhaps displeasure over the restriction. The more in-depth examination of the group of farmers who made these assertions (see Table 2) supports such a conclusion. These farmers included some who were young and/or had successors, as well as some who owned sizable sow herds. Unlike farmers from small farms who are elderly and without heirs, we assume that these farmers are less likely to quit pig farming.
Therefore, in the S4 scenario, it is assumed that in reality, the farmers’ decisions will be less radical and that the number of ‘exits’ will be lower than reported in the survey. Declarations of other decisions remained unchanged, as in Scenario S3. The procedure of modification is presented below.
We calculated the number of farmers who intend to continue producing, notwithstanding survey respondents’ “exit” declarations, as in Scenario S3. Three factors were simultaneously taken into account, using linear interpolation to predict exit probabilities as follows:
  • number of sows at the farm: if fewer than 50—the probability of exit is 100%, if more than 500—it is 0%;
  • age of the farmer: if the farmer is younger than 45 years old—0%, if older than 60 years old—it is 100%;
  • likelihood of a successor in the family, expressed as a percentage of the likelihood—if no successor at all—the probability of exit is 100%, if succession is certain—it is 0%.
Entire farms were removed from the sample only if all three criteria together indicated a 100% probability. Farms having exit probabilities ranging from 0% to 100% had the associated number of sows removed from the sample. The choice of the system was presumed to be S1 (the free-farrowing system with temporary confinement) for farms that continued to be in operation. Assuming that farm managers can always be replaced, the sole factor considered for the selected pig production enterprises was the size of the herd.
Table 2 shows the breakdown of the farmer choices in Scenarios S3 and S4, as well as how many sows were affected by each choice. It is important to highlight that the proportion of farms declaring their intention to leave was substantially higher than the proportion of sows affected by these decisions. This is because the majority of the farmers who reported their exits were from small farms. Following this process, it was projected how many sows would remain in alternative housing systems following the transition in Scenarios S3 and S4.
Scenario S5capri: “Number of sows based on the CAPRI model results”. It is assumed that all the farmers will switch to alternative systems by (1 January) 2025. The 23.6% decrease in the EU-27 pork production from the CAPRI model solution [33,34] was used as a basis for determining the number of sows for farm-level assessments. This decrease differed between Western European member states (−21.2%) and Eastern EU countries (−37.2%), as presented by Potori et al. [33]. The methodology of the CAPRI estimation was published in [33] and in this paper, we use this estimation as a basis for aggregation in Scenario S5. For brevity, we refrain from presenting the CAPRI methodology herein.

3.4. Aggregation (Scaling-Up) Procedure

The findings of the farm-level calculations were aggregated to the EU sector level. The results were weighted based on the structure of the sow herd in the EU member states and the percentage of sows maintained in crates as of 2021 (Table 3).
Despite some differences in farm parameters and farmer decisions across countries, the results were presented for two geographical regions: EU-East (‘new’ EU member states from Central and Eastern Europe) and EU-West (all the remaining ‘old’ EU member states). Additionally, a group of seven major pig-producing countries (Spain, Denmark, Germany, the Netherlands, France, Italy, and Poland) was distinguished based on the number of sows in each country.

4. Results and Discussion

4.1. Farm Characteristics

Although the averages reported in Table 4 encompass a wide range of indicators observed across individual farms, there are no large disparities in the parameters describing various clusters of farms in the sample.
Performance parameters, such as piglets weaned per sow per year, often exhibit lower values in Eastern Europe and on smaller farms. Additionally, it is worth noting that the transition period expected for the EU-East is shorter compared with that expected for the EU-West (12 years versus 18 years). The difference can be attributed to less modernised farms in Eastern countries undergoing investment processes. Regardless of the system’s design, foreseen investments must be completed soon to maintain production.

4.2. Indicators Estimated for Alternative Farrowing Systems

Table 5 presents a selection of indicators for three farrowing systems: traditional crates and two alternative free-farrowing systems distinguished by pen size and the presence of confinement. Calculations were performed assuming the continuous operation of all the farms in the sample. As a result of the lower stocking density in alternative farrowing systems, the number of sows decreased by approximately 20% in systems with confinement and around 36% in systems without confinement. This reduction is attributed to the disparity between the current farrowing pen sizes on farms and the alternative sizes of 5.5 or 7 m2. Additionally, various other parameters changed in the alternative housing systems. Lastly, in a manner similar to that of the farm-sample analysis, the transition to free-farrowing systems led to an increase in the total estimated costs. These costs include selected variable costs related to the farrowing period, the depreciation of new investment, and the depreciation of existing buildings. Specifically, the cost per piglet weaned rose by approximately 34.5% in the case of farrowing systems with confinement and about 53.5% for systems without confinement. Notably, variations were simulated for farms with smaller or larger herds and across the western and eastern groups of countries, as shown in Table 5.

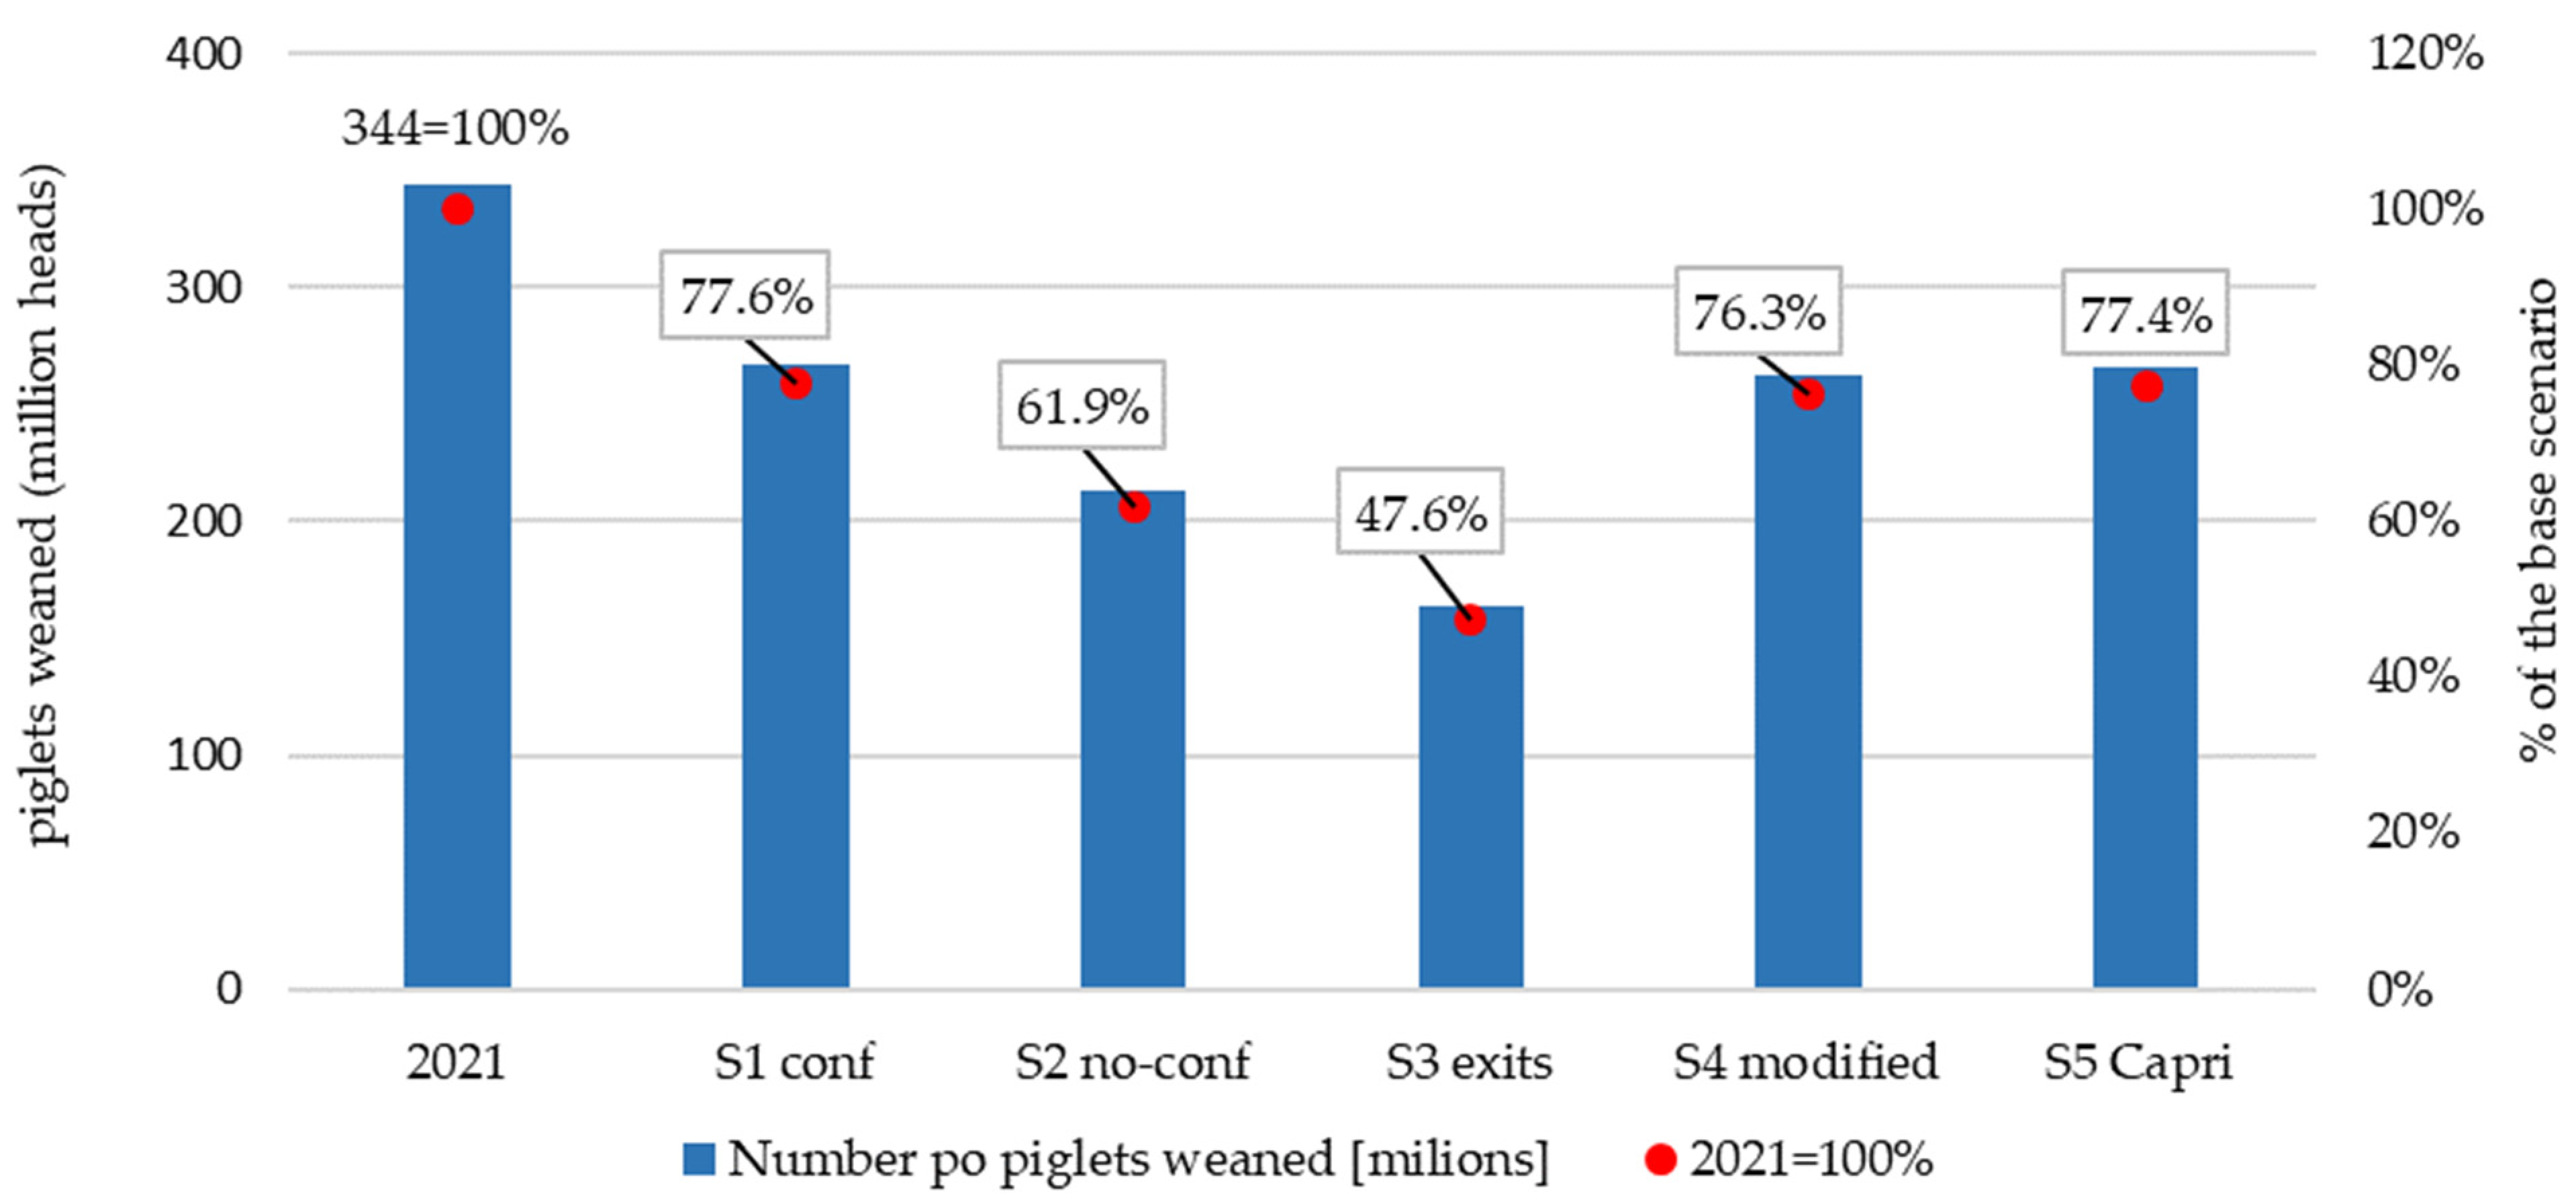
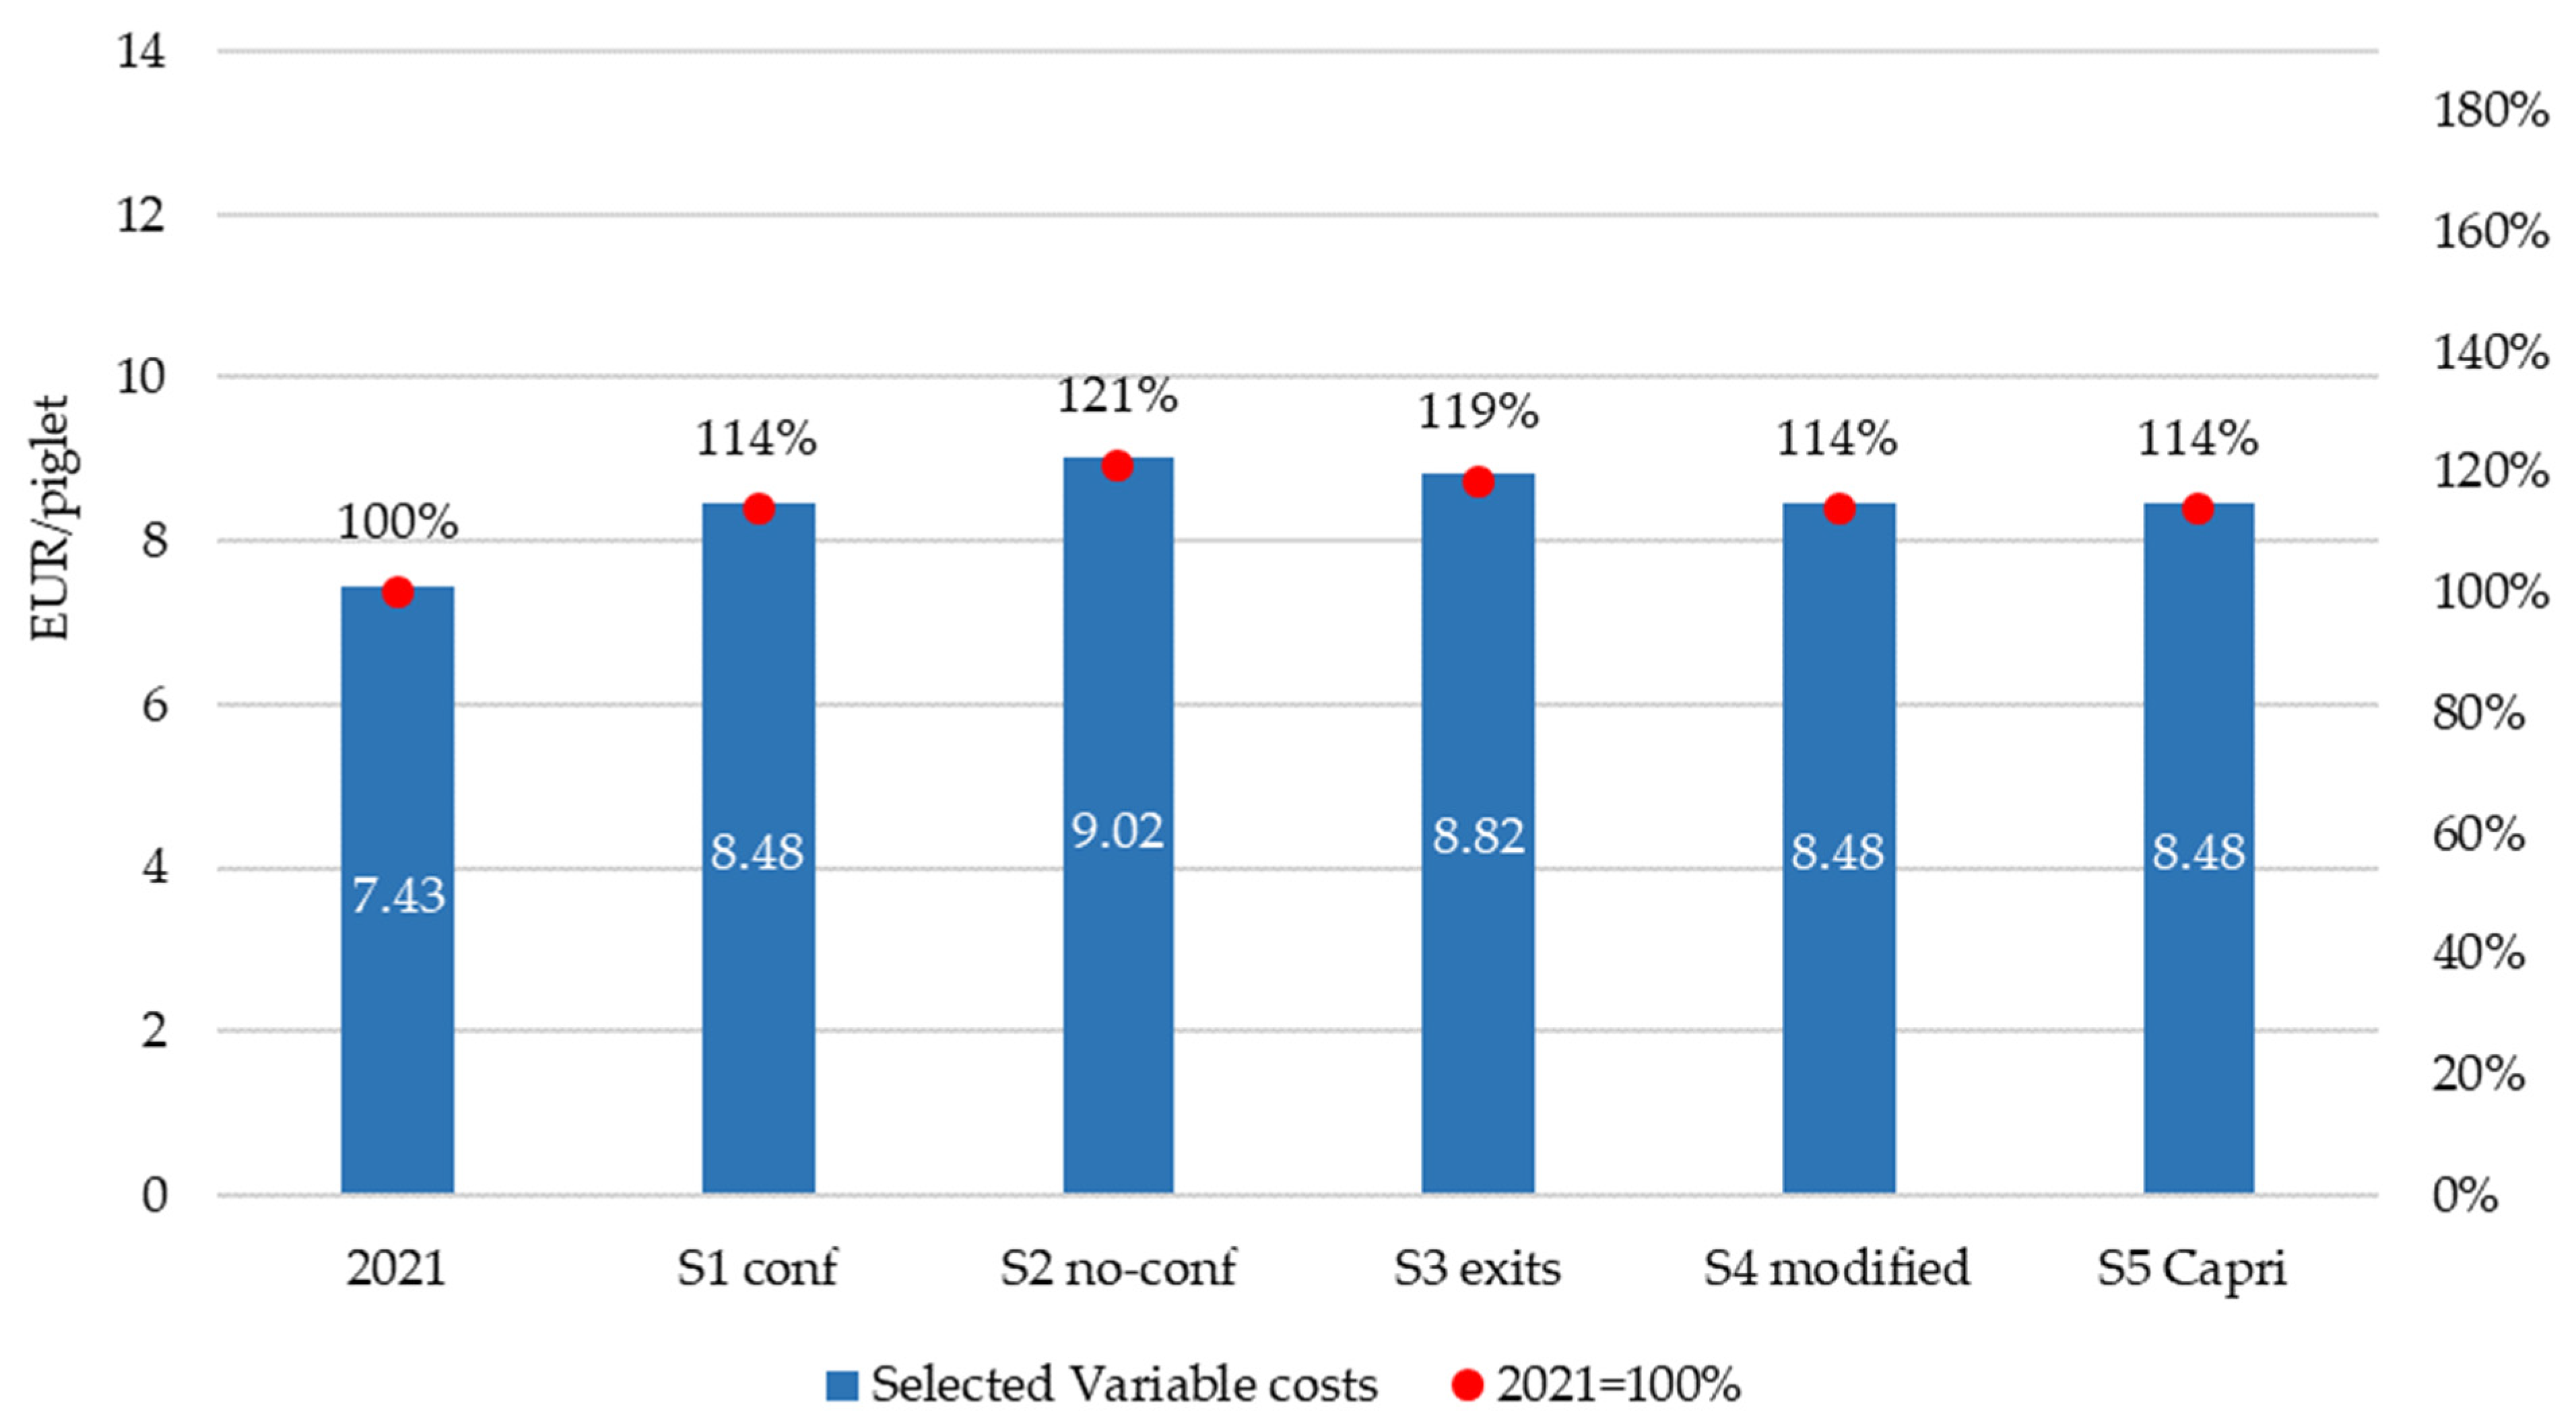
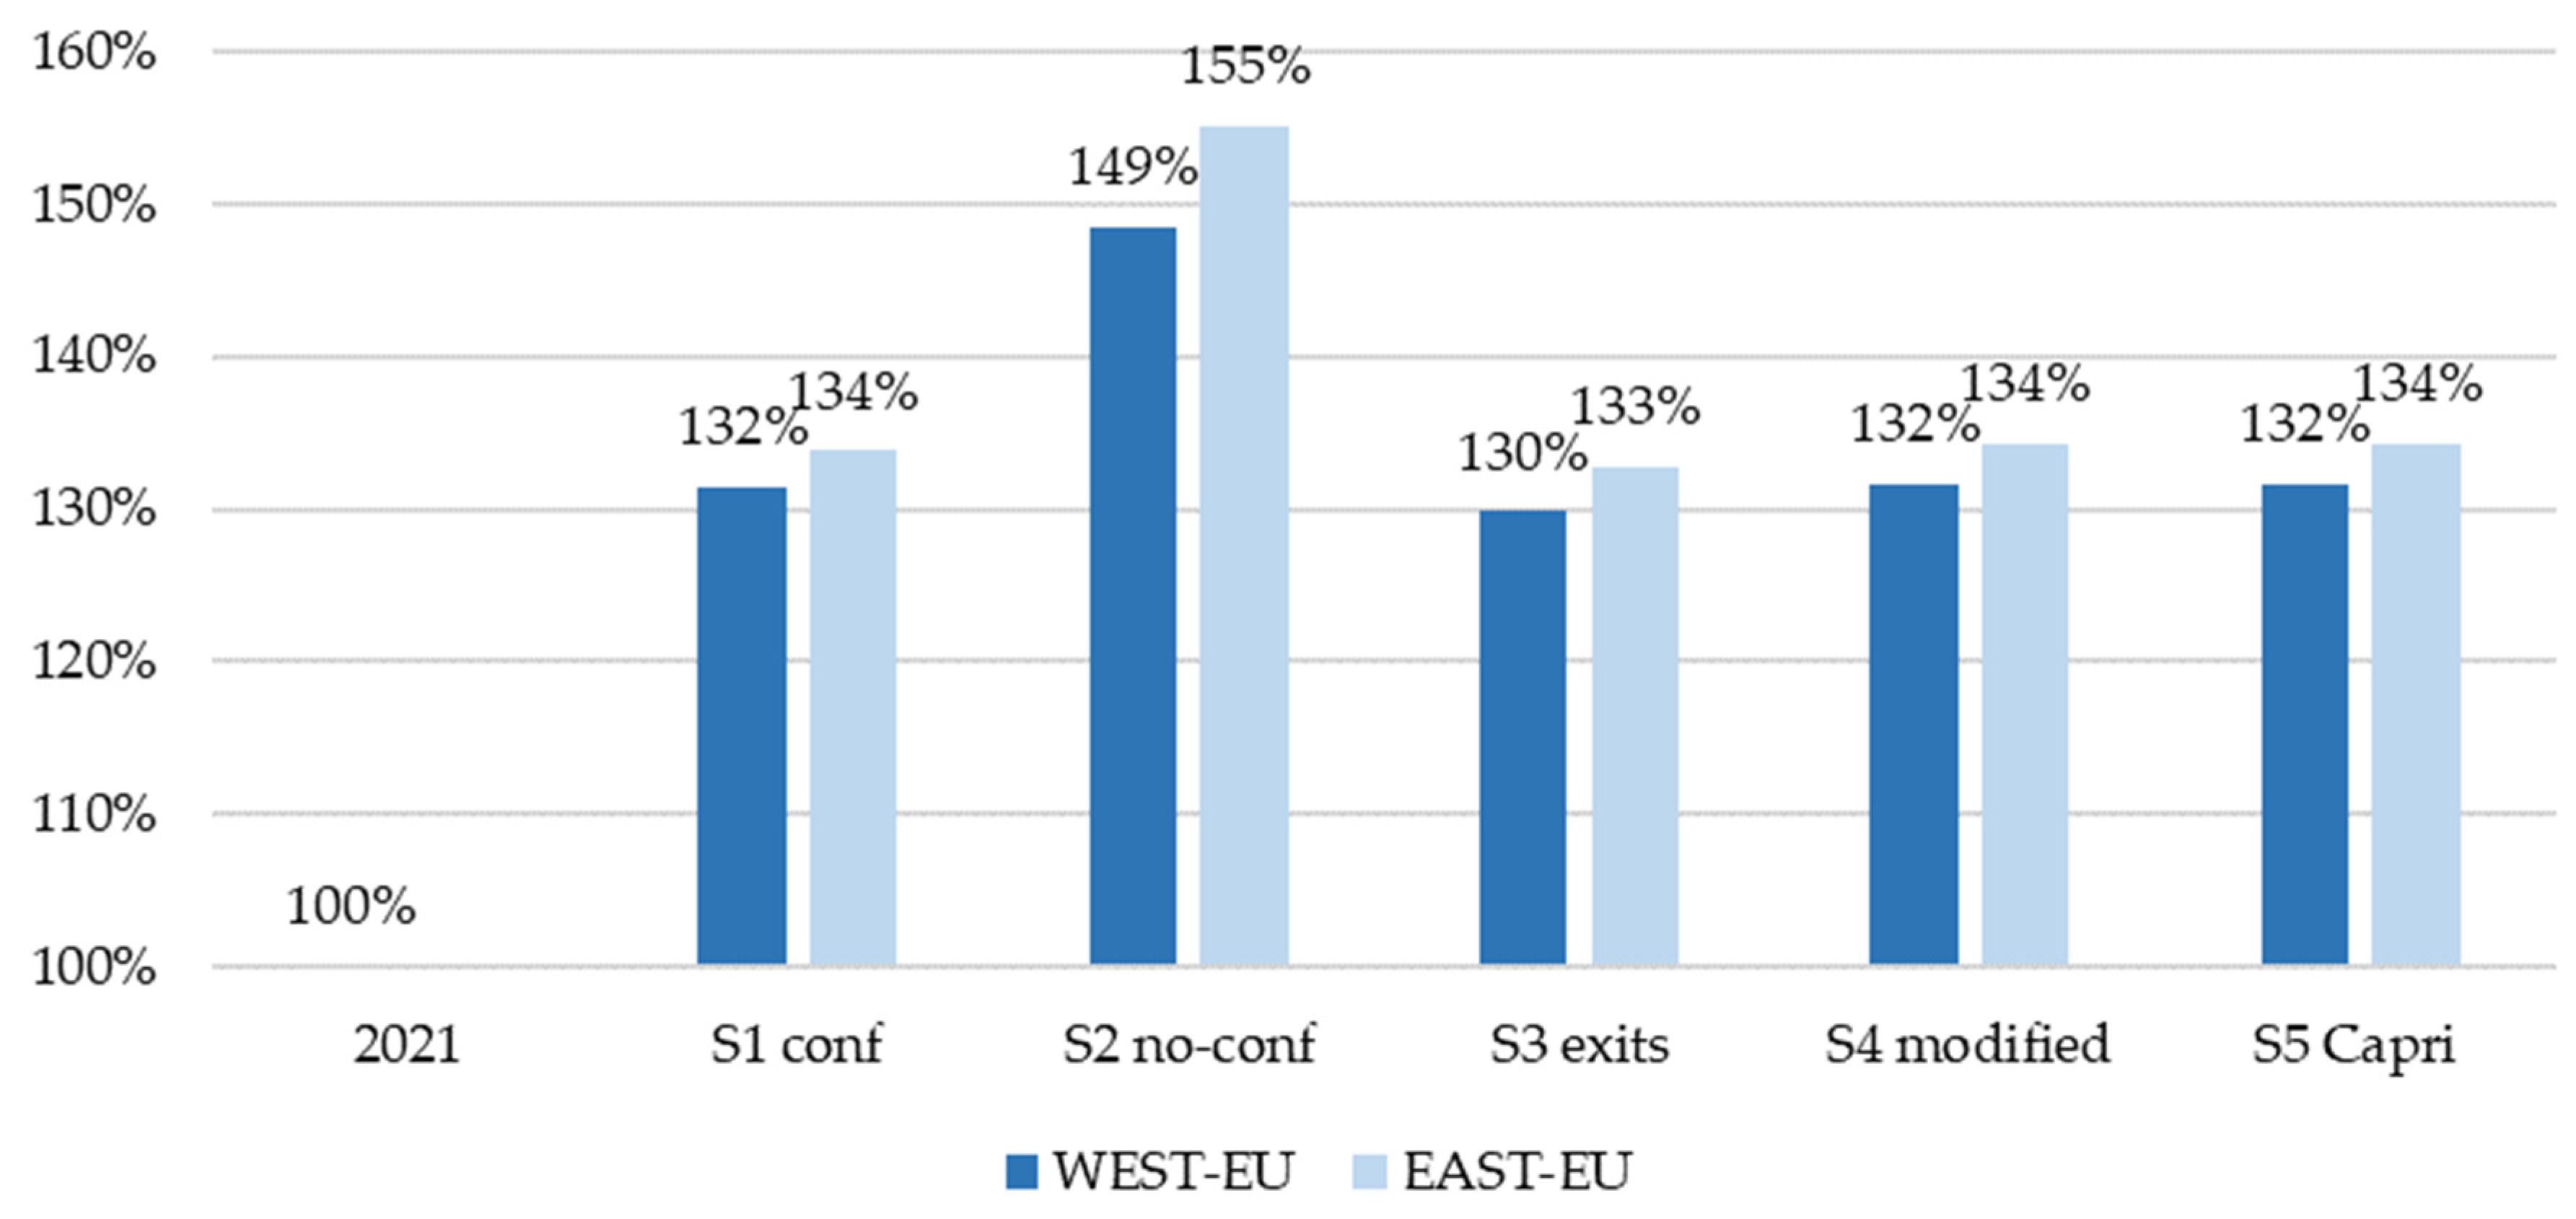
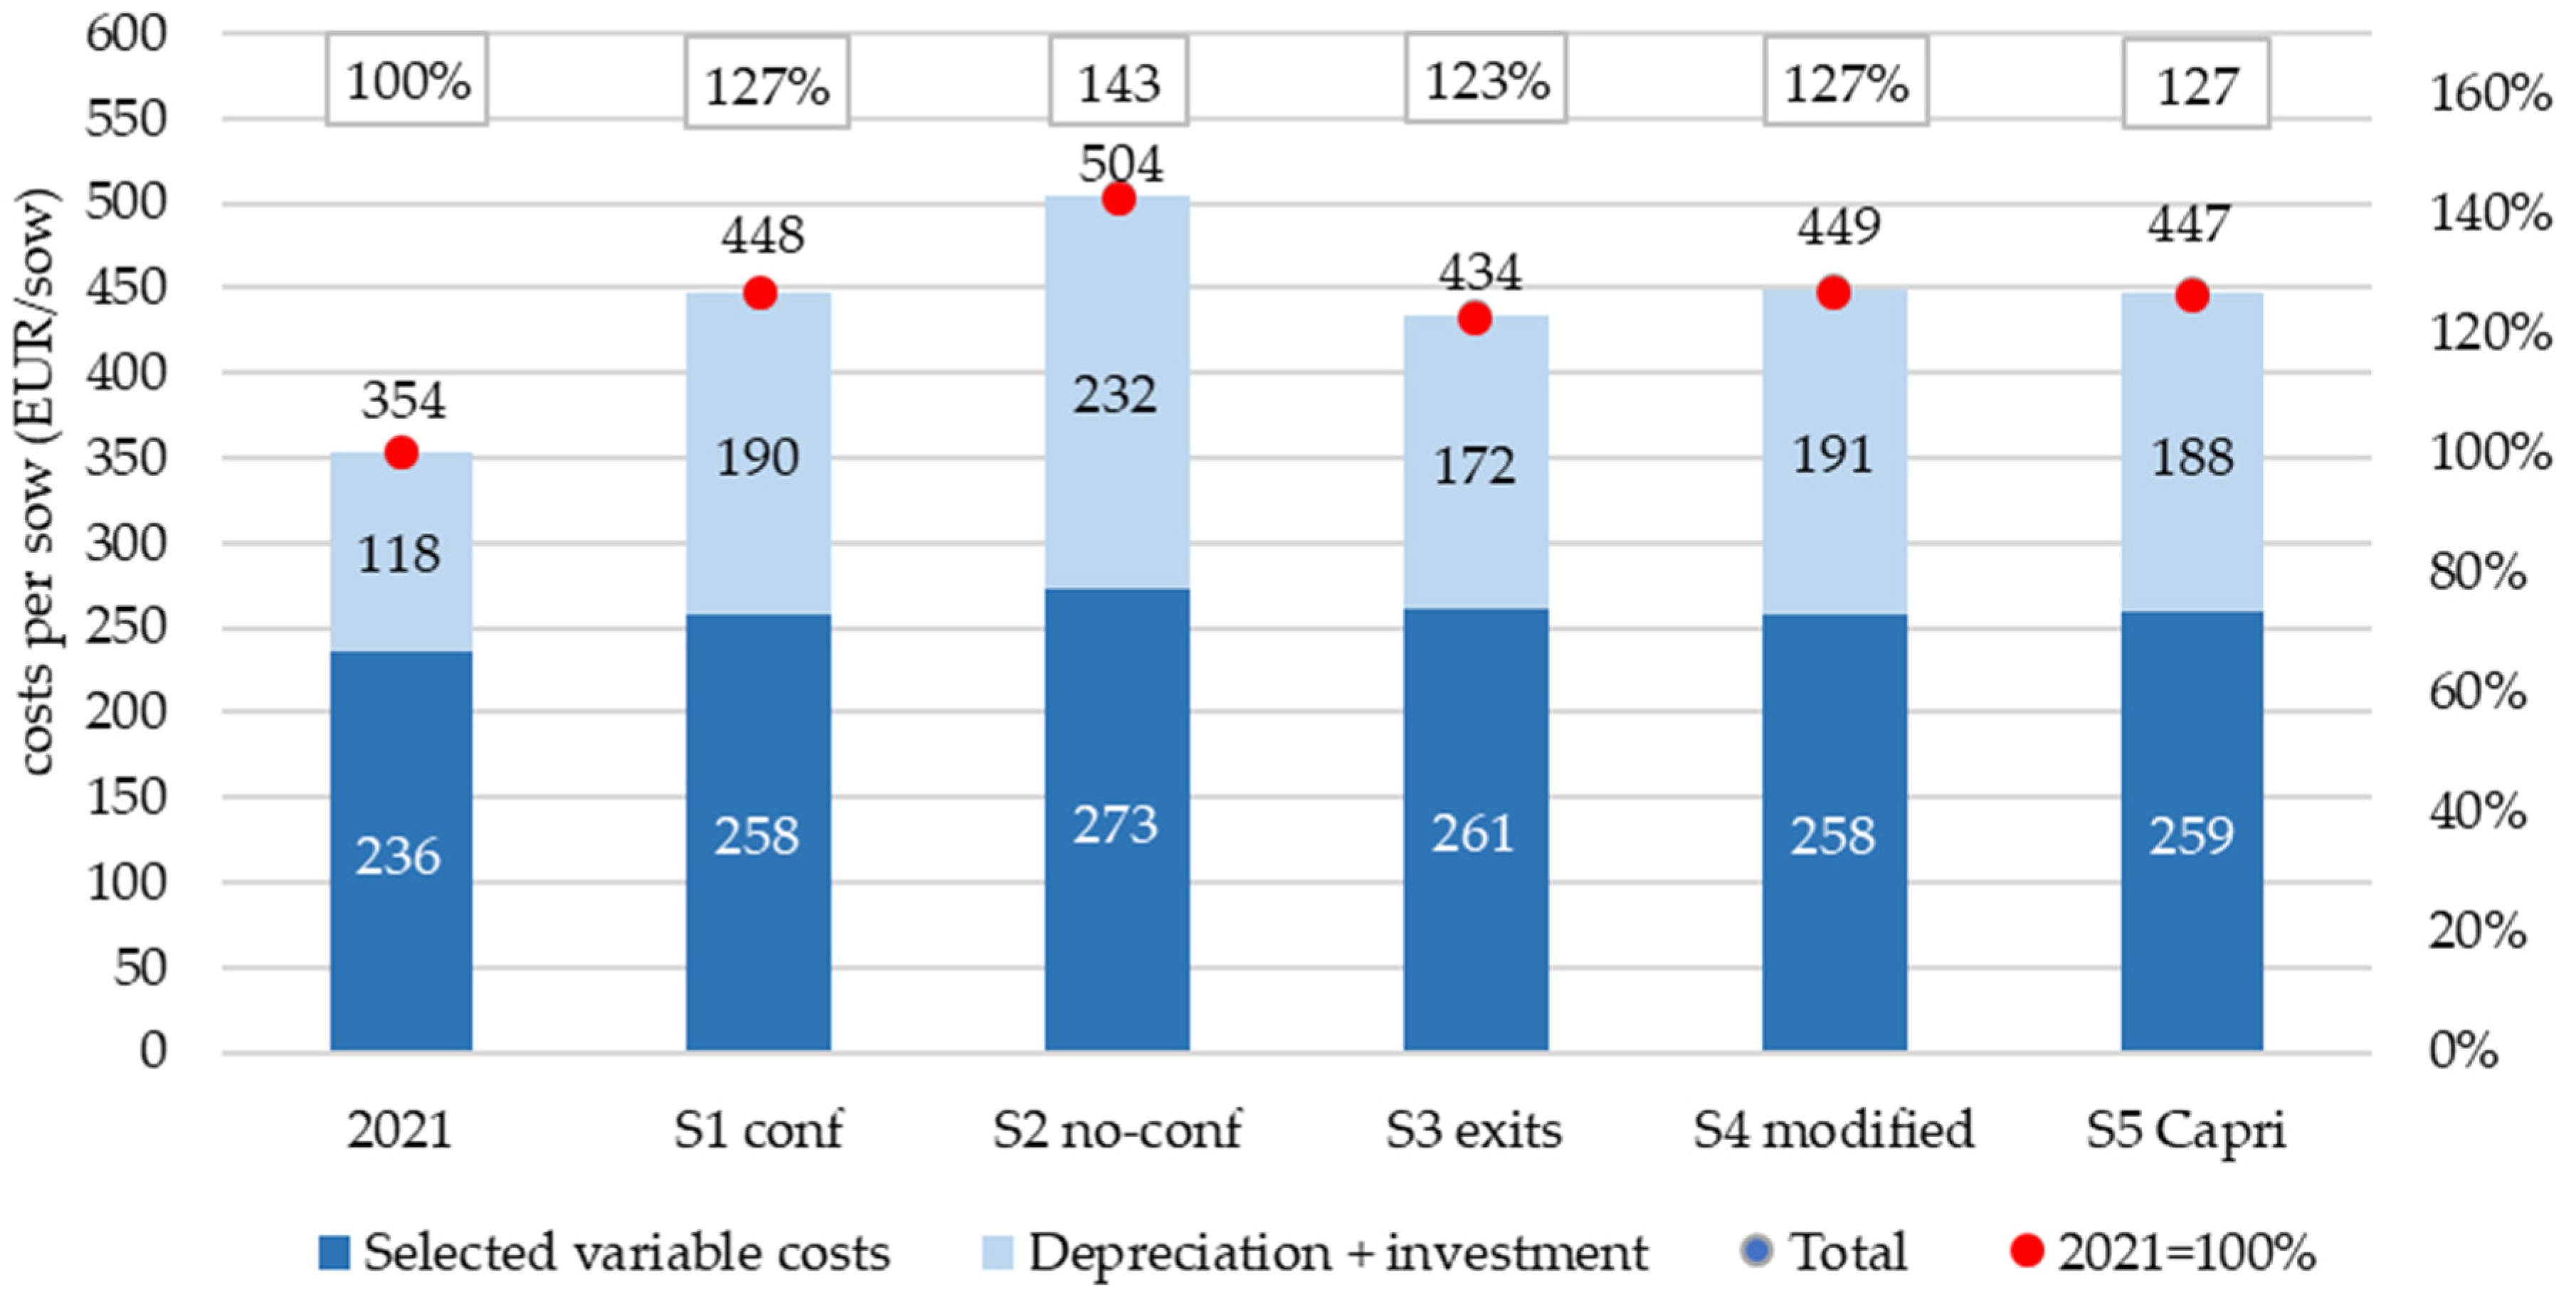
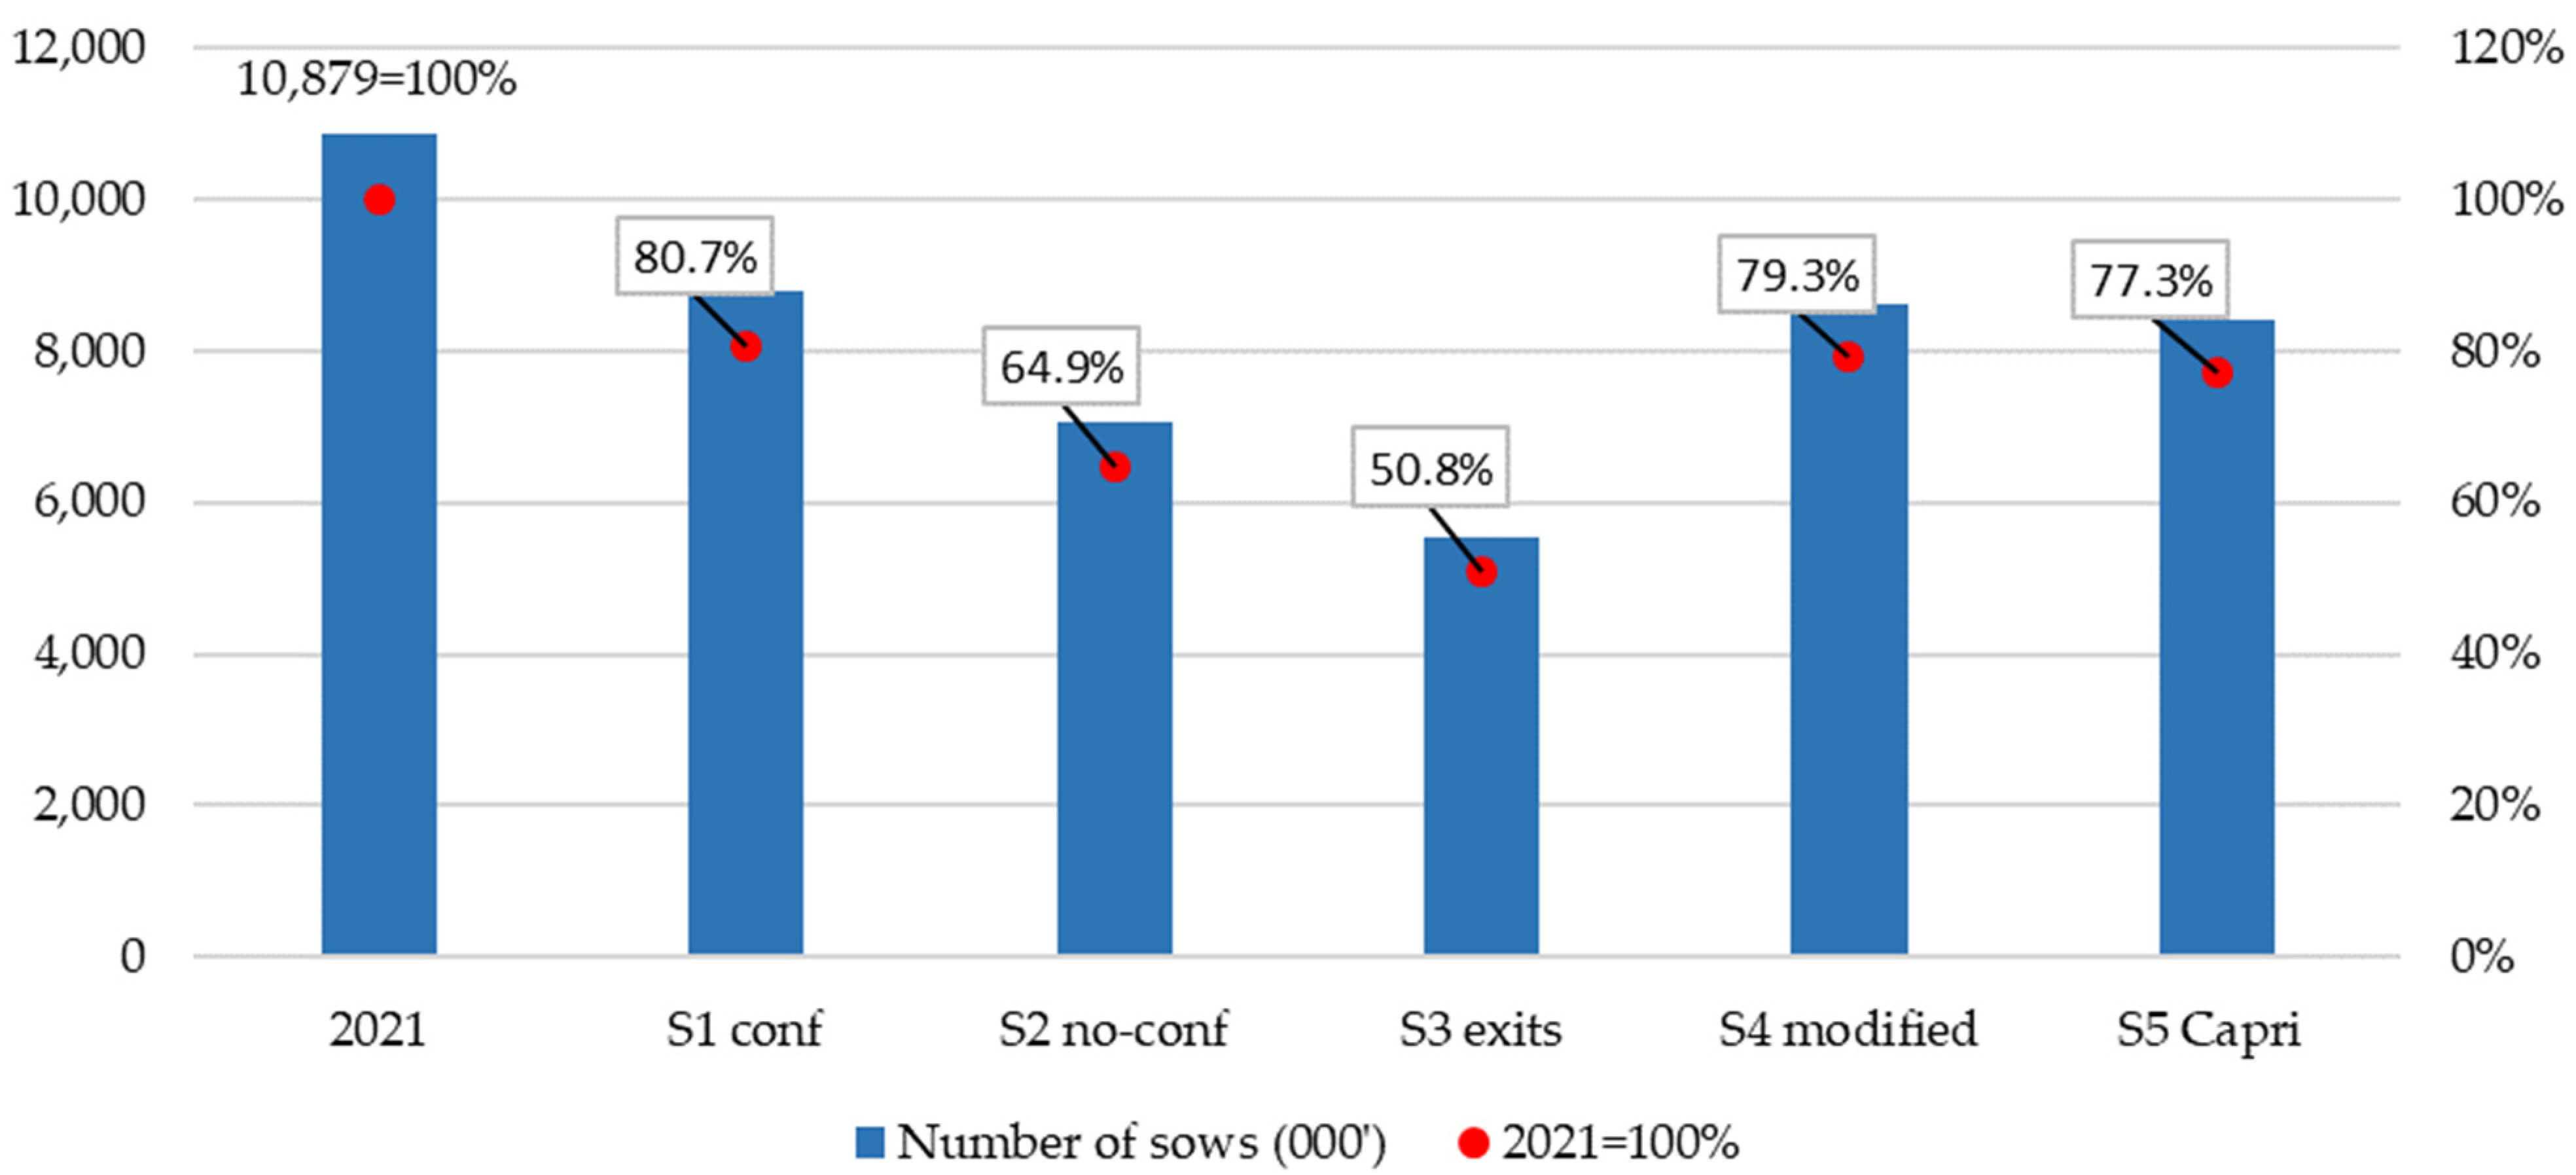
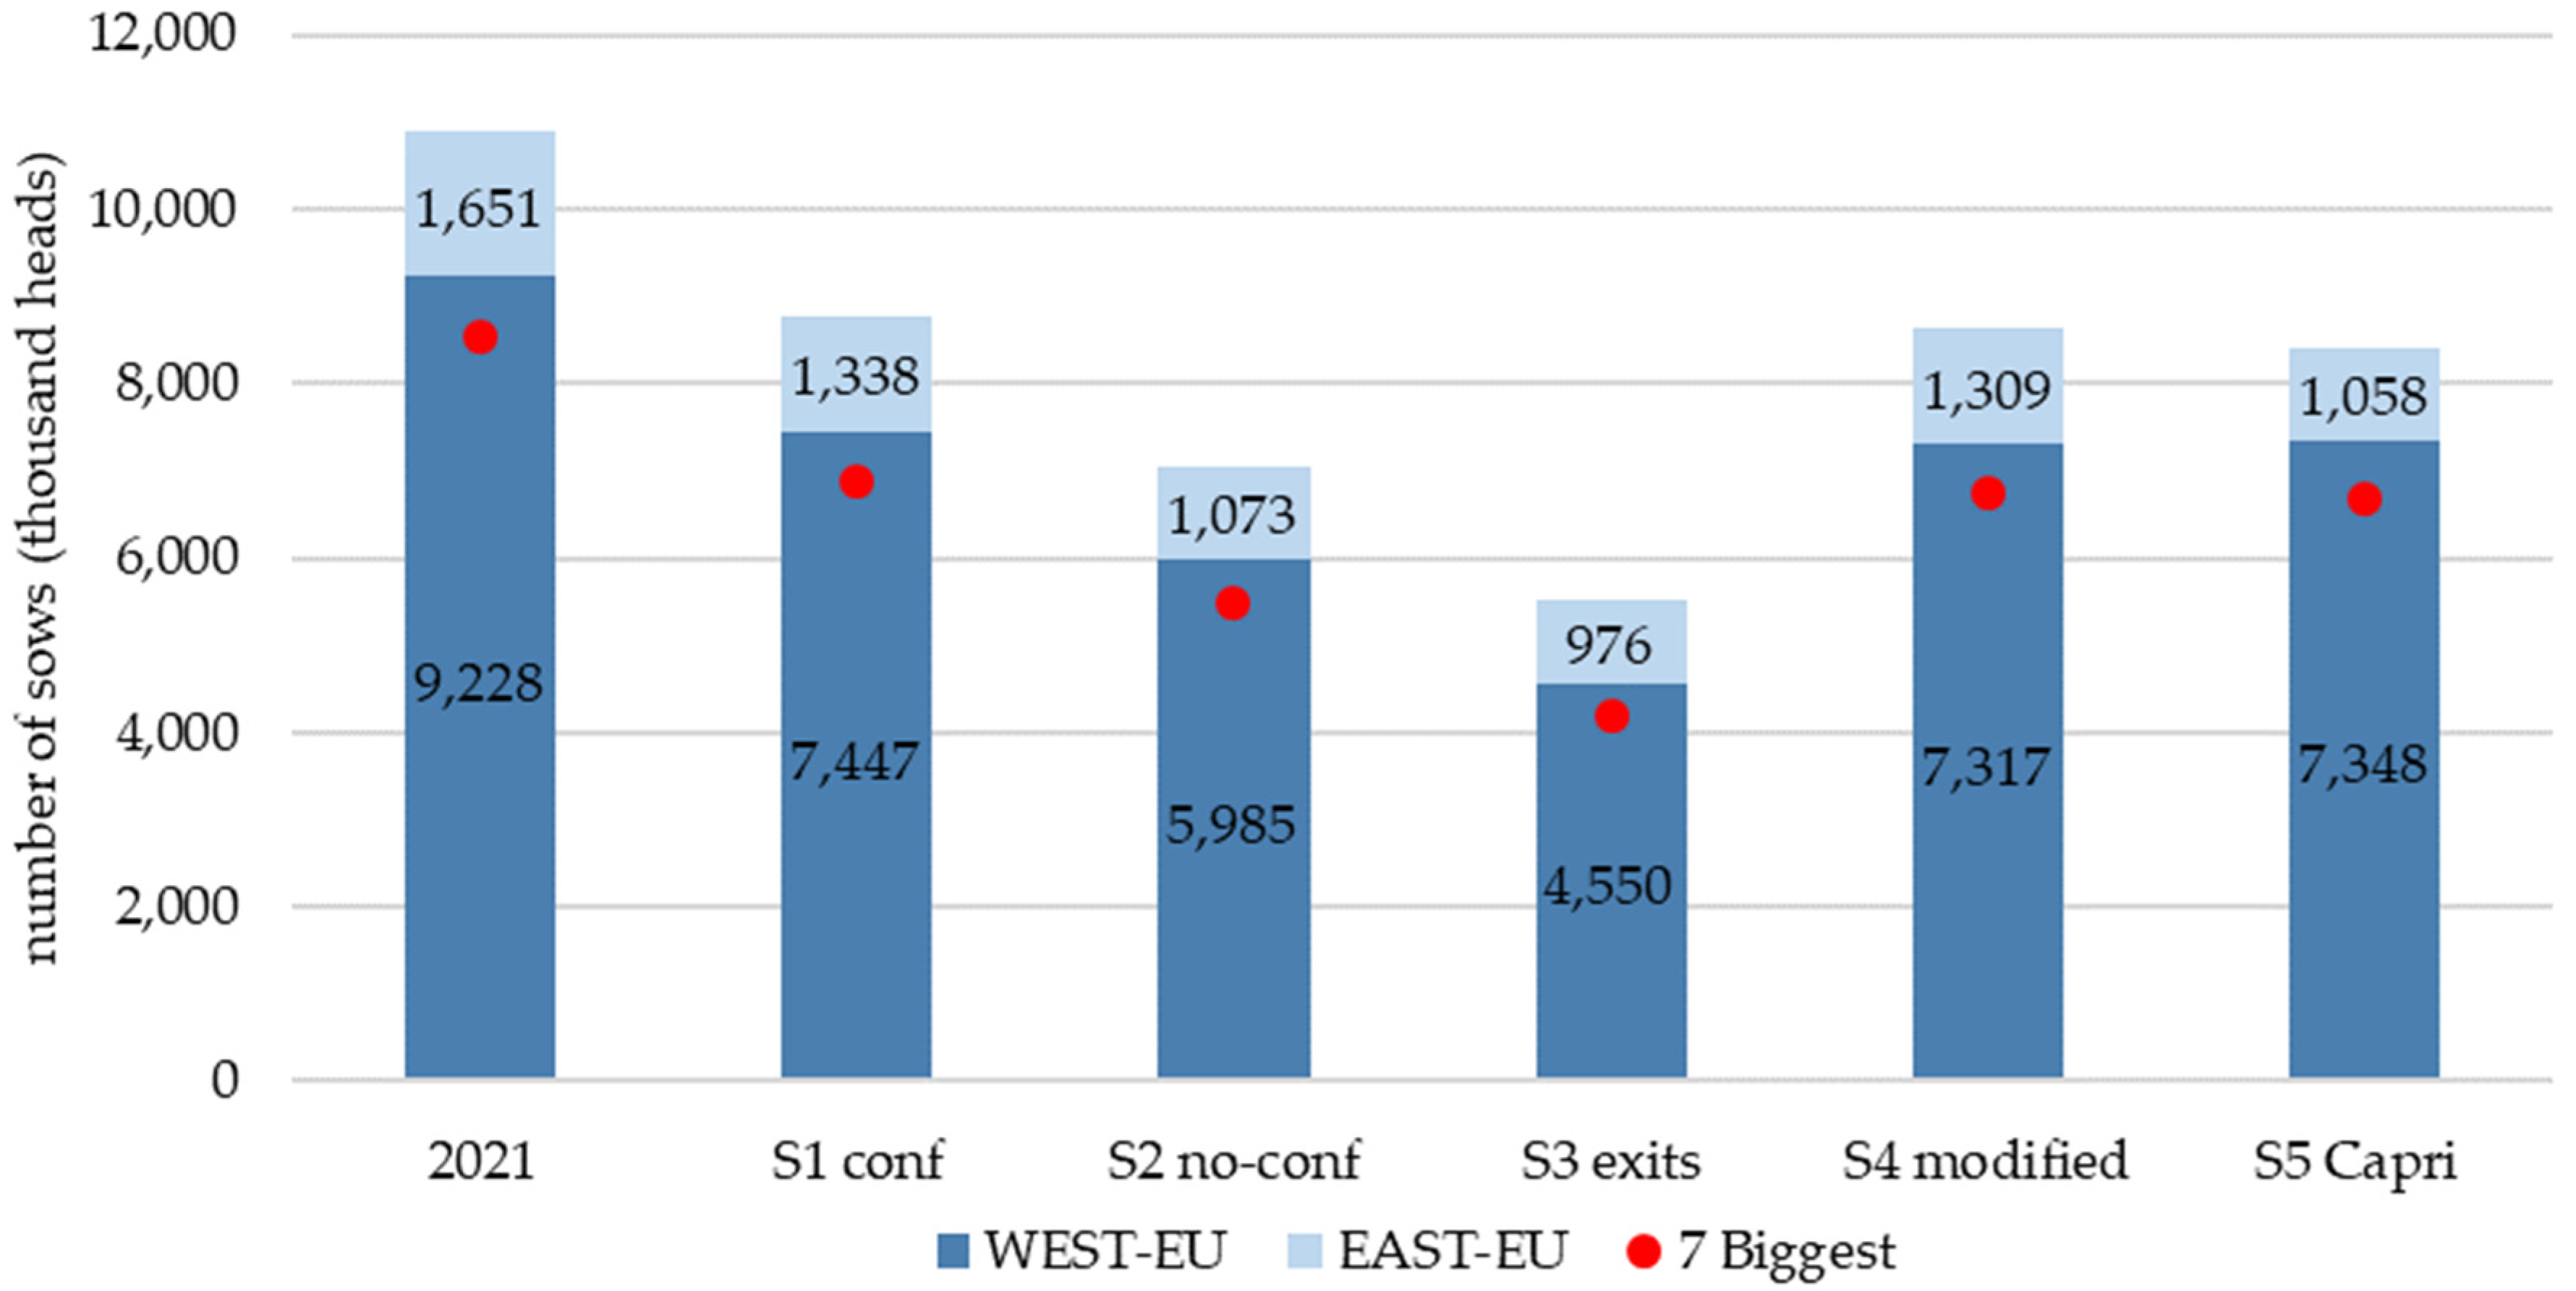
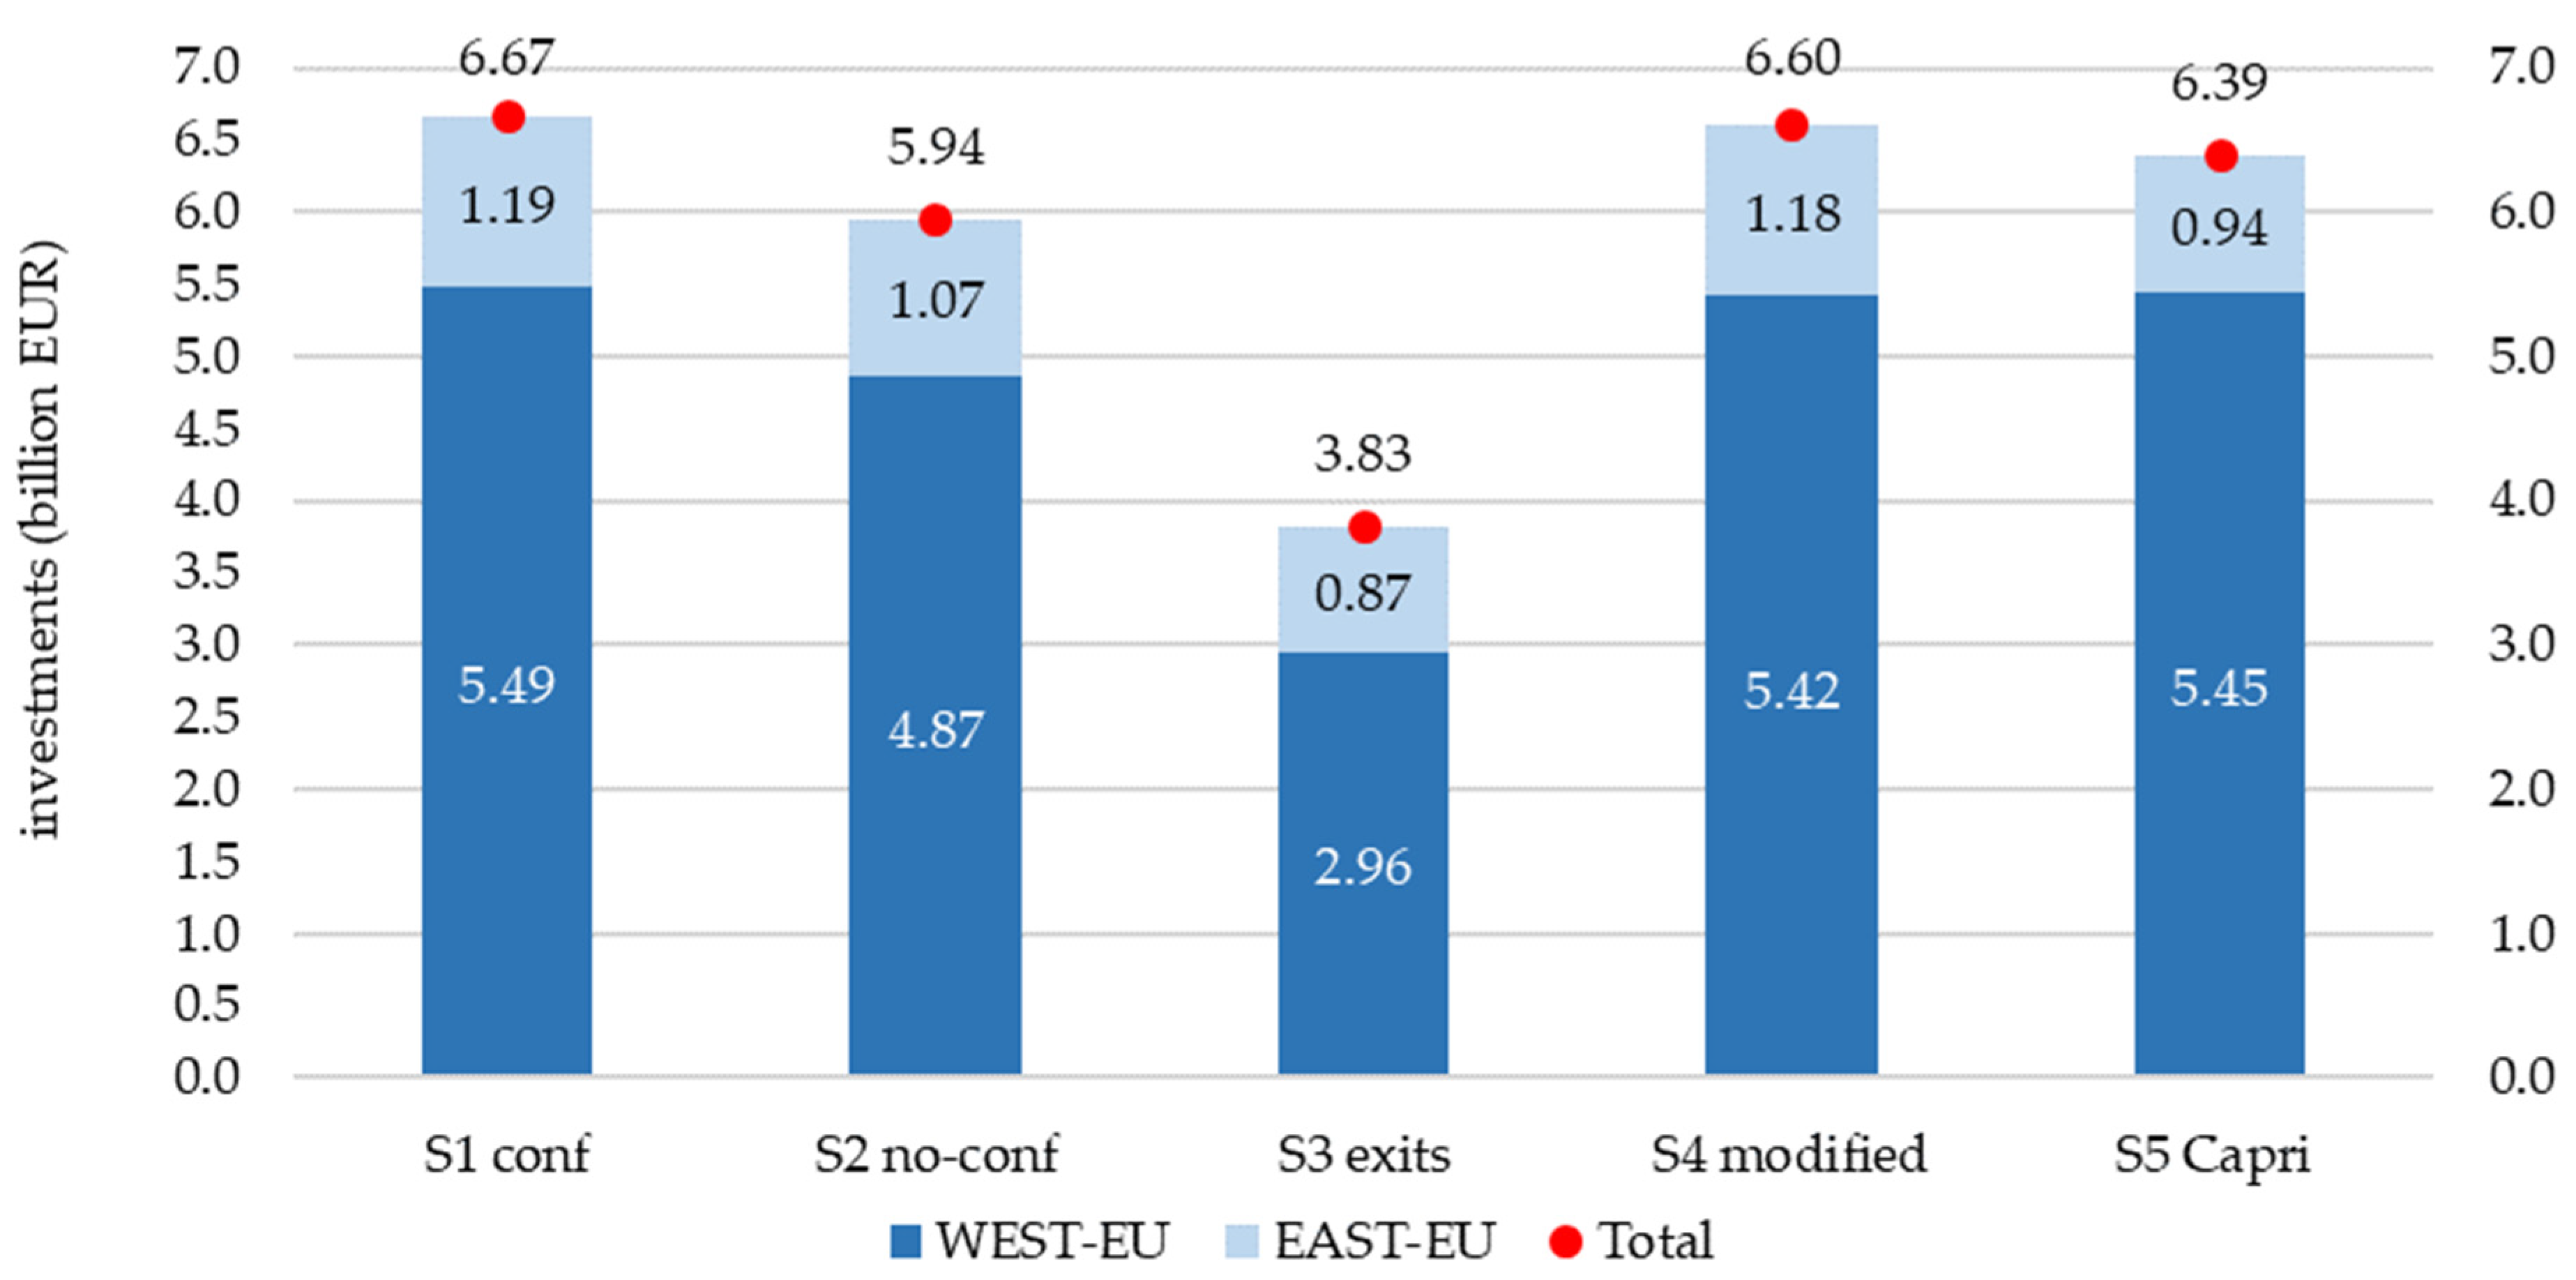
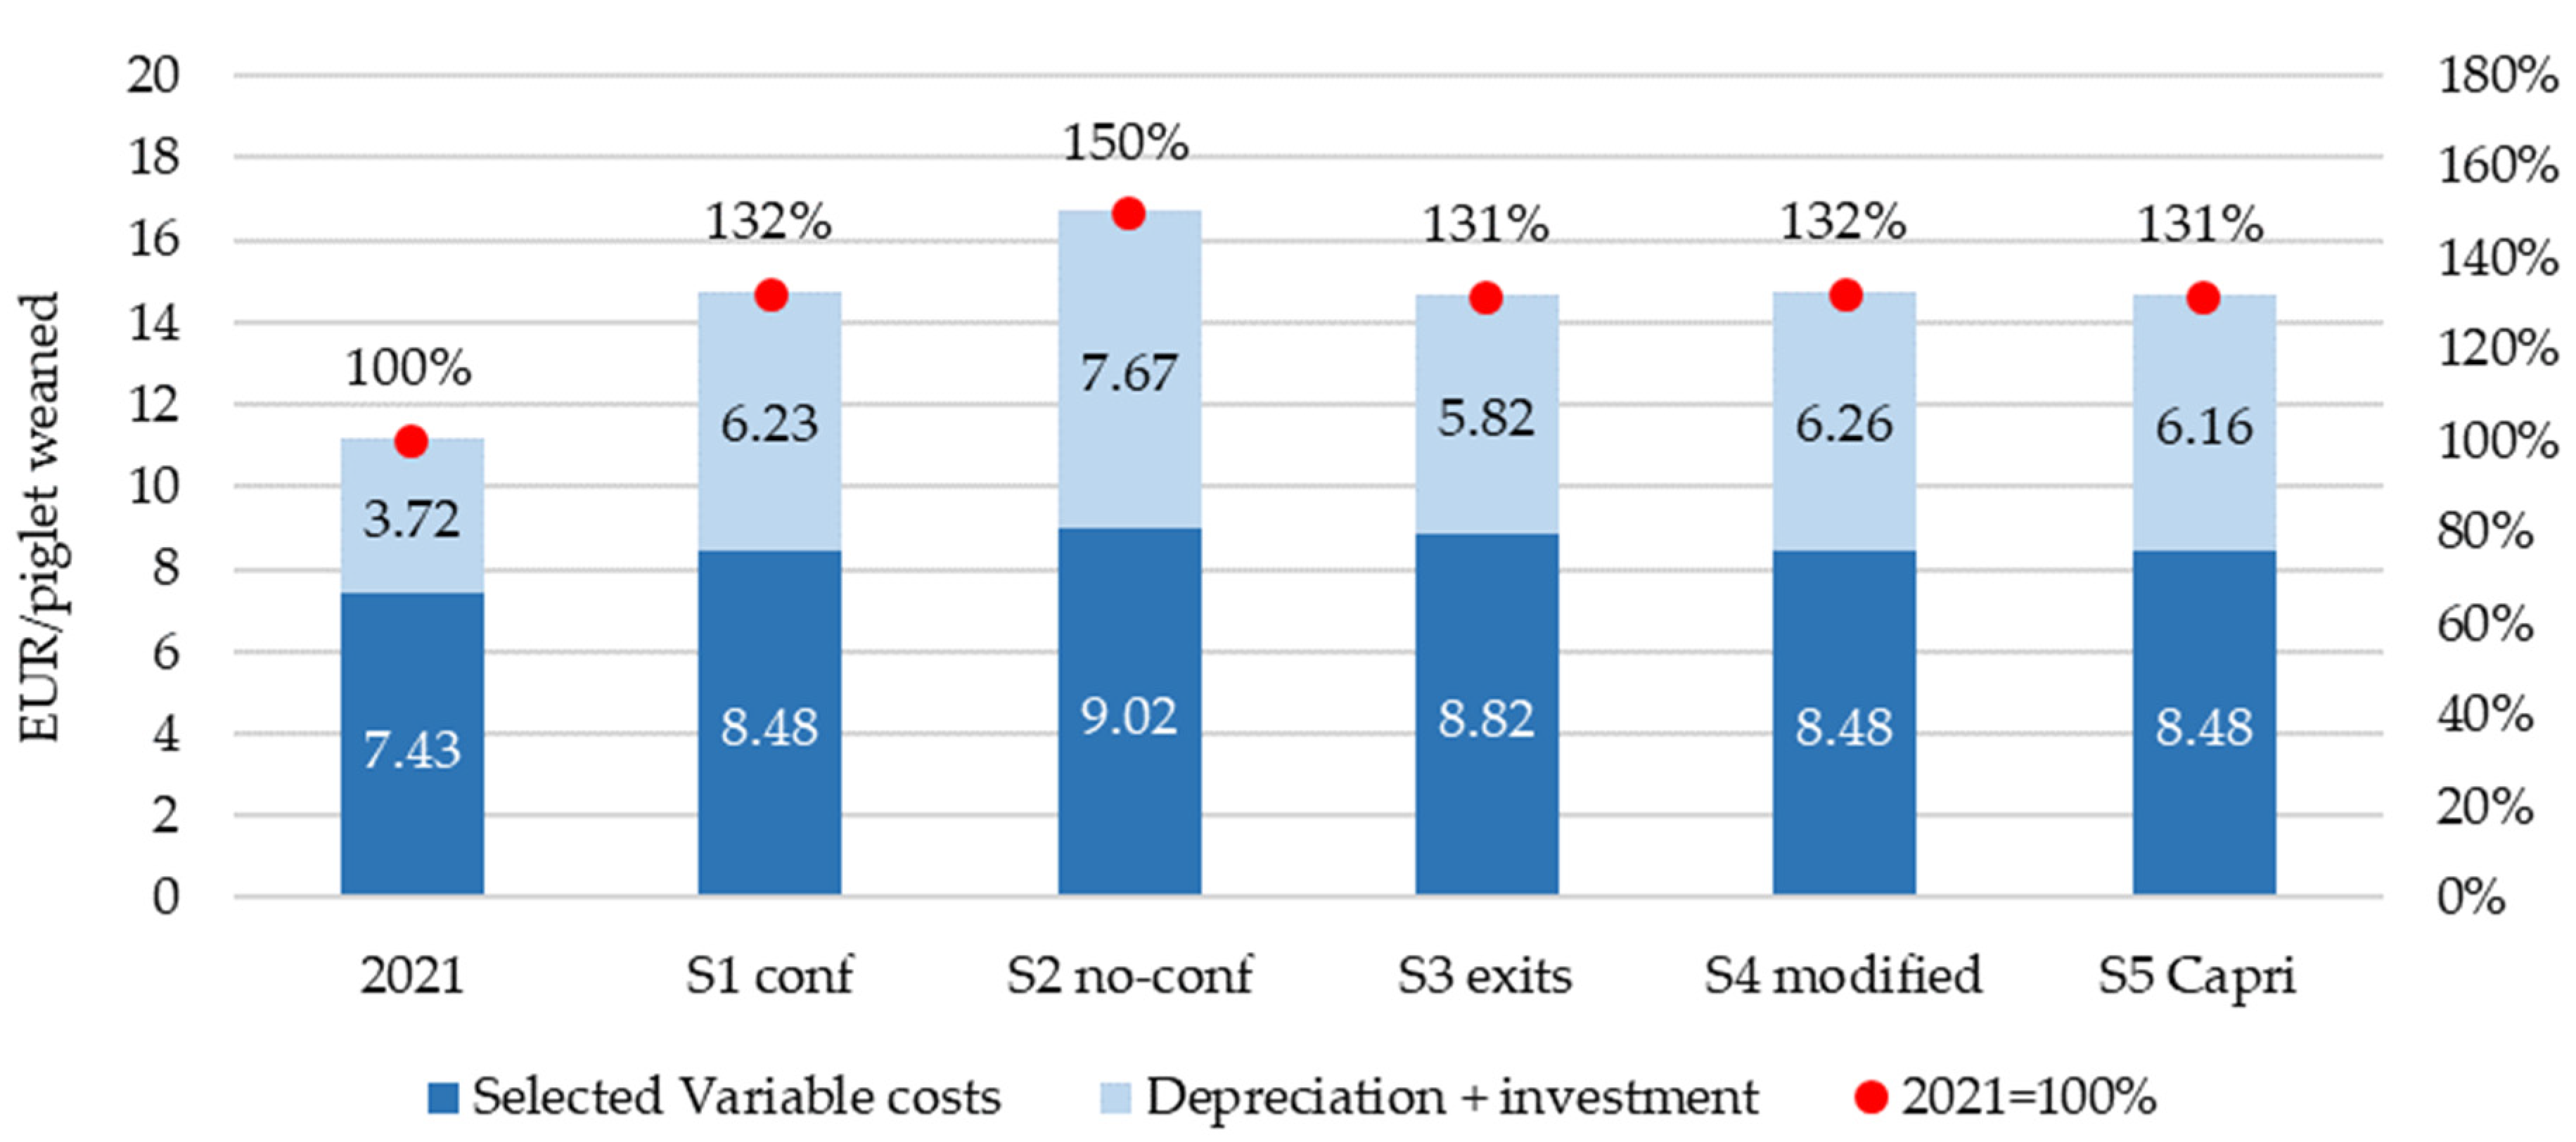
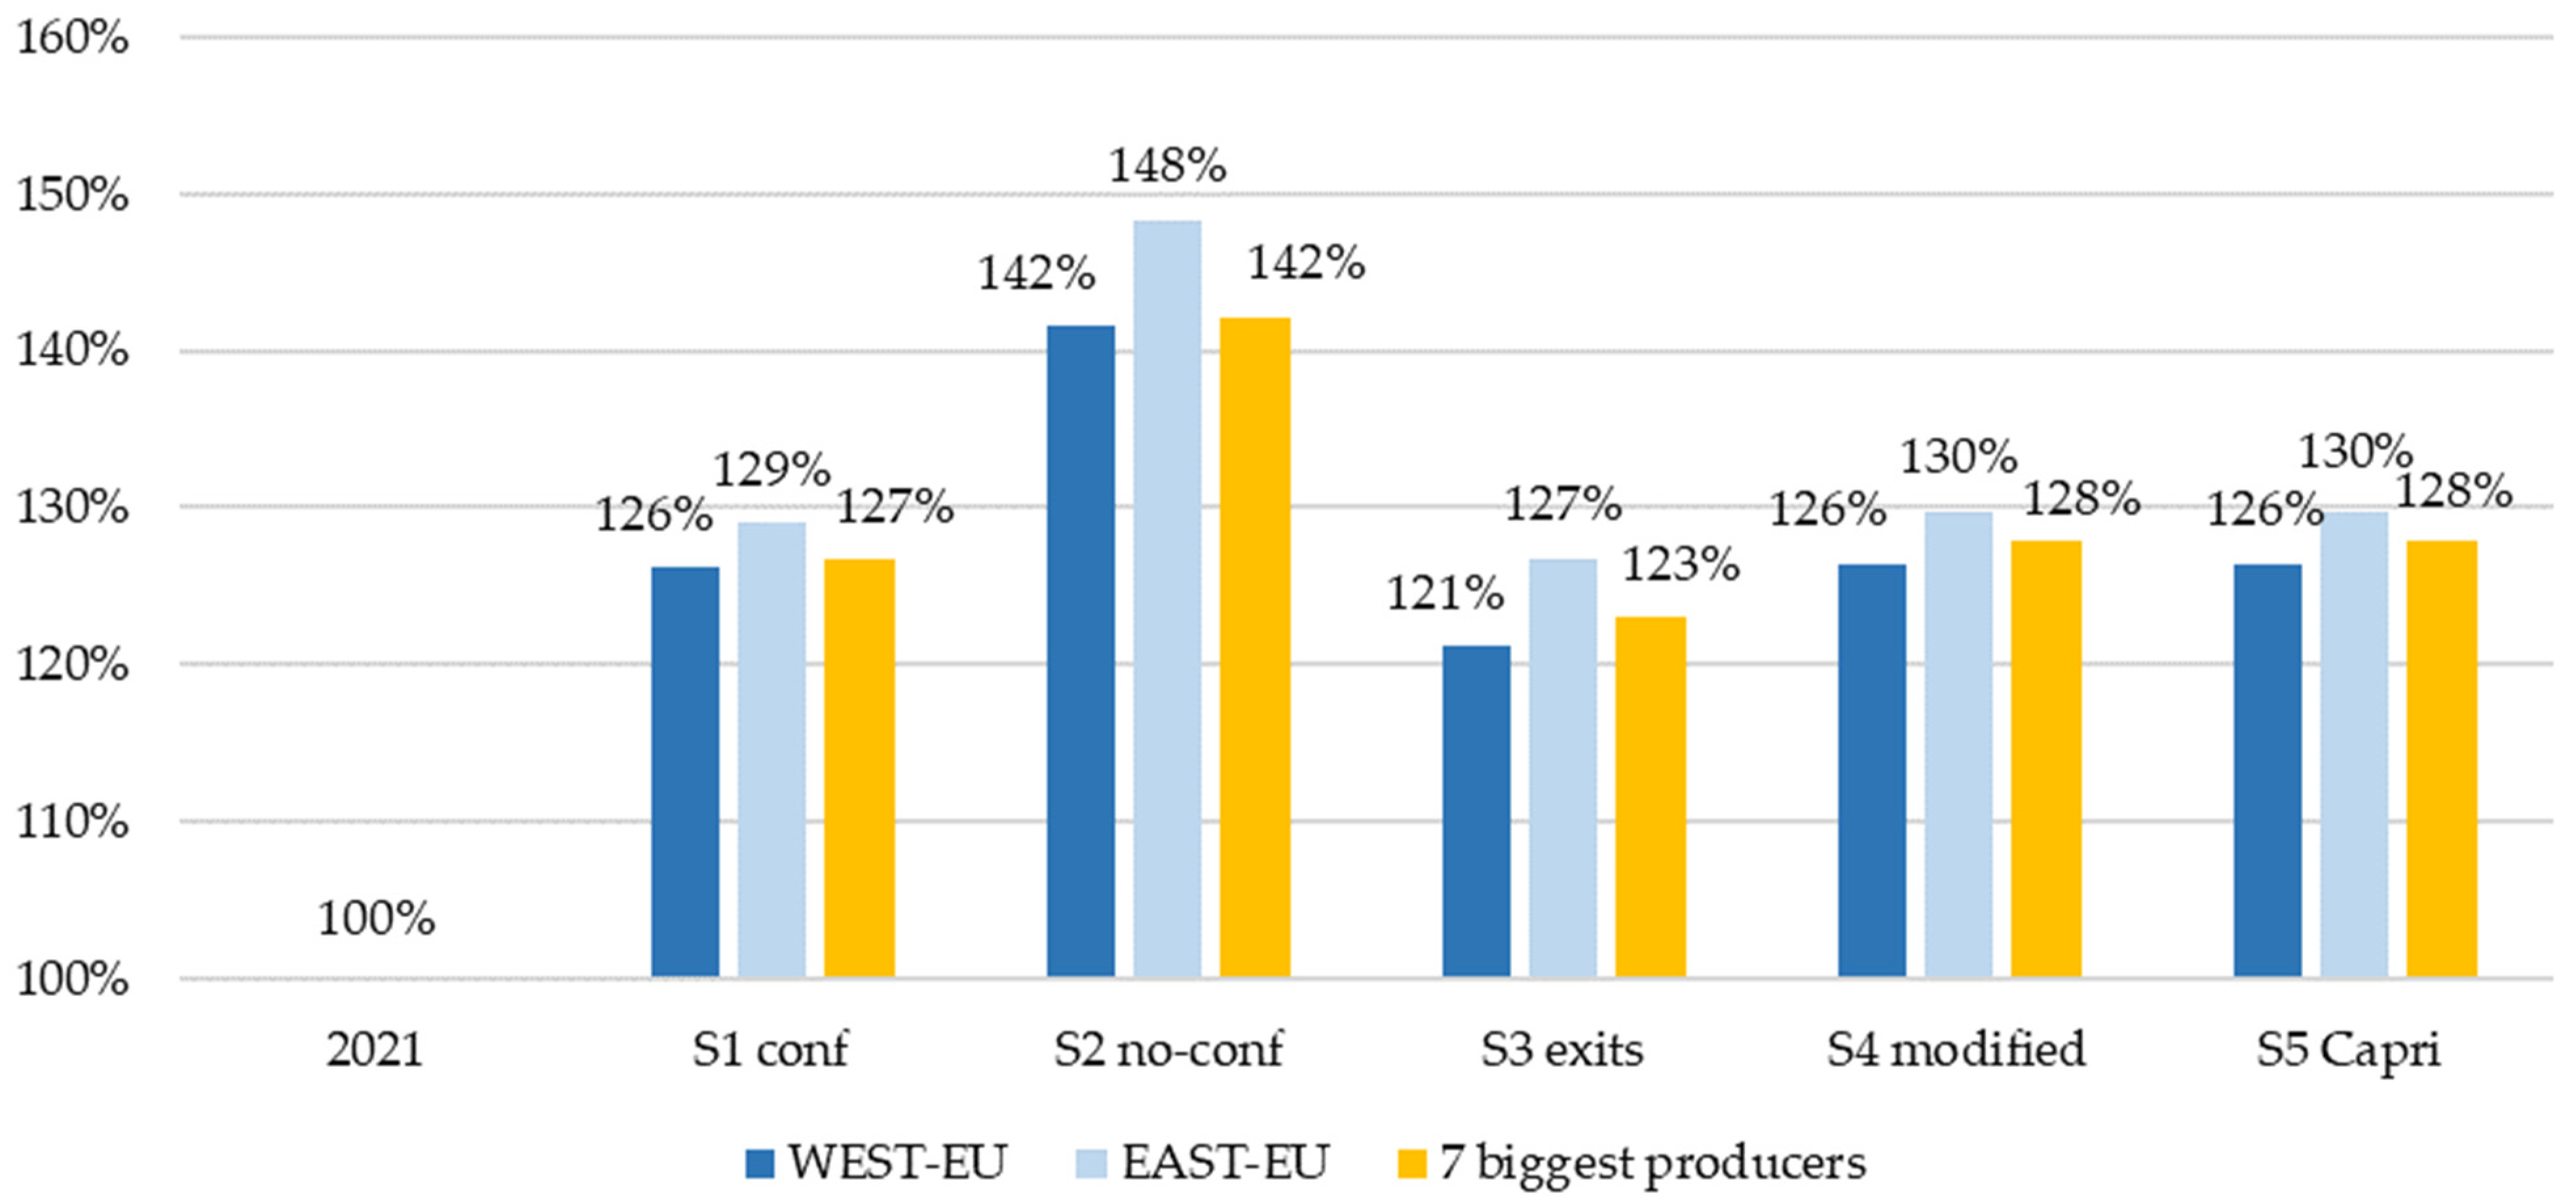
4.3. Results Aggregated for the EU-27 Pig Sector according to 5 Scenarios

The results of the assessments, which were derived from the sample of farms discussed in Section 3.2, were employed in scenario analyses and aggregated to the EU-27 pig sector level. The structure of the sow herd and the proportion of sows confined in crates in 2021 were used to weight the results, as detailed in Table 3, for each country. Furthermore, we integrated the CAPRI simulation outcomes regarding pork production levels, as documented in [33], into the fifth scenario, denoted as Scenario S5capri. This scenario assumes that all the farmers will be compelled to transition by 2025 owing to the policy change. In this scenario, the pork output in the EU-27 was anticipated to fall by 23.6% (including a decline of 21.2% in the EU-West and a reduction of 37.2% in the EU-East), as demonstrated by Potori et al. [33].
In all the alternative scenarios, the overall number of sows in the EU-27 is lower compared to the base year scenario of 2021, which is based on the use of crates (Figure 2 and Figure 3). This reduction is particularly pronounced in the extreme S3exit scenario depicted in Figure 2, wherein the highest number of farmers expressed their intention to exit the sector, impacting approximately 30% of the sow population in these farms (as shown in Table 2). In this scenario, the total number of sows in the EU-27 declines from the base level of 10.9 million to roughly 5.5 million, representing a substantial 49% decrease. This decrease is influenced by the lower stocking density associated with alternative housing systems. In the S4modified scenario, the number of sows declines to around 8.6 million and in S5Capri to around 8.4 million, corresponding to reductions of 20.7% and 22.7%, respectively.
Figure 3 presents the number of sows in the distinguished clusters (EU-West, EU-East, and 7 largest pig-producing EU counties), across all the simulated scenarios.
In the base year, 2021, the contributions of the eleven countries categorised as EU-East, contributed only 15.2% to the total EU population of sows, with nearly half (6% of the total) kept in Poland. Pig production is predominantly concentrated in some of the Western European countries, e.g., in Denmark, France, Germany, Italy, the Netherlands, and Spain, and which, together with Poland, accounts for almost 80% of all the EU-27 sow population.
The most significant decline in the EU-27 sow population (as shown in Figure 3) is observed in the extreme S3exit scenario, marked by the greatest number of declared exits from production. In this scenario, exits within the EU-East cluster affect 24% of the sow population, while in the EU-West cluster, they impact 35.7% of the sows. When these exit figures are combined with other impacts on production parameters and reduction due to a lower stocking density, it results in a substantial 48% drop in the total number of sows. In the alternative scenario, S4modified, featuring modified farmer declarations (refer to Table 2 for comparison), the total sow population undergoes a reduction of approximately 21% within both the eastern and western clusters, as well as among the seven largest pig-producing countries. The total number of sows decreases by approximately 23% under the CAPRI scenario, S5capri, including 35.9% in the EU-East and 20.4% in the EU-West clusters and 21.9% among the seven largest pig-producing countries.
Changes in the number of sows following the full transition to alternative farrowing systems are accompanied by changes in the number of weaned piglets (Figure 4). In all the free-farrowing systems, fewer piglets weaned per sow (by −3.7% in free farrowing with temporary confinement and −4.3% with no confinement owing to increased piglet mortality) also contributes to reduced production. Consequently, in the worst-case scenario, S3exit, 164 million piglets are weaned instead of 344 million, marking a 52.4% decrease. The production of piglets is reduced by 23.7% in the more realistic scenario, S4modified (reflecting modified decisions), compared with the base scenario, and a 22.6% reduction in the S5capri scenario.
The measures used to evaluate the financial implications for banning farrowing crates encompassed additional variable costs associated with the farrowing period and the investment costs incurred in transitioning to free-farrowing systems (Figure 5, Figure 6 and Figure 7). Notably, all the alternative scenarios exhibit an escalation in variable costs (Figure 5). These higher costs resulted from several factors, including increased feed intake by sows during lactation in larger pens with free movement (+7.5%), elevated expenses related to sow replacement (with a 15% rise in sow-culling rates), an increase in labour costs necessary for the maintenance of free-farrowing pens (by 1–2 additional minutes per day during lactation), an increase in vet-med costs (+7.5%), and a decrease in production due to a slightly elevated piglet mortality (+15% with confinement and + 20% with no confinement), along with a reduced number of litters per sow per year (−1.9%). Consequently, in the theoretical scenario, S2no-conf, the selected variable costs per piglet weaned increased by 21%, while in the more realistic scenarios, S4modified and S5capri, they rose by 14%. The increase in variable costs was also found by other authors mentioned in the literature review [11,16,27,29].
The transition to free-farrowing housing systems necessitates investments in the modernisation of existing buildings and the installation of new pens. Figure 6 illustrates the investment values in each of the examined scenarios.
The total value of the investments (Figure 6) varies from approximately 3.8 billion EUR (in Scenario S3exit) to around 6.7 billion EUR (in Scenario S1conf), assuming an average cost of EUR 1700 for the new free-farrowing pens, which must replace the smaller pens, as well as the costs for reconstructing existing buildings (On average, at EUR 1800 per pen, the actual value depends on the specific scenario and region (EU-West/EU-East) and ranges from EUR 1623 in S3 to EUR 2146 in S2). The S5capri scenario requires investments totalling EUR 6.4 billion. The EU-West cluster of countries incurs the highest estimated investment costs, mainly owing to their substantial share of the sow herds in Europe (Figure 6). Our results are in line with the findings of AHDB [27] and other studies [16,28], which emphasise the additional investment needed to convert farrowing crates into free-farrowing pens.
After the enforcement of the ban on farrowing crates, the total estimated production costs, which include additional variable costs, the value of the investments in new pens, and the cost of the depreciation of existing buildings, are anticipated to rise (Figure 7). Depending on the scenario, those costs rise by 31% per piglet weaned in Scenario S3exit, and up to 50% in Scenario S2no-conf. An increase in production costs per piglet weaned from EUR 11.1 to approximately EUR 14.6 (+32%) is projected in Scenarios S4modified and S5capri. Owing to the lower production efficiency and, on average, smaller herds, in the EU-East countries, the increase in production costs will be larger than in the western part of Europe (Figure 8).
By recalculating the extra costs associated with switching to free-farrowing systems per sow (Figure 9 and Figure 10), we observe results similar to those shown in Figure 7 and Figure 8, respectively, for weaned piglets. The production costs per sow increase by 23% in Scenario S3exit (which involves a high percentage of farm-exit declarations and a switch to fattening) and by 43% in Scenario S2no-conf (where all the farms transition to free-farrowing systems without confinement) (Figure 9). We anticipate a 27% rise in production costs per sow in the most likely scenarios, S4modified and S5Capri, from 354 EUR/sow in the base year scenario of 2021 to 449 EUR/sow in Scenario S4modified.
Figure 10 displays the difference between the total costs per sow (selected variable costs related to the farrowing period and depreciation of existing buildings and new investments) in the EU-West and EU-East clusters and in the seven largest pig-producing countries (expressed as percentages). It is evident that the EU-East group of countries will have a more substantial increase in these costs per sow during the farrowing period. This is likely due to the lower efficiencies of production and, on average, smaller sow herds in eastern countries.

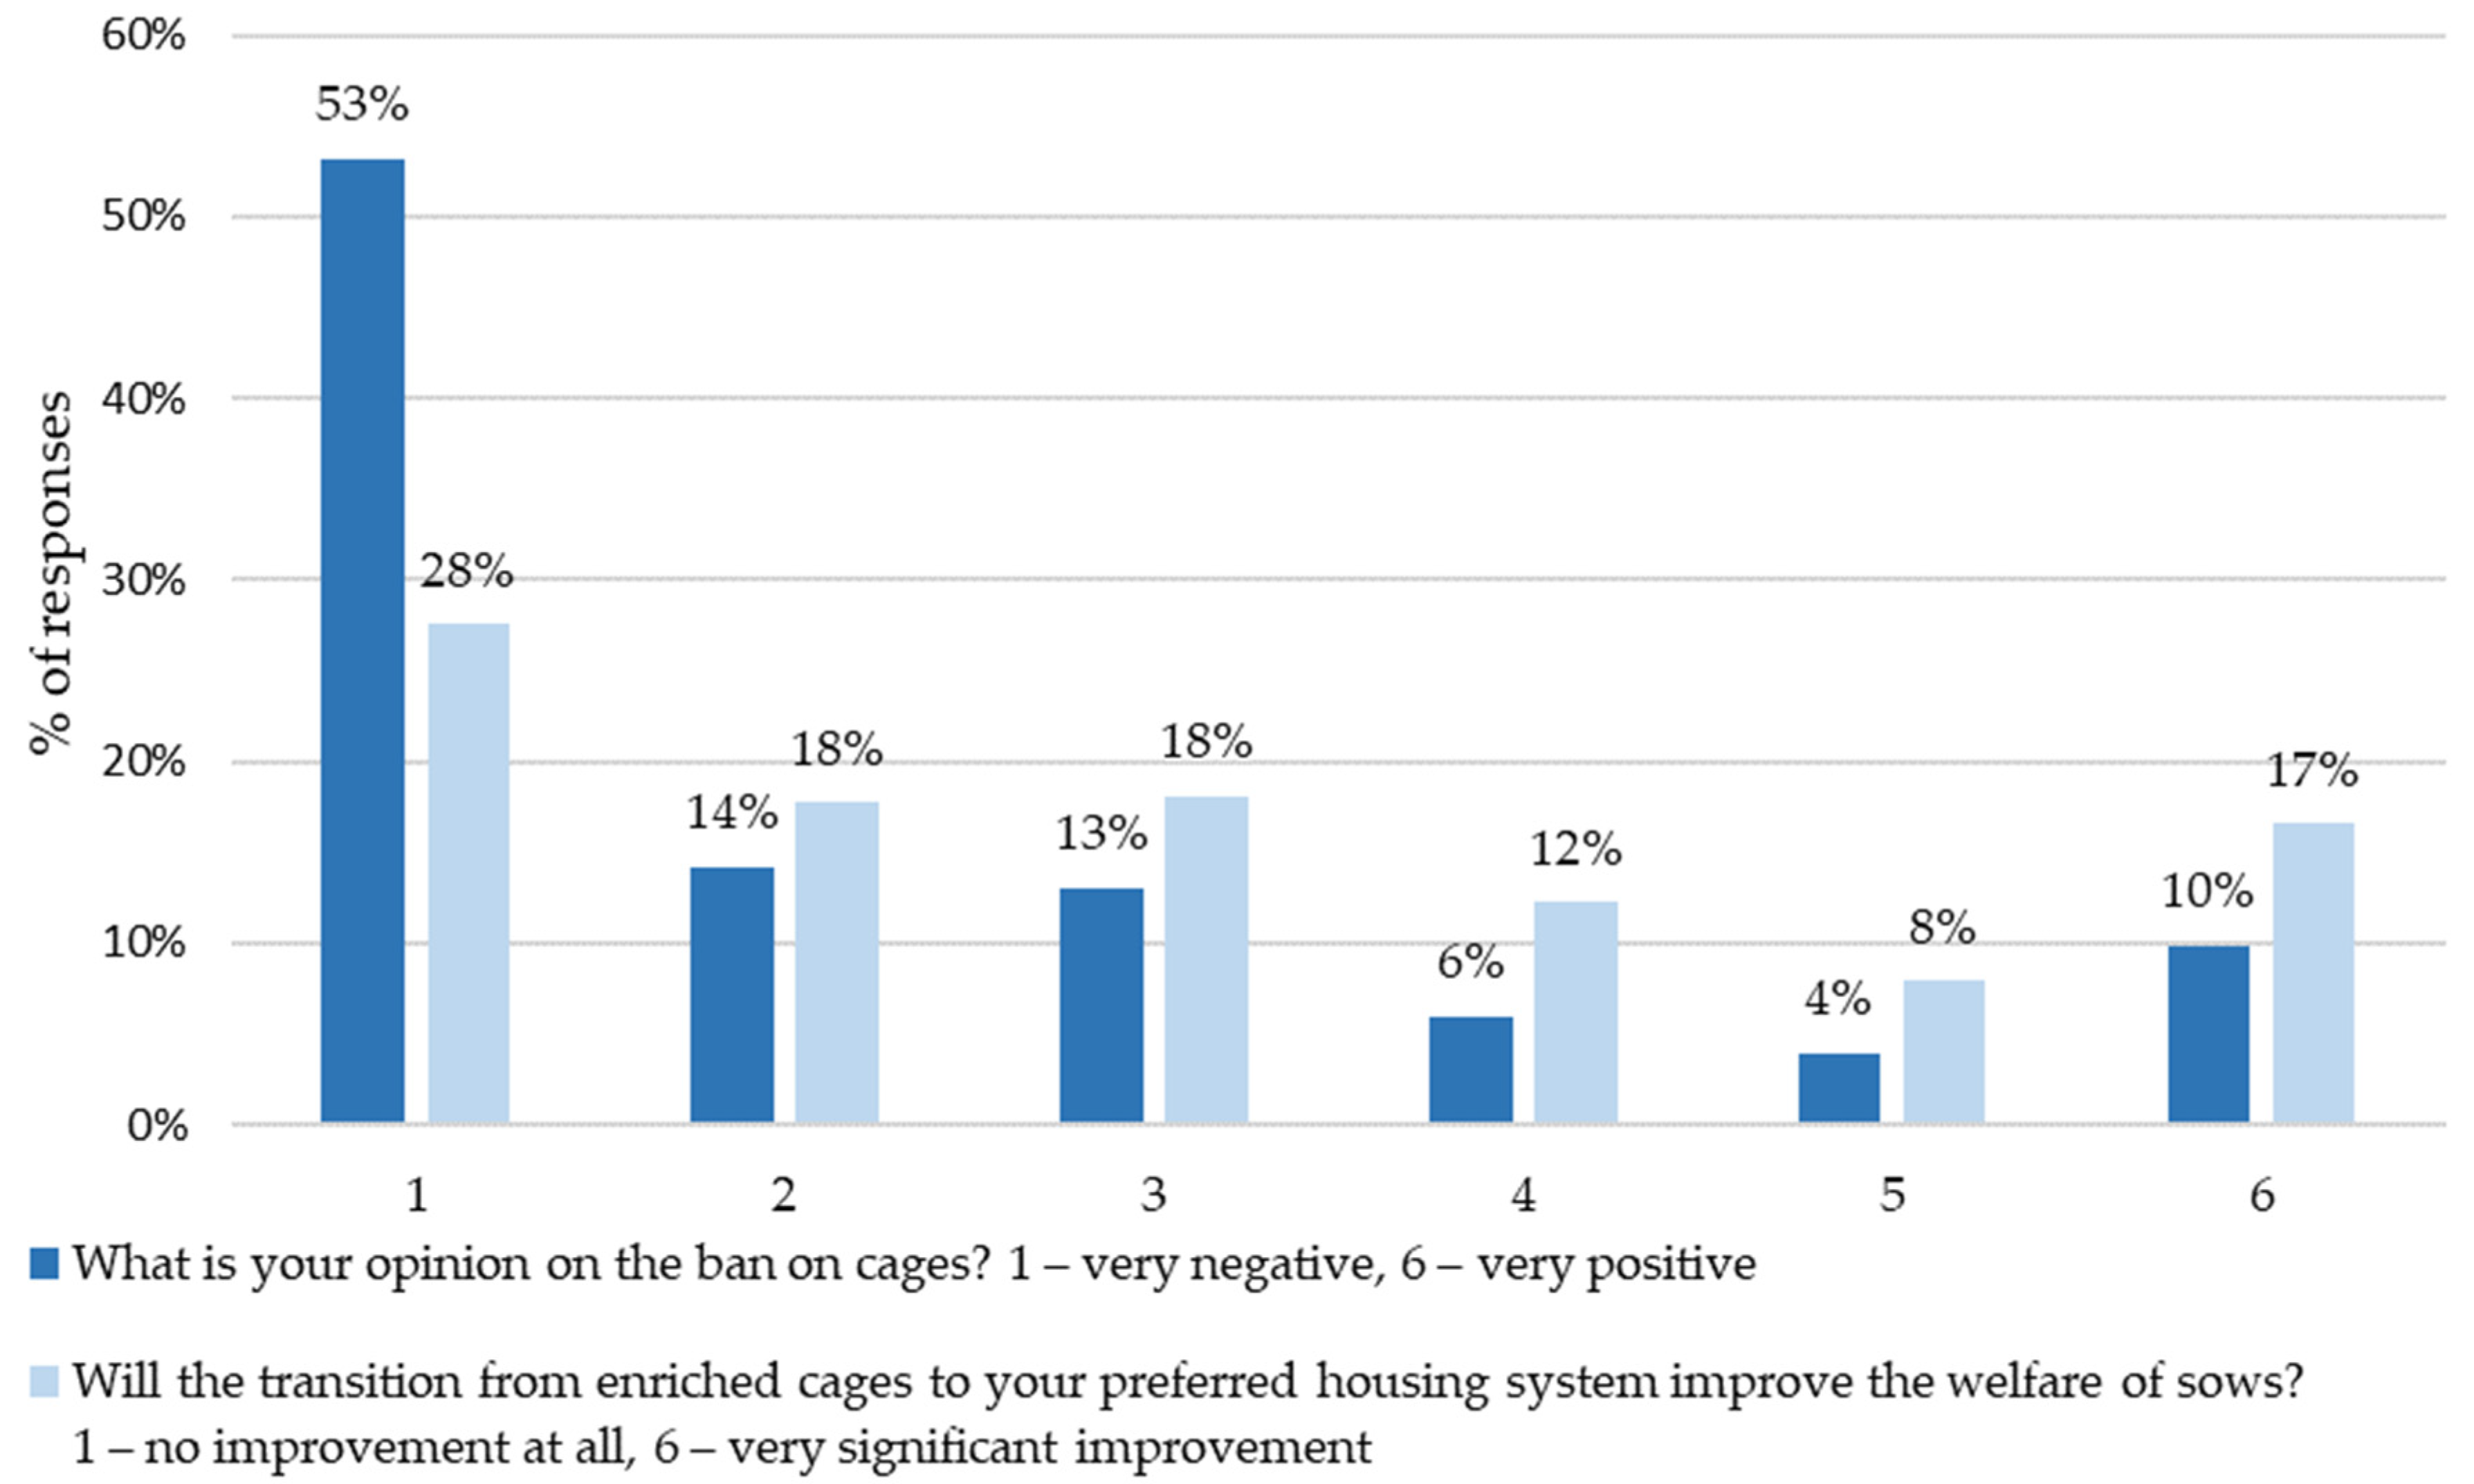
4.4. Farmers’ Opinions on the Planned Banning of Farrowing Crates

In our survey, we collected feedback from both individual farmers and farmer organisations regarding the proposed legislation aimed at enhancing the free-farrowing system. Respondents were asked to provide their perspectives on two key aspects: (1) their overall assessment of the ban on farrowing crates and (2) the potential of the ban to improve sows’ welfare. A total of 254 farmers from 14 countries participated in responding to these questions, out of a total of 323 farmers who took part in the survey. The responses were gathered using a 6-point Likert scale, and the summarised outcomes are presented in Figure 11.
Almost seventy percent of the farmers (67%) expressed strong opposition to the idea for banning farrowing crates (scores 1 and 2). It is noteworthy that only 14% of the farmers held the opposing view (scores 5 and 6). Furthermore, negative sentiments prevailed when assessing the impact of the reform on sows’ welfare, although the proportion of those strongly negative was comparatively lower. Approximately 25% of the respondents perceived favourable effects on sows’ welfare (scores 5 and 6), while 46% believed there would be no improvement (scores 1 and 2). The responses to the question about the likelihood for improving the well-being of sows were more positive (a mean response of 3.1 on a scale of 1–6) compared to opinions on the prohibition of farrowing crates (mean response: 2.3). The differences appeared to be statistically significant. An analysis of the data revealed a high degree of comparability in farmers’ responses to both questions, supported by a Spearman correlation coefficient of 0.64. It is important to note that the responses to both inquiries appeared independent of factors such as the country of origin and the size of the farm’s sow population. This suggests that irrespective of the production scale and other farm-related factors, farmers generally hold a negative opinion regarding the ban.
Farmers were also given the opportunity to share their thoughts on the planned reform and its anticipated impacts through an open-ended question in the survey. Over half of the respondents seized this opportunity. The responses were categorised into six groups, and a concise overview of these opinions is presented in Table 6.
Over 85% of the comments received were characterised by a negative and pessimistic tone (Table 6). One of the producers succinctly articulated the key concerns surrounding the welfare implications of the new farrowing system, stating: “in piglet production, we can imagine a triangle with three welfare goals: 1: the welfare of the sow, 2: the welfare of piglets, and 3: the welfare of workers. Our production system must strive to achieve all three, but it is challenging to improve one aspect without compromising the others.” It is evident that one of the primary advantages of free-farrowing systems is the ability of sows to express natural behaviours, such as rooting and nest-building before farrowing. However, there is still a lack of complete pen designs that can effectively enhance or maintain piglet well-being, particularly in preventing increased piglet mortality and injuries. At the same time, providing greater freedom to sows also entails an increased risk to workers and more complex sow handling, which consumes more time.
Farmers have also raised concerns about the detrimental effects for transitioning to non-cage systems on the economics of pig production and farm management. These concerns find some support in farm-level analyses. Farmers believe that imposing restrictions will increase costs and reduce farm revenues. There is a genuine worry (mostly raised by small-scale farmers) that the investments required for this transition may not adequately cover the costs and will not be passed on to the customer. Their worries are also shared in the other studies [27]. Some farmers, particularly those with smaller operations, have even announced their intention to cease production. Additionally, many farmers point out that the elimination of farrowing crates will result in higher labour inputs at a time when there are already long-term shortages of skilled labour in the industry.
The crate systems currently in use are built upon a solid portion of the floor designated to support the sow’s weight. The plastic slatted floor section is specifically engineered to accommodate the free movement of the piglets, taking into account their weight at this age. However, the sow’s weight far exceeds what the light-slatted floor can bear. All the existing pens must be replaced with entirely new ones to implement the new free-farrowing system. Farrowing pens are among the most expensive pieces of farm equipment, and replacing existing pens and reconstructing flooring will entail significant financial expenditures and disruptions to the production process. Therefore, the proposed ban on farrowing crates is also a matter of great concern for organisations representing pig farmers and breeders.
It is also noteworthy that many farmers in Eastern EU member states have recently invested substantially in renovating pig barns to enhance animal comfort. Implementing the new system would render these expenditures essentially futile, and there is a high likelihood that they would not be reimbursed.
Some farmers argue that instead of making substantial investments in rebuilding farrowing sections, there are more effective ways to enhance the welfare of sows, which are worthy of support, such as the group housing of sows outside of the farrowing period, the installation of air conditioning, and streamlining the process for obtaining permits for solar energy production. One thing is clear: the investment costs will need to be mitigated through EU subsidies, or the transition period for producers to adapt should be sufficiently extended to ensure a smooth and manageable adjustment for farmers.

5. Conclusions

The main objective of this study was to evaluate the costs associated with the planned ban on farrowing crates in EU pig production by the European Commission, with the intention for replacing them with free-farrowing systems in the near future.
Our findings indicate that prohibiting farrowing crates in the EU is expected to result in (1) a decrease in the sow number and piglet output in the EU owing to the increased sow space allowance requirement; (2) a reduction in the efficiency of production due to increased costs of production, which encompass veterinary expenses, labour costs, and sow feed costs, as well as expenses associated with higher piglet mortality and increased sow replacement rates; and (3) significant demand for investments in new pens and the reconstruction of the existing buildings. In the most probable scenarios, assuming a gradual transition by sow farmers, the number of sows is projected to decrease by approximately 20.7% to 22.7%, resulting in around 8.6 and 8.4 million heads, respectively. Expressed as a percentage of the total production costs per piglet (as referred to in InterPIG data), we can expect a 6–10% increase in the total piglet production costs. Additionally, the ban on farrowing crates may lead to an increased concentration in piglet production in larger herds. Small-scale producers without successors are at a high risk for exiting the industry, while some farmers may opt to shift to finishing only.
The vast majority of pig farmers surveyed across the EU held negative opinions regarding the prohibition of farrowing cages. Farmers stressed the difficulty in simultaneously achieving the three welfare goals in production without compromising each one: the welfare of the sows, the welfare of the piglets, and the welfare of the workers. It is evident that the primary benefit of free-farrowing systems is the sows’ ability to express natural behaviour. However, maintaining the welfare of piglets in free-farrowing pens is much more challenging. On the other hand, greater freedom for sows increases the risk of injury and requires more time from personnel.
Although it sheds new light on the impact of the planned ban on farrowing crates in pig production, the analysis is not without limitations, which should be kept in mind when reading our results. First, the impacts observed at the farm-level assessments will not necessarily proportionally affect the market parameters. Other studies could seek to measure these effects on market and international scales, as presented by Potori et al. [34]. Second, the paper is based on certain assumptions (including the expected size of the pen and the impacts of free-farrowing systems on production parameters), which although based on experiments described in the literature and the experiences of countries that have already (partly) converted to free-farrowing systems, like Sweden or Finland, may differ for individual farms. Finally, the effect of the pigs’ animal welfare improvements at the farm level could be extended in future research to consider other aspects of welfare, like avoiding castration, tail docking, or teeth clipping. Notwithstanding these limitations, we think that our study, encompassing the entire EU pig sector for the first time in the literature, improved our understanding of the effects of a planned policy change.
The transition from cage-farrowing systems for sows is widely accepted, and plans for implementing reforms at the level of the European Commission are well advanced. Nevertheless, it should be recognised that beyond the actual improvement in the welfare of sows, there are lingering concerns, including increased production costs, higher piglet mortality rates, and heightened risks to employees. Undoubtedly, these challenges can be mitigated through changes in the technological production process. However, such adjustments require time and training. Given that the planned changes have significant economic and organisational implications for many pig farms, it is essential to consider providing financial assistance to support farms in making a smooth transition to the new systems. Additionally, producers should be granted a sufficiently extended transition period to ensure a painless shift.

Author Contributions

Conceptualisation A.M.-R., E.M., M.H. and N.P.; methodology; A.M.-R., E.M., M.H., N.P. and V.S.; formal analysis; A.M.-R. and E.M.; resources: A.M.-R., E.M., M.H., N.P. and E.E.; data curation; A.M.-R. and E.M.; investigation; A.M.-R., E.M. and M.H.; validation; A.M.-R., E.M., N.P., V.S. and E.E.; writing—original draft; E.M., A.M-R. and N.P.; writing—review and editing; E.M., A.M.-R., M.H. and N.P. All authors have read and agreed to the published version of the manuscript.

Funding

The research has been funded by Copa-Cogeca 2023 within the project titled” Project titled “An assessment of the impacts of the phasing out cages in EU livestock farming”.

Data Availability Statement

The data presented in this study are available on request from the corresponding author, and after agreement of the study Funder.

Conflicts of Interest

The authors declare no conflicts of interest. The funders had no role in the design of the study; in the collection, analyses, or interpretation of the data; in the writing of the manuscript; or in the decision to publish the results.

References

  1. Rojek, B. Animal Welfare Protection in the EU Strategy and Law; European Parliamentary Research Service: Brussels, Belgium, 2023. [Google Scholar]
  2. European Commission. Commission Staff Working Document Evaluation of the European Union Strategy for the Protection and Welfare of Animals 2012–2015, SWD (2021) 76 Final, Brussels, 31.3.2021; European Commission: Brussels, Belgium, 2021.
  3. European Commission. Communication from the Commission to the European Parliament, the Council and the European Economic and Social Committee on the European Union Strategy for the Protection and Welfare of Animals 2012–2015, COM(2012) 6 Final, 19.1.2012, Brussels; European Commission: Brussels, Belgium, 2012.
  4. Council Directive 2008/120/EC; Laying Down Minimum Standards for the Protection of Pigs. Council of the European: Brussels, Belgium, 2009; pp. 5–13.
  5. European Commission 2023. COMMUNICATION FROM THE COMMISSION on the European Citizens’ Initiative (ECI) “Stop Finning-Stop the Trade”, Brussels, 5.7.2023, C(2023) 4489 Final, Brussels, Belgium. 2023. Available online: https://citizens-initiative.europa.eu/sites/default/files/2023-07/C_2023_4489_1_EN.pdf (accessed on 15 September 2023).
  6. Federal Law Journal of Austria —Amendment of Animal Welfare Act. Verordnung des Bundesministers für Soziales, Gesundheit, Pflege und Konsumentenschutz, mit der die 1. Tierhaltungsverordnung geändert wird; Nr. 296/2022, 27.07.2022. Available online: https://www.ris.bka.gv.at/eli/bgbl/II/2022/296/20220727 (accessed on 13 December 2023).
  7. Federal Law Journal of Germany—Amendment of Animal Welfare Act. Siebte Verordnung zur Änderung der Tierschutz Nutztierhaltungsverordnung; Nr. 2020:302, 03.07.2020; Bundesrat: Berlin, Germany, 2020.
  8. Federal Law Journal of Germany—Amendment of Animal Welfare Act; Nr. 2019:587, 19.07.2019; Bundesrat: Berlin, Germany, 2019. Available online: https://www.bundesrat.de/SharedDocs/drucksachen/2019/0501-0600/587-19.pdf?__blob=publicationFile&v=1 (accessed on 20 September 2023).
  9. Danish Crown. Danish Crown Animal Welfare Position Statement 2023. September 2023, pp. 1–28. Available online: https://www.danishcrown.com/media/14233/animal-welfare-position-statement.pdf (accessed on 3 November 2023).
  10. Hansen, S.T. Tre Gange Så Mange Kan Få Tilskud Til Løse Søer. Landbrugsavisen.Dk. GRIS. Available online: https://landbrugsavisen.dk/gris/tre-gange-s%C3%A5-mange-kan-f%C3%A5-tilskud-til-l%C3%B8se-s%C3%B8er (accessed on 15 August 2022).
  11. Quendler, E.; Podiwinsky, C.; Baumgartner, J.; Winckler, C.; Boxberger, J. Performance, Labour and Economic Aspects of Different Farrowing Systems. April 2009. Available online: https://cigrjournal.org/index.php/Ejounral/article/view/1135/1187 (accessed on 23 April 2023).
  12. Chidgey, K.L.; Morel, P.C.H.; Stafford, K.J.; Barugh, I.W. Sow and piglet productivity and sow reproductive performance in farrowing pens with temporary crating or farrowing crates on a commercial New Zealand pig farm. Livest. Sci. 2015, 173, 87–94. [Google Scholar] [CrossRef]
  13. Karlen, G.A.M.; Hemsworth, P.H.; Gonyou, H.W.; Fabrega, E.; Strom, A.D.; Smits, R.J. The welfare of gestating sows in conventional stalls and large groups on deep litter. Appl. Anim. Behav. Sci. 2007, 105, 87–101. [Google Scholar] [CrossRef]
  14. Anil, L.; Anil, S.S.; Deen, J.; Baidoo, S.K.; Wheaton, J.E. Evaluation of well-being, productivity, and longevity of pregnant sows housed in groups in pens with an electronic sow feeder or separately in gestation stalls. Am. J. Vet. Res. 2005, 66, 1630–1638. [Google Scholar] [CrossRef] [PubMed]
  15. Mcglone, J.; von Borell, E.; Deen, J.; Johnson, A.; Levis, D.; Meunier-Salaon, M.; Morrow, J.; Reeves, D.; Salak-Johnson, J.; Sundberg, P. Reviews: Compilation of the Scientific Literature Comparing Housing Systems for Gestating Sows and Gilts Using Measures of Physiology, Behavior, Performance, and Health1. Prof. Anim. Sci. 2004, 20, 105–117. [Google Scholar] [CrossRef]
  16. Baxter, E.M.; Lawrence, A.B.; Edwards, S.A. Alternative farrowing accommodation: Welfare and economic aspects of existing farrowing and lactation systems for pigs. Animal 2012, 6, 96–117. [Google Scholar] [CrossRef] [PubMed]
  17. Einarsson, S.; Sjunnesson, Y.; Hultén, F.; Eliasson-Selling, L.; Dalin, A.-M.; Lundeheim, N.; Magnusson, U. A 25 years experience of group-housed sows–reproduction in animal welfare-friendly systems. Acta Vet. Scand 2014, 56, 37. [Google Scholar] [CrossRef] [PubMed]
  18. Hales, J.; Moustsen, V.A.; Nielsen, M.B.F.; Hansen, C.F. Temporary confinement of loose-housed hyperprolific sows reduces piglet mortality1. J. Anim. Sci. 2015, 93, 4079–4088. [Google Scholar] [CrossRef] [PubMed]
  19. Zotti, E.; Resmini, F.A.; Schutz, L.G.; Volz, N.; Milani, R.P.; Bridi, A.M.; Alfieri, A.A.; Da Silva, C. A Impact of piglet birthweight and sow parity on mortality rates, growth performance, and carcass traits in pigs. Rev. Bras. Zootec. 2017, 46, 856–862. [Google Scholar] [CrossRef]
  20. Mazzoni, C.; Scollo, A.; Righi, F.; Bigliardi, E.; Di Ianni, F.; Bertocchi, M.; Parmigiani, E.; Bresciani, C. Effects of three different designed farrowing crates on neonatal piglets crushing: Preliminary study. Ital. J. Anim. Sci. 2018, 17, 505–510. [Google Scholar] [CrossRef]
  21. Morgan, L.; Klement, E.; Novak, S.; Eliahoo, E.; Younis, A.; Sutton, G.A.; Abu-Ahmad, W.; Raz, T. Effects of group housing on reproductive performance, lameness, injuries and saliva cortisol in gestating sows. Prev. Vet. Med. 2018, 160, 10–17. [Google Scholar] [CrossRef] [PubMed]
  22. Glencorse, D.; Plush, K.; Hazel, S.; D’Souza, D.; Hebart, M. Impact of Non-Confinement Accommodation on Farrowing Performance: A Systematic Review and Meta-Analysis of Farrowing Crates Versus Pens. Animals 2019, 9, 957. [Google Scholar] [CrossRef] [PubMed]
  23. Buoio, E.; Costa Annamaria. Space allowance and piglets survival rate in the farrowing crate. Large Anim. Rev. 2020, 26, 239–247. [Google Scholar]
  24. Zhang, X.; Li, C.; Hao, Y.; Gu, X. Effects of Different Farrowing Environments on the Behavior of Sows and Piglets. Animals 2020, 10, 320. [Google Scholar] [CrossRef] [PubMed]
  25. Ko, H.-L.; Temple, D.; Hales, J.; Manteca, X.; Llonch, P. Welfare and performance of sows and piglets in farrowing pens with temporary crating system on a Spanish commercial farm. Appl. Anim. Behav. Sci. 2022, 246, 105527. [Google Scholar] [CrossRef]
  26. Chapinal, N.; de la Torre, J.R.; Cerisuelo, A.; Gasa, J.; Baucells; Coma, J.; Vidal, A.; Manteca, X. Evaluation of welfare and productivity in pregnant sows kept in stalls or in 2 different group housing systems. J. Vet. Behav. 2010, 5, 82–93. [Google Scholar] [CrossRef]
  27. AHDB; Davis, C.; Wilkins, B.; Barber, C. Evidence report: Comparing the Potential Implications of Widespread Use of Different Farrowing Systems in the British Pig Sector. United Kingdom, August 2020. Available online: https://projectblue.blob.core.windows.net/media/Default/Market%20Intelligence/COP/AHDB%20Alternative%20Farrowing%20Report.pdf (accessed on 23 April 2023).
  28. Mitchell, L.; Romanowicz, B.; Sawyer, P.; Reyes, E.; Deblitz, C. Pig Network the Pig Industry’s Transition to Group Sow Housing: Economic and Welfare Assess-Ments. Braunschweig, Germany and Poling, UK, April 2017. Available online: https://literatur.thuenen.de/digbib_extern/dn058694.pdf (accessed on 23 April 2023).
  29. Seddon, Y.M.; Cain, P.J.; Guy, J.H.; Edwards, S.A. Development of a spreadsheet based financial model for pig producers considering high welfare farrowing systems. Livest. Sci. 2013, 157, 317–321. [Google Scholar] [CrossRef]
  30. Bates, R.O.; Edwards, D.B.; Korthals, R.L. Sow performance when housed either in groups with electronic sow feeders or stalls. Livest. Prod. Sci. 2003, 79, 29–35. [Google Scholar] [CrossRef]
  31. REDACTIE VARKENS. Aeres Applies Innovative Well Farrowing Free-range Farrowing Pens. Available online: https://www.varkens.nl/nieuws/2020/12/08/aeres-neemt-innovatieve-wellfarrowing-vrijloopkraamhokken-in-gebruik (accessed on 8 December 2020).
  32. AHDB. 2021 Pig Cost of Production in Selected Countries. 2022, pp. 1–31. Available online: https://projectblue.blob.core.windows.net/media/Default/Pork/Pork%20MI%20files/CostPigProduction2021_221117_WEB.pdf (accessed on 2 November 2023).
  33. Potori, N.; Majewski, E.; Malak-Rawlikowska, A.; Himics, M.; Witzke, P.; Egri, E.; Erdos, A.; Gębska, M.; Grontkowska, A.; Hamulczuk, M.; et al. An Assessment of the Impacts of the Phasing out of Cages in EU Livestock Farming: The Pig and Layer Sectors. Brussels, Belgium, January 2023. Available online: https://www.copa-cogeca.eu/Flexpage/DownloadFile/?id=13425681 (accessed on 4 October 2023).
  34. Potori, N.; Himics, M.; Witzke, P.; Szabo, Z.; Savoly, J.; Egri, E. Socio-economic Implications of Banning Conventional Farrowing Crates in EU Pig Farming: A CAPRI-based Scenario Analysis. Stud. Agric. Econ. Dec. 2023, 125, 136–142. [Google Scholar] [CrossRef]
Figure 1. Conceptual framework for farm-level assessments. Source: authors’ elaboration.
Agriculture 14 00187 g001
Figure 2. The total sow population in the EU-27 (percentage in relation to the base scenario and in thousands of heads). Source: authors’ elaboration.
Agriculture 14 00187 g002
Figure 3. The total sow population in the EU-27, across EU-West, EU-East, and in the 7 largest pig-producing countries (thousands of heads). Source: authors’ elaboration.
Agriculture 14 00187 g003
Figure 4. The total number of piglets weaned in the EU-27 (million piglets and percentage compared with those in base scenario). Source: authors’ elaboration.
Agriculture 14 00187 g004
Figure 5. Selected variable costs per piglet weaned for EU-27 (EUR/piglet). Source: authors’ elaboration.
Agriculture 14 00187 g005
Figure 6. Total costs for investing in new pens in the EU-27, across EU-West and EU-East (billion EUR). Source: authors’ elaboration.
Agriculture 14 00187 g006
Figure 7. The total selected costs per piglet weaned (selected variable costs and depreciation of new investments + existing buildings) for EU-27 (EUR/piglet). Source: own elaboration.
Agriculture 14 00187 g007
Figure 8. Change in the total selected costs per piglet weaned (selected variable costs and depreciation of new investments + existing buildings) in Western and Eastern EU member states (%). Source: own elaboration.
Agriculture 14 00187 g008
Figure 9. The total selected costs per sow (selected variable costs + depreciation of new investments and existing buildings) for EU-27 (EUR/sow). Source: own elaboration.
Agriculture 14 00187 g009
Figure 10. Change in the total selected costs per sow (selected variable costs + depreciation of new investments and existing buildings) in the EU-West and EU-East and in the 7 largest pig-producing countries (%). Source: own elaboration.
Agriculture 14 00187 g010
Figure 11. Farmers’ opinions on the transition from cage-farrowing systems (share of responses, percentage, n = 254). Source: authors’ elaboration.
Agriculture 14 00187 g011
Table 1. Selected references associated with the technical performance parameters, which provided the basis for the parameter assessments in our study.
Selected Production Efficiency IndicatorsReferencesValues for Free-Farrowing Systems (FFS) vs. Crates (Smaller “<” or Larger “>”)
Litters/sow/year
Decreased number of litters per sow per year and duration of inter-farrowing period
[11,12] FFS < Crates
Sow mortality (%)[13]FFS > Crates
Culling-out percentage (%)[14]FFS > Crates
Mortality of piglets (%)
Pigs born alive or dead per litter
Pre-weaning mortality (%)
[12,13,14,15,16,17,18,19,20,21,22,23,24,25] FFS > Crates
Number or percentage of crushed piglets[13,23,24]FFS > Crates
Average weight of piglets at birth (kg)[13,15,19,25]FFS ≥ Crates
Weaned piglets (piglets/sow; kg/sow; piglets/m2; kg/m2)[11,12,22]FFS < Crates
Feed intake (kg/day/sow)[13,26] FFS > Crates
Labour (hours per sow per year)[11,16] FFS > Crates
Space for farrowing (m2)[22,25,27] FFS > Crates
Investment needs and housing (euros/m2)[27]FFS > Crates
Costs of investments (euros/sow place)[16,27,28]FFS > Crates
Cost of vet and medicines (euros/piglet)[27]FFS > Crates
Costs of production and gross margins[11,16,27,29]FFS > Crates
Source: own elaboration based on the results of literature review of abovementioned studies.
Table 2. Farmer declarations of the transition path in S3 and S4 scenarios (expressed as percentage of sow herd affected—not the number of farms *).
S3exit: “All the Farm
Declarations for Alternative Systems Included”
Switch to Free Farrowing with Confinement
(5.5 m2)
Switch to Free-Farrowing System with No
Confinement (7 m2)
Switch to
Pig Fattening
Exit from Production
TOTAL60.2%4.3%5.1%30.4%
EU-West54.2%3.2%7.0%35.7%
EU-East67.3%5.7%2.8%24.1%
S4modified: “Farm
Declarations for Alternative Systems Were Modified “
Switch to Free Farrowing with Confinement (5.5 m2)Switch to Free-Farrowing System with No Confinement
7 m2
Switch to
Pig Fattening
Exit from Production
TOTAL94.5%4.3%0.3%0.8%
EU-West95.7%3.2%0.4%0.8%
EU-East93.2%5.7%0.3%0.8%
* The percentage of farmers declaring exits was greater than the corresponding percentage of sows in the sample. This is because the size of the herds at those farms was far below the average. Source: authors’ elaboration.
Table 3. Characteristics of the sow herd in the EU, 2021.
Country Number of Sows
(2021, Thousands of Heads)
Share in the Total EU Percentage of Sows in Crates
Spain2684.924.7%99%
Germany 1583.014.6%99%
Denmark1235.011.4%95%
France928.08.5%96%
The Netherlands910.08.4%98%
Poland654.16.0%95%
Italy551.05.1%99%
Belgium386.33.6%95%
Romania298.92.7%99%
Hungary240.72.2%99%
Portugal229.62.1%99%
Austria224.12.1%95%
Ireland144.81.3%99%
Czechia126.41.2%95%
Sweden120.71.1%0%
Croatia104.01.0%95%
Greece100.00.9%99%
Finland93.00.9%60%
Bulgaria65.80.6%99%
Lithuania44.30.4%95%
Latvia39.70.4%95%
Slovakia37.20.3%99%
Cyprus31.00.3%95%
Malta3.70.0%99%
Luxembourg3.10.0%99%
Estonia25.70.2%95%
Slovenia14.20.1%95%
TOTAL EU10,879.1100.0%96.2%
EU-West9228.284.8%96.1%
EU-East1650.915.2%96.6%
7 Largest Pig-Producing Countries (SP, DE, DK, FR, NL, IT, and PL)8546.078.6%97.7%
Source: authors’ elaboration based on EUROSTAT data.
Table 4. Farm survey results—basic characteristics of the sample.
Clusters (EU-West/EU-East; Farm Size in No. of Sows per Farm)Number of Farms in the SampleAverage Number of Sows per FarmNumber of Sows in the SampleAverage Size of Farrowing Pen (m2)Mortality of PigletsNumber of Litters/Sow/YearPiglets Weaned per Sow per YearMortality of SowsReplacement Ratio (%)Amount of Feed for Sows in the Lactation Period (28 Days) kg/sow/dayRequested Transition Period (Years)
SAMPLE225897.9202,0384.710.7%2.328.46.0%42%6.415.4
EU-West121906.6109,7004.711.4%2.329.95.9%44%6.418.2
EU-East104887.992,3384.89.9%2.226.76.2%39%6.312.3
Number of sows at the farm
≤704343.118534.99.7%2.225.35.2%39%6.214.4
71–20047143.167255.211.5%2.226.46.0%39%6.617.4
201–50039360.714,0664.610.2%2.329.75.4%41%6.516.2
501–100040747.329,8904.311.4%2.329.56.4%44%6.316.7
>1000562669.7149,5044.510.7%2.330.96.8%46%6.213.2
Source: authors’ elaboration based on the farm survey.
Table 5. Chosen indicators calculated for crates and free-farrowing systems for the sample of farms.
CratesFree Farrowing with
Confinement—5.5 m2
Free Farrowing No Confinement—7 m2 Free Farrowing with
Confinement (% Change)
Free
Farrowing No
Confinement (% Change)
Number of sows per farm (mean)(difference vs. crates (%))
SAMPLE897.9719.4570.8−19.9%−36.4%
EU-West906.6724.5575.1−20.1%−36.6%
EU-East887.9713.5565.9−19.6%−36.3%
Grouped by herd size
≤7043.136.329.3−15.8%−32.0%
71–200143.1124.8105.9−12.8%−26.0%
201–500360.7295.6234.4−18.0%−35.0%
501–1000747.3578.2458.1−22.6%−38.7%
>10002669.72138.91691.7−19.9%−36.6%
Piglets’ mortality (%)(difference vs. crates (%))
SAMPLE10.712.312.9+15%+20%
EU-West11.413.113.7+15%+20%
EU-East9.911.411.9+15%+20%
Grouped by herd size
≤709.711.211.6+15%+20%
71–20011.513.213.8+15%+20%
201–50010.211.712.2+15%+20%
501–100011.413.113.7+15%+20%
>100010.712.412.9+15%+20%
Number of piglets weaned per sow (number of litters × piglets weaned/L)(difference vs. crates (%))
SAMPLE28.427.427.2−3.7%−4.3%
EU-West29.928.728.6−3.8%−4.4%
EU-East26.725.825.6−3.6%−4.1%
Grouped by herd size
≤7025.324.424.3−3.5%−4.1%
71–20026.425.325.2−3.9%−4.5%
201–50029.728.728.5−3.6%−4.1%
501–100029.528.428.2−3.8%−4.5%
>100030.929.729.6−3.7%−4.3%
Feed cost per piglet weaned during lactation (EUR)(difference vs. crates (%))
SAMPLE4.65.15.1+11.4%+12.1%
EU-West4.55.05.0+11.6%+12.3%
EU-East4.75.25.2+11.2%+11.9%
Grouped by herd size
≤704.95.45.4+11.2%+11.8%
71–2004.95.55.6+11.6%+12.4%
201–5004.55.05.0+11.3%+11.9%
501–10004.44.94.9+11.6%+12.3%
>10004.14.64.7+11.4%+12.1%
Sow replacement costs per piglet weaned (EUR)(difference vs. crates (%))
SAMPLE4.45.25.2+17.9%+18.7%
EU-West4.35.15.1+18.3%+19.1%
EU-East4.65.45.4+17.6%+18.3%
Grouped by herd size
≤704.35.15.1+17.8%+18.4%
71–2004.65.45.4+18.0%+18.8%
201–5004.14.94.9+17.9%+18.6%
501–10004.65.45.4+18.1%+19.0%
>10004.45.25.3+17.9%+18.6%
Additional labour cost per piglet (EUR)
SAMPLE0.61.1
EU-West0.51.1
EU-East0.61.2
Grouped by herd size
≤700.71.3
71–2000.61.3
201–5000.51.0
501–10000.51.0
>10000.51.0
VET-MED costs (average) per piglet weaned (EUR)(difference vs. crates (%))
SAMPLE1.31.51.5+11.6%+12.4%
EU-West1.41.61.6+11.8%+12.5%
EU-East1.21.31.3+11.5%+12.1%
Grouped by herd size
≤701.51.71.7+11.4%+12.1%
71–2001.41.61.6+11.9%+12.6%
201–5001.31.41.4+11.5%+12.2%
501–10001.21.41.4+11.8%+12.6%
>10001.21.31.3+11.6%+12.3%
Total variable costs per piglet weaned (EUR)(difference vs. crates (%))
SAMPLE8.09.29.8+14.5%+22.2%
EU-West7.99.19.7+14.7%+22.1%
EU-East8.29.310.0+14.2%+22.4%
Grouped by herd size
≤708.39.610.2+15.3%+23.5%
71–2008.69.910.6+14.6%+22.8%
201–5007.89.09.5+14.8%+22.1%
501–10007.99.09.7+14.0%+21.6%
>10007.68.69.2+13.8%+21.2%
Investment in new pen, value per piglet weaned (EUR/piglet weaned)
SAMPLE 1.31.3
EU-West 1.11.1
EU-East 1.51.5
Grouped by herd size
≤70 1.91.9
71–200 1.41.4
201–500 1.11.1
501–1000 1.11.1
>1000 1.01.0
Depreciation of existing building and equipment, EUR per piglet weaned (difference vs. crates (%))
SAMPLE5.27.39.2+40.9%+77.2%
EU-West4.05.67.1+40.2%+77.0%
EU-East6.69.311.7+41.4%+77.4%
Grouped by herd size
≤706.48.711.0+35.4%+70.2%
71–2006.08.19.9+35.0%+64.6%
201–5004.46.38.1+43.2%+82.5%
501–10004.76.98.8+48.0%+88.1%
>10004.56.78.5+46.7%+87.3%
Depreciation of new investments in pens, existing buildings, and equipment per piglet weaned
SAMPLE5.28.610.5+65.4%+101.8%
EU-West4.06.78.2+67.4%+104.3%
EU-East6.610.813.2+63.9%+100.0%
Grouped by herd size
≤706.410.612.8+64.4%+99.1%
71–2006.09.511.3+58.5%+88.2%
201–5004.47.49.1+67.0%+106.4%
501–10004.78.09.8+70.9%+111.2%
>10004.57.79.5+68.9%+109.7%
Total costs of transition (variable costs + depreciation of new investments and existing buildings) per piglet weaned (EUR)(difference vs. crates (%))
SAMPLE13.217.820.3+34.5%+53.5%
EU-West11.915.817.9+32.4%+49.7%
EU-East14.820.123.2+36.4%+57.1%
Grouped by herd size
≤7014.720.223.1+36.8%+56.5%
71–20014.619.421.9+32.6%+49.6%
201–50012.216.318.7+33.7%+52.6%
501–100012.617.019.5+35.0%+54.7%
>100012.116.318.7+34.4%+54.3%
Source: authors’ elaboration based on the farm survey.
Table 6. The most common views of farmers on the suggested reform (the number of comments qualified in each category are in brackets, n = 160).
Broad Opinion (n = 68)
wrong direction/resignation from pig production/decreasing competitiveness/disaster to producers—(negative: 82% of answers)
useful idea/positive change/no difference—(positive: 18% of answers)
Animal Welfare (n = 43)
severe increase in piglet mortality/higher mortality of sows (negative: 74% of answers)
better welfare of sows (positive: 26% of answers)
Human Welfare (n = 13)
sows will be more aggressive when protecting their piglets/difficult to find workers/dangerous to workers (negative: 100% of answers)
Farm Economics (n = 36)
increased production costs/decreased productivity/worse efficiency/high investment costs/need for EU support/deterioration of working conditions for staff/problems with staff
Source: authors’ elaboration.
Disclaimer/Publisher’s Note: The statements, opinions and data contained in all publications are solely those of the individual author(s) and contributor(s) and not of MDPI and/or the editor(s). MDPI and/or the editor(s) disclaim responsibility for any injury to people or property resulting from any ideas, methods, instructions or products referred to in the content.

