Article

Mechanism Analysis and Experimental Verification of Side-Filled Rice Precision Hole Direct Seed-Metering Device Based on MBD-DEM Simulations

1
College of Engineering, Northeast Agricultural University, Harbin 150030, China
2
College of Electrical and Information, Northeast Agricultural University, Harbin 150030, China
*
Author to whom correspondence should be addressed.
Agriculture 2024, 14(2), 184; https://doi.org/10.3390/agriculture14020184
Submission received: 29 December 2023 / Revised: 22 January 2024 / Accepted: 23 January 2024 / Published: 25 January 2024

Abstract

:
In order to solve the problems of poor hole-filling performance and the high seed-breakage rate of conventional rice bud seed precision hole direct seed-metering devices, a side-filled rice precision hole direct seed-metering device was developed, and the mechanism and force analyses for seeding operations were carried out. The key factors affecting seeding quality were determined: rotation speed, seeding angle and seeding height. By coupling the discrete element method (DEM) and multi-rigid body dynamics (MBD), the seed breakage rate and seeding performance at different rotation speeds were analyzed. Single-factor bench testing was used to analyze the effect of a duckbill unit on seeding performance under different factor levels. The three-factor and five-level quadratic regression orthogonal rotation center combination test methods were used to obtain the optimal working parameter combination. The test results showed that when the rotation speed was 47 r/min, the seeding angle was 19°, and the seeding height was 180 mm, the qualified index of seeding was 92.03%, the hole diameter qualified index was 91.62%, and the hole distance variation index was 7.17%. This study provides a reference for the research of mechanical rice sprouting seed-metering devices.

1. Introduction

Rice, as one of the major food crops of mankind, has edible, economic and medicinal value [1,2,3]. Recently, with improvements to rice seed quality, the emergence rate and germination rate of rice seeds have been improved. Rice planting effectiveness is one of the main factors affecting rice yield. Compared with other planting methods, rice direct seeding technology is a light and simplified planting method that saves time and resources. It allows for precise seeding of rice seedlings with appropriate hole spacing, hole diameter and species count in accordance with agronomic requirements. This method represents one of the key directions of mechanized rice planting [4,5,6].
The key component of mechanized rice direct seeding technology is the seed-metering device. Based on their operating principle, devices can be subdivided into pneumatic seed-metering devices and mechanical seed-metering devices. A pneumatic seed-metering device can adsorb or press seeds by using the characteristics of gas flow, which has the advantages of high precision and low seed damage. However, it is not suitable for seeding rice due to its complex structure, high sealing requirements, and the potential for suction hole blockages. A mechanical seed-metering device offers the benefits of a simple structure, easy inspection and maintenance, and the ability to accommodate high-humidity field seeding environments [7].
In view of ensuring that mechanical seed-metering devices can complete seeding operations stably and accurately in the field, many researchers have conducted large amounts of in-depth research on mechanical seed-metering devices. Zhang et al. [8] designed a slider–hole–wheel seed-metering device, studied the seed filling and removal process, analyzed the adverse effects of the rotation speed on seeding, and achieved high seeding accuracy. However, this study did not consider the potential damage caused by key components of the seed-metering device, such as the seed cleaning wheel, to the seeds. Maleki et al. [9] designed a multi-layer spiral-groove seed-metering device to improve the seeding uniformity and achieve uniform seeding but did not take into account the required spacing for rice growth. To address the above problems, Hensh and Raheman [10] designed a solenoid-operated hill-dropping seed-metering device, which utilizes a seed-metering wheel with an electromagnetic induction-type sensor for seed expulsion and achieves low-damage and orderly seed expulsion. However, this study failed to consider the hole-forming performance of the seed-metering device after seeding. In pursuit of precise seeding, Li et al. [11] designed a combination of a mini shovel and a telescopic tube, which effectively solved the problems of seed tube blockage and uneven seeding depth and improved the qualified rate of the seed hole diameter after seeding. But the key components of the device vibrated when contacting the soil, which increases the degree of hole distance variation. Consequently, it is of great relevance to design a mechanical rice seed-metering device with no contact between the soil and the key components of device, a low seed breakage rate, and excellent hole-forming performance.
The effectiveness of the interaction between the key components of the seed-metering device and the sprouted seeds is the key to the successful completion of the seeding operation. Therefore, it is necessary to conduct simulation studies on the effects of seed–seed and seed–device component interactions. The discrete element method (DEM) has been employed to study various seed transport mechanisms within seed-metering devices, including the interaction between different particles inside the seed filling chamber [12,13,14,15]. By using the discrete element method, Pasha et al. [16] simulated the motion of different seed particles in a seed packing machine, explored the effects of seed velocity and friction, and improved the uniformity of seed coating. With EDEM 2.7 software, Lei et al. [
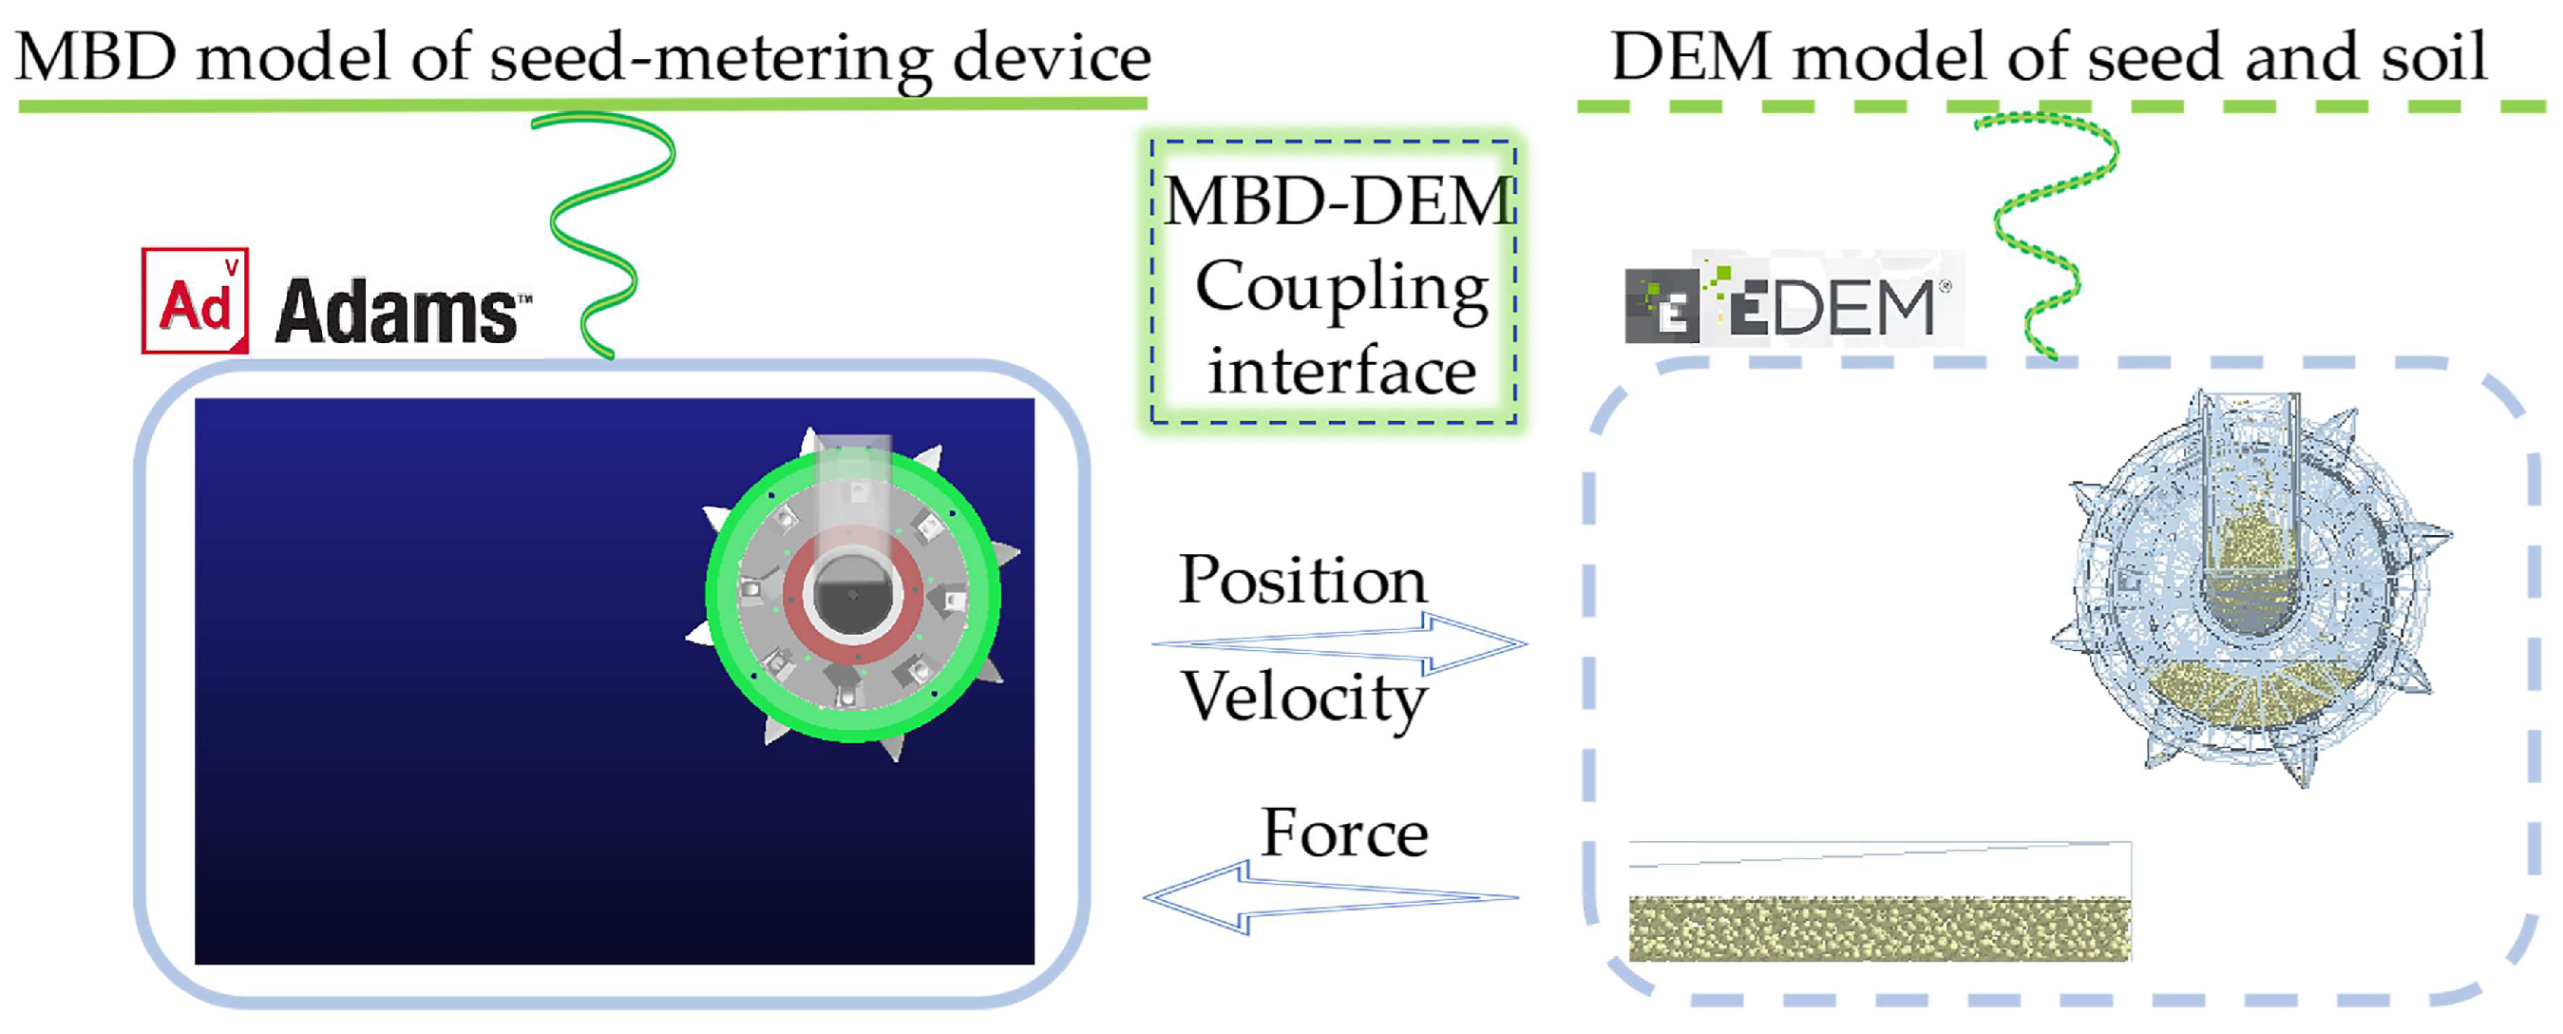
17] explored the seed flow characteristics in an air-assisted centralized metering system and analyzed the effect of the compression force on the filling characteristics. Simulating the motion of complex seed-metering device components using EDEM software alone can be challenging, while employing a combined simulation approach using the discrete element method (DEM) and multi-body dynamics (MBD) allows for modeling the effects of complex seed-metering device component motion on particles [18,19,20]. This coupled simulation method has been applied in various agricultural engineering projects; for example: Kim et al. [21] developed a full-scale soil–tool–machine coupled model based on DEM and MBD coupling to predict the traction force during tillage according to the tillage depth; Liu et al. [22] developed a mathematical model and performed DEM and MBD coupled simulation to investigate the effects of feeding volume and threshing clearance on the load force of the piston rod of the hydraulic cylinder; Zhang et al. [
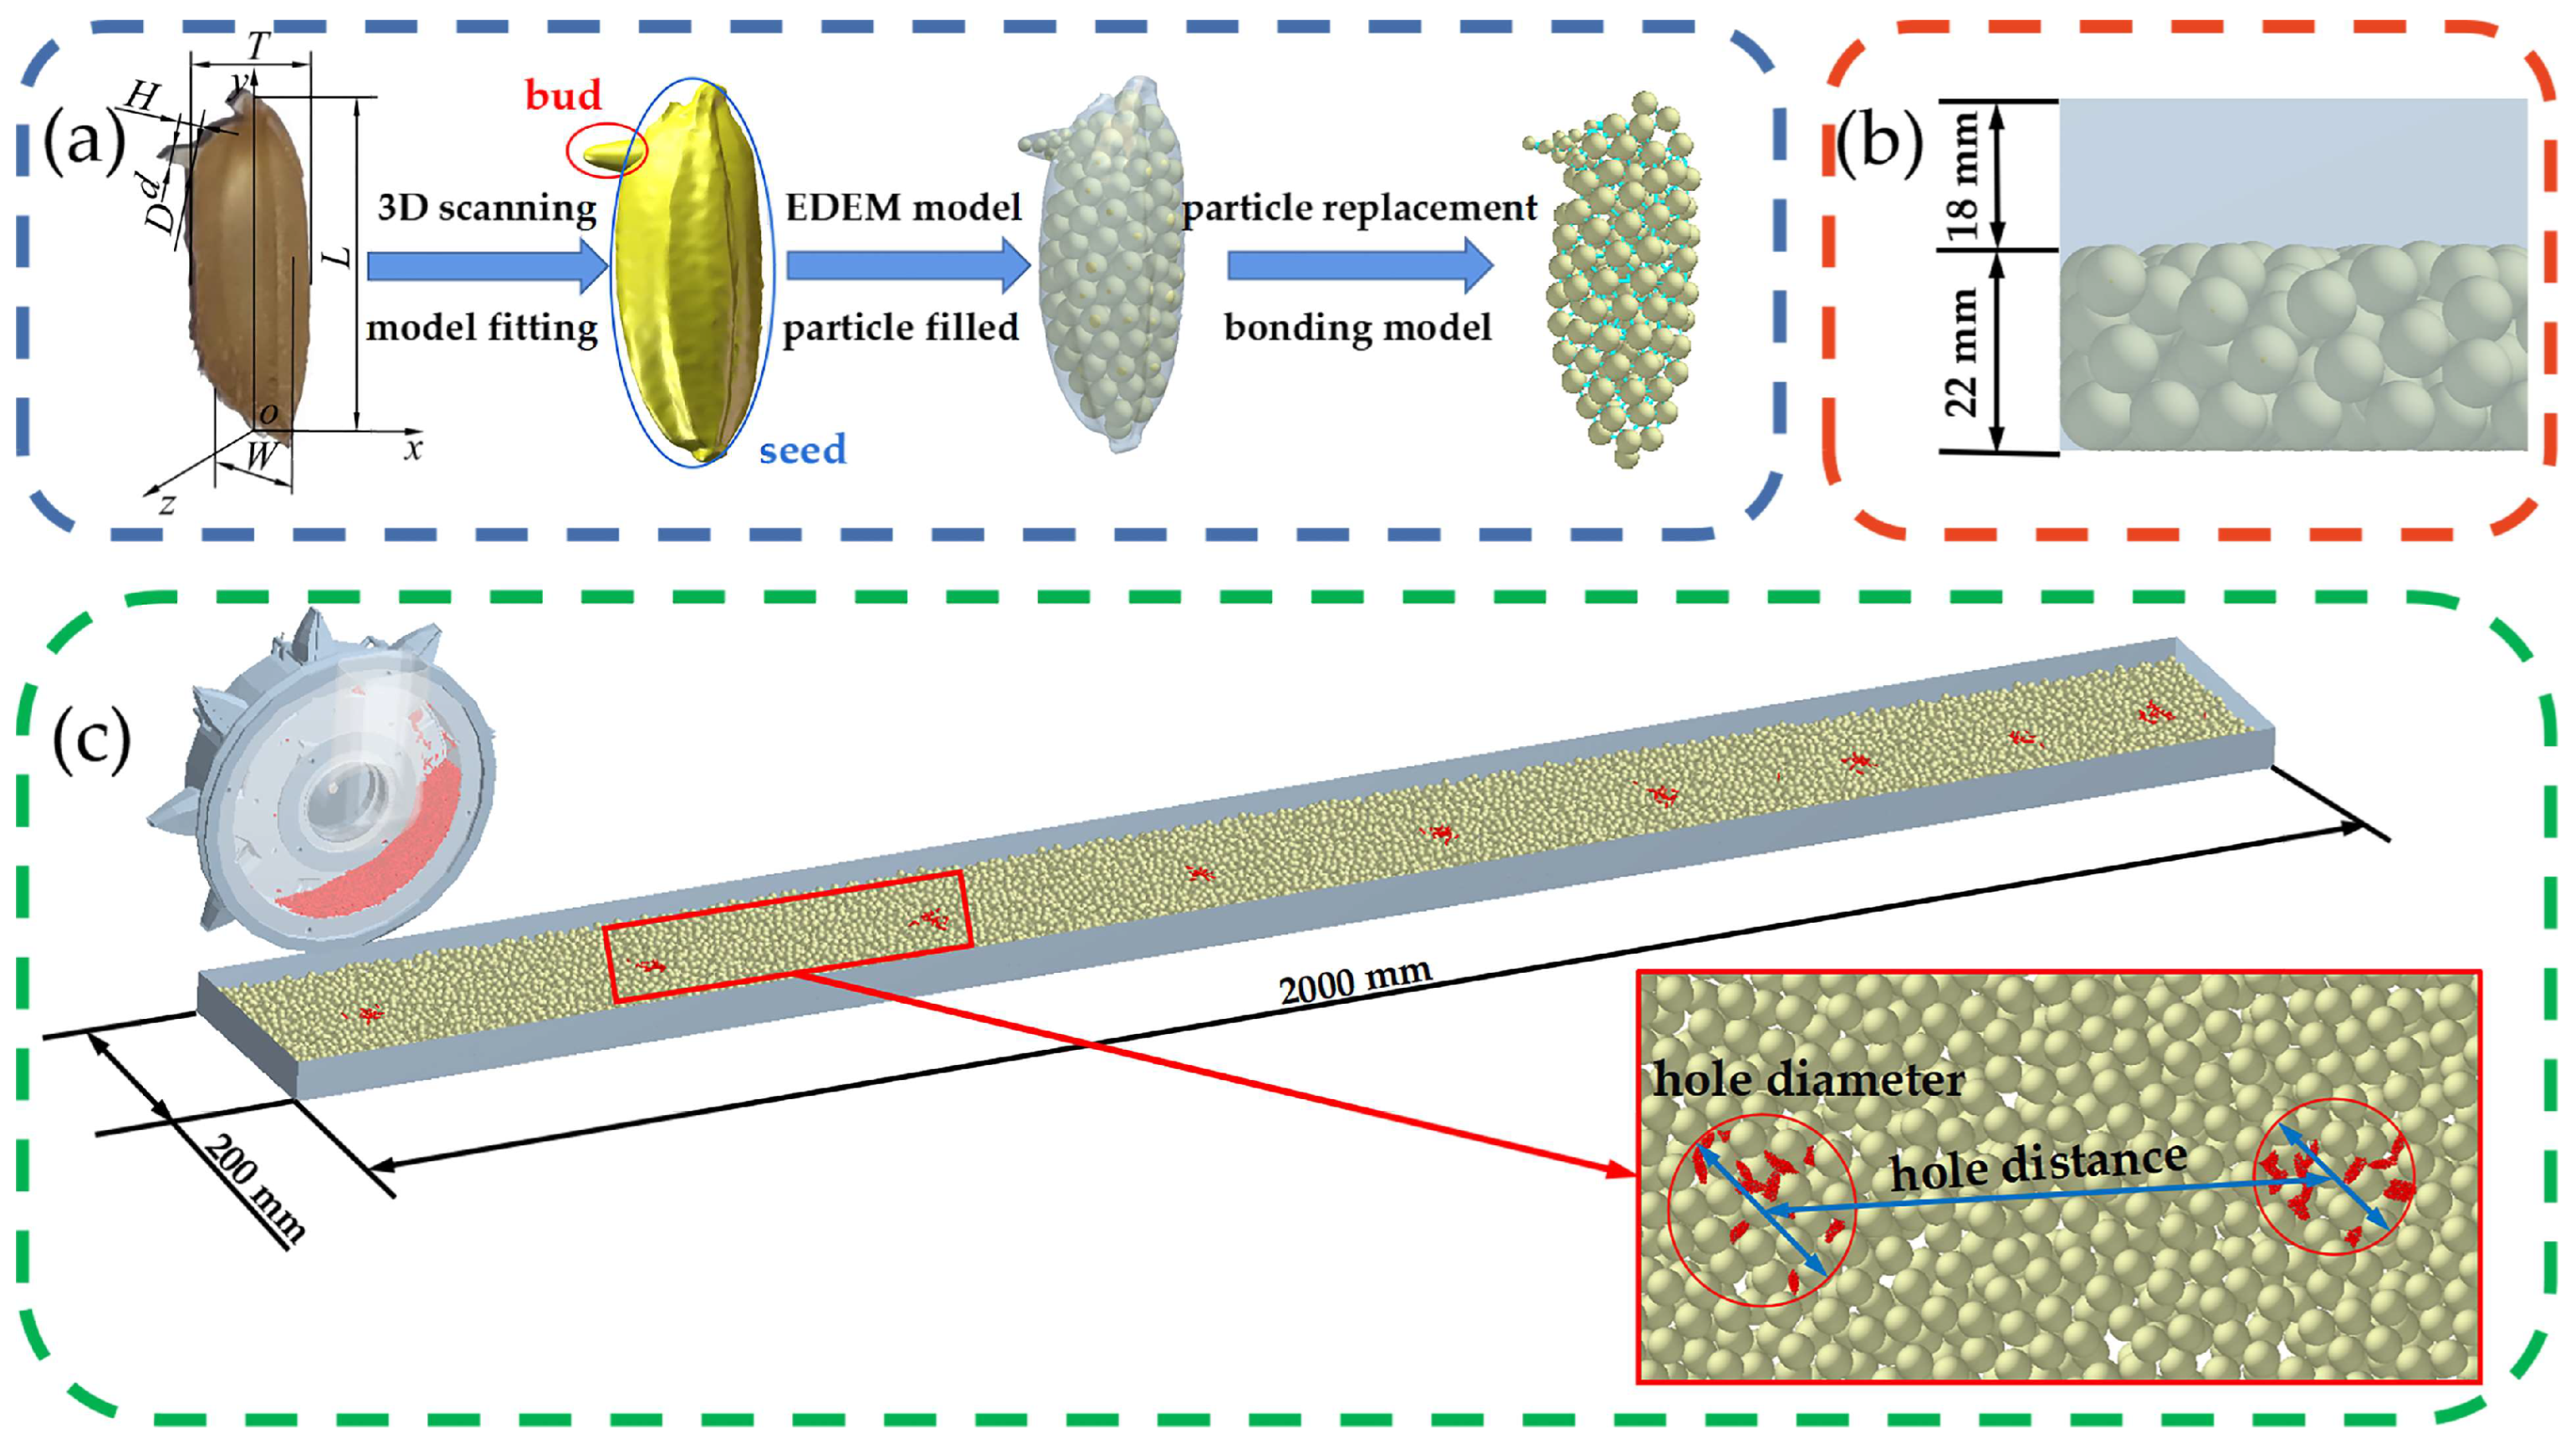
23] used MBD–DEM two-way coupling to analyze the harvesting process. Therefore, the coupled simulation method has been proven to be able to fully explain the interactions between the design components and the particles along with the particle motion. Before direct seeding in paddy fields, it is often necessary to prepare rice seeds by sunlight drying, sorting, soaking and germinating to shorten the rice growth period. These processes continue until seedlings with a length of 1–2 mm are obtained, after which they are ready for planting [24,25]. Previous studies have generally used an ellipsoidal model with multiple particles as a simplified model for rice seeds and did not address the effects produced by sprouting after seed soaking. Since the buds of the sprouting seeds are fragile, they can easily be damaged in the process of seeding, which reduces the seed emergence rate and prolongs the growth time of rice. Therefore, in this study, a bonding model was used to establish a rice seed and bud model and to determine the actual damage to the seeds under different bonding conditions. Although MBD–DEM coupled simulation has been applied to analyze the mechanisms of many devices in recent years, it has not yet been applied to research a mechanical sprouting rice seed seed-metering device.
High-speed camera technology can quickly create a record of a high-speed object’s trajectory, and it has the advantages of rapid image recording, clear images and real-time target capture [26]. Zahra and Saman [27] used the high-speed camera technique to record a falling seed’s trajectory. By extracting the trajectory equations, they determined the effective factors affecting the uniformity of seed hole distances under laboratory testing and field testing conditions. In order to improve the seeding performance in mountainous areas, Xing et al. [28] designed a pneumatic rice seed-metering device with an adjustable seeding rate and used high-speed camera technology to research the seed throwing mechanism in order to establish the trajectory equation of the thrown seeds. By comparing the theoretical trajectory area with the actual one, the seeding performance of the seed-metering device was optimized. In the above studies, theoretical research and analysis of a segment of the trajectory during the seed throwing process was conducted solely using high-speed camera technology without further investigation into whether the post-landing motion of the seeds would impact the hole-forming performance. Furthermore, these studies did not take into account the additional interference of the seeding mechanism on the seeds, which can cause the actual trajectory of the seedlings to deviate from the theoretical trajectory, resulting in variations in seedling hole diameter and spacing and thus affecting the growth space and time required for the seedlings.
In response to the above issues, this study developed a side-filled rice precision hole direct seed-metering device and analyzed its operational mechanism. We employed MBD–DEM coupled simulation to assess the force and motion of seedlings within the planter, used high-speed camera technology to analyze factors affecting the seed-throwing trajectory, and conducted both single-factor and multi-factor bench tests to investigate the seeding performance of the seed-metering device.

2. Materials and Methods

2.1. Overall Structure and Working Principle of Side-Filled Rice Precision Hole Direct Seed-Metering Device

The structure of the side-filled rice precision hole direct seed-metering device is displayed in Figure 1 and is primarily constituted of the shell, seed-metering plate, seed guide plate, bearing end cover, bearing, seed tube, fork duckbill assembly device, fixed end cover, contact device, etc.
When the rice seed-metering device is in operation, the rice bud seeds rotate with the seed-metering plate and move into the interior of the device from the seed guide plate. The internal seed-metering plate starts to rotate counterclockwise under the action of a belt drive. The rice bud seeds fill the holes in the seed-metering plate under the combined effect of gravity, centrifugal force and the interaction force among the seeds. Due to the rotating action of the seed-metering plate, any excess seeds covering the holes are returned to the filling chamber, ensuring that each hole contains 12 to 16 rice seeds, which are then smoothly transported to the fork duckbill assembly device. Finally, when the fork duckbill collides with the contact device, the duckbill unit opens in a fixed position so as to realize the direct seeding of rice bud seeds into holes and thereby improve the hole diameter qualified index of the bud seeds and reduce the hole distance variation index [29].

2.2. Analysis of Seeding Mechanism

In order to ensure the seeding performance of the seed-metering device and improve the stability of the seed supply, mechanical analysis of seeds during the seeding process is an important method and approach to investigate the seed filling mechanism. The seed filling stage exerts a significant influence on the movement of and damage to the bud seeds, the seed cleaning stage is closely related to the seeding performance, and the seed throwing stage directly affects the hole-forming performance and seeding uniformity. In conclusion, it is necessary to explore the mechanisms of the different seeding stages of the seed-metering device.

2.2.1. Filling Stage

In the seed filling area, the bud seeds collectively maintain a certain mobility with the rotation of the seed-metering plate. Individual target seeds fill the interior of the hole by a combination of gravity, centrifugal force, friction and interaction force among the seeds. Since the seeds are characterized as scattered particles in the seed filling chamber, the seed filling process for individual target seeds can be analyzed. The auxiliary coordinate system xOy is set up by taking the center of the seed-metering plate as the reference point, and Figure 2a illustrates the force distribution of the target seed. The force equation for a bud seed is then established as:
m a = G 1 cos α + F N 2 sin α f 1 f 2 cos α 0 = F N 1 + G 1 sin α F N 2 cos α f 2 sin α F f = f 2 + f 1 cos α 0 = F C + m g cos θ F N f i = μ i F N i G 1 = m g sin θ
where FN1 is the supporting force of the seed guide port on the target seeds, N; FN2 is the force of the surrounding seeds on the target seeds, N; f1 is the friction force of the seed guide port on the target seeds, N; f2 is the friction force of the surrounding seeds on the target seeds, N; a is the target seed acceleration, m/s2; α is the inclination angle of the seed guide groove, (°); θ is the angle between the horizontal line and the line formed by the center of mass of the target seed and the origin, (°); μ1 is the friction coefficient between the seed guide port and a bud seed; and μ2 is the friction coefficient between bud seeds.
From Equation (1), it follows that:
m a = G ( 1 + μ 1 sin α ) + F N 2 [ sin ( 1 μ 1 μ 2 ) cos α ( μ 1 + μ 2 ) ] F N = m ω 2 r + G cos θ F N F N 2
According to Equation (2), the effective acceleration of a target rice bud seed is dependent on the angular velocity ω, the material properties of the bud seeds μ1 and μ2, and the inclination angle α of the seed guide groove. Based on the principles of the device, it is understood that, if keeping the inclination angle of the seed guide groove constant, an increase in angular velocity results in greater acceleration generated by the combined force affecting the rice bud seeds, leading to improved seed filling efficiency of the seed guide plate. With the purpose of exploring the appropriate rotation speed of the seed-metering device, the speed was designed to be 30, 40, 50, 60 or 70 r/min.

2.2.2. Cleaning Stage

In the seed cleaning area, the bud seed filling the hole mainly relies on its own gravity and centrifugal force to achieve cleaning, and there are three types of seed cleaning situations in this stage. As shown in Figure 2b. The seeds in the hole cannot move freely in the seed cleaning process, and they always exist in the hole until the seed delivery stage. The seeds outside the hole slide back to the seed filling chamber under the influence of the force of the seed-metering device and their own gravity and thus realize seed cleaning outside the hole. Under the influence of the force of the other seeds inside the hole and their own gravity, the bud seeds in the hole slide out of the hole until they slide into the seed filling area; they achieve seed cleaning in the hole. The seed force equation is established as shown below:
m a 1 = F N 3 m g cos θ m a 2 = F N 4 sin β + m g cos θ cos β μ 1 F N 4 m a 3 = F N 5 sin β + m g cos θ cos β μ 2 F N 5
where FN3 is the support force of the bud seeds in the hole, N; FN4 is the support force of the bud seeds outside the hole, N; FN5 is the support force of the bud seeds on the hole, N; θ is the angle between the line connecting the center of mass of the bud seeds and the center of the seed-metering plate and a horizontal line, (°); β is the angle of inclination of the hole surface, (°); and a1, a2, a3 are the accelerations of the target bud seeds for three different cases, m/s2.
From Equation (3), it can be obtained that:
m a 2 = m g cos θ 1 + cos β μ 1 / sin β m a 3 = m g cos θ ( 1 + cos β μ 2 / sin β )
From Equation (4), it can be seen that with the rotation of the seed-metering device, θ gradually increases, the acceleration of the target bud seeds gradually decreases, and the reduction in the seed cleaning effect is not related to the rotation speed. Considering the natural rest angle of the bud seeds, the value of the inclination angle of the hole’s surface should be 38.6–50°, and the inclination angle of this design is set at 45°. In order to ensure that filling of the seed-metering device is stable, we need to conduct experimental tests on the rotation speed of the seed-metering device. For ensuring that the seed-metering device’s casting can meet the agronomic requirements for hole direct bud seed growth, the seeding angle and seeding height need to be tested.

2.2.3. Seeding Stage

After leaving the duckbill unit, the bud seeds are thrown out with initial velocity v0; ignoring the influence of the wind, the rotation of bud seeds and the mutual action between the bud seeds and only considering the role of air resistance and gravity, the trajectory of the falling bud seeds is parabolic. By analyzing the seed throwing motion, the motion trajectory of the bud seeds in three-dimensional space can be converted into a single two-dimensional plane-motion trajectory. Based on different throwing conditions, we can divide the two-dimensional plane-motion trajectory of the bud seeds into different routes, as shown in Figure 2c.
By decomposing air resistance into vertical and horizontal components, we can derive the forces in the x and z directions based on Newton’s second law:
m d 2 x / d t 2 C ( d x / d t ) 2 = 0 m d 2 z / d t 2 C ( d z / d t ) 2 + G = 0
where m is the mass of a rice bud seed group, kg; x is the displacement in the horizontal direction, m; z is the displacement in the vertical direction, m; t is the movement time of the throwing process, s; C is the coefficient of air resistance; and G is the gravity of the bud seed group, N.
The equation for the air resistance of a thrown bud seed group is:
F = C ρ A v 0 2 / 2
where F is the air resistance of the bud seed group, N; ρ is the air density, kg/m3; A is the windward area of the bud seed group, m2; and v0 is the initial speed of the bud seed group, m/s. From the Equation (6), the vertical force of the air resistance in the process of throwing down is:
F Z = C ρ A v 0 v 0 z / 2
where v0z is the velocity in the vertical direction, m/s; and FZ is the air resistance in the vertical direction, N. Substitute Equation (7) into Equation (5) to obtain:
t = 4 m z / C A ρ v 0 v 0 z 2 G
The air resistance in the horizontal direction is:
F X = C A ρ v 0 v 0 x / 2 0 = m d 2 x / d t 2 F X
where v0x is the velocity in the horizontal direction, m/s; and FX is the air resistance in the horizontal direction, N. Substitute Equation (9) into Equation (8) to obtain:
x = C A ρ v 0 v 0 x z / 2 G C A ρ v 0 v 0 z
Through calculation of Equations (6)–(10), the time the bud seed group is in the air and the throwing distance can be obtained. Through analysis, it becomes evident that the primary factors influencing the state of the rice bud seed group during descent include the initial speed at which the bud seed group leaves the duckbill unit, its initial height and the throwing angle. According to the above analysis, these factors can be known about the seed-metering device: the initial speed of the bud seed group is determined by the rotation speed, the initial height is related to the installation height, and the throwing angle depends on the installation angle of the contact pin. These analyses provide a theoretical basis for further testing of the seeding performance and the hole-forming performance.

2.3. MBD–DEM Coupling Simulation Test

In this study, a coupling simulation methodology was used to investigate the operation mechanism of the bud seeds in a seed-metering device at different rotation speeds using EDEM (2020, Altair Engineering Inc., Troy, MI, USA) and ADAMS (2020, Mechanical Dynamics Inc., Los Angeles, CA, USA) software. The simulation tests were conducted on a high-performance workstation equipped with two Intel® Xeon® CPU E5-2680V4 @ 2.40 GHz CPUs and 128 GB of RAM. The velocities and positions of the key components were controlled by calculating the equations of motion in ADAMS, and the data were transferred into EDEM through the coupling interface software ADAMS Co-simulation to analyze the motion process of particle collision, as is illustrated in Figure 3.

2.3.1. Discrete Element Model Establishment

(1)
Rice bud seed discrete element model establishment
A representative cold land rice from northern China, “Longjing 31”, has been recognized by the Ministry of Agriculture of China as a major super rice variety and has been widely planted in Heilongjiang Province for many years. It has the advantages of neat field growth, fast fruiting speed, low rate of empty grain, strong resistance to inversion and cold tolerance. After sunlight drying, selecting, soaking and drying, experimental bud seeds with a bud length of 1–2 mm were obtained. In order to ensure that the discrete element model of rice bud seed was consistent with the actual model, 100 bud seeds were selected and measured using a vernier caliper, and the triaxial arithmetic mean values of the bud seed bodies and bud lengths were obtained through statistical calculations.
Bud seeds that matched the average values were selected, and their 3D point cloud data were obtained by scanning the selected bud seeds with a 3D scanner. The 3D mesh geometry model of bud species was synthesized from 3D point cloud data by reverse-engineering technology and were filled using a Hertz–Mindlin model with bonding particles as shown in Figure 4a.
(2)
Soil tank discrete element model establishment
The paddy field soil during the seeding period of rice was taken as reference, and its soil characteristics were as follows: black soil with certain plasticity, strong adhesion, large water content and agglomeration phenomenon between particles. The soil particle model was established based on the relevant literature [30], and the radius of the soil particles was set to 4 mm. Due to its certain adhesion and large moisture content, the contact model chosen for soil particle interactions was Hertz–Mindlin with JKR, and the surface energy of JKR was set to 7.91 J/m2 [31]. The size of the established soil box model was 2000 mm × 200 mm × 40 mm, as shown in Figure 4.

2.3.2. Boundary Conditions and Parameter Settings

In the EDEM 2020 software, the particle factory was set to generate a quantity of 3000 bud seeds, and the overlap check was set to the contact radius. Under the influence of gravity, the bud seed particles fell freely into the interior of the seed filling chamber until the bud seed particles were stabilized. The EDEM file was regenerated with 0 moments after the stable generation of bud seeds and soil particles. In the ADAMS 2020 software, setting the motion trajectory of the seed dispenser included: accelerating the rotation to the specified rotation speed in 0–0.5 s, maintaining uniform rotation and completing the filling process of bud seed particles in 0.5–2 s, starting the horizontally accelerated motion in 2–2.5 s, and after 2.5 s, the seed-metering device maintained uniform horizontal motion and uniform rotational motion to complete the seeding operation. In the EDEM 2020 software, the time step was set to 2 × 10⁻⁶ s. In the ADAMS coupled simulation file, the time step was set to 5 × 10⁻⁵ s. In order to economize the occupied memory, the saving time interval was set to 0.01 s. The bud and seed bodies of rice bud seed were separated prior to testing, and the two materials were subjected to compression and shear tests, respectively, by means of an electronic texture analyzer. By comparing the viability of the treated bud seeds, it was determined that the limiting force value for damage to the seed body was approximately 20 N, and the limiting force for the bud body was approximately 0.1 N. By checking related references [32,33,34,35], other important simulation parameters used in this study were finally obtained, as shown in Table 1.

2.3.3. Test Content

During the bench test of the seed-metering device, it was impossible to precisely investigate the seed filling effect and the bud seed-breakage mechanism, while the coupled simulation technology of the EDEM and ADAMS software can visualize and analyze the motion state and force effect of the bud seed in the seeding process. The degree of bud damage is closely connected to the rotation speed of the seed-metering device and is independent of the seeding height and angle [36]. In summary, a single-factor test needs to be conducted, with rotation speed as the test factor. To reduce the simulation time, the single-factor test was divided into two parts: the test part of seeding performance and the test part of hole-forming performance. The rotation speeds of the simulation test were 30, 40, 50, 60 and 70 r/min.

2.4. Bench Test

2.4.1. Test Environment

The test was conducted on “Longjing 31”, which has a thousand-grain weight of 362.5 g, a moisture content of 16.24%, and is a conventional rice variety from the cold northern region of China. The key device parts were produced by 3D printing technology (precision of 0.1 mm; resin material). The indoor seeding performance test of the device was carried out by relying on a JPS 12-type computer vision seed-metering device seeding performance test bench, as shown in Figure 5. The single-factor test was a high-speed testing process, and the seeding process was analyzed using a pco.dimax cs1 high-speed camera (PCO Company, Kelheim, Germany).

2.4.2. Test Content

(1)
Single-factor test
High-speed camera equipment was employed to track the rice bud seeds during the seed-metering device seeding process, to analyze the changes in the rice bud seed group shape, and to examine the effects of different test factors on seeding performance and hole-forming performance during the seeding process. The rotation speed X1, seeding angle X2, and seeding height X3 were taken as the test factors, and the seeding qualified index Y1, the leakage index Y2, the multiple index Y3, the breakage index Y4, the hole diameter qualified index Y5, and the hole distance variation index Y6 were taken as the test indexes. Each set of trials was replicated three times, each test measured and recorded 150 bud seed holes, and the resultant data were averaged. The test coding table is shown as Table 2.
(2)
Multi-factor test
Based on the single-factor test results for optimizing the design parameters of the seed-metering device, the study used rotation speed (X1), seeding angle (X2), and seeding height (X3) as test factors and hole diameter qualification index (Y1) and hole distance variation index (Y2) as test criteria. A three-factor and five-level quadratic regression orthogonal rotation center combination test method was designed, and the test coding table is presented as Table 3.

2.4.3. Data Processing

Through the field investigation, it is known that the seeding number of bud seeds is generally 12–16 seeds per hole, which will be used as the evaluation index to verify the seeding qualified rate of the seed-metering device. Referring to ISO standard 7256/1-1984(E) [37], the evaluation index equation is:
Y i = n i / N × 100 % , i = 1 ~ 5 Y 6 = ( L L ¯ ) 2 / ( N 1 ) L ¯ 2 × 100 %
where n1 is the number of total holes with fewer than 12 seeds in each group; n2 is the number of total holes with 12–16 seeds in each group; n3 is the number of total holes with more than 16 seeds in each group; n4 is the number of total seeds with epidermal damage, bud breakage or seed body breakage in each group; n5 is the number of total holes with diameters less than 50 mm in each group; N is the number of total holes in each group; L is the sample hole distance, mm; L ¯ is the average sample hole distance, mm; and N is the number of total holes in each sample group.

3. Results and Discussion

3.1. Stress Analysis and Motion State of Seeds during Seeding Process

In this part, by simulating the seeding process under different rotation speeds, the bud seed flow states of the filling chamber and the effects of the key components on the bud seeds were investigated. The rotation speed of the seed-metering device was 30–70 r/min at five levels.
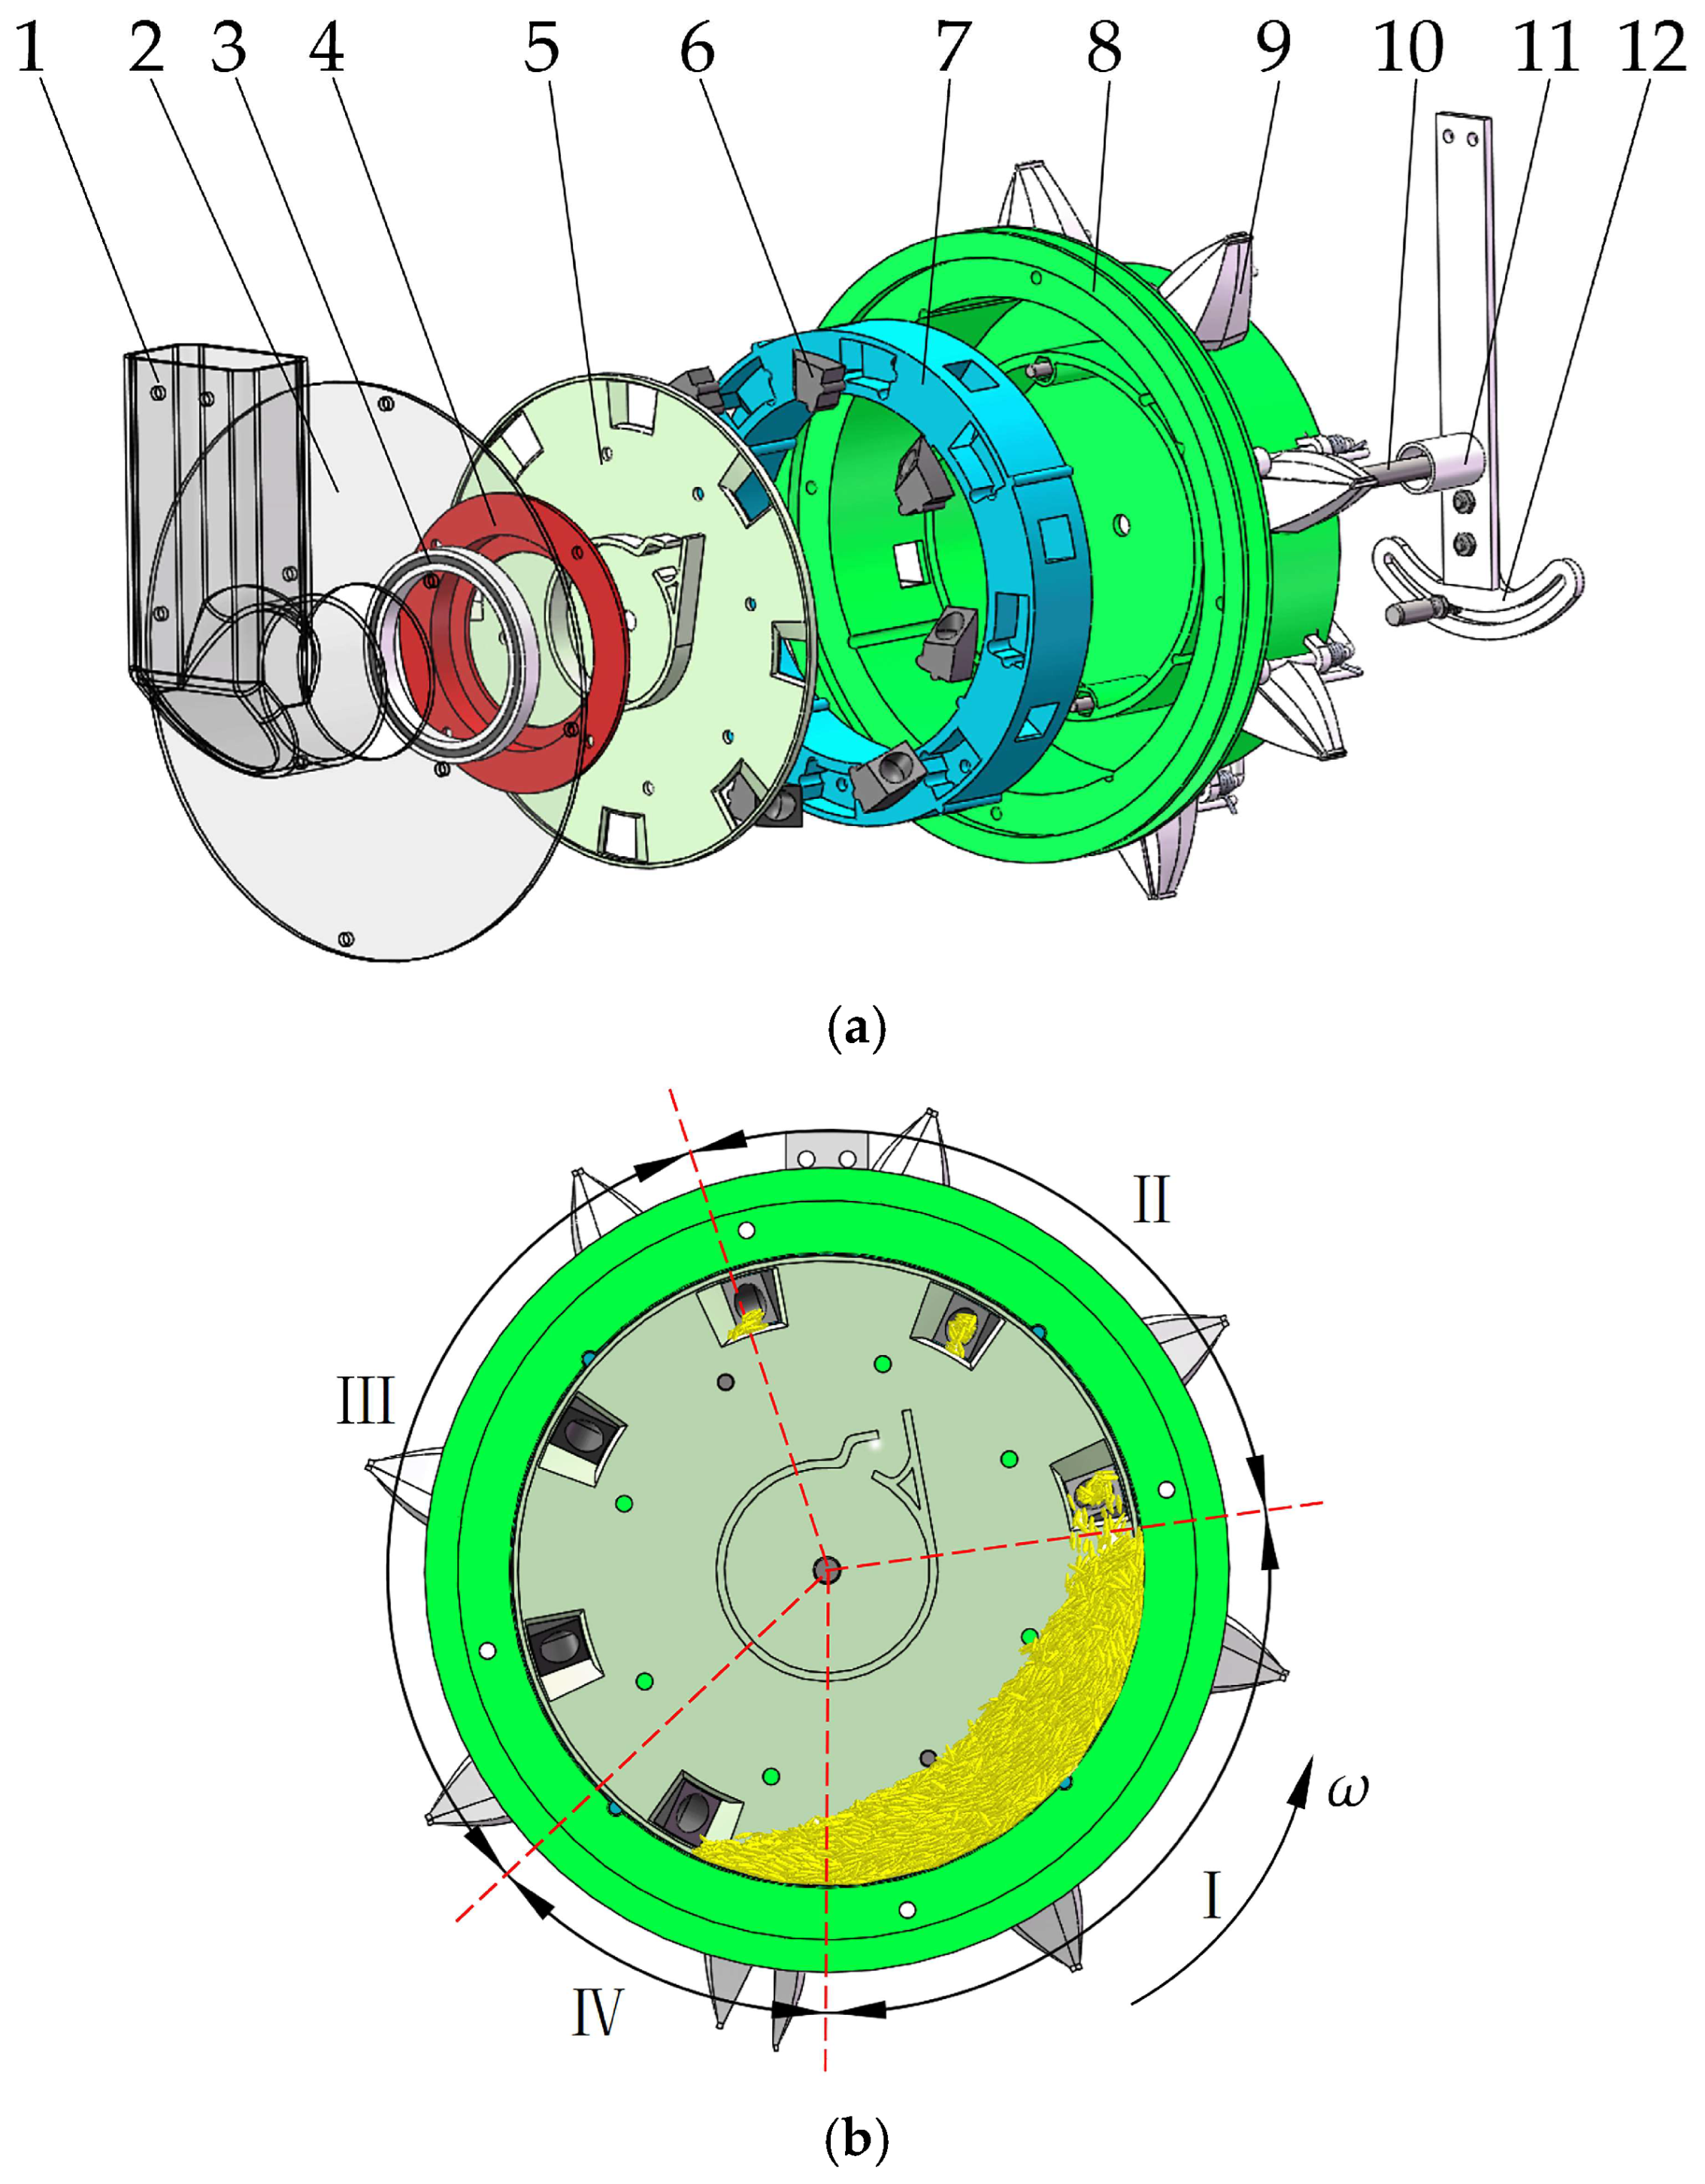
The coupled simulation process includes the rolling stage of bud seeds in the seed filling chamber and the seeding stage. In order to investigate the motion of and forces on the bud seeds in the seeding operation, after the movement of the device was stabilized, one of the bud seed holes that completed the seeding operation was selected and marked, and the combined force that the bud seed suffered during different stages of motion was extracted. As shown in Figure 6, the red line is the trajectory of bud seed movement, and the yellow arrow represents the direction of bud seed flow. By observing the changes in the posture of the bud seed group, the seeding process was divided into different stages: I is the seed filling stage and has a seed angle of 90°; II is the seed cleaning stage and has a seed angle of 110°; III is the seed carrying stage and has a seed angle of 140°; IV is the seed throwing stage and has a seed angle of 20°.
As depicted in Figure 6, during stages I, II, and III, it can be observed that the force exerted by other rice bud seeds and device components on the target rice bud seed group remained relatively uniform and below 0.06 N. This suggests the absence of any forced shear effects from the key components on the rice bud seeds, and there is no occurrence of seed damage caused by the internal components of the seed-metering device during its operation. At 4.2 s, the bud seed group passed through the throwing stage IV and successfully fell on the soil box with an impact force of 0.13 N. Through observation of the bud seeds falling stably on the soil box, there were no seed breakages, which indicated that the bud seeds can complete the seeding operation stably and safely.
The effect of seed-metering device with different rotation speeds on single bud seeds is shown in Figure 7. As illustrated in Figure 7a, it is evident that the forces acting on the rice bud seeds remain consistent at various speeds, indicating that the damage to the rice bud seeds caused by the key components of the seed-metering device was independent of the rotation speed. When the rotation speed was 70 r/min, the maximum force on the bud seeds was about 0.025 N, which is far less than the ultimate force of the bud seed impact. As illustrated in Figure 7b, rotation speed had no significant effect on the velocity of bud seeds in the filling chamber but had a significant effect on the frequency of bud seed speed changes. This indicates that within the same time, with the increase in rotation speed, the force magnitude and direction change speed of bud seeds were intensified, which was more likely to cause wear and damage to bud seeds.
Among the various stages of the seeding process, the seed filling stage is the most critical period that significantly influences the seeding performance. During the seed filling stage, the force and speed of the rice bud seeds directly impacts the extent of seed damage and consequently affects the seed breakage index. Therefore, further studies and analyses of the seed filling stage are essential.
As shown in Figure 8, the bud seeds in the bottom layer of the seed filling chamber moved inside the seed-metering device with rotation of the seed-metering device and flowed in the opposite direction to the bud seeds in the upper layer. The bud seeds in the upper layer flow faster, and the maximum speed reached 1.5 m/s. However, when the rotation speed was greater than 50 r/min, the speed of the bud seeds in the upper and lower layers did not increase with the increase in the rotation speed and started to maintain a limiting speed without large speed fluctuations.
The bud seeds that filled the seed filling compartment were the bottom layer bud seeds. A comparison between the speed of the bud seeds and the speed of the seed filling compartment revealed that the speed of the bottom layer bud seeds was less than the tangential movement speed of the seed-metering plate, resulting in a certain degree of relative sliding between the two. As a result, higher seed-metering plate rotational speed do not change the flow speed of the bud seeds. According to Equation (2), it is known that if the effective acceleration of the bud seeds remains unchanged, the seed filling effect of the seed filling component of the bud seeds per unit time does not change. By comparing the position of area B, it is clear that the rotation speed does not have a significant effect on the rotation angle in the seed filling stage.
By marking and tracking the bud seed groups in each hole, it can be seen that the range of area A where the seed filling component completes the filling of bud seeds is different at different rotation speeds. According to the comparison of the pictures in Figure 8, it is known that with increasing the rotation speed, the bud seeds waiting to be filled are more and more dense, and the seed filling component can finish the filling operation within a smaller displacement. At 70 r/min, the device only requires 36° of rotation to complete the seed filling process, which only takes 0.086 s. During the seed filling process, the effect of key components and other buds on the buds waiting to be filled should be minimized. Higher rotation speeds allow for faster seed filling and reduced bud stress times but increase the force per unit of time that the seed filling component exerts on the bud seed groups. Relatively, a lower rotation speed will reduce the force of the seed filling component on the bud seeds per unit time but will increase the time of the force on the bud seeds. To examine the influence of seed-filling components and other bud seeds on the filled bud seeds, the EDEM post-processing function was utilized to extract the average force exerted on an individual bud seed during the seed-filling process. The seed-filling stage was subdivided into five sections, with the center of the seed-metering plate serving as the reference point, as illustrated in Figure 9a.
From Figure 9b, it is intuitively obvious that: when the filling parts are in areas I and II, the greater the rotation speed, the greater the resultant force received by the seed group. When the filling components were in areas III, IV and V, the smaller the rotation speed, the greater the combined force received by the seed group. However, the impact of the former on the bud seed group is significantly more pronounced than that of the latter. Therefore, it is evident that the rotation speed should be minimized while still ensuring effective seed filling by the device. When the rotation speed was 70 r/min and the filling area was I, the maximum force exerted on the seed group was about 0.004 N, which is lower than the limiting force of the seed, indicating that the seed-metering device will not directly damage the seed during the filling process.

3.2. Analysis of Throwing Trajectory and Seeding Performance

3.2.1. Analysis of Throwing Trajectory

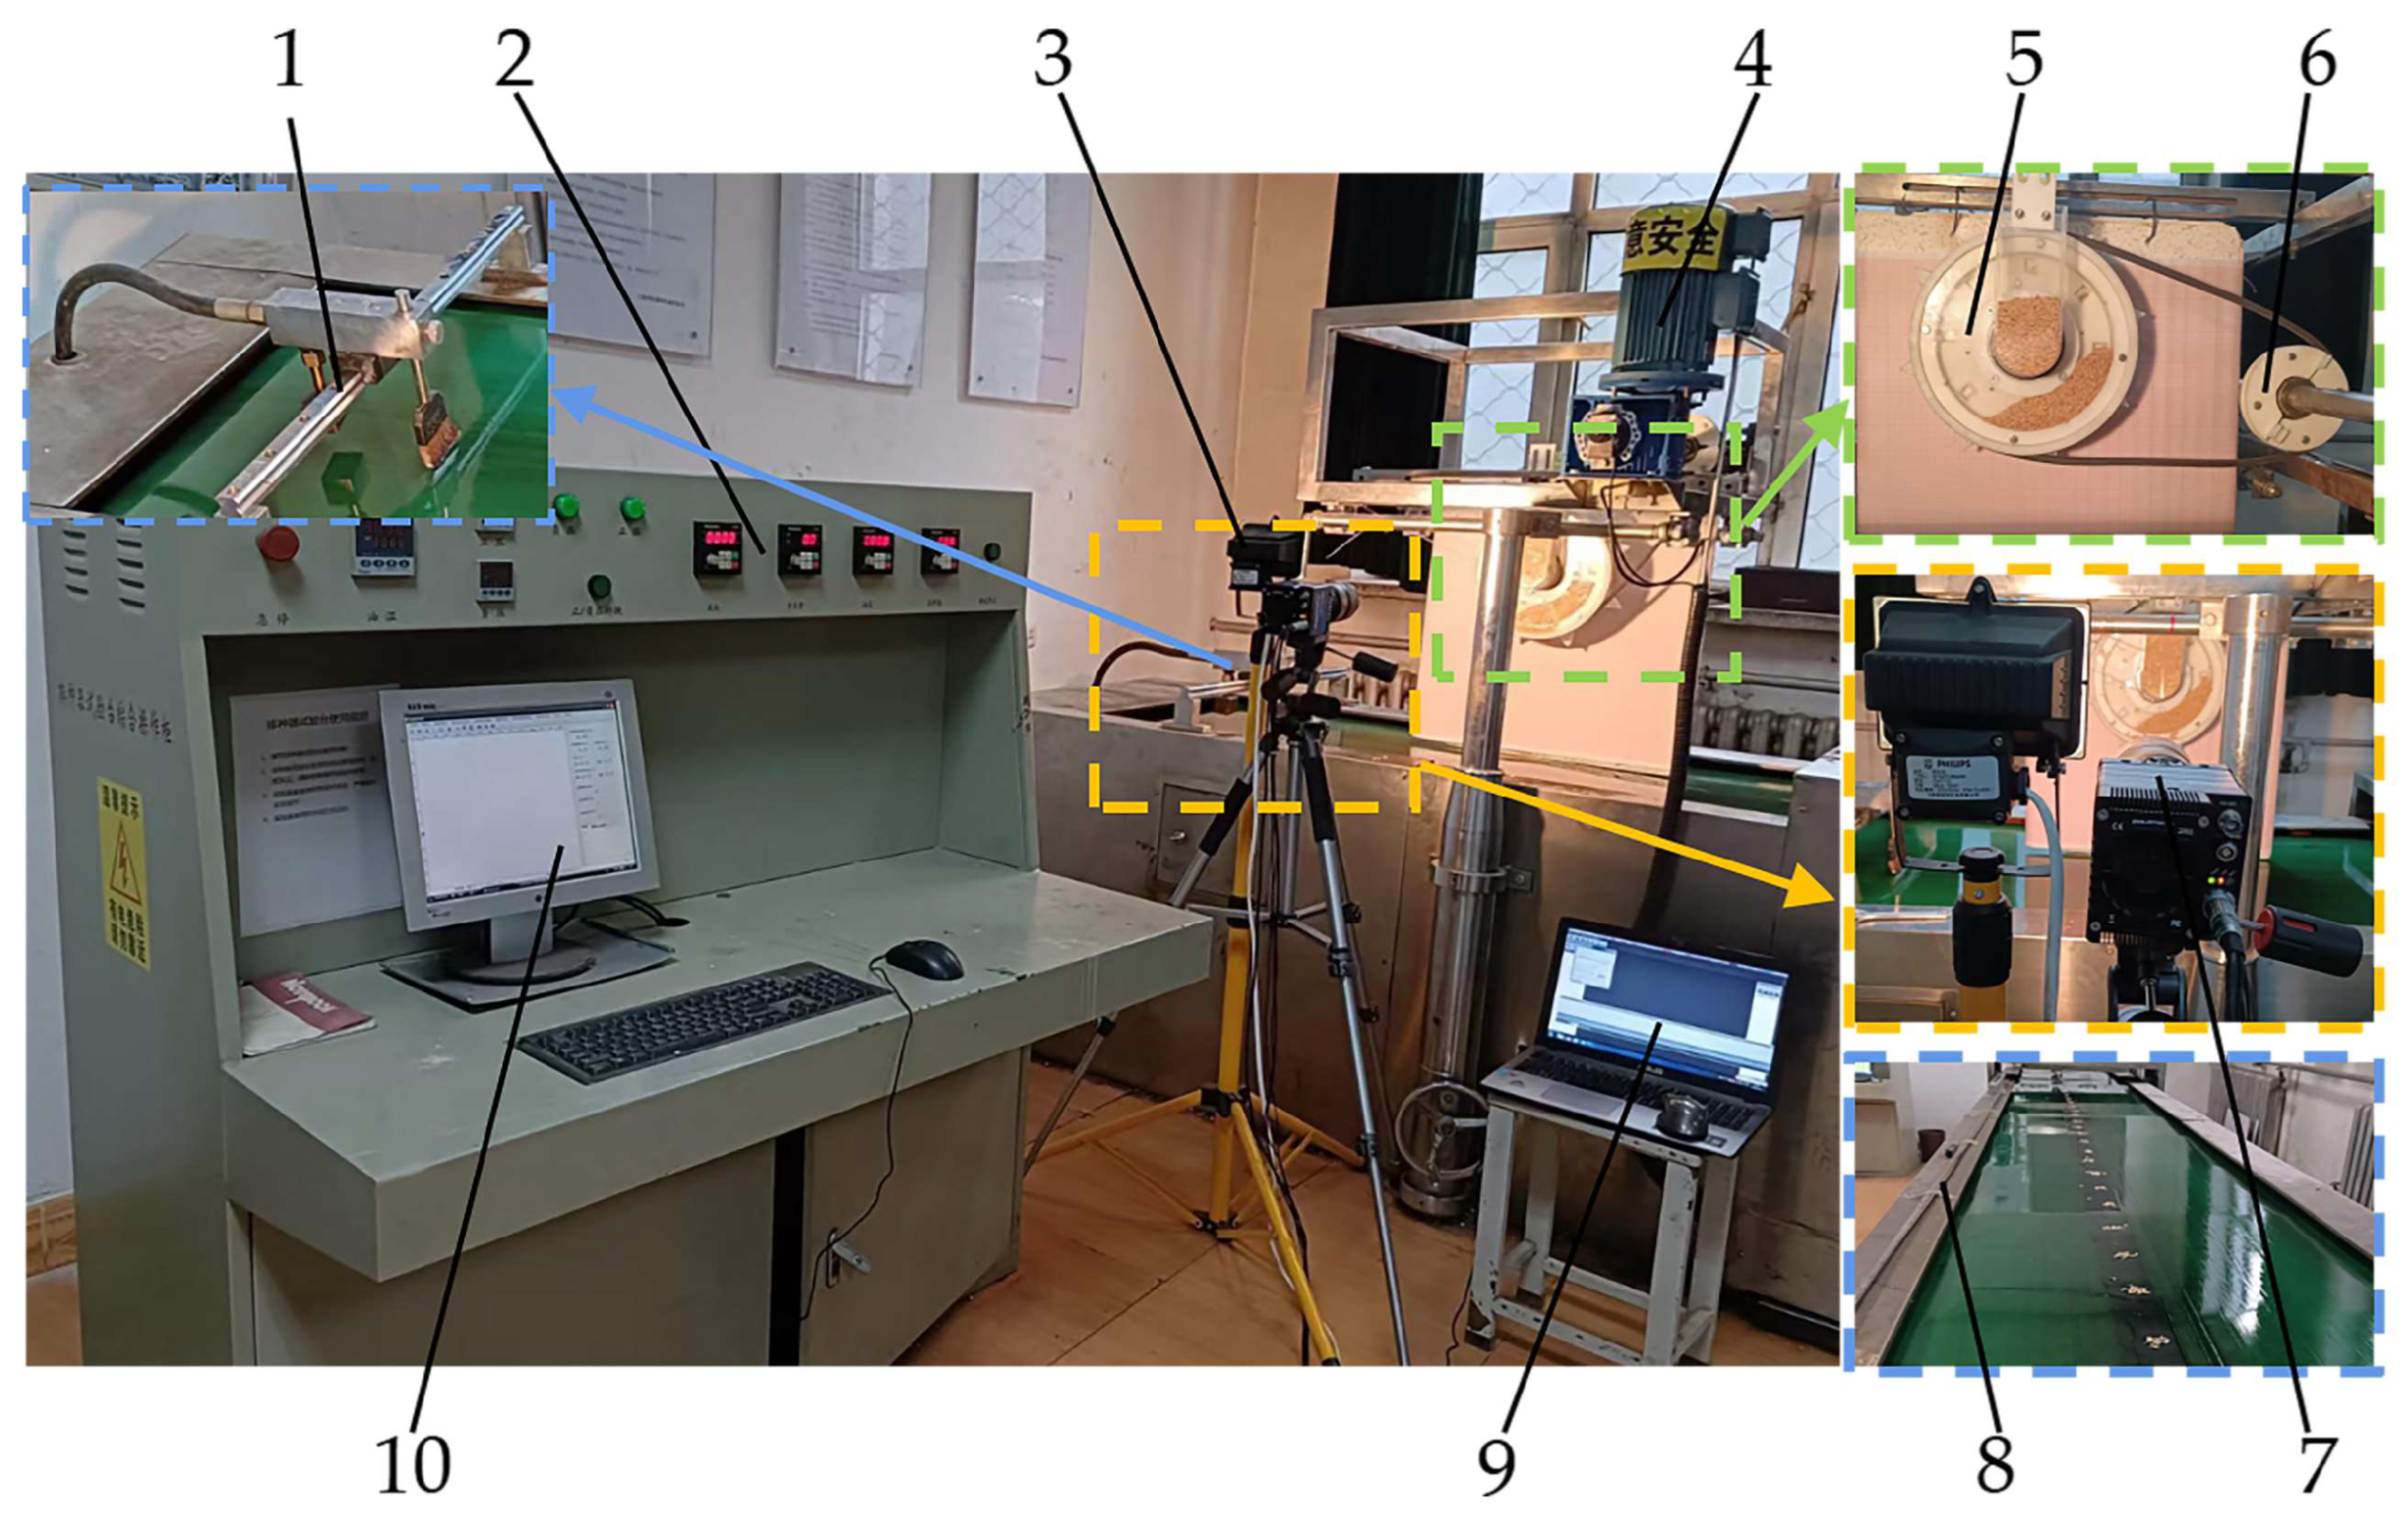
In order to further investigate the main factors that influence the hole-forming effect during the throwing process, high-speed camera technology was utilized to statistically analyze the seeding process, as shown in Figure 10. The working parameters of the high-speed camera are set as throughput/photographic speed: the image resolution is 1600 × 1600; the instrument shoots at 500 fps.
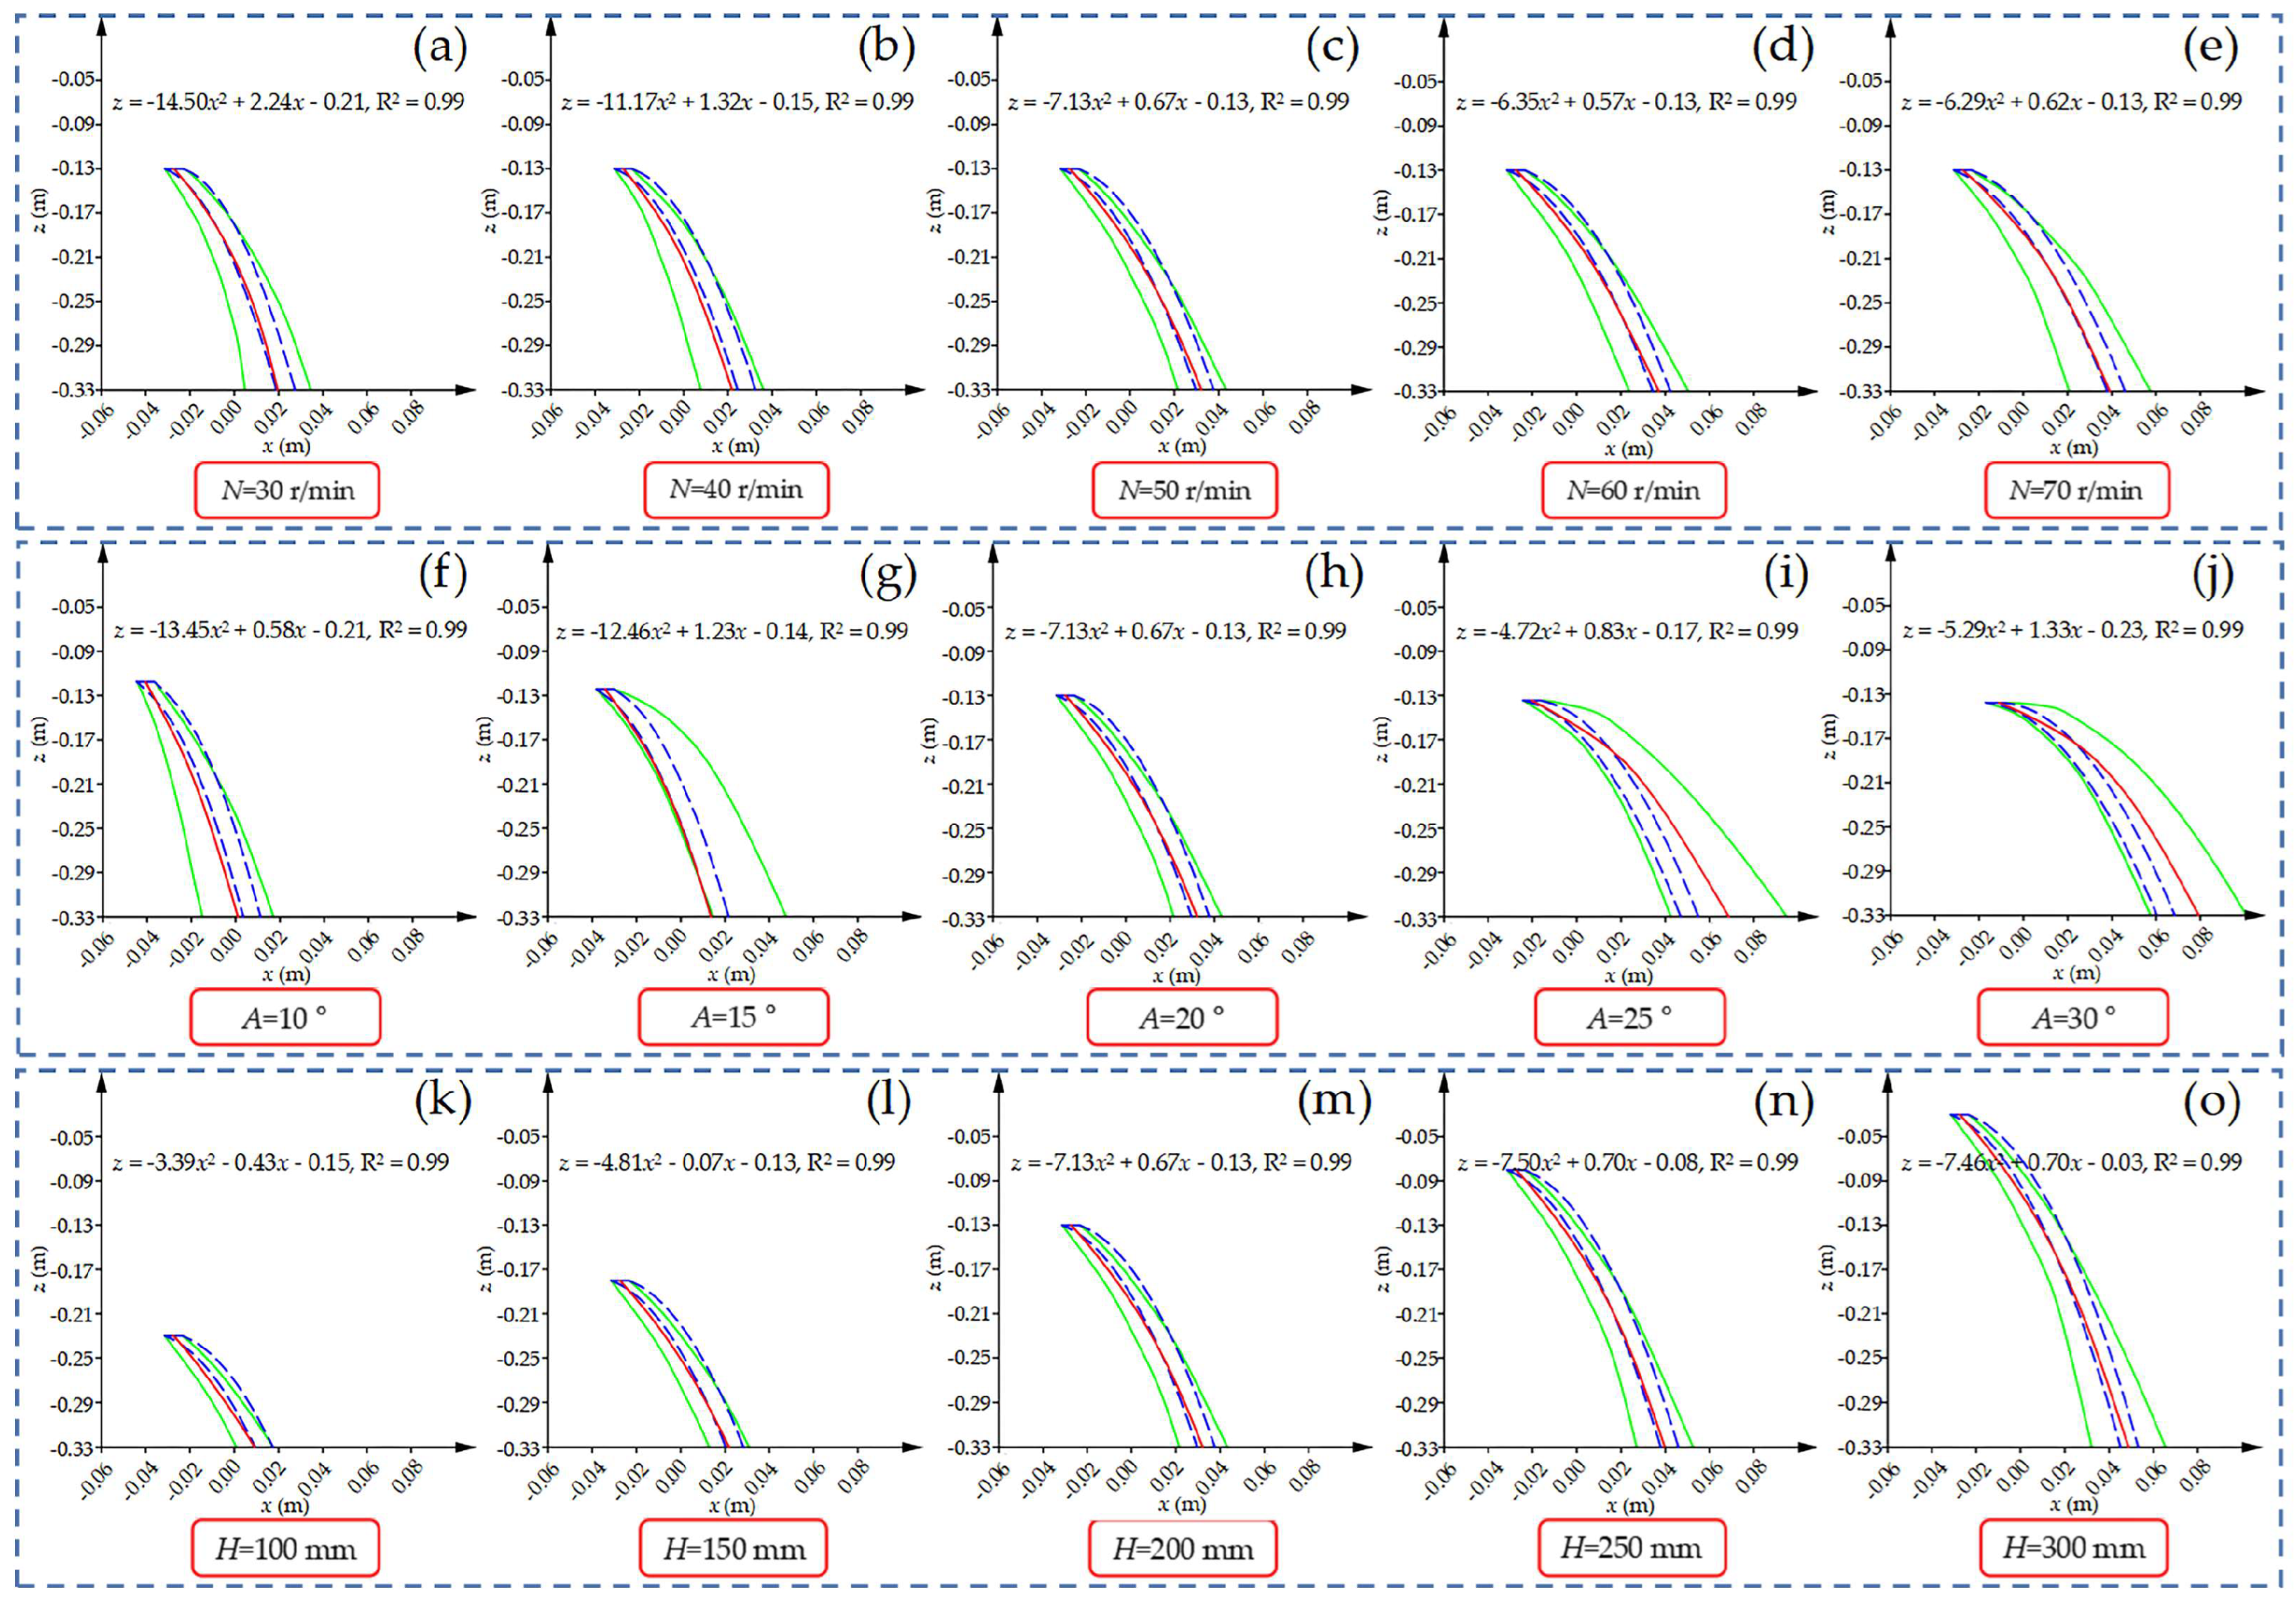
By continuously tracking the seeding trajectory through high-speed camera technology, we saw that different degrees of diffusion appeared in the falling process of bud seed groups. Under the influence of internal slippage, the effect of the duckbill unit on the bud seed group, and air resistance, the flat area of the bud seed group increased continuously, which adversely affected the changes to the hole diameter and hole distance after seeding. With the aim of investigating the causes of the unfavorable factors, it is necessary to analyze the trajectory of bud seed groups. Taking the center of the seed-metering plate as the reference coordinate point, the actual trajectory area of the falling bud seed group is counted, and the theoretical trajectory area of the bud seed group is obtained through a theoretical calculation. By processing and calculating the actual trajectory, the average curve and fitting equation of the actual trajectory are obtained. The final obtained drop trajectory of the bud seed groups is shown in Figure 11.
It is clear from Figure 11 that the rotation speed, seeding angle and seeding height of the seed-metering device all have great influence on the trajectory of the seed group.
The falling trajectories of the bud seed groups at different rotation speeds are shown in Figure 11a–e. As the rotation speed increases, the actual trajectory areas of the bud seed groups show the trend of decreasing and then increasing. The main reason for this phenomenon is that when the rotation speed is low, the individual bud seeds in the bud seed group inside the duckbill unit and other bud seeds have a slip movement, resulting in a small change in the direction and size of the initial speed. As a result, individual rice bud seeds do not follow the theoretical trajectory during ejection. As the rotation speed increases, due to the increase in centrifugal force on the bud seeds, the bud seeds are pressed inside the duckbill unit, and the slip phenomenon is reduced. However, when the end bud seeds of the bud seed group were detached from the duckbill unit, the duckbill unit had already produced a small rotation, resulting in a change in the seeding angle of the end bud seeds and an increase in the area of the seeding trajectory. The diameters of the bud seed holes for five different rotation speeds are less than 50 mm, which meets the agronomic requirements for rice hole direct seeding.
The falling trajectories of bud seed groups under different seeding angles are shown in Figure 11f–j. With the increase in the seeding angle, the actual trajectory areas of the bud seed groups exhibit a tendency of decreasing and then increasing. The main reason for this phenomenon is that: when the seeding angle is larger, the internal slip phenomenon of the bud seed group is serious, and the individual bud seeds do not move according to the theoretical seeding trajectory, resulting in an increase in the actual trajectory area. When the angle of seed casting is small, the angle between the movement direction of the bud seed group leaving the duckbill unit and the vertical direction is larger. The initial velocity of the seed group in the z-axis direction decreases, the initial velocity in the x-axis direction increases, and the throwing distance in the x-axis direction increases, which ultimately leads to an increase in the actual trajectory area. Therefore, the seeding angle affects the actual trajectory more, and the actual trajectory mean line differs from the theoretical trajectory region. The diameters of the bud seed holes for five different seeding angles are less than 50 mm, which meets the agronomic requirements for rice hole direct seeding.
The falling trajectories of the bud seed groups at different seeding heights are shown in Figure 11k–o. With the increase in seeding height, the actual trajectory area of bud seed group increased. In theory, a lower seeding height should result in better hole-forming performance. However, through observations of the seed distribution pattern on the belt of the seeding test bench and comparisons with high-speed camera photos, it was discovered that a lower seeding height can lead to secondary bouncing in the rice bud seed group. Specifically, the bud seeds that landed after seeding were prone to collide with those that had already landed first, resulting in bouncing. The bouncing phenomenon not only enlarged the diameter of the rice bud seed hole but also posed challenges for subsequent rice agronomic management. Therefore, the occurrence of bouncing should be minimized as much as possible, and an appropriate seeding height can effectively reduce the probability of occurrence.

3.2.2. Influence of Each Test Factor on Seeding
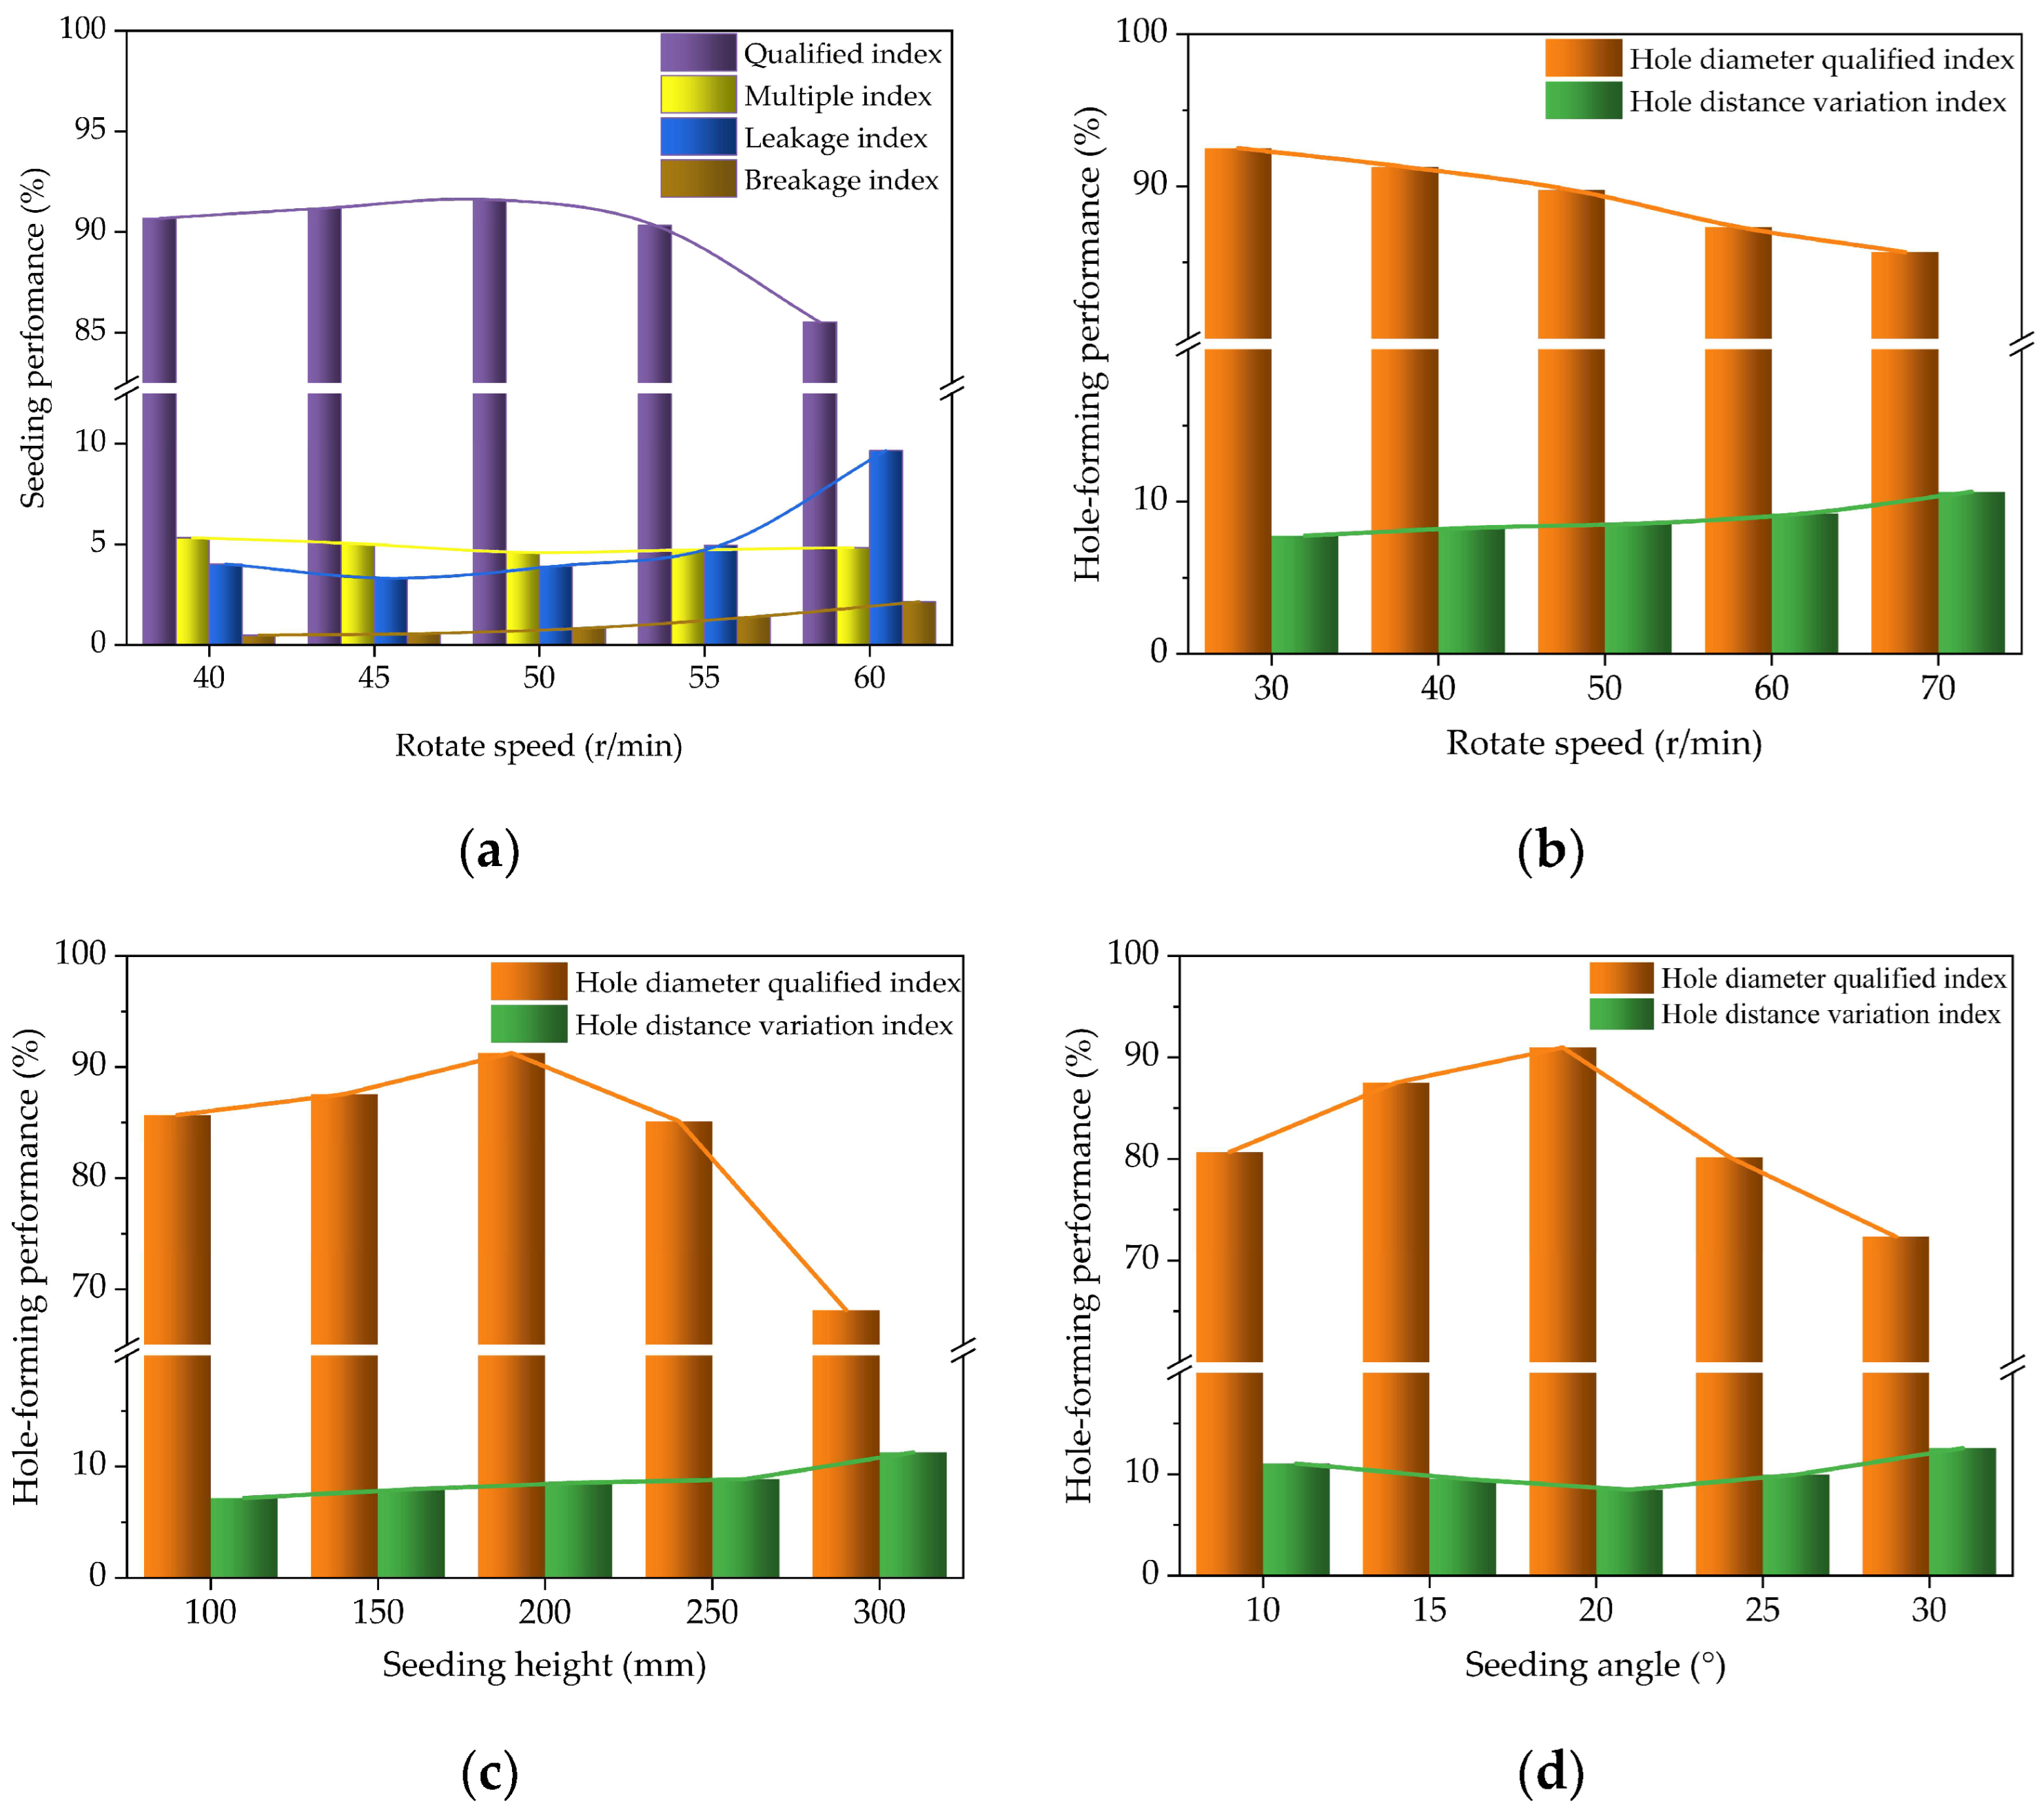
As shown in Figure 12a, with the increase in rotation speed, the seeding qualified index shows a trend of stable increase and then decrease. When the rotation speed was 50 r/min, the seeding qualified index reached the maximum. With the increase in rotation speed, the multiple index gradually decreased, and the multiple index reached the maximum value when the rotation speed was 40 r/min. At this time, the rotation speed of the seed-metering device was low, the bud seeds outside the type hole in the seed cleaning area were subjected to poor seed cleaning, and the centrifugal force and the gravity of the bud seeds could not completely remove the excess bud seeds. With the increase in rotation speed, the leakage index showed a trend of first decreasing and then increasing. When the rotation speed was 70 r/min, the leakage index reached a maximum of 9.66%. Higher rotation speed affected the seed guiding effectiveness of the seed guide plate: part of the hole into the throwing area was not completely filled by the seed, resulting in a higher leakage index. With the increase in rotation speed, the bud seed breakage index gradually increased. The phenomenon of coat breakage on the surface of the bud seeds was aggravated, which affected the growth of the bud seeds. When the rotation speed was 40–60 r/min, the seeding quality was higher. The fitting equation for each index was obtained through the software as:
Y 1 = 0.035 X 1 2 + 3.303 X 1 + 14.636 , R 2 = 0.951 Y 2 = 0.004 X 1 2 0.423 X 1 + 15.914 , R 2 = 0.929 Y 3 = 0.032 X 1 2 2.955 X 1 + 70.970 , R 2 = 0.970 Y 4 = 0.005 X 1 2 0.377 X 1 + 8.218 , R 2 = 0.951
Figure 12b shows that the hole diameter qualified index decreases and the hole distance variation index increases with the increase in rotation speed. When the rotation speed was 70 r/min, the hole diameter qualified index was 85.67%, and the hole distance variation index was 10.64%. Under the premise of the same seeding angle and height, the initial speed of bud seeds leaving the device increased with the increase in rotation speed. Based on Equation (10), it can be seen that the effect of air resistance on the bud seed group increases, and the variability of the force on different bud seeds increases, resulting in a more complicated seeding process and worse hole-forming performance.
Figure 12c shows that with the increase in seeding height, the hole diameter qualified index shows a trend of slowly increasing and then rapidly decreasing, and the coefficient of variation of the hole diameters increases with the increase in height. When the seeding height was between 100–200 mm and the hole diameter was less than 22 mm, the bud seed was prone to bouncing when contacting the oil belt. This led to changes in the hole diameter of the bud seed: the hole diameter qualified index decreased, and the hole-forming performance became worse. Therefore, the qualified hole diameter should be 22–50 mm.
Figure 12d shows that with the increase in the seeding angle, the hole diameter qualified index showed a trend of increasing and then decreasing. When the seeding angle was 20°, the hole diameter qualified index reached the highest value of 90.97%. The hole distance variation index shows a trend of slowly decreasing and then slowly increasing and reached a minimum value of 8.46% when the seeding angle was 20°. This is attributed to variations in the seeding angle leading to differences in the initial velocity direction of the rice bud seed group. Simultaneously, the contact modes of the duckbill unit with different rice bud seeds have subtle variations that result in significant differences in hole-forming performance efficiency.

3.3. Seed Placement Performance Optimization Test Analysis

The multi-factor test scheme and results are shown in Table 4.
To further explore the effects of different factors on the test parameters and explore interactions among multiple factors, multiple regression analysis was performed using Design-Expert 13. This allowed the establishment of a quadratic regression model relating the test parameters to the test factors and the subsequent significance of the test results, as illustrated in Table 5.
As shown in Table 5, the regression model results were extremely significant, the lack-of-fit test results were not significant, and the predicted R2 values were all greater than 0.9, proving that the regression equations can accurately respond to the actual situation. For the hole diameter qualified index, X1×2, X1×3 and X12 were not significant; for the hole distance variation index, X1×2 and X12 were not significant. After excluding non-significant factors, the quadratic regression equations of each test factor and test index were obtained using Design-Expert 13 software:
Y 5 = 2.186 0.210 X 2 2 0.002 X 3 2 + 0.011 X 2 X 3 + 0.166 X 1 + 7.196 X 2 + 0.284 X 3 Y 6 = 202.735 + 0.178 X 2 2 + 0.001 X 3 2 + 0.005 X 1 X 3 + 0.008 X 2 X 3 1.871 X 1 8.268 X 2 0.813 X 3
The variance results show that for the regression equation for the hole diameter qualified index, the influence of different factors on hole diameter qualified index is in the following order from high to low: rotation speed, seeding angle and seeding height. For the regression equation for the hole distance variation index, the influence of different factors on hole distance variation index is in the following order from high to low: seeding height, seeding angle and rotation speed.
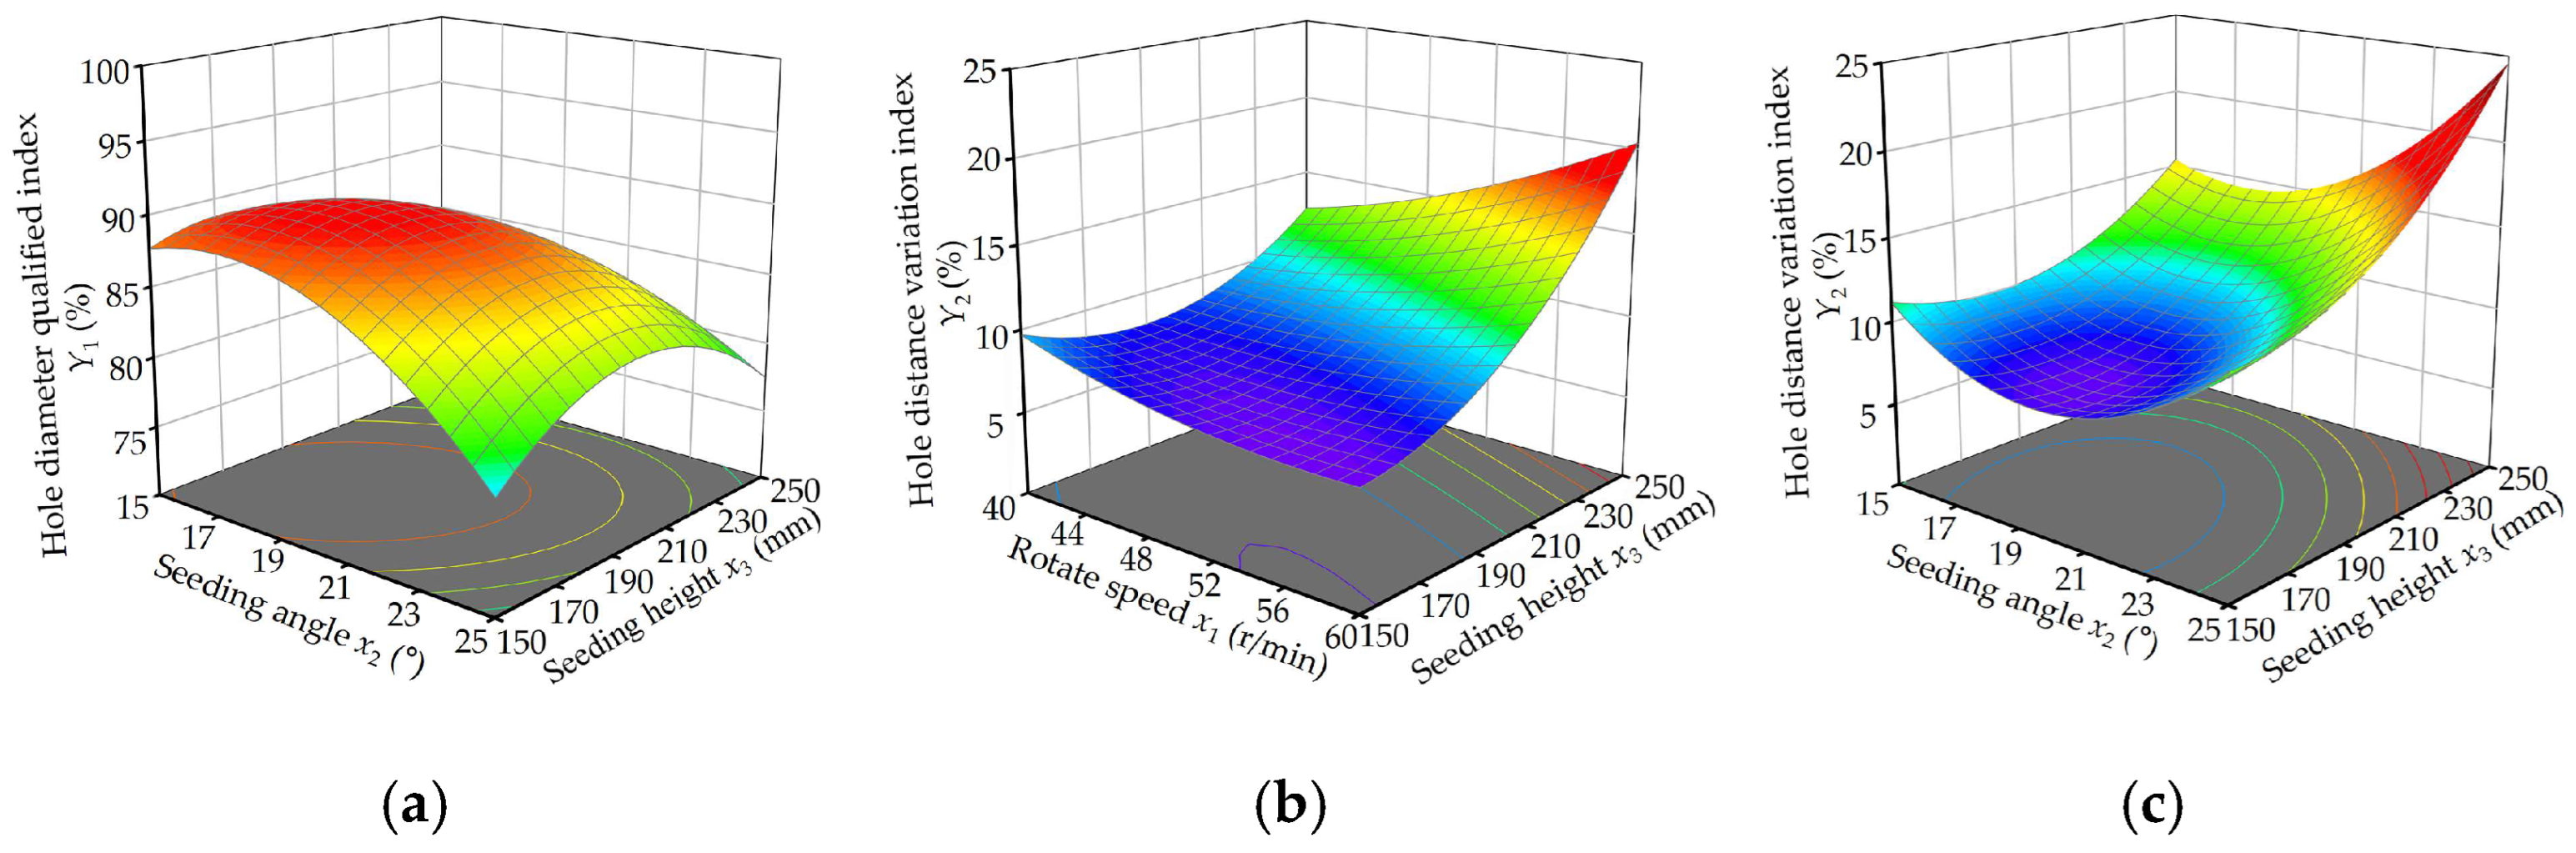
In order to observe more intuitively the impacts of the test factor interactions on the hole diameter qualified index and the hole distance variation index, response surface diagrams were drawn based on the significant terms of the interactions in Table 5, as shown in Figure 13.
The effect of X2×3 interaction on the hole diameter qualified index is significant. According to Figure 13a, when the rotation speed is constant, the hole diameter qualified index shows a trend of increasing and then decreasing. With the decrease in the seeding height, the diffusion effect of the bud seed groups in the process of falling decreases. In addition, as the seeding angle decreases, the initial velocity direction of the bud seed group is closer to the running direction of the conveyor belt, which is conducive to the realization of zero-speed seeding. Therefore, a reasonable reduction in these two variables can effectively improve the hole diameter qualified index of the seed-metering device. However, when the seeding angle was less than 16° and the seeding height was less than 160 mm, the bouncing phenomenon easily occurred, resulting in reduction in the hole diameter qualified index. As can be seen from the response surface diagram, when the seeding angle was 16–20° and the seeding height was 160–200 mm, the seeding qualified index stayed above 90%, which meets seeding requirements.
The effect of X1×3 interaction on the hole distance variation index is particularly significant. According to Figure 13b, the hole distance variation index decreased with the increase in the rotation speed and decreased with the decrease in the seeding height when the seeding angle was constant. When the seeding height was reduced, the effect of air resistance on the seed group was reduced, resulting in an increase in the uniformity of the distance from each individual bud seed to the center of the seed group when it fell on the conveyor belt and an increase in the uniformity of the distance between the centers of each of the two neighboring bud seed groups and thus a reduction in the hole distance variation index. As can be seen from the response surface diagram, when the rotation speed was 51–60 r/min and the seeding height was 150–170 mm, the hole distance variation index stayed below 8%, which meets the requirements of seeding.
The effect of X2×3 interaction on the hole distance variation index is significant. According to Figure 13c, when the rotation speed was constant, the hole distance variation index decreased and then increased with the increase in seeding angle and seeding height. As can be seen from the response surface diagram, when the seeding height was 150–190 mm and the seeding angle was 18–21°, the hole distance variation index was kept below 8%, which meets the seeding requirements.
For the purpose of accurately obtaining the optimal combination of test factors, a mathematical model was established with the boundary conditions of the test factors. With the objective of finally obtaining the highest seeding qualified index, the highest hole diameter qualified index and the lowest hole distance variation index, the optimization model was established as:
max Y 5 ( X 1 , X 2 , X 3 ) min Y 6 ( X 1 , X 2 , X 3 ) 45   r / min X 1 55   r / min 15 ° X 2 25 ° 150   mm X 3 250   mm
After optimization, the seed-metering device achieved its best performance parameters when the rotation speed was 47.030 r/min, the seeding angle was 18.592° and the seeding height was 178.67 mm: the seeding qualified index, hole diameter qualified index and hole distance variation index were 92.08%, 91.16% and 7.21%, respectively. The rotation speed of the seed-metering device was set to 47 r/min, the seeding angle was set to 19°, and the seeding height was set to 180 mm, and a bench test was carried out to verify the performance. The test was carried out five times, and the mean values of the seeding qualified index, the hole diameter qualified index and the hole distance variation index were 92.03%, 91.62% and 7.17%, respectively, and are basically in line with the optimization results.

4. Conclusions

In order to verify the performance of a side-filled rice precision hole direct seed-metering device, the seeding operation mechanism was analyzed, and the main factors affecting the seeding performance were identified: rotation speed, seeding angle and seeding height. The MBD-DEM coupling method was used to analyze the seeding process at different rotation speeds. A single-factor bench test was used to analyze the effects of different test factors on seeding performance. Three-factor and five-level quadratic regression orthogonal rotation center combination test methods were adopted to optimize and analyze the target parameters using the response surface method to obtain the optimal working parameter combination.
(1) The factors affecting the seeding performance and hole-forming performance of the side-filled rice precision hole direct seed-metering device are rotation speed, seeding height and seeding angle.
(2) The maximum value of the force on the bud seeds in each period is 0.025 N, and the maximum speed is less than 2 m/s. During the seed filling process, the maximum force on the bud seeds is about 0.008 N. The components of the side-filled rice precision hole direct seed-metering device do not have any damaging effect on the bud seeds.
(3) A high-speed camera test revealed that when the seed-metering device operates at a low rotation speed with an appropriate seeding angle, it can effectively mitigate the internal slipping of the rice bud seed group and reduce the throwing distance during the seed-throwing stage. Consequently, this diminishes the impact of the seed-throwing components on the seeding performance of the seed-metering device and ensure that the actual seeding trajectory of the rice bud seed group aligns with the theoretical seeding trajectory. Secondly, the appropriate seeding height can effectively avoid the occurrence of secondary bouncing and reduce its impact on the seeding performance of the seed-metering device.
(4) The optimal working parameters obtained from the multi-factor test were: a rotation speed of 47 r/min, seeding angle of 19° and seeding height of 180 mm, which led to a seeding qualified index of the seed-metering device of 92.03%, a hole diameter qualified index of 91.62% and a hole distance variation index of 7.17%.

Author Contributions

Conceptualization, J.W.; methodology, H.T. and Y.X.; software, Z.Y.; validation, Z.Y., R.G. and F.G.; formal analysis, Z.Y.; investigation, H.L.; resources, H.T. and H.L.; data curation, Z.Y.; writing—original draft preparation, J.W.; writing—review and editing, Z.Y.; visualization, Z.Y.; supervision, H.T., R.G. and Q.W.; project administration, H.T.; funding acquisition, J.W. All authors have read and agreed to the published version of the manuscript.

Funding

This research was funded by the Program on Industrial Technology System of National Rice (CN), grant number CARS-01, and the Key Research and Development Program of Heilongjiang Province of China (CN), grant number 2022ZX05B02.

Institutional Review Board Statement

Not applicable.

Data Availability Statement

Data are contained within the article.

Acknowledgments

The authors would like to thank their schools and colleges as well as the funders of the project. All support and assistance is sincerely appreciated.

Conflicts of Interest

The authors declare no conflicts of interest.

References

  1. Kowsalya, P.; Sharanyakanth, P.S.; Mahendran, R. Traditional rice varieties: A comprehensive review on its nutritional, medicinal, therapeutic and health benefit potential. J. Food Compos. Anal. 2022, 114, 104742. [Google Scholar] [CrossRef]
  2. Sahini, M.G.; Mutegoa, E. Extraction, phytochemistry, nutritional, and therapeutical potentials of rice bran oil: A review. Phytomed. Plus 2023, 3, 100453. [Google Scholar] [CrossRef]
  3. Wu, X.; Guo, T.; Luo, F.; Lin, Q. Brown rice: A missing nutrient-rich health food. Food Sci. Hum. Wellness 2023, 12, 1458–1470. [Google Scholar] [CrossRef]
  4. Farooq, M.; Siddique, K.H.M.; Rehman, H.; Aziz, T.; Lee, D.-J.; Wahid, A. Rice direct seeding: Experiences, challenges and opportunities. Soil Tillage Res. 2011, 111, 87–98. [Google Scholar] [CrossRef]
  5. Kumar, V.; Ladha, J.K. Direct seeding of rice: Recent developments and future research needs. Adv. Agron. 2011, 111, 297–413. [Google Scholar]
  6. Wang, W.; Peng, S.; Liu, H.; Tao, Y.; Huang, J.; Cui, K.; Nie, L. The possibility of replacing puddled transplanted flooded rice with dry seeded rice in central China: A review. Field Crops Res. 2017, 214, 310–320. [Google Scholar] [CrossRef]
  7. Singh, R.C.; Singh, G.; Saraswat, D.C. Optimisation of Design and Operational Parameters of a Pneumatic Seed Metering Device for Planting Cottonseeds. Biosyst. Eng. 2005, 92, 429–438. [Google Scholar] [CrossRef]
  8. Zhang, X.; Zhu, D.; Xue, K.; Li, L.; Zhu, J.; Zhang, S.; Liao, J. Parameter Optimization and Experiment of Slider-Hole-Wheel Seed-Metering Device Based on Discrete Element Method. INMATEH Agric. Eng. 2021, 65, 410–420. [Google Scholar] [CrossRef]
  9. Maleki, M.R.; Jafari, J.F.; Raufat, M.H.; Mouazen, A.M.; Baerdemaeker, J.D. Evaluation of Seed Distribution Uniformity of a Multi-flight Auger as a Grain Drill Metering Device. Biosyst. Eng. 2006, 94, 535–543. [Google Scholar] [CrossRef]
  10. Hensh, S.; Raheman, H. Laboratory Evaluation of a Solenoid-Operated Hill Dropping Seed Metering Mechanism for Pre-germinated Paddy Seeds. J. Biosyst. Eng. 2022, 47, 1–12. [Google Scholar] [CrossRef]
  11. Li, H.; Zeng, S.; Luo, X.; Fang, L.; Liang, Z.; Yang, W. Design, DEM Simulation, and Field Experiments of a Novel Precision Seeder for Dry Direct-Seeded Rice with Film Mulching. Agriculture 2021, 11, 378. [Google Scholar] [CrossRef]
  12. Du, X.; Liu, C. Design and testing of the filling-plate of inner-filling positive pressure high-speed seed-metering device for maize. Biosyst. Eng. 2023, 228, 1–17. [Google Scholar] [CrossRef]
  13. Gao, X.; Xie, G.; Li, J.; Shi, G.; Lai, Q.; Huang, Y. Design and validation of a centrifugal variable-diameter pneumatic high-speed precision seed-metering device for maize. Biosyst. Eng. 2023, 227, 161–181. [Google Scholar] [CrossRef]
  14. Han, D.; Zhang, D.; Jing, H.; Yang, L.; Cui, T.; Ding, Y.; Wang, Z.; Wang, Y.; Zhang, T. DEM-CFD coupling simulation and optimization of an inside-filling air-blowing maize precision seed-metering device. Comput. Electron. Agric. 2018, 150, 426–438. [Google Scholar] [CrossRef]
  15. Wu, Z.; Li, M.; Lei, X.; Wu, Z.; Jiang, C.; Zhou, L.; Ma, R.; Chen, Y. Simulation and parameter optimisation of a centrifugal rice seeding spreader for a UAV. Biosyst. Eng. 2020, 192, 275–293. [Google Scholar] [CrossRef]
  16. Pasha, M.; Hare, C.; Ghadiri, M.; Gunadi, A.; Piccione, P.M. Effect of particle shape on flow in discrete element method simulation of a rotary batch seed coater. Powder Technol. 2016, 296, 29–36. [Google Scholar] [CrossRef]
  17. Lei, X.; Hu, H.; Wu, W.; Liu, H.; Liu, L.; Yang, W.; Zhou, Z.; Ren, W. Seed motion characteristics and seeding performance of a centralised seed metering system for rapeseed investigated by DEM simulation and bench testing. Biosyst. Eng. 2021, 203, 22–33. [Google Scholar] [CrossRef]
  18. Dan, D.; Wang, Q.; Gong, J. Application of coupled multi-body dynamics—Discrete element method for optimization of particle damper for cable vibration attenuation. Front. Struct. Civ. Eng. 2021, 15, 244–252. [Google Scholar] [CrossRef]
  19. Richter, C.; Roessler, T.; Otto, H.; Katterfeld, A. Coupled discrete element and multibody simulation, part I: Implementation, verification and validation. Powder Technol. 2021, 379, 494–504. [Google Scholar] [CrossRef]
  20. Wu, Y.-R.; Chung, Y.-C.; Wang, I.C. Two-way coupled MBD–DEM modeling and experimental validation for the dynamic response of mechanisms containing damping particles. Mech. Mach. Theory 2021, 159, 104257. [Google Scholar] [CrossRef]
  21. Kim, Y.-S.; Lee, S.-D.; Baek, S.-M.; Baek, S.-Y.; Jeon, H.-H.; Lee, J.-H.; Abu Ayub Siddique, M.; Kim, Y.-J.; Kim, W.-S.; Sim, T.; et al. Development of DEM-MBD coupling model for draft force prediction of agricultural tractor with plowing depth. Comput. Electron. Agric. 2022, 202, 107405. [Google Scholar] [CrossRef]
  22. Liu, Y.; Li, Y.; Dong, Y.; Huang, M.; Zhang, T.; Cheng, J. Development of a variable-diameter threshing drum for rice combine harvester using MBD—DEM coupling simulation. Comput. Electron. Agric. 2022, 196, 106859. [Google Scholar] [CrossRef]
  23. Zhang, P.; Yuan, J.; Wang, D.; Liu, X.; Zheng, X. Development of a novel pull-cutting end-effector for ex-situ robotic harvesting of white asparagus based on MBD-DEM coupling simulation. Comput. Electron. Agric. 2023, 205, 107641. [Google Scholar] [CrossRef]
  24. Lal, B.; Gautam, P.; Nayak, A.K.; Raja, R.; Panda, B.B.; Tripathi, R.; Shahid, M.; Chatterjee, D.; Bhattacharyya, P.; Bihari, P.; et al. Agronomic manipulation in main season and ratoon rice influences growth, productivity, and regeneration ability in tropical lowlands. Field Crops Res. 2023, 294, 108872. [Google Scholar] [CrossRef]
  25. Xu, F.; Zhang, L.; Zhou, X.; Guo, X.; Zhu, Y.; Liu, M.; Xiong, H.; Jiang, P. The ratoon rice system with high yield and high efficiency in China: Progress, trend of theory and technology. Field Crops Res. 2021, 272, 108282. [Google Scholar] [CrossRef]
  26. Song, G.; Li, Y.; Wang, W.; Liu, S.; Wang, X.; Shi, Z.; Yao, S. Experimental investigation on the microprocess of hydrate particle agglomeration using a high-speed camera. Fuel 2019, 237, 475–485. [Google Scholar] [CrossRef]
  27. Abdolahzare, Z.; Abdanan Mehdizadeh, S. Real time laboratory and field monitoring of the effect of the operational parameters on seed falling speed and trajectory of pneumatic planter. Comput. Electron. Agric. 2018, 145, 187–198. [Google Scholar] [CrossRef]
  28. Xing, H.; Wang, Z.; Luo, X.; He, S.; Zang, Y. Mechanism modeling and experimental analysis of seed throwing with rice pneumatic seed metering device with adjustable seeding rate. Comput. Electron. Agric. 2020, 178, 105697. [Google Scholar] [CrossRef]
  29. Tian, J.-Y.; Li, S.-P.; Cheng, S.; Liu, Q.-Y.; Zhou, L.; Tao, Y.; Xing, Z.-P.; Hu, Y.-J.; Guo, B.-W.; Wei, H.-Y.; et al. Increasing the appropriate seedling density for higher yield in dry direct-seeded rice sown by a multifunctional seeder after wheat-straw return. J. Integr. Agric. 2023, 22, 400–416. [Google Scholar] [CrossRef]
  30. Qi, L.; Chen, Y.; Sadek, M. Simulations of soil flow properties using the discrete element method (DEM). Comput. Electron. Agric. 2019, 157, 254–260. [Google Scholar] [CrossRef]
  31. Ucgul, M.; Fielke, J.M.; Saunders, C. Three-dimensional discrete element modelling (DEM) of tillage: Accounting for soil cohesion and adhesion. Biosyst. Eng. 2015, 129, 298–306. [Google Scholar] [CrossRef]
  32. Chen, P.; Han, Y.; Jia, F.; Zhao, D.; Meng, X.; Li, A.; Chu, Y.; Zhao, H. Investigation of the mechanism of aerodynamic separation of rice husks from brown rice following paddy hulling by coupled CFD-DEM. Biosyst. Eng. 2022, 218, 200–215. [Google Scholar] [CrossRef]
  33. Han, Y.; Zhao, D.; Jia, F.; Qiu, H.; Li, A.; Bai, S. Experimental and numerical investigation on the shape approximation of rice particle by multi-sphere particle models. Adv. Powder Technol. 2020, 31, 1574–1586. [Google Scholar] [CrossRef]
  34. Su, Z.; Li, Y.; Dong, Y.; Tang, Z.; Liang, Z. Simulation of rice threshing performance with concentric and non-concentric threshing gaps. Biosyst. Eng. 2020, 197, 270–284. [Google Scholar] [CrossRef]
  35. Wang, Y.; Xue, W.; Ma, Y.; Tong, J.; Liu, X.; Sun, J. DEM and soil bin study on a biomimetic disc furrow opener. Comput. Electron. Agric. 2019, 156, 209–216. [Google Scholar] [CrossRef]
  36. Pasha, M.; Hare, C.; Ghadiri, M.; Gunadi, A.; Piccione, P.M. Inter-particle coating variability in a rotary batch seed coater. Chem. Eng. Res. Des. 2017, 120, 92–101. [Google Scholar] [CrossRef]
  37. Li, H.; Liu, L.; Wang, Z.; Yang, J.; Zhang, J. Agronomic and physiological performance of high-yielding wheat and rice in the lower reaches of Yangtze River of China. Field Crops Res. 2012, 133, 119–129. [Google Scholar] [CrossRef]
Figure 1. Structural diagram of side-filled rice precision hole direct seed-metering device. (a) Exploded view; (b) Working principle. 1. Seed guide tube; 2. Front end cap; 3. Bearing; 4. Bearing end cap; 5. Seed guide plate; 6. Seed-taking unit; 7. Seed-metering plate; 8. Shell; 9. Fork duckbill assembly device; 10. Support shaft; 11. Washer; 12. Contact device; I: Filling area; II: Cleaning area; III: Carrying area; and IV: Throwing area.
Agriculture 14 00184 g001
Figure 2. Schematic diagram of mechanism analysis at different stages. (a) Filling stage; (b) Cleaning stage; and (c) Seeding stage.
Agriculture 14 00184 g002
Figure 3. Schematic diagram of MBD-DEM coupling.
Agriculture 14 00184 g003
Figure 4. Coupled simulation diagrams. (a) The process of modeling the bud seed particles; (b) Schematic diagram of the soil tank model; (c) Schematic diagram of the simulated seeding operation.
Agriculture 14 00184 g004
Figure 5. Seed-metering device test bench. 1. Oil port; 2. Integrated test bench; 3. Filler light; 4. Motor; 5. Side-filled rice precision hole direct seed-metering device; 6. Drive pulley; 7. High-speed camera; 8. Tape measure; 9. Data acquisition terminal; and 10. Testing bench console.
Agriculture 14 00184 g005
Figure 6. Seeding process analysis of bud seed group. (a) Trajectory diagram; (b) Force change curve schematic diagram. I: Filling area; II: Cleaning area; III: Carrying area; and IV: Throwing area.
Agriculture 14 00184 g006
Figure 7. Seeding process analysis of a single bud seed at different rotation speeds. (a) Force diagram; (b) Velocity diagram.
Agriculture 14 00184 g007
Figure 8. Distribution of bud seeds to be filled at different rotation speeds. Note: The yellow arrow shows the direction of bud seed flow, the highlighted area A shows the distribution range of bud seeds to be filled in a single hole, and area B shows the junction range between the seed filling area and the seed cleaning area. (ae) respectively represent the state of rice bud seeds movement at rotational speeds of 30, 40, 50, 60, and 70 r/min.
Agriculture 14 00184 g008
Figure 9. Analysis of the filling process of single bud seeds with different rotation speeds. (a) Area division schematic diagram; (b) Average force schematic diagram.
Agriculture 14 00184 g009
Figure 10. High-speed camera photographs of the bud seed groups falling.
Agriculture 14 00184 g010
Figure 11. Trajectories of the falling bud seed groups under different test factors. Note: The green line area is the actual trajectory range; the red line is the average curve of the actual trajectory; the blue line area is the theoretical trajectory range; the equation is the fitting equation of the actual trajectory average curve; (ae) are trajectory diagrams of the bud seed groups at different rotation speeds; (fj) are trajectory diagrams of the bud seed groups at different seeding angles; (ko) are trajectory diagrams of the bud seed groups at different seeding heights.
Agriculture 14 00184 g011
Figure 12. Effect of each test factor on seed-metering device performance. Note: (a) The effect of rotation speed on seeding performance; (bd) The respective effects of rotation speed, seeding height and seeding angle on hole-forming performance.
Agriculture 14 00184 g012
Figure 13. Response surface diagrams. Note: (a) The response surface of the effect of X2×3 interaction on the hole diameter qualified index; (b,c) The response surface of the effect of X1×3, X2×3 interaction on the hole distance variation index.
Agriculture 14 00184 g013
Table 1. Simulation parameters.
TypeParameterValueUnit
Bud particleParticle physical radius0.2mm
Particle contact radius0.22mm
Poisson’s ratio0.25
Solids density231Kg/m3
Shear modulus1 × 107Pa
Seed particleParticle physical radius0.38mm
Particle contact radius0.42mm
Poisson’s ratio0.4
Solids density1163Kg/m3
Shear modulus1.15 × 108Pa
Soil particleParticle physical radius4mm
Poisson’s ratio0.38
Solids density2060Kg/m3
Shear modulus1.05 × 1010Pa
Interactions between different particlesCoefficient of restitution between seed and soil0.15
Coefficient of static friction between seed and soil0.1
Coefficient of rolling friction between seed and soil0.2
Coefficient of restitution between bud and soil0.1
Coefficient of static friction between bud and soil0.1
Coefficient of rolling friction between bud and soil0.2
BondingNormal stiffness per unit area between buds3.6 × 108N/m3
Shear stiffness per unit area between buds2.3 × 108N/m3
Critical normal stress between buds3.6 × 106Pa
Critical shear stress between buds2.3 × 106Pa
Normal stiffness per unit area between seeds6.3 × 108N/m3
Shear stiffness per unit area between seeds5.2 × 108N/m3
Critical normal stress between seeds6.3 × 106Pa
Critical shear stress between seeds5.2 × 106Pa
Normal stiffness per unit area between bud and seed9.3 × 109N/m3
Shear stiffness per unit area between bud and seed7.6 × 109N/m3
Critical normal stress between bud and seed9.3 × 107Pa
Critical shear stress between bud and seed7.6 × 107Pa
Table 2. Single-factor test horizontal coding table.
LevelTest Factor
Rotation Speed
X1 (r/min)
Seeding Angle
X2 (°)
Seeding Height
X3 (mm)
13010100
24015150
35020200
46025250
57030300
Table 3. Multi-factor test level coding table.
LevelTest Factor
Rotation Speed
X1 (r/min)
Seeding Angle
X2 (°)
Seeding Height
X3 (mm)
−1.684015150
−14417170
05020200
+15623230
+1.686025250
Table 4. Results of the multi-factor test.
LevelExperimental FactorExperimental Index
X1 (r/min)X2 (°)X3 (mm)Y5 (%)Y6 (%)
1441717091.177.98
2561717088.177.82
3442317087.3310.23
4562317081.8710.06
5441723085.479.79
6561723084.3313.25
7442323085.2614.68
8562323082.1318.4
9402020092.338.34
10602020086.1310.28
11501520087.5610.84
12502520081.2714.88
13502015087.337.45
14502025083.2715.26
15502020088.978.9
16502020089.278.43
17502020089.679.19
18502020091.68.4
19502020088.139.06
20502020088.757.17
Table 5. ANOVA table for quadratic model.
SourceHole Diameter Qualified Index Y5/%Hole Distance Variation Index Y6/%
Sum of SquaresdfF-Valuep-ValueSum of SquaresdfF-Valuep-Value
Model191.02925.33<0.0001 **179.37944.53<0.0001 **
X139.27146.86<0.0001 **7.49116.730.0022 **
X239.17146.75<0.0001 **33.30174.37<0.0001 **
X324.20128.880.0003 **80.541179.89<0.0001 **
X1×22.4812.950.11640.007810.01740.8975
X1×32.1912.620.13677.05115.750.0027 **
X2×37.4718.910.0137 *3.8518.600.0150 *
X120.309410.3680.55731.4513.250.1016
X2249.26158.79<0.0001 **35.65179.63<0.0001 **
X3233.99140.57<0.0001 **15.61134.870.0002 **
Residual8.3810 4.4810
Lack of Fit1.2350.17190.96211.7550.64010.6818
Pure Error7.155 2.735
Cor Total199.3919 183.8519
Note: (*) indicates a significant effect (0.01 < p < 0.05), and (**) indicates an extremely significant effect (p < 0.01).
Disclaimer/Publisher’s Note: The statements, opinions and data contained in all publications are solely those of the individual author(s) and contributor(s) and not of MDPI and/or the editor(s). MDPI and/or the editor(s) disclaim responsibility for any injury to people or property resulting from any ideas, methods, instructions or products referred to in the content.

