Article

Incorporation of Relay Intercropping in Wheat–Fresh Maize–Fresh Soybean Cropping System Improves Climate Resource Utilization and Economic Benefits in Yangtze River Delta

1
Jiangsu Yanjiang Institute of Agricultural Sciences, Nantong 226541, China
2
Jiangsu Key Laboratory of Crop Genetics and Physiology/Co-Innovation Center for Modern Production Technology of Grain Crops, Yangzhou University, Yangzhou 225009, China
*
Author to whom correspondence should be addressed.
Agriculture 2024, 14(12), 2178; https://doi.org/10.3390/agriculture14122178
Submission received: 12 September 2024 / Revised: 19 November 2024 / Accepted: 26 November 2024 / Published: 29 November 2024
(This article belongs to the Section Agricultural Systems and Management)

Abstract

:
In the Yangtze River Delta region, demand from consumers for fresh maize and fresh soybeans is increasing. The cropping systems applied in agricultural production have a low utilization of light and temperature resources. In order to construct a novel planting pattern for fresh maize and fresh soybean with a high-efficiency utilization of climate resources, we conducted a field experiment to compare the annual yield, allocation, and utilization efficiency of climatic resources and the economic benefits between the conventional double-cropping system with wheat-fresh soybeans (CK) and the triple-cropping planting patterns comprising wheat-fresh maize/fresh soybeans (W1) or wheat-fresh maize/fresh maize(W2) at Nantong, Jiangsu, China, from 2016 to 2020. Compared with the conventional double-cropping system, the triple-cropping planting patterns increased the annual yield by 6547 kg ha−1 and 11,979 kg ha−1 and increased the annual biomass by 4389 kg ha−1 and 10,425 kg ha−1, respectively. The annual economic benefit of triple-cropping planting patterns increased by 2775 RMB ha−1 and 12,765 RMB ha−1, respectively. The triple-cropping planting patterns respectively increased the annual radiation production efficiency by 0.08 g MJ−1 and 0.28 g MJ−1, the annual temperature production efficiency by 1.65 kg ha−1 °C−1 and 4.30 kg ha−1 °C−1, and the annual precipitation production efficiency by 4.40 kg mm−1 ha−1 and 9.67 kg mm−1 ha−1. Considering the yields, resource-use efficiency, and economic benefits, the wheat–fresh maize–fresh soybean system is suitable for application in YRD region and worth extending in the Yangtze River region. However, ways to improve fertilizer utilization efficiency in the wheat–fresh maize–fresh soybean system need to be studied.

1. Introduction

The Yangtze River Delta (YRD) is generally considered to encompass southern Jiangsu Province, eastern and northern Zhejiang Province, and the municipality of Shanghai [1]. The YRD has ample temperature, light, and water resources and is the main agricultural production region in China [2]. The YRD is the most densely populated and economically prosperous region in China [3]. Socioeconomic development continues to fuel the demand for diversified agricultural products, and growing needs are placed on the production capacity of cultivated land [4,5]. Therefore, it is particularly important to study diversified planting patterns with an efficient utilization of light, temperature, and water resources to meet the demand.
Fresh soybean seeds are rich in nutrients, such as carbohydrates, proteins, vitamins, minerals, and phytochemicals [6]. The consumption of fresh soybeans has many health benefits, including lowered low-density lipoprotein cholesterol levels and a reduced risk of cardiovascular disease, and thus is a popular fresh crop in China and Southeast Asia [7,8]. China is the global center for fresh soybean production, and the production and processing of fresh soybeans are primarily concentrated in the Jiangsu and Zhejiang provinces, which are located in the lower reaches of the Yangtze River [9]. A wheat–fresh soybean planting pattern is often used in production in the YRD region. The wheat crop in wheat–fresh soybean cropping systems is usually sown in late October or early November and is harvested in early June. Fresh soybean seeds are sown in early June and harvested in late September. There are approximately 40 days between fresh soybean harvest and wheat sowing. As a result, the wheat–fresh soybean planting pattern wastes almost 40 days of temperature, light, and water resources in the entire year. Therefore, it is particularly important to construct a planting pattern that has high light, temperature, and water utilization rates all year round.
In order to meet the growing demand for food, it is necessary to partially achieve yield growth by increasing crop productivity, that is, increasing the yield per unit of cultivated land [10,11]. Intercropping could significantly contribute to crop production through the effective utilization of resources [12,13]. Relay intercropping is an agricultural practice in which two or more crops are grown in the same field, with one crop being planted during the late growth stage of the previous season’s crops [14,15]. Relay intercropping is important in subsistence and food production worldwide [16,17,18]. This planting pattern often outperforms the individual crop components because of the increased efficiency of resource use and the reduced incidence of weeds, insect pests, and diseases [19,20,21]. Cereal and legume intercropping is a common cropping system practiced in several countries [16,22]. Maize–soybean relay intercropping is an important type of cereal and legume intercropping system [23,24]. This intercropping system is common in regions where the growing season is too short for double cropping [19,25,26]. A maize–soybean relay-strip intercropping system with a high land equivalent ratio, light and fertilizer (nitrogen [N] and phosphorus [P]) use efficiency, and crop productivity is widely practiced in China, especially in areas with low solar radiation [27,28,29,30]. This system increases productivity because it has the benefit of biological N fixation by soybeans, thereby reducing the use of N-containing fertilizers [30,31].
Fresh maize has high nutritional and economic value, a relatively simple production process, and is highly favored by consumers and farmers [32]. The current planting area of fresh maize in China has reached 1.3 million ha, and thus, China is the largest producer and consumer of fresh maize in the world [33].
Previous studies on maize–soybean relay intercropping have focused on fertilizer utilization, water-use efficiency, and crop interaction [34,35,36]. Previous research has focused on soybeans and maize harvested with dry seeds. Relatively limited research has been conducted on fresh maize–fresh soybean relay intercropping. The research period is limited to the growth period of soybeans and maize, and fewer studies have investigated the annual use-efficiency of light, temperature, and water in the planting patterns. The demand for fresh maize and fresh soybeans is increasing. However, the current planting pattern has a low annual-utilization rate of light and temperature resources, and there is little research on the construction of annual planting patterns for fresh soybeans and fresh maize. The present study used relay intercropping to devise novel planting patterns, comprising wheat–fresh maize–fresh soybean and wheat–fresh maize–fresh maize. The annual utilization-efficiency of light, temperature, and precipitation resources and the economic benefits were evaluated for each planting pattern to construct a novel planting pattern for fresh maize and fresh soybean with high-efficiency utilization of climate resources for application in production. The results provide a basis for the selection of a planting pattern for crop production and present a reference method for the development of a diversified multi-crop planting pattern for the efficient annual utilization of resources.

2. Materials and Methods

2.1. Study Site and Plant Material

This field experiment was conducted from November 2016 to October 2020 in the experimental field of the Jiangsu Yanjiang Agricultural Science Research Institute located in Jiangsu Province, China. At the start of this study, the biochemical properties of the dry topsoil (0–20 cm depth) were as follows: soil organic matter content 9.91 g kg−1, total N 0.91 g kg−1, total P 0.82 g kg−1, total potassium (K) 13.16 g kg−1, available N 88.20 mg kg−1, Olsen P 3.44 mg kg−1, and exchangeable K 45.17 mg kg−1. From 2016 to 2020, the range of annual accumulated radiation was 3356.82–4244.17 MJ m−2, the precipitation was 1092.5–2314.9 mm, and the accumulated temperature was 2692.9–2931.5 °C (Figure 1).
In the field experiment, the fresh maize cultivar ‘Suyunuo 14’, the fresh soybean cultivar ‘Tongdou 6’, and the wheat cultivar ‘Yangmai 16’ were used.

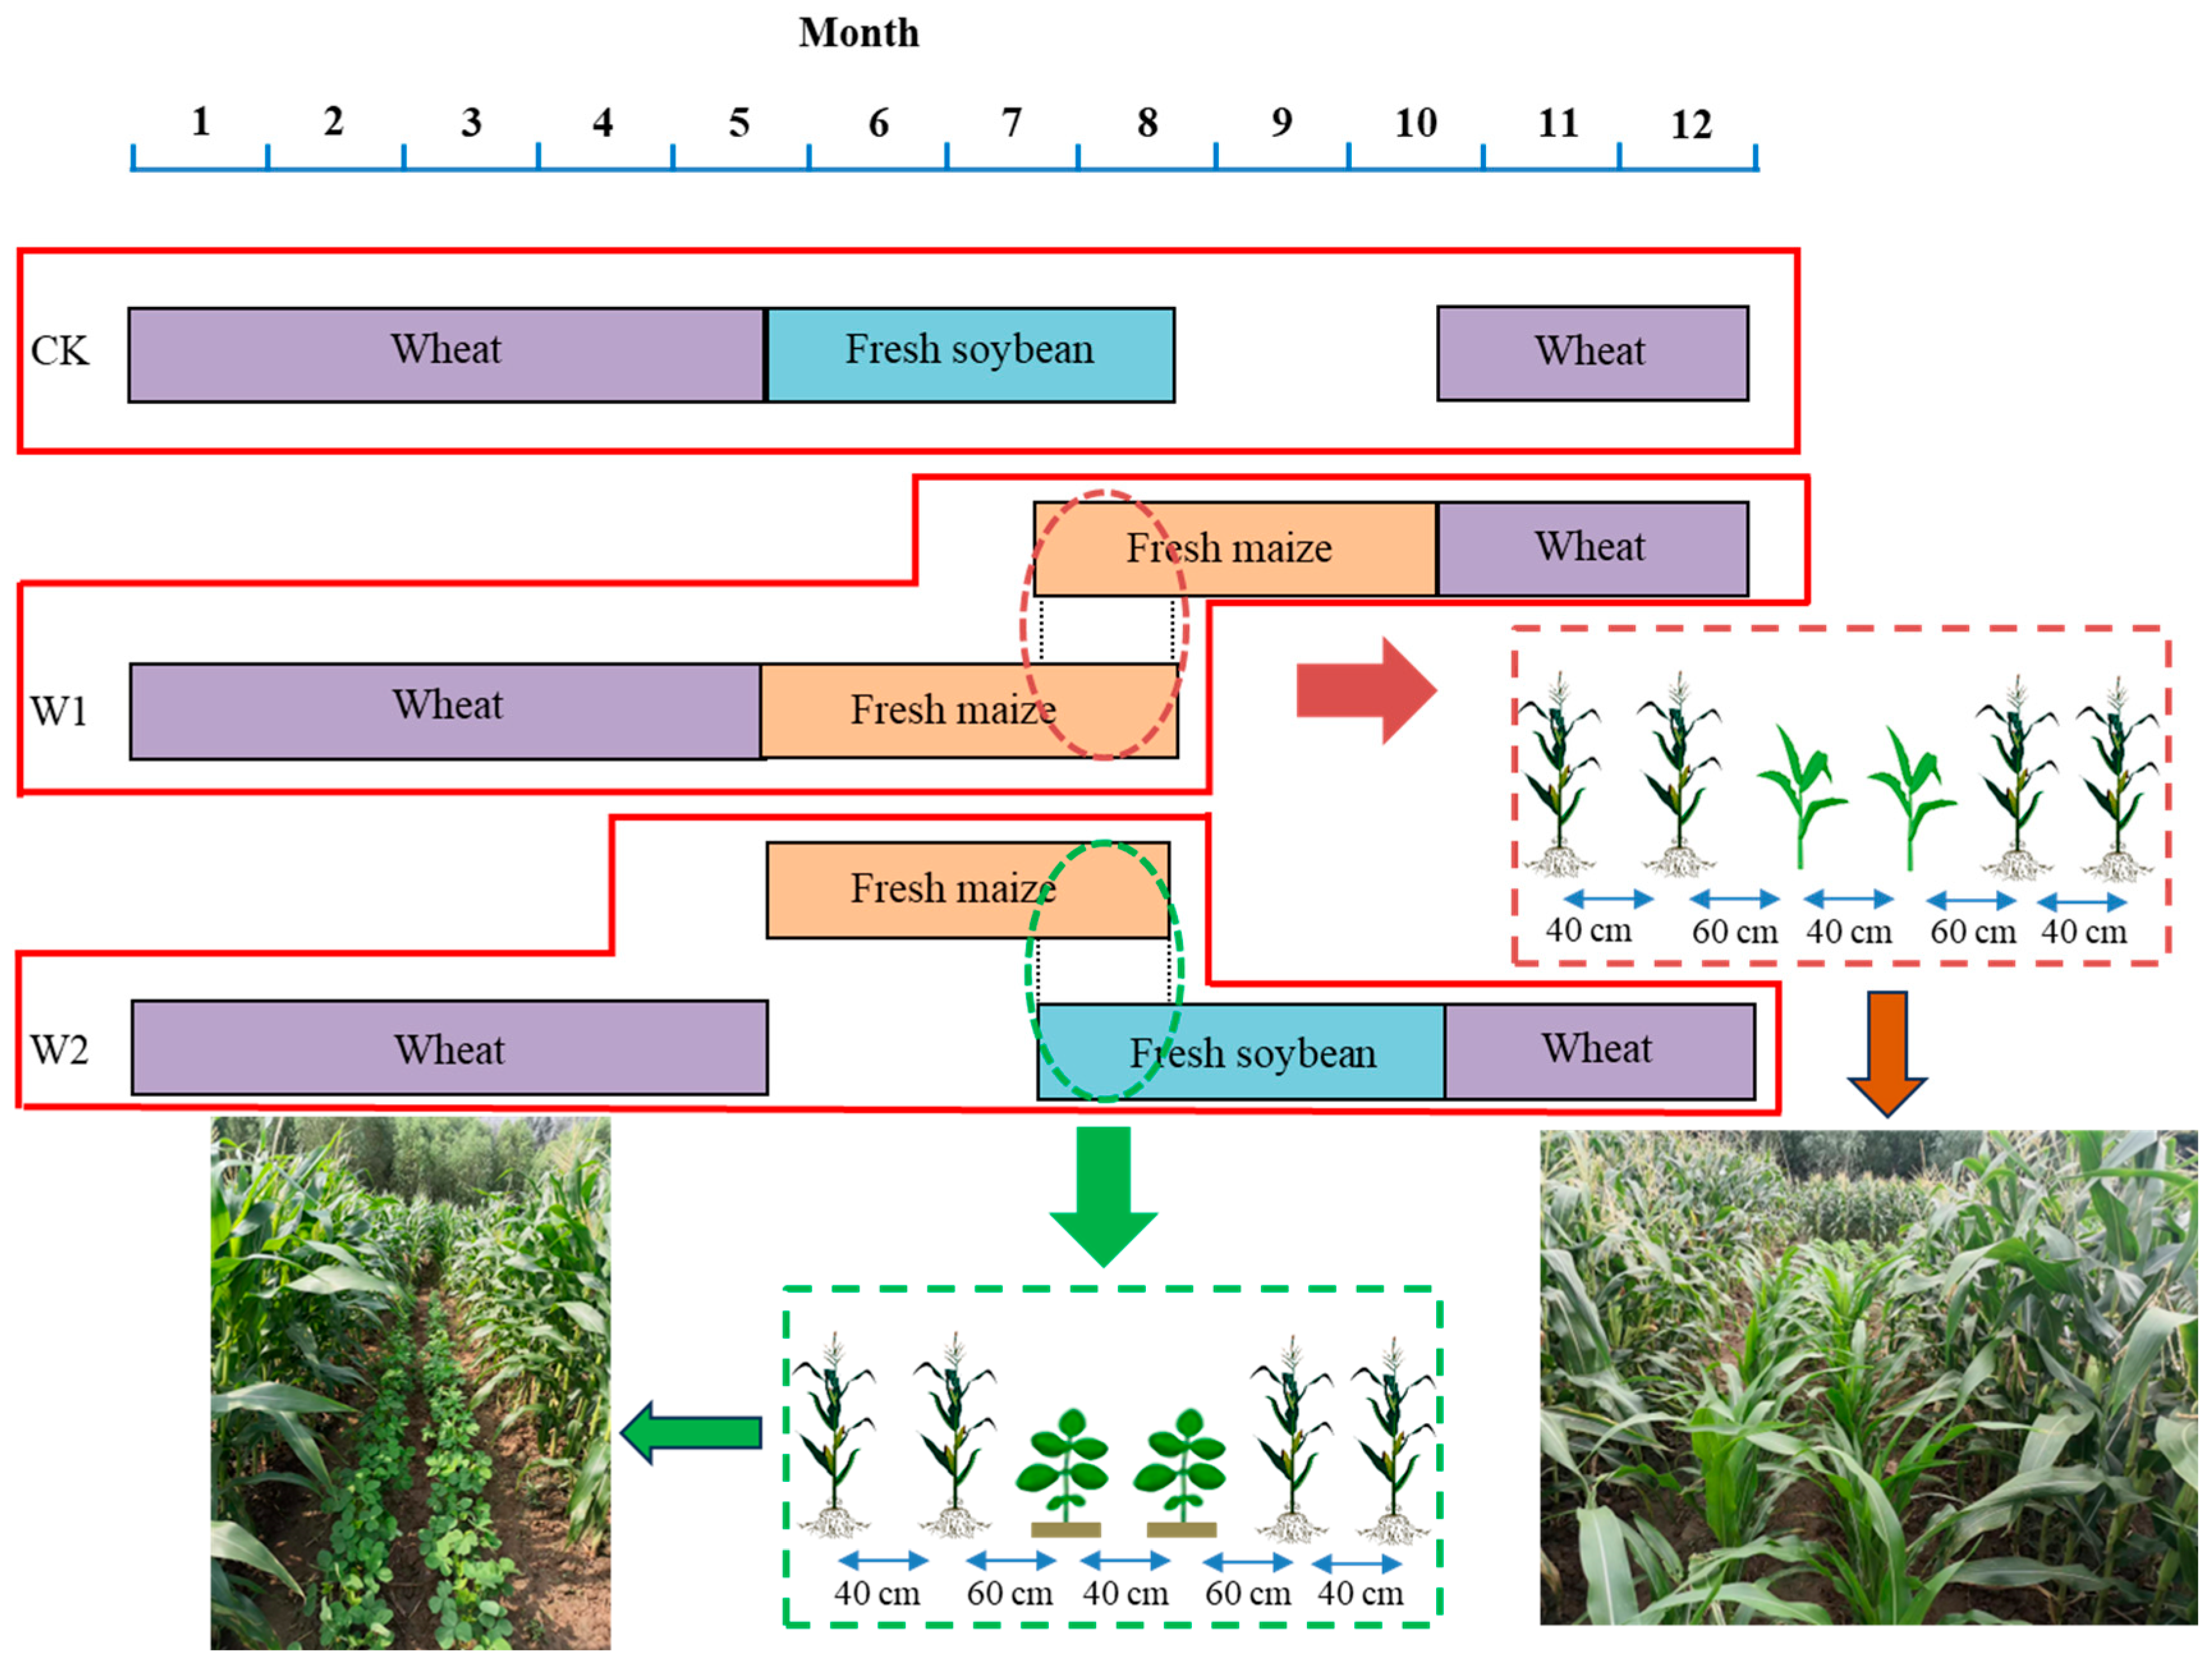
2.2. Experimental Design and Plant Growth

Three treatments comprising different planting patterns were applied: in Treatment 1 (CK), the planting pattern was wheat–fresh soybean; in Treatment 2 (W1), the planting pattern was wheat–fresh maize–fresh maize; and in Treatment 3 (W2), the planting pattern was wheat–fresh maize–fresh soybean. For each treatment, the area of an individual plot was 5.0 m × 6.0 m, and three replicate plots were treated. The sowing date, harvest period, and planting density of the crops in the planting patterns are summarized in Table 1.
For the CK (wheat–fresh soybean), wheat was sown in late October or early November in each year from 2016 to 2020. Wheat seeds were sown in equal rows, with row spacing of 25 cm and planting density of 2.4 million plants ha−1. The total amount of N applied in the wheat-growing period was 210 kg ha−1. A compound fertilizer (N:P2O5:K2O = 15:15:15) was applied as a basal dressing at the rate of 240 kg ha−1. At the tillering and grain-filling stages, respective topdressings of 150 kg ha−1 and 225 kg ha−1 urea (CO(NH2)2, N = 46.4%) were applied. Fresh soybean was sown in early June. A compound fertilizer (N:P2O5:K2O = 15:15:15) was applied at the rate of 225 kg ha−1 as the basal fertilizer. The soybean seeds were sown in equal rows, with row spacing of 50 cm and planting density of 12,000 plants ha−1.
For the W1 treatment (wheat–fresh maize/fresh maize), wheat was sown as described for the CK. Fresh maize was sown with alternate wide and narrow rows (160 cm + 40 cm) in mid-June (Figure 2). The planting density was 60,000 plants ha−1. The total amount of N applied in the fresh maize-growing period was 210 kg ha−1. A compound fertilizer (N:P2O5:K2O = 15:15:15) was applied as a basal dressing at the rate of 375kg ha−1. At the tillering and grain-filling stages, respective topdressings of 225 kg ha−1 and 375 kg ha−1 urea (CO(NH2)2, N = 46.4%) were applied. The second fresh maize crop was sown in late July to early August with wide rows (160 cm), row spacing of 40 cm, and planting density of 60,000 plants ha−1 (Figure 2). The fertilizer applications were identical to those of the preceding fresh maize crop.
For the W2 treatment (wheat–fresh maize/fresh soybean), wheat was sown as described for the CK. Fresh maize was planted as described for the W1 treatment. Fresh soybean was sown in late July and early August with wide rows (160 cm), as for the preceding fresh maize crop, with row spacing of 40 cm and planting density of 12,000 plants ha−1 (Figure 2). A compound fertilizer (N:P2O5:K2O = 15:15:15) was applied as a basal dressing at the rate of 225 kg ha−1.

2.3. Determination of Economic Yield and Biomass of Crops in Each Planting Pattern

The economic yield of individual crops (wheat, fresh maize, and fresh soybean) within the planting patterns was calculated based on the actual yield of the experimental community during the harvest period. The economic yield of fresh maize was determined as the yield of fresh ears, including the bracts in individual plot. The economic yield of fresh soybean was measured as the yield of fresh pods in individual plot. The dry matter accumulation of each crop per unit area was measured during harvest, and the annual biomass was calculated.

2.4. Economic Analysis of Each Planting Pattern

An economic analysis was performed to evaluate the economic feasibility of the three planting patterns. The total variable costs, including the cost of fertilizers, pesticides, herbicides, plowing, seeds, and labor, were calculated. Gross income was calculated by considering the economic yield based on the prevailing market prices. Net income was determined as the difference between gross income and total variable costs. In addition, the benefit/cost ratio was calculated by dividing gross income by variable costs [37].

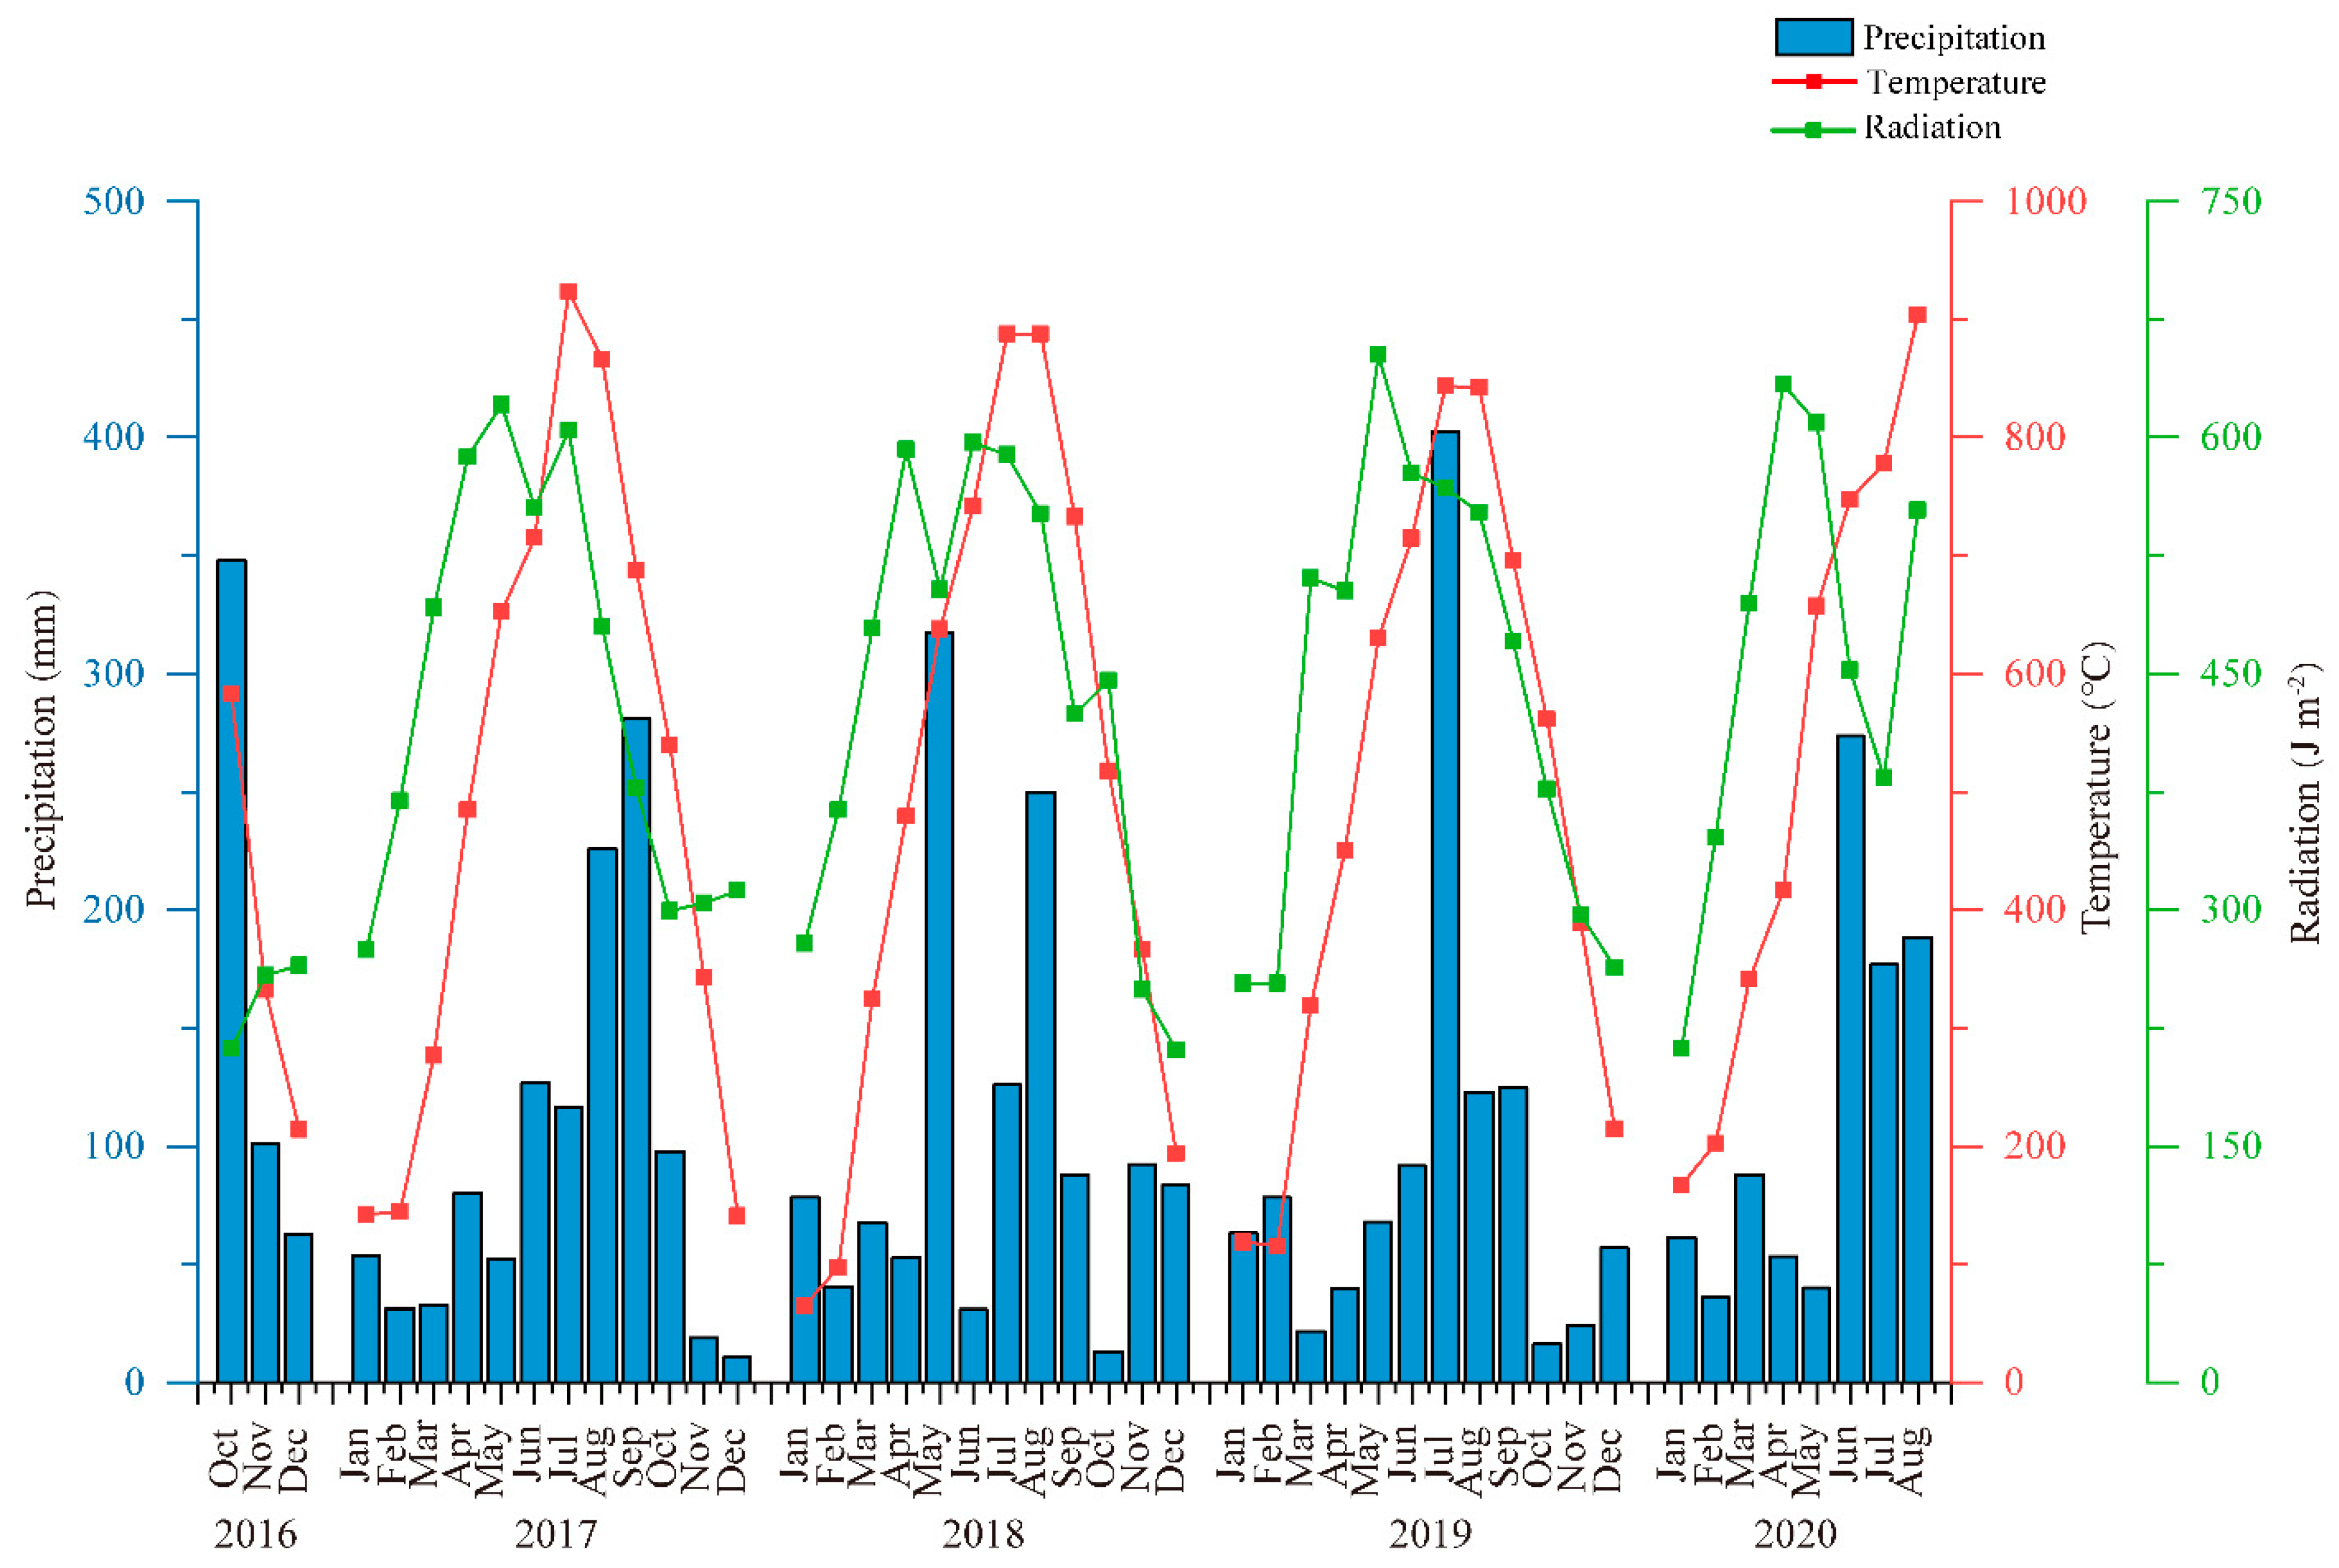
2.5. Meteorological Data

Meteorological data were sourced from an automatic meteorological station installed in the experimental field and from the website of the National Meteorological Administration, Nantong City Meteorological Station, Jiangsu Province (http://www.cma.gov.cn (accessed on 22 May 2021). The meteorological data comprised solar radiation, daily temperature, sunshine hours, rainfall, and other indicators.

2.6. Allocation of Solar Radiation, Effective Accumulated Temperature, and Precipitation

The growth period of each crop was recorded, and then the percentage allocation (the proportion of the annual total recorded during a crop season for each meteorological variable) for radiation, temperature, and precipitation was calculated for each crop season using the following formulas:
Radiation allocation (%) = Crop season radiation/Annual radiation × 100;
Temperature allocation (%) = Crop season accumulated temperature/Annual accumulated temperature × 100;
Precipitation allocation (%) = Crop season precipitation/Annual precipitation × 100.
Finally, the allocation of radiation, temperature, and precipitation was calculated for each planting pattern.

2.7. Production Efficiency of Accumulated Temperature, Radiation, and Precipitation

The production efficiency of radiation, temperature, and precipitation for each crop season was calculated using the following formulas:
Radiation production efficiency (g MJ−1) = Crop economic yield/total radiation during the crop growth period;
Temperature production efficiency (kg ha−1−2 °C−1) = Crop economic yield/total accumulated temperature during the crop growth period;
Precipitation production efficiency (kg ha−1 mm−1) = Crop economic yield/total precipitation during the crop growth period.
We then calculated the production efficiency of radiation, temperature, and precipitation for each planting pattern.

2.8. Radiation Use Efficiency

The radiation use efficiency (RUE) of the total dry matter of each crop and annual radiation use efficiency were calculated using the following formula:
RUE (%) = (W × H)/ΣQ × 100,
where H is the heat released from the combustion of crops per gram of dry matter, the dry-weight calorific value of maize is 1.807 × 10⁴ J g−1, and the dry-weight calorific value of wheat is 1.747 × 10⁴ J g−1; W is the increase in dry matter in the crop growth period, and ∑Q is the total light radiation in the crop growth period.

2.9. Statistical Analysis

All data are presented as means and standard deviations. The two-way ANOVA model includes year and plant pattern, and the interaction between year and plant pattern was used for statistical analysis. The significance of differences among groups was tested using Fisher’s least significant difference at the p = 0.05 significance level using IBM SPSS Statistics 19.0 software. Transformations were not applied during statistical analysis as the data normally met the assumptions.

3. Results

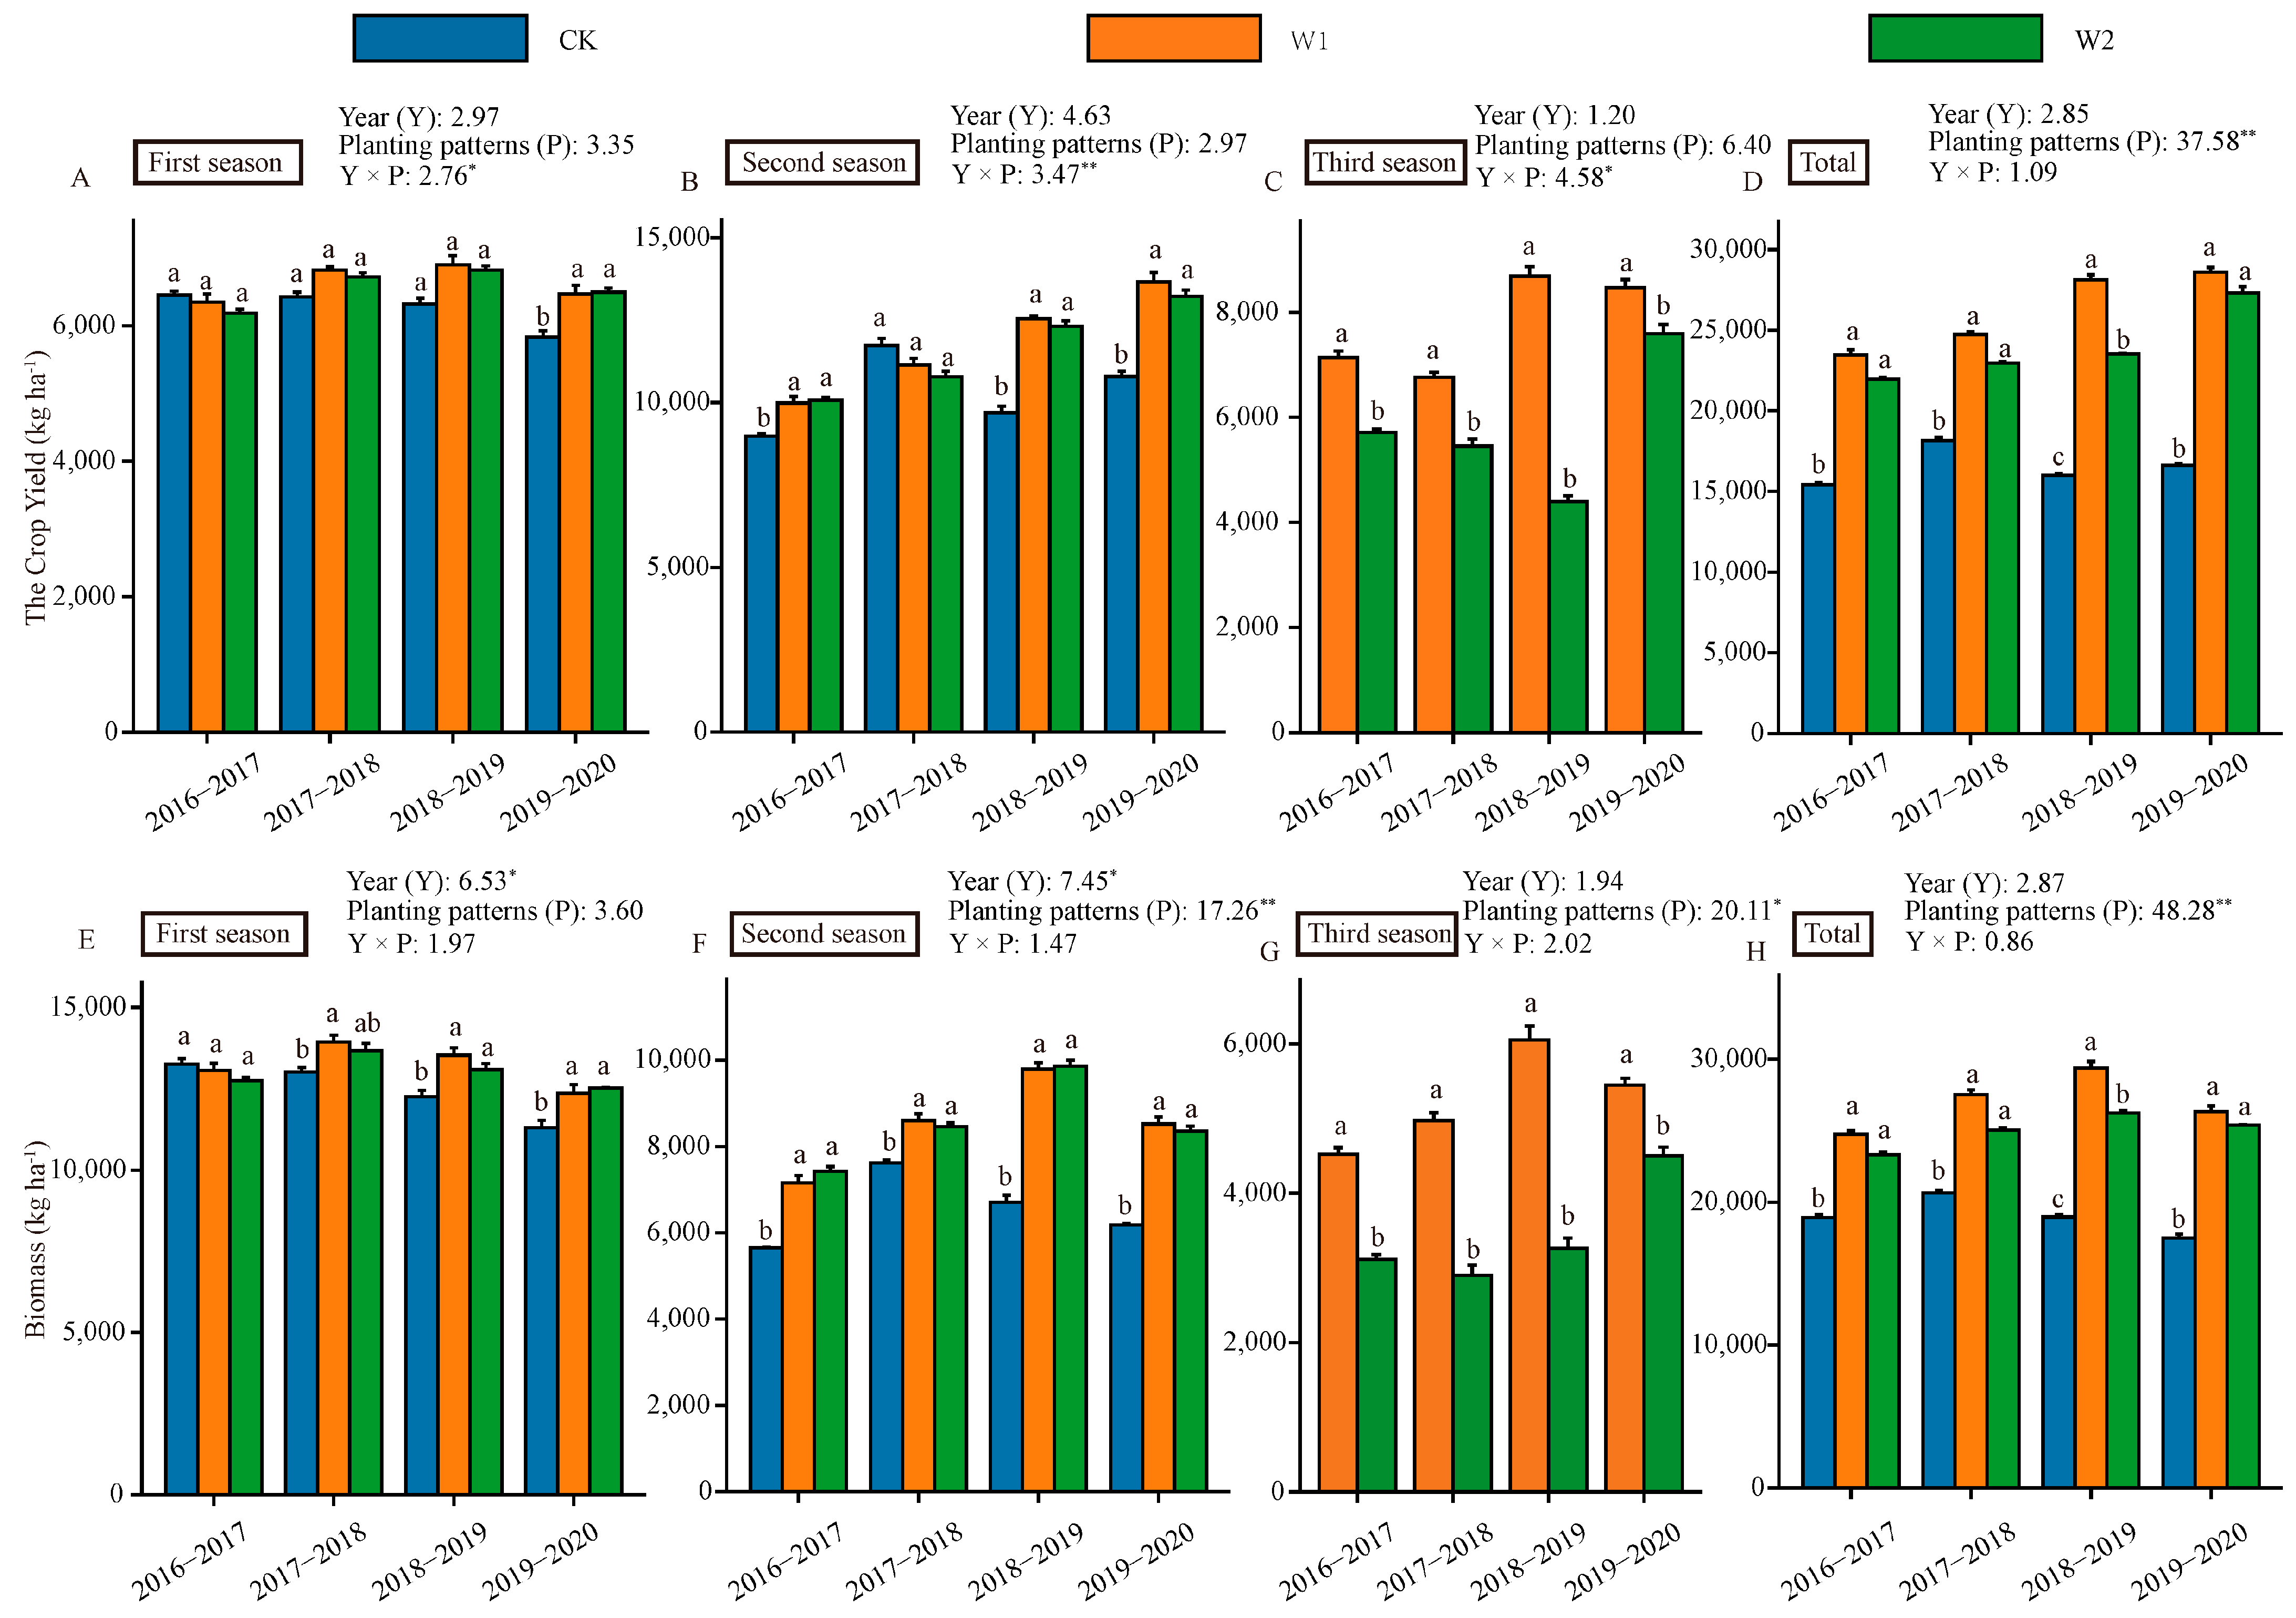
3.1. Yield and Biomass

In 2020, the wheat yield of the triple-cropping planting patterns (W1 and W2) increased by 296.30 kg ha−1 and 664.45 kg ha−1, respectively, compared with that of the double-cropping planting pattern (CK) (Figure 3A). From 2016 to 2020, the annual yield of W1 and W2 was significantly higher than that of the CK by 6547 kg ha−1 and 11,979 kg ha−1, respectively (Figure 3D). The annual biomass of W1 and W2 was significantly higher than that of the CK by 4389 kg ha−1 and 10,425 kg ha−1, respectively (Figure 3H).

3.2. Economic Benefits

From 2016 to 2020, the average total expenditure, including seeds, pesticides and herbicides, fertilizer, and plowing, for wheat crops in all planting patterns was approximately similar (Table 2). The average net benefit and total income of wheat in W1 and W2 tended to increase compared with that of the CK (Table 2). These results indicated that the use of relay intercropping in the triple-cropping planting patterns did not increase the cost of wheat cultivation and was beneficial for improving the wheat net economic benefits. The average total expenditures, including seeds, pesticides and herbicides, fertilizer, and plowing, for fresh soybean crops in the CK and W2 were approximately similar (Table 2). In addition, the average net economic benefit and total income for fresh soybean crops in the CK and W2 were similar (Table 2). Therefore, relay intercropping in the triple-cropping planting patterns did not increase the cost of fresh soybean cultivation and did not affect the fresh soybean net economic benefit.
The annual total expenditure of W1 and W2 increased by 9855 RMB ha−1 and 11,310 RMB ha−1, respectively, compared with that of the CK (Table 2). The annual total income of W1 and W2 increased by 7575 RMB ha−1and 16,110 RMB ha−1, respectively, compared with that of the CK. The annual net economic benefit of W1 and W2 increased by 2775 RMB ha−1 and 12,765 RMB ha−1, respectively, compared with that of the CK (Table 2). These results indicated that the triple-cropping planting patterns increased the annual total expenditure but increased the annual net economic benefit. The annual net benefit of W2 was 55.80% higher than that of the CK and 38.95% higher than that of W1 (Table 2).

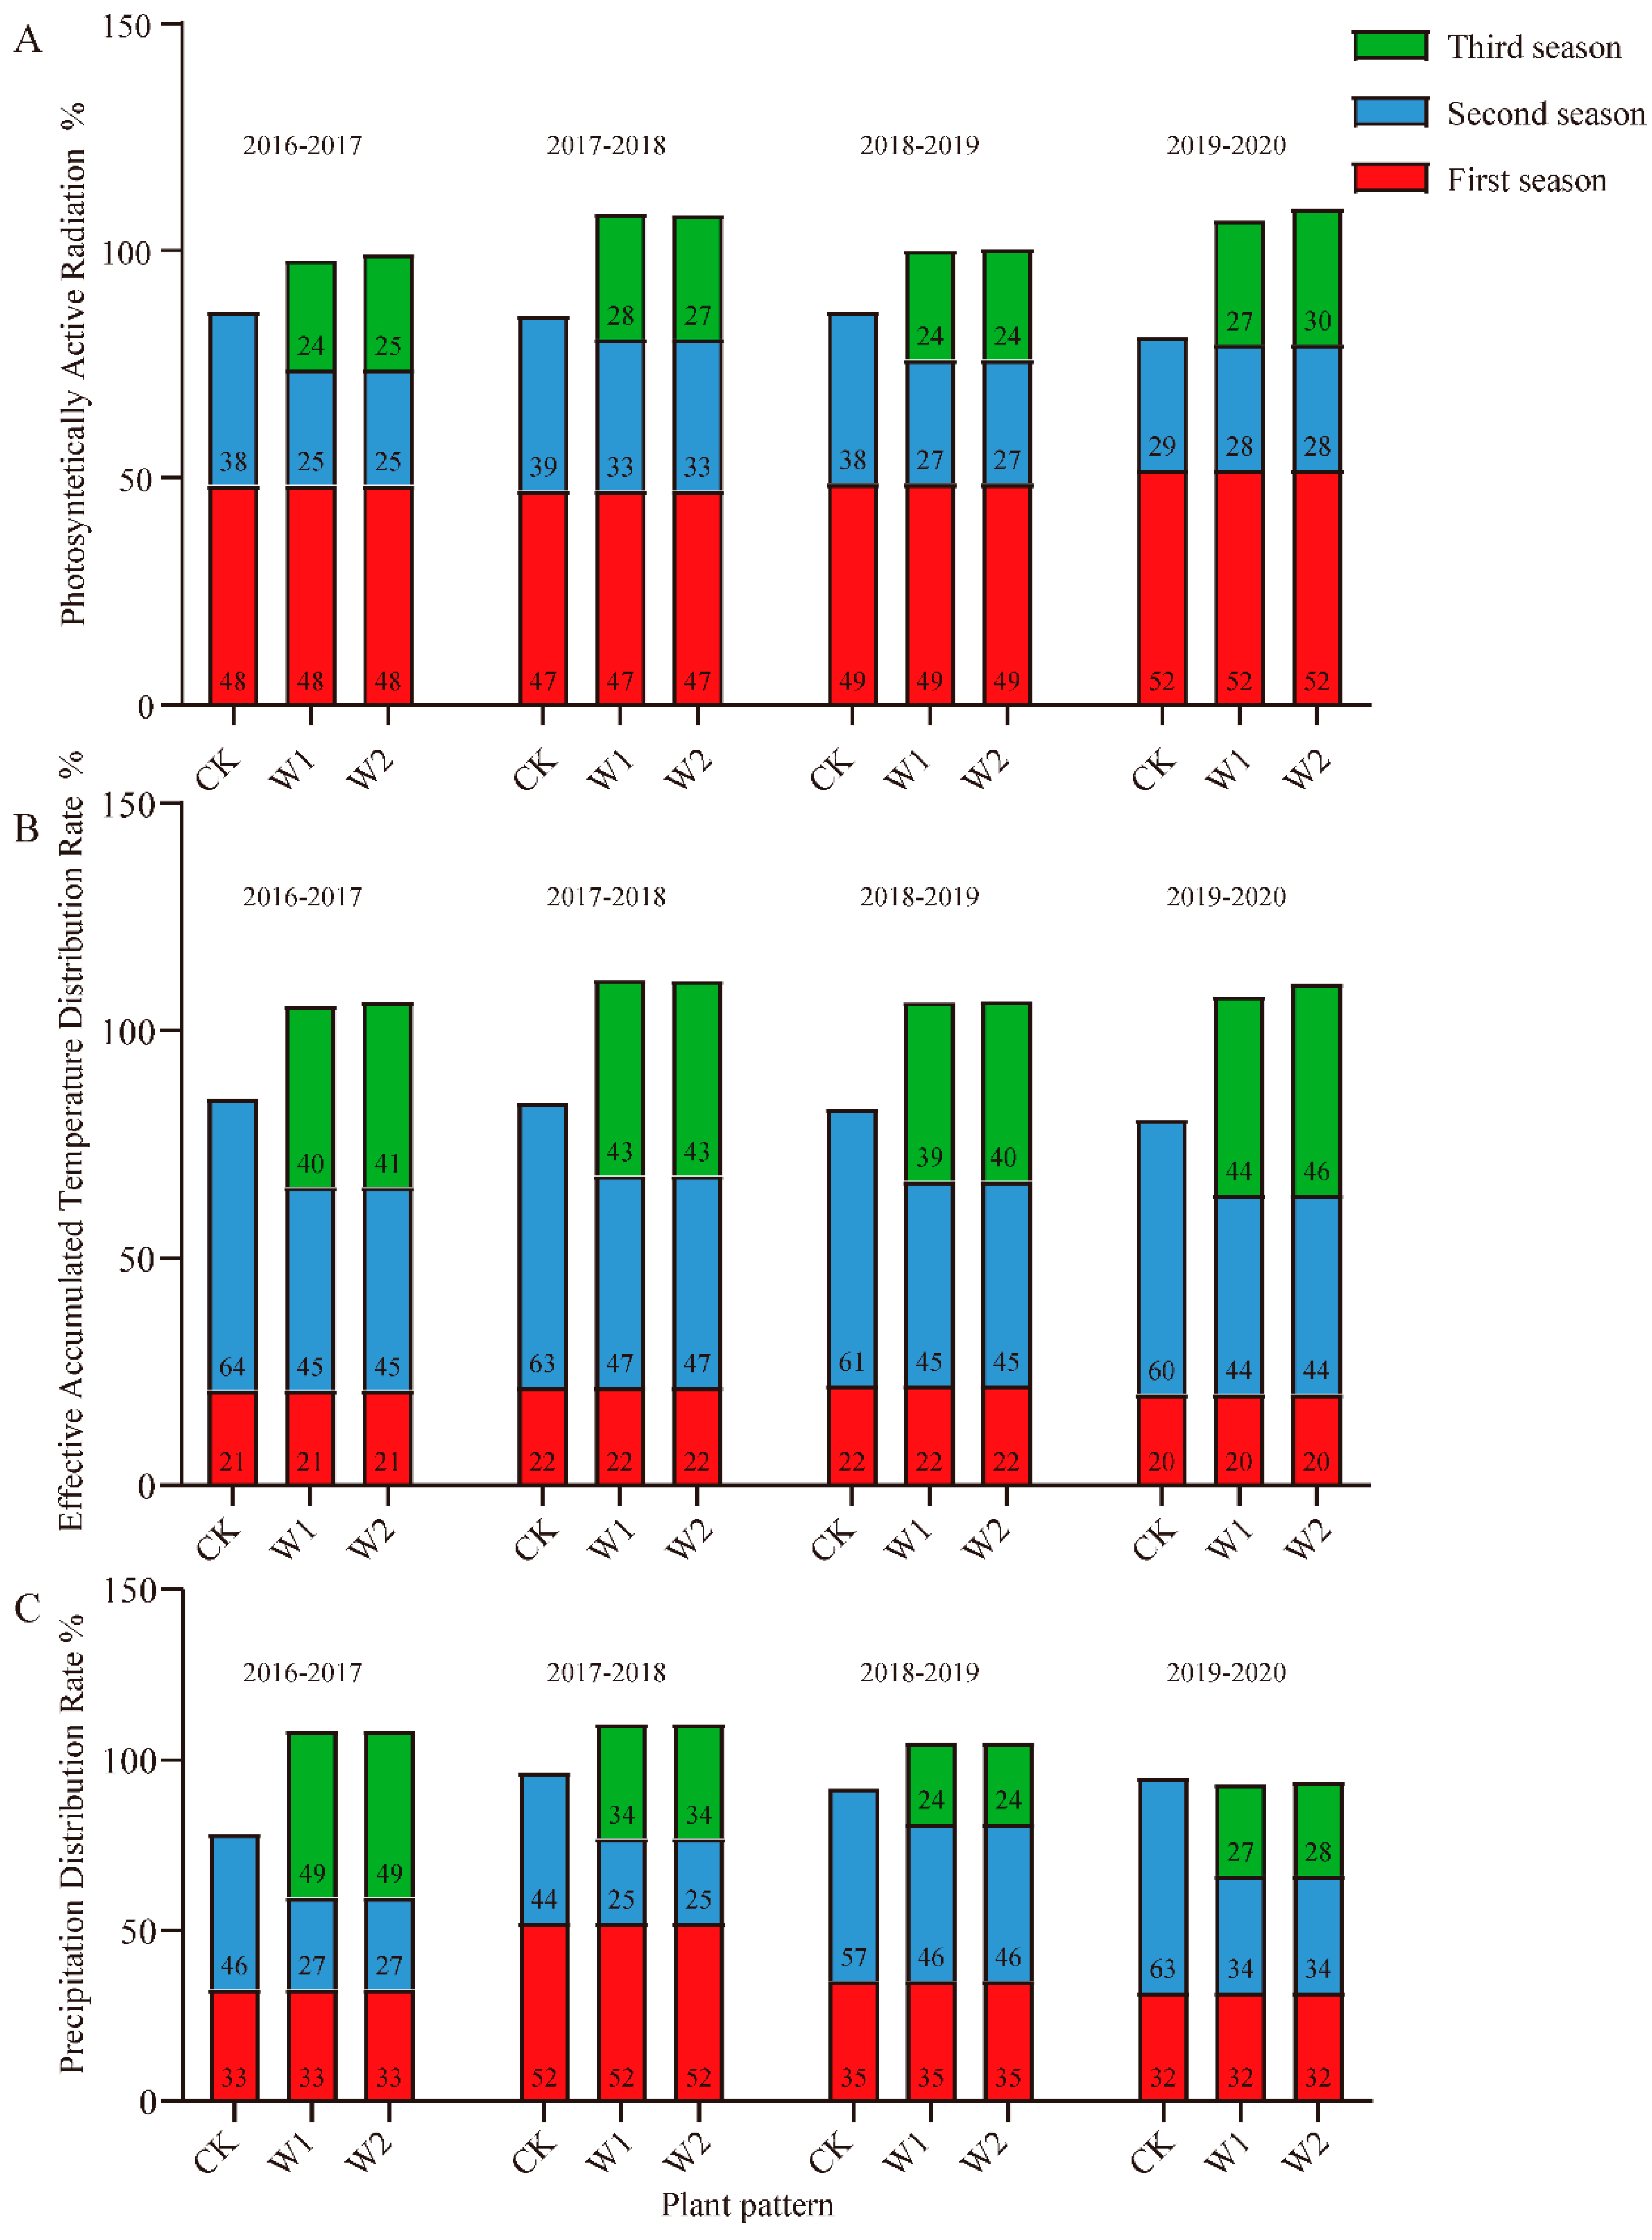
3.3. Annual Allocation of Climate Resources

From 2016 to 2020, the effective radiation allocation for wheat in all planting patterns was 47–52%, that for fresh soybean in the triple-cropping planting patterns (W1 and W2) was 24–30%, and the effective radiation allocation for fresh maize was 24–33%. Thus, the wheat crop was allocated approximately half of the annual effective radiation (Figure 4). From 2016 to 2020, the effective accumulated temperature allocation for wheat in all planting patterns was 20–22%, that for fresh soybean in the triple-cropping planting patterns was 40–46%, and that for the CK was 60–64% (Figure 4). The effective accumulated temperature allocation for fresh maize in the triple-cropping planting patterns was 40–47% (Figure 4).

3.4. Production Efficiency of Radiation, Accumulated Temperature, and Precipitation

No significant difference in the production efficiency of radiation, accumulated temperature, and precipitation was observed for wheat among all planting patterns. The radiation and accumulated temperature production efficiency for fresh maize was higher than that for fresh soybean in all planting patterns. From 2016 to 2020, the annual radiation production efficiency of W1 and W2 was significantly higher than that of the CK by 0.08 g MJ−1 and 0.28 g MJ−1, respectively (Table 3). The annual temperature production efficiency of W1 and W2 was significantly higher than that of the CK by 1.65 kg ha−1 °C−1 and 4.30 kg ha−1 °C−1, respectively (Table 3). The annual precipitation production efficiency of W1 and W2 was significantly higher than that of the CK by 4.40 kg mm−1 ha−1 and 9.67 kg mm−1 ha−1, respectively (Table 3).

3.5. Light Energy Use Efficiency

No significant difference in grain and total biomass radiation use efficiencies was observed for wheat in all planting patterns. The grain and total biomass radiation use efficiencies for the second-season fresh maize in W1 and W2 were higher than those for the second-season fresh soybean in the CK (Table 4). From 2016 to 2020, the annual grain and total biomass radiation use efficiencies of W1 and W2 were significantly higher than those for the CK (Table 4).

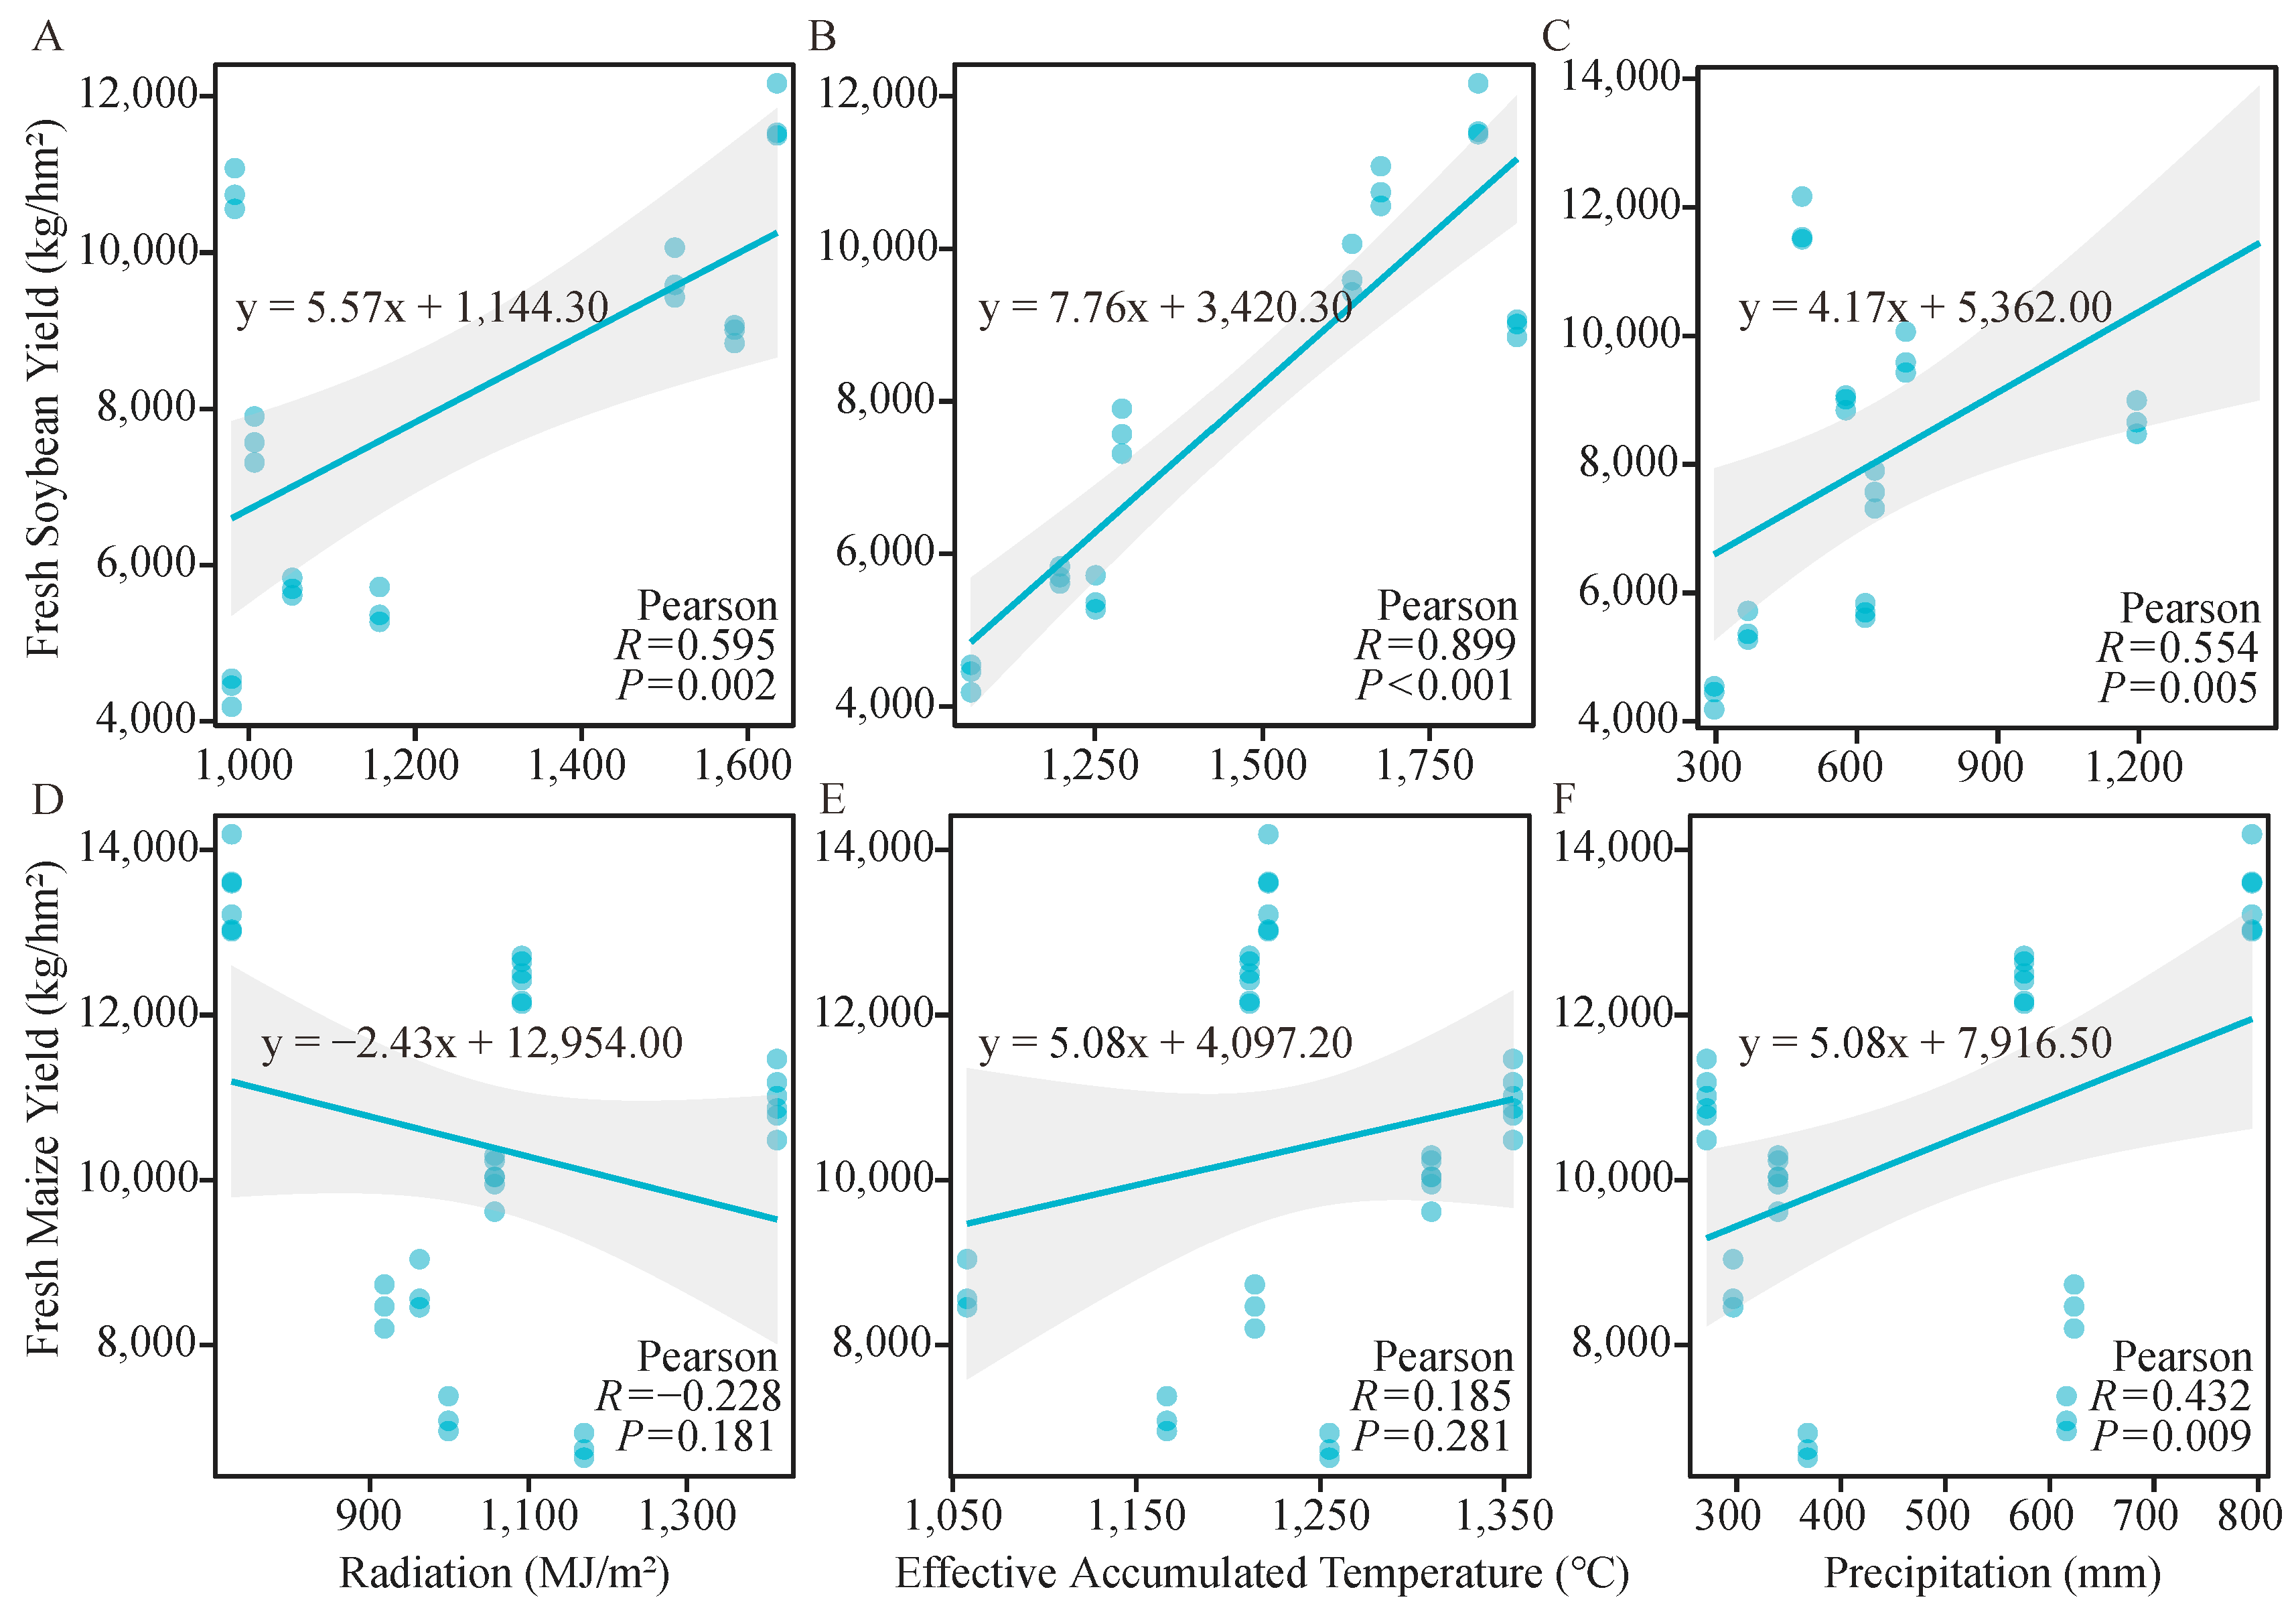
3.6. Relationship Between Fresh Maize and Fresh Soybean Grain Yield and Climatic Factors

The fresh soybean yield (y) was significantly positively correlated with the effective photosynthetic radiation (x) between 950 MJ m−2 and 1700 MJ m−2 (y = 5.57x + 1144.30) (Figure 5A). The fresh soybean yield increased with the increase in effective photosynthetic radiation. The fresh soybean yield (y) was significantly positively correlated with accumulated temperature (x) between 1050 °C and 1900 °C (y = 7.76x + 3420.30) (Figure 5B). The fresh soybean yield increased with the increase in the accumulated temperature. The fresh soybean yield (y) was significantly positively correlated with precipitation (x) between 295 mm and 1460 mm (y = 4.17x + 5362.00) (Figure 5C). The fresh maize yield was not significantly correlated with effective photosynthetic radiation and accumulated temperature (Figure 5D,E). However, the fresh maize yield (y) was significantly positively correlated with precipitation (x) between 270 mm and 800 mm (y = 5.08x + 7916.50) (Figure 5F).

4. Discussion

4.1. Impact of Planting Pattern on Yield and Biomass

A relay intercropping system is widely used where the growing season is too short for double cropping [19,25,26,38]. In the present study, we used relay intercropping to devise triple-cropping planting patterns comprising wheat–fresh maize–fresh soybean (W1) and wheat–fresh maize–fresh maize (W2). The annual yield and biomass of W1 and W2 were significantly higher than those of the double-cropping system (CK, wheat–fresh soybean) (Figure 3D,H). Relay intercropping with the same growth duration uses the land more efficiently than corresponding sole crops [39]. The most remarkable advantages of intercropping are greater yields, improved sustainability, and preservation of the environment through efficient utilization of natural resources (e.g., fertilizers, soil nutrients, water, and solar radiation) [40,41]. Compared with the CK, the triple-cropping planting patterns had increased effective accumulated temperature and radiation use efficiencies, which were the main factors in the increase in annual yield and biomass of W1 and W2 (Table 3). Compared with the CK, the triple-cropping planting patterns include an additional crop season and increase the land-use efficiency, which are also important factors in the significant increase in annual yield and biomass [42]. These indicate that utilizing relay intercropping could increase the annual yield of planting patterns.
From 2016 to 2020, the yield of wheat in the triple-cropping planting patterns showed a tendency to increase compared with that of the CK (Figure 3A). In 2020, the yield of wheat in W1 and W2 was significantly higher than that in the CK (Figure 3A). Diversification of rotations can improve yields or yield stability [43,44], increase productivity per unit area [45], and improve soil organic matter and microbial activity [46]. In a rotation cropping system, the previous crop affects the growth and yield of wheat [47]. The previous crop of wheat in W1 was fresh maize, whereas the previous crop of wheat in W2 was fresh soybean. However, no significant difference in wheat yield between W1 and W2 was observed from 2016 to 2020 (Figure 3A). The crop previous to wheat in the CK and W2 was fresh soybean; the yield of wheat in W2 was higher than that in the CK (Figure 3A). Cereal–legume intercropping can be a source of fodder and still support the yield of the following wheat cash crop [48]. Legume–barley intercropping increases N availability in the soil, enabling the succeeding wheat crop to achieve an adequate grain yield [49]. These findings indicate that the yield increase of wheat in the triple-cropping planting patterns (W1 and W2) was the result of relay intercropping (i.e., fresh maize–fresh maize or fresh maize–fresh soybean).
From 2016 to 2020, the yield and biomass of the second-season fresh maize did not differ significantly between W1 (wheat–fresh maize/fresh maize) and W2 (wheat–fresh maize/fresh soybean) (Figure 3B). This result indicated that relay-intercropped fresh maize or fresh soybean crops had little effect on the yield of the preceding fresh maize.

4.2. Impact of Planting Pattern on Economic Benefits

The average total expenditure, including seeds, pesticides and herbicides, fertilizer, and plowing, for wheat in all planting patterns was approximately similar (Table 2). Thus, the planting pattern had no effect on the total expenditure for the wheat crop. The fertilizer cost was 1740 RMB ha−1 and constituted 26.73% of the total expenditure (Table 2). Legume–cereal intercropping increases N availability in the soil, enabling the succeeding wheat crop to achieve an adequate grain yield with a reduced use of N-fertilizer [47]. If the triple-cropping planting patterns (W1 and W2) were applied in production, the amount of fertilizer required for the wheat crop would be less, thereby reducing production costs. From 2016 to 2020, under the three planting patterns, the average net economic benefit for wheat ranged from 7110 to 7990 RMB ha−1, the net economic benefit for fresh soybean ranged from 15,765 to 15,975 RMB ha−1, and the net economic benefit for second-season fresh maize ranged from 6225 RMB ha−1 to 19,665 RMB ha−1 (Table 2). The triple-cropping planting pattern, W2 (wheat–fresh maize–fresh soybean), improved the annual economic benefit for fresh maize. The economic benefits of W2 were higher than those of W1 (wheat–fresh maize–fresh maize) (Table 2). This result was mainly because the economic benefits of the third-season fresh soybean were higher than those for the third-season fresh maize. The derived economic benefit is vital to the success of any agricultural business [50].
The labor cost for fresh maize was 6450 RMB ha−1, which constituted 61.25% of the total expenditure. The labor cost for fresh soybean was 6975 RMB ha−1 and 7755 RMB ha−1, comprising 76.86% and 78.21% of the total expenditure, respectively (Table 2). The labor cost was the largest expense in the production of fresh maize and fresh soybean, mainly because of the lack of appropriate machinery for fresh maize and fresh soybean production. Therefore, the design and development of machinery specifically for the cultivation of fresh soybeans and fresh maize is needed.

4.3. Utilization Efficiency of Light, Temperature, and Precipitation Resources by Different Planting Patterns

Compared with the double-cropping planting pattern (CK, wheat–fresh soybean), the triple-cropping planting patterns significantly improved the annual production efficiency and the allocation of accumulated temperature, radiation, and precipitation (Figure 4, Table 3). The main reason for the increase in production efficiency is that relay intercropping fills the temporal gap in the wheat–fresh soybean double-cropping system (Figure 2), enabling full utilization of temperature, radiation, and precipitation resources and increasing the annual yields of the triple-cropping planting patterns.
Crop yield formation is influenced by radiation, accumulated temperature, and precipitation [51,52]. No difference in the allocation of solar radiation, effective accumulated temperature, and precipitation was observed for wheat among all planting patterns. This finding indicated that the increase in the wheat yields of W1 and W2 in 2020 was not associated with the utilization of radiation, temperature, and precipitation resources, and was instead likely due to changes in the soil condition caused by relay intercropping. The fresh soybean yield was significantly positively correlated with effective photosynthetic radiation, accumulated temperature, and precipitation (Figure 5). The fresh soybean yield in the CK was higher than that in W2 largely because of the higher allocation of solar radiation, effective accumulated temperature, and precipitation for fresh soybeans in the CK.
Reasonable intercropping can improve the light energy-utilization efficiency of crop populations and increase yields [17,53,54]. Compared with the CK, the annual radiation use efficiency of W1 and W2 increased by 17.78% and 38.09%, respectively (Table 4), indicating that relay intercropping improved the annual radiation utilization. The light energy-utilization efficiency of high-yield fields is 1–2%, and the utilization rate of light energy in rice fields situated along the Yangtze River is approximately 1.03% [55]. The annual radiation utilization efficiency of the triple-cropping planting patterns (W1 and W2) was relatively high. The W2 triple-cropping planting pattern (wheat–fresh maize–fresh soybean) evaluated in the present study is suitable to solve the problems of low-efficiency utilization of light, temperature, and water resources and poor crop-complementarity in dry-field production along the Yangtze River. The W2 planting pattern improves both food production and the derived economic benefits. Therefore, this cropping system could be used to improve production efficiency and to promote the coordinated production of food crops and economic crops in the dry-field production areas along the Yangtze River.

5. Conclusions

Compared with the conventional double-crop planting pattern (CK, wheat–fresh soybean), the triple-crop planting patterns (wheat–fresh maize–fresh maize, wheat–fresh maize–fresh soybean) significantly improved the annual yield, biomass, radiation use efficiency, and production efficiencies of accumulated temperature, radiation, and precipitation. The triple-crop planting patterns incorporating relay intercropping, especially the wheat–fresh maize–fresh soybean cropping system, significantly increased the annual economic benefits. The wheat–fresh maize–fresh soybean system is suitable for application in the YRD region and worth extending in the Yangtze River region.

Author Contributions

B.L.: Conceptualization, Data curation, Writing, Original draft preparation. J.L.: Writing, Methodology, Experimental design. Q.R.: Software, Draw designs. X.S.: Data analysis. W.S.: Data analysis. Y.W.: Reviewing, Investigation, Founding acquisition. F.X.: Reviewing, Founding acquisition, Project administration. All authors have read and agreed to the published version of the manuscript.

Funding

This study was supported by the Jiangsu Province Science and Technology Projects (E2023335), the Jiangsu Province Agricultural Independent Innovation Project (CX(22)2011), and the National Key Research and Development Program of China (2016YFD030020904).

Institutional Review Board Statement

Not applicable. The research subjects are wheat, fresh maize, and fresh soybeans, which do not require ethical review. This article does not contain any studies with animals performed by any of the authors.

Data Availability Statement

Data are contained within the article.

Conflicts of Interest

The authors declare that they have no conflicts of interest. No conflicts of interest exist in the submission of this manuscript, and the manuscript was approved by all authors for publication. The work described is original research that has not been published previously and is not under consideration for publication elsewhere, in whole or in part. All authors listed have approved the manuscript.

References

  1. Zhou, Y.; Fu, J.S.; Zhuang, G.; Levy, J.I. Risk-Based Prioritization Among Air Pollution Control Strategies in the Yangtze River Delta, China. Environ. Health Perspect. 2010, 118, 1204–1210. [Google Scholar] [CrossRef] [PubMed]
  2. Tao, Y.Y.; Sheng, X.W.; Xu, J.; Shen, Y.; Wang, H.H.; Lu, C.Y.; Shen, M.X. Characteristics of heat and solar resources allocation and utilization in riceoilseed rape double cropping systems in the Yangtze River Delta. Acta Agron. Sin. 2023, 49, 1327–1338. [Google Scholar]
  3. Sun, J.; Jin, L.; He, T.; Wei, Z.; Liu, X.; Zhu, L.; Li, X. Antibiotic resistance genes (ARGs) in agricultural soils from the Yangtze river delta, China. Sci. Total Environ. 2020, 740, 140001. [Google Scholar] [CrossRef] [PubMed]
  4. He, G.; Zhao, Y.; Wang, L.; Jiang, S.; Zhu, Y. China’s food security challenge: Effects of food habit changes on requirements for arable land and water. J. Clean. Prod. 2019, 229, 739–750. [Google Scholar] [CrossRef]
  5. Zhong, Z.; He, L.; Wang, Z. Geographic sources and the structural decomposition of emissions embodied in trade by Chinese megacities: The case of Beijing, Tianjin, Shanghai, and Chongqing. J. Clean. Prod. 2017, 158, 59–72. [Google Scholar] [CrossRef]
  6. Wu, M.L.; Chou, K.L.; Wu, C.R.; Chen, J.K.; Huang, T.C. Characterization and the possible formation mechanism of 2-acetyl-1-pyrroline in aromatic vegetable soybean (Glycine max L.). J. Food Sci. 2009, 74, 192–197. [Google Scholar] [CrossRef]
  7. Chen, L.; Liu, Q.Q.; Gai, J.Y.; Zhu, Y.L.; Yang, L.F.; Wang, C. Effects of nitrogen forms on the growth and polyamine contents in developing seeds of vegetable soybean. J. Plant Nutr. 2011, 34, 504–521. [Google Scholar] [CrossRef]
  8. Hou, J.; Wang, C.; Hong, X.; Zhao, J.; Xue, C.; Guo, N.; Gai, J.; Xing, H. Association analysis of vegetable soybean quality traits with SSR markers. Plant Breed. 2011, 130, 444–449. [Google Scholar] [CrossRef]
  9. Dong, D.K.; Fu, X.J.; Yuan, F.J.; Chen, P.Y.; Zhu, S.L. Genetic diversity and population structure of vegetable soybean(Glycine max (L.) Merr.) in China as revealed by SSR markers. Genet. Resour. Crop. 2014, 61, 173–183. [Google Scholar] [CrossRef]
  10. Mueller, N.D.; Gerber, J.S.; Johnston, M.; Ray, D.K.; Ramankutty, N.; Foley, J.A. Closing yield gaps through nutrient and water management. Nature 2012, 490, 254–257. [Google Scholar] [CrossRef]
  11. Tilman, D.; Balzer, C.; Hill, J.; Befort, B.L. Global food demand and the sustainable intensification of agriculture. Proc. Natl. Acad. Sci. USA 2011, 108, 20260–20264. [Google Scholar] [CrossRef] [PubMed]
  12. Brooker, R.W.; Bennett, A.E.; Cong, W.-F.; Daniell, T.J.; George, T.S.; Hallett, P.D.; Hawes, C.; Iannetta, P.P.M.; Jones, H.G.; Karley, A.J.; et al. Improving intercropping: A synthesis of research in agronomy, plant physiology and ecology. N. Phytol. 2015, 206, 107–117. [Google Scholar] [CrossRef] [PubMed]
  13. Inal, A.; Gunes, A.; Zhang, F.; Cakmak, I. Peanut/maize intercropping induced changes in rhizosphere and nutrient concentrations in shoots. Plant Physiol. Biochem. 2007, 45, 350–356. [Google Scholar] [CrossRef] [PubMed]
  14. Chen, G.; Liang, B.; Bawa, G.; Chen, H.; Shi, K.; Hu, Y.; Chen, P.; Fan, Y.; Pu, T.; Sun, X.; et al. Gravity Reduced Nitrogen Uptake via the Regulation of Brace Unilateral Root Growth in Maize Intercropping. Front. Plant Sci. 2021, 12, 724909. [Google Scholar] [CrossRef]
  15. Chang, X.; Wei, D.; Zeng, Y.; Zhao, X.; Hu, Y.; Wu, X.; Song, C.; Gong, G.; Chen, H.; Yang, C.; et al. Maize-soybean relay strip intercropping reshapes the rhizosphere bacterial community and recruits beneficial bacteria to suppress Fusarium root rot of soybean. Front. Microbiol. 2022, 13, 1009689. [Google Scholar] [CrossRef]
  16. Ofori, F.; Stern, W.R. Cereal–legume intercropping systems. Adv. Agron. 1987, 41, 41–90. [Google Scholar]
  17. Zhang, L.; Werf, W.V.D.; Zhang, S.; Li, B.; Spiertz, J.H.J. Growth, yield and quality of wheat and cotton in relay strip intercropping systems. Field Crops Res. 2007, 103, 178–188. [Google Scholar] [CrossRef]
  18. Rodriguez-Navarro, D.N.; Oliver, I.M.; Contreras, M.A.; Ruiz-sainz, J.E. Soybean interactions with soil microbes, agronomical and molecular aspects. Agron. Sustain. 2011, 31, 173–190. [Google Scholar] [CrossRef]
  19. Naik, B.S.S.S.; Sharma, S.K.; Pramanick, B.; Yadav, S.K.; Reddy, G.K.; Tirunagari, R.; Meena, R.S.; Bamboriya, J.S.; Kumar, M.S.; Gurumurthy, P.; et al. Development of an improved silicon application protocol for organic sweet corn cultivation ensuring higher productivity and better soil health. Silicon 2024, 16, 2547–2555. [Google Scholar] [CrossRef]
  20. Wang, Z.; Zhao, X.; Wu, P.; He, J.; Chen, X.; Gao, Y.; Cao, X. Radiation interception and utilization by wheat/maize strip intercropping systems. Agric. For. Meteorol. 2015, 204, 58–66. [Google Scholar] [CrossRef]
  21. Raza, M.A.; Feng, L.Y.; Khalid, M.H.B.; Iqbal, N.; Meraj, T.A.; Hassan, M.J.; Ahmed, S.; Chen, Y.K.; Feng, Y.; Wenyu, Y. Optimum leaf excision increases the biomass accumulation and seed yield of maize plants under different planting patterns. Ann. Appl. Biol. 2019, 175, 54–68. [Google Scholar] [CrossRef]
  22. Orozco-Angelino, X.; Espinosa-Ramirez, J.; Serna-Saldivar, S.O. Extrusion as a tool to enhance the nutritional and bioactive potential of cereal and legume by-products. Food Res. Int. 2023, 169, 112889. [Google Scholar] [CrossRef] [PubMed]
  23. Yang, F.; Huang, S.; Gao, R.; Liu, W.; Yong, T.; Wang, X.; Wu, X.; Yang, W. Growth of soybean seedlings in relay strip intercropping systems in relation to light quantity and red:far-red ratio. Field Crop. Res. 2014, 155, 245–253. [Google Scholar] [CrossRef]
  24. Te, X.; Din, A.U.; Cui, K.; Raza, M.; Ali, M.F.; Xiao, J. Inter-specific root interactions and water use efficiency of maize/soybean relay strip intercropping. Field Crops Res. 2023, 291, 108793. [Google Scholar] [CrossRef]
  25. Monzon, J.; Mercau, J.; Andrade, J.; Caviglia, O.; Cerrudo, A.; Vega, C.; Andrade, F.; Calviño, P. Maize-soybean intensification alternatives for the Pampas. Field Crops Res. 2014, 162, 48–59. [Google Scholar] [CrossRef]
  26. Yang, F.; Wang, X.; Liao, D.; Lu, F.; Gao, R.; Liu, W.; Yong, T.; Wu, X.; Du, J.; Liu, J.; et al. Yield response to different planting geometries in maize-soybean relay strip intercropping systems. Agron. J. 2015, 107, 296–304. [Google Scholar] [CrossRef]
  27. Li, S.; Evers, J.B.; Werf, W.V.; Wopke, W. Plant architectural responses in simultaneous maize/soybean strip intercropping do not lead to a yield advantage. Ann. Appl. Biol. 2020, 177, 195–210. [Google Scholar] [CrossRef]
  28. Zhou, T.; Wang, L.; Sun, X.; Wang, X.; Pu, T.; Yang, H.; Rengel, Z.; Liu, W.; Yang, W. Improved post-silking light interception increases yield and P-use efficiency of maize in maize/soybean relay strip intercropping. Field Crops Res. 2020, 262, 108054. [Google Scholar] [CrossRef]
  29. Liu, X.; Rahman, T.; Song, C.; Yang, F.; Su, B.; Cui, L.; Bu, W.; Yang, W. Relationships among light distribution, radiation use efficiency and land equivalent ratio in maize-soybean strip intercropping. Field Crops Res. 2018, 224, 91–101. [Google Scholar] [CrossRef]
  30. Yu, L.; Tang, Y.; Wang, Z.; Gou, Y.; Wang, J. Nitrogen-cycling genes and rhizosphere microbial community with reduced nitrogen application in maize/soybean strip intercropping. Nutr. Cycl. Agroecosyst. 2019, 113, 35–49. [Google Scholar] [CrossRef]
  31. Stern, W.R. Nitrogen fixation and transfer in intercrop systems. Field Crops Res. 1993, 34, 335–356. [Google Scholar] [CrossRef]
  32. Gong, K.; Chen, L. Characterization of Carbohydrates and their Metabolizing Enzymes Related to the Eating Quality of Postharvest Fresh Waxy Corn. J. Food Biochem. 2013, 37, 619–627. [Google Scholar] [CrossRef]
  33. Li, Z.; Hong, T.; Shen, G.; Gu, Y.; Guo, Y.; Han, J. Amino Acid Profiles and Nutritional Evaluation of Fresh Sweet-Waxy Corn from Three Different Regions of China. Nutrients 2022, 14, 3887. [Google Scholar] [CrossRef] [PubMed]
  34. Rahman, T.; Ye, L.; Liu, X.; Iqbal, N.; Du, J.; Gao, R.; Liu, W.; Yang, F.; Yang, W. Water use efficiency and water distribution response to different planting patterns in maize–soybean relay strip intercropping systems. Exp. Agric. 2016, 53, 159–177. [Google Scholar] [CrossRef]
  35. Lv, Y.; Francis, C.; Wu, P.; Chen, X.; Zhao, X. Maize–Soybean Intercropping Interactions Above and Below Ground. Crop Sci. 2014, 54, 914–922. [Google Scholar] [CrossRef]
  36. Wang, X.; Deng, X.; Pu, T.; Song, C.; Yong, T.; Yang, F.; Sun, X.; Liu, W.; Yan, Y.; Du, J.; et al. Contribution of interspecific interactions and phosphorus application to increasing soil phosphorus availability in relay intercropping systems. Field Crops Res. 2017, 204, 12–22. [Google Scholar] [CrossRef]
  37. Gitari, H.I.; Gachene, C.K.K.; Karanja, N.N.; Kamau, S. Optimizing yield and economic returns of rain-fed potato(Solanum tuberosum L.) through water conservation under potato-legume intercropping systems. Agric. Water Manag. 2018, 208, 59–66. [Google Scholar] [CrossRef]
  38. Coll, L.; Cerrudo, A.A.; Rizzalli, R.H.; Monzon, J.P.; Andrade, F.H. Capture and use of water and radiation in summer intercrops in the south-east Pampas of Argentina. Field Crops Res. 2012, 134, 105–113. [Google Scholar] [CrossRef]
  39. Yu, Y.; Stomph, T.J.; Makowski, D.; Werf, W. Temporal niche differentiation increases the land equivalent ratio of annual intercrops: A meta-analysis. Field Crops Res. 2015, 184, 133–144. [Google Scholar] [CrossRef]
  40. Kermah, M.; Franke, A.C.; Adjei-Nsiah, S.; Ahiabor, B.D.K.; Abaidoo, R.C.; Giller, K.E. Maize-grain legume intercropping for enhanced resource use efficiency and crop productivity in the guinea savanna of northern ghana. Field Crops Res. 2017, 213, 38–50. [Google Scholar] [CrossRef]
  41. Shen, Y.; Sui, P.; Huang, J.; Wang, D.; Whalen, J.K.; Chen, Y. Greenhouse gas emissions from soil under maize–soybean intercrop in the North China Plain. Nutr. Cycl. Agroecosyst. 2018, 110, 451–465. [Google Scholar] [CrossRef]
  42. Umesh, M.R.; Angadi, S.; Begna, S.; Gowda, P.; Lauriault, L.; Hagevoort, R.; Darapuneni, M. Intercropping and species interactions on physiological and light use characteristics of forage cereals-legumes combinations in semi-arid regions. Field Crops Res. 2023, 290, 108755. [Google Scholar] [CrossRef]
  43. Bowles, T.M.; Mooshammer, M.; Socolar, Y.; Calderón, F.; Cavigelli, M.A. Long-term evidence shows that crop-rotation diversification increases agricultural resilience to adverse growing conditions in North America. One Earth 2022, 2, 284–293. [Google Scholar] [CrossRef]
  44. Gaudin, A.C.M.; Janovicek, K.; Deen, B.; Hooker, D.C. Wheat improves nitrogenuse efficiency of maize and soybean-based cropping systems. Agric. Ecosyst. Environ. 2015, 210, 1–10. [Google Scholar] [CrossRef]
  45. Hauggaard-Nielsen, H.; Mundus, S.; Jensen, E.S. Grass-clover under sowing affects nitrogen dynamics in a grain legume–cereal arable cropping system. F. Crop. Res. 2012, 136, 23–31. [Google Scholar] [CrossRef]
  46. Tiemann, L.K.; Grandy, A.S.; Atkinson, E.E.; Marin-Spiotta, E.; McDaniel, M.D. Crop rotational diversity enhances belowground communities and functions in an agroecosystem. Ecol. Lett. 2015, 18, 761–771. [Google Scholar] [CrossRef]
  47. Mesfin, S.; Gebresamuel, G.; Haile, M.; Zenebe, A. Potentials of legumes rotation on yield and nitrogen uptake of subsequent wheat crop in northern Ethiopia. Heliyon 2023, 9, e16126. [Google Scholar] [CrossRef]
  48. Monti, M.; Pellicanò, A.; Pristeri, A.; Badagliacca, G.; Preiti, G.; Gelsomino, A. Cereal/grain legume intercropping in rotation with durum wheat in crop/livestock production systems for mediterranean farming system. Field Crops Res. 2019, 240, 23–33. [Google Scholar] [CrossRef]
  49. Scalise, A.; Tortorella, D.; Pristeri, A.; Petrovicova, B.; Gelsomino, A.; Lindstrom, K.; Monti, M. Legume-barley intercropping stimulates soil N supply and crop yield in the succeeding durum wheat in a rotation under rainfed conditions. Soil. Biol. Biochem. 2015, 89, 151–161. [Google Scholar] [CrossRef]
  50. Feng, L.; Dai, J.L.; Tian, L.W.; Zhang, H.J.; Li, W.J.; Dong, H.Z. Review of the technology for high-yielding and efficient cotton cultivation in the northwest in land cotton-growing region of China. Field Crops Res. 2017, 208, 18–26. [Google Scholar] [CrossRef]
  51. Wang, D.; Laza, M.R.C.; Cassman, K.G.; Huang, J.; Nie, L.; Ling, X.; Centeno, G.S.; Cui, K.; Wang, F.; Li, Y.; et al. Temperature explains the yield difference of double-season rice between tropical and subtropical environments. Field Crops Res. 2016, 198, 303–311. [Google Scholar] [CrossRef]
  52. Tanaka, D.L.; Anderson, R.L.; Rao, S.C. Crop Sequencing to Improve Use of Precipitation and Synergize Crop Growth. Agron. J. 2005, 97, 385–390. [Google Scholar] [CrossRef]
  53. Gou, F.; Ittersum, M.K.; Simon, E.; Leffelaar, P.A.; van der Putten, P.E.; Zhang, L.; van der Werf, W. Intercropping wheat and maize increases total radiation interception and wheat RUE but lowers maize RUE. Eur. J. Agron. 2017, 84, 125–139. [Google Scholar] [CrossRef]
  54. Wang, R.; Wang, Z.; Sun, Q.; Zhao, M.; Du, L.; Wu, D. Effects of crop types and nitrogen fertilization on temperature sensitivity of soil respiration in the semi-arid loess plateau. Soil. Tillage Res. 2016, 163, 1–9. [Google Scholar] [CrossRef]
  55. Zhou, S.X.; Dong, H.Y.; Sun, S.Q. Correlation analysis of crop production and photosynthetic efficiency. J. Zhangjiakou Agric. Coll. 2003, 19, 4–5. [Google Scholar]
Figure 1. Radiation, temperature, and precipitation from 2016 to 2020.
Agriculture 14 02178 g001
Figure 2. Schematic diagram of planting patterns assessed in this study. CK, wheat–fresh soybean; W1, wheat–fresh maize–fresh maize; W2, wheat–fresh maize–fresh soybean.
Agriculture 14 02178 g002
Figure 3. Yield and biomass in three planting patterns from 2017 to 2020. (AD), Yield; (EH), Biomass. CK, wheat–fresh soybean; W1, wheat–fresh maize–fresh maize; W2, wheat–fresh maize–fresh soybean. Different lowercase letters on each bar indicate significant differences in biomass/yield in each crop season (p < 0.05, Fisher’s least significant difference). In the two-way ANOVA, * and ** indicate significant differences at the 0.05 and 0.01 probability levels, respectively.
Agriculture 14 02178 g003
Figure 4. Allocation of solar radiation, effective accumulated temperature, and precipitation in the three planting patterns from 2017 to 2020. (A), photosynthetically active radiation, (B), effective accumulated temperature, (C), precipitation. CK, wheat–fresh soybean; W1, wheat–fresh maize/fresh maize; W2, wheat–fresh maize/fresh soybean.
Agriculture 14 02178 g004
Figure 5. Relationship between fresh maize and fresh soybean yields and climatic factors from 2017 to 2020. (AC): Relationship between fresh soybean yield and radiation, effective accumulated temperature, and precipitation, respectively; (DF): relationship between fresh maize yield and radiation, effective accumulated temperature, and precipitation, respectively.
Agriculture 14 02178 g005
Table 1. Sowing date, harvest date, and planting density for the three planting patterns.
YearPlanting PatternFirst SeasonSecond SeasonThird Season
DensitySowing DateHarvest DateDensitySowing DateHarvest DateDensitySowing DateHarvest Date
2016–2017wheat–fresh soybean (CK)2.4 million plant ha−1Nov. 3rdMay 27th120,000 plant ha−1Jun. 3rdSep. 21st
wheat–fresh maize/fresh maize (W1)2.4 million plant ha−1Nov. 3rdMay 27th60,000 plant ha−1Jun. 17thAug. 25th60,000 plant ha−1Jul. 29thOct. 16th
wheat–fresh maize/fresh soybean (W2)2.4 million plant ha−1Nov. 3rdMay 27th60,000 plant ha−1Jun. 17thAug. 25th12,000 plant ha−1Jul. 29thOct. 21th
2017–2018wheat–fresh soybean (CK)2.4 million plant ha−1Oct. 28thMay 26th120,000 plant/ha−1Jun. 6thSep. 16th
wheat–fresh maize/fresh maize (W1)2.4 million plant ha−1Oct. 28thMay 26th60,000 plant ha−1Jun. 18thAug. 30th60,000 plant ha−1Jul. 24thOct. 12th
wheat–fresh maize/fresh soybean (W2)2.4 million plant ha−1Oct. 28thMay 26th60,000 plant ha−1Jun. 18thAug. 30th12,000 plant ha−1Jul. 24thOct. 11th
2018–2019wheat–fresh soybean (CK)2.4 million plant ha−1Oct. 29thMay 30th120,000 plant ha−1Jun. 9thSep. 19th
wheat–fresh maize/fresh maize (W1)2.4 million plant hm−2Oct. 29thMay 30th60,000 plant hm−2Jun. 17thAug. 27th60,000 plant ha−1Aug. 5thOct. 25th
wheat–fresh maize/fresh soybean (W2)2.4 million plant hm−2Oct. 29thMay 30th60,000 plant hm−2Jun. 17thAug. 27th12,000 plant ha−1Aug. 5thOct. 28th
2019–2020wheat–fresh soybean(CK)2.4 million plant ha−1Nov. 3rdMay 25th120,000 plant ha−1Jun. 10thSep. 22th
wheat–fresh maize/fresh maize (W1)2.4 million plant ha−1Nov. 3rdMay 25th60,000 plant ha−1Jun. 20thAug. 31st60,000 plant ha−1Jul. 25thOct. 11th
wheat–fresh maize/fresh soybean (W2)2.4 million plant ha−1Nov. 3rdMay 25th60,000 plant ha−1Jun. 20thAug. 31st12,000 plant ha−1Jul. 25thOct. 22th
Table 2. Economic benefits derived for the three planting patterns.
ItemsWheat–Fresh Soybean (CK)Wheat–Fresh Maize/Fresh Maize (W1)Wheat–Fresh Maize/Fresh Soybean (W2)
WheatFresh SoybeanAnnualWheatFresh MaizeFresh MaizeAnnualWheatFresh MaizeFresh SoybeanAnnual
Seeds (RMB ha−1)60010501650600135013503300600135010503000
Pesticides and herbicides (RMB ha−1)54045099054084067520555408404051785
Fertilizer (RMB ha−1)174066024001740205520555850174020556454440
Plowing the fields (RMB ha−1)84008408400084084000840
Labor (RMB ha−1)2790775510,54527906450645015,69027906450697516,215
Total expenditure (RMB ha−1)6510991516,425651010,69510,53027,735651010,695907526,280
Total Income (RMB ha−1)13,62025,68039,30014,43030,10516,75546,87514,25030,36025,05055,410
Net benefit (RMB ha−1)711015,76522,875792019,410622525,650774019,66515,97535,640
Benefit–cost ratio1.091.591.391.221.810.590.921.191.841.761.36
Table 3. Production efficiency of accumulated temperature, radiation, and precipitation in the three planting patterns from 2017 to 2020.
YearPlant PatternProduction Efficiency of Ra (g MJ–1)Production Efficiency of AT (kg ha−1 °C–1)Production Efficiency of Pr (kg ha−1 mm–1)
First
Season
Second
Season
Third
Season
AnnualFirst
Season
Second
Season
Third
Season
AnnualFirst
Season
Second
Season
Third
Season
Annual
2017CK0.32 ± 0.005 a0.57 ± 0.007 b 0.42 ± 0.004 c10.49 ± 0.18 a4.77 ± 0.06 b 5.26 ± 0.06 c15.64 ± 0.26 a15.57 ± 0.21 b 12.25 ± 0.15 c
W10.32 ± 0.010 a0.94 ± 0.033 a0.71 ± 0.022 a0.59 ± 0.013 a10.33 ± 0.34 a7.62 ± 0.26 a6.12 ± 0.19 a8.01 ± 0.19 a15.39 ± 0.50 a29.4 ± 1.01 a11.59 ± 0.35 a18.63 ± 0.43 a
W20.31 ± 0.005 a0.95 ± 0.014 a0.54 ± 0.011 b0.55 ± 0.004 b10.06 ± 0.17 a7.69 ± 0.11 a4.77 ± 0.09 b7.50 ± 0.06 b14.99 ± 0.25 a29.66 ± 0.43 a9.25 ± 0.18 b17.44 ± 0.14 b
2018CK0.32 ± 0.006 a0.72 ± 0.023 a 0.48 ± 0.008 c10.17 ± 0.19 a6.44 ± 0.21 b 6.23 ± 0.12 c11.26 ± 0.21 a24.27 ± 0.78 b 16.62 ± 0.32 c
W10.34 ± 0.004 a0.79 ± 0.243 a0.58 ± 0.013 a0.60 ± 0.007 a10.80 ± 0.14 a8.22 ± 0.25 a5.39 ± 0.12 a8.49 ± 0.11 a11.96 ± 0.16 a41.09 ± 1.27 a18.39 ± 0.42 a22.31 ± 0.29 a
W20.33 ± 0.005 a0.76 ± 0.194 a0.47 ± 0.020 b0.56 ± 0.003 b10.64 ± 0.17 a7.96 ± 0.20 a4.36 ± 0.19 b7.88 ± 0.05 b11.78 ± 0.18 a39.78 ± 1.01 a14.82 ± 0.64 b21.02 ± 0.14 b
2019CK0.32 ± 0.008 a0.64 ± 0.022 b 0.44 ± 0.005 c10.64 ± 0.25 a5.93 ± 0.21 b 5.95 ± 0.07 c14.44 ± 0.33 b13.77 ± 0.47 b 12.86 ± 0.16 c
W10.35 ± 0.012 a1.15 ± 0.014 a0.90 ± 0.032 a0.71 ± 0.013 a11.61 ± 0.40 a10.36 ± 0.13 a8.21 ± 0.29 a9.81 ± 0.20 a15.75 ± 0.54 a21.80 ± 0.27 a29.30 ± 1.05 a22.53 ± 0.43 a
W20.35 ± 0.006 a1.13 ± 0.026 a0.45 ± 0.019 b0.59 ± 0.002 b11.47 ± 0.17 a10.17 ± 0.24 a4.13 ± 0.18 b8.74 ± 0.02 b15.57 ± 0.25 a21.40 ± 0.50 a14.83 ± 0.63 b19.17 ± 0.05 b
2020CK0.34 ± 0.009 a1.10 ± 0.027 b 0.56 ± 0.006 b10.39 ± 0.28 a6.44 ± 0.16 b 5.97 ± 0.07 c7.91 ± 0.22 b7.41 ± 0.18 b 7.18 ± 0.08 b
W10.37 ± 0.013 a1.88 ± 0.068 a0.92 ± 0.029 a0.90 ± 0.015 a11.53 ± 0.41 a11.19 ± 0.40 a6.97 ± 0.22 a10.27 ± 0.18 a8.77 ± 0.31 a17.22 ± 0.62 a13.58 ± 0.43 a12.24 ± 0.22 a
W20.37 ± 0.006 a1.82 ± 0.047 a0.75 ± 0.029 b0.84 ± 0.021 a11.58 ± 0.19 a10.82 ± 0.28 a5.89 ± 0.23 b9.81 ± 0.25 b8.81 ± 0.14 a16.65 ± 0.43 a11.91 ± 0.46 b11.97 ± 0.30 a
Different lowercase letters in the same column indicate significant differences (p < 0.05, Fisher’s least significant difference).
Table 4. Comparison of light energy-use efficiency (%) in the three planting patterns from 2017 to 2020.
YearPlant PatternRadiation Use Efficiency of GrainRadiation Use Efficiency of Total Biomass
First SeasonSecond SeasonThird SeasonAnnualFirst SeasonSecond SeasonThird SeasonAnnual
2017CK0.50 ± 0.008 a0.39 ± 0.005 b 0.39 ± 0.006 b1.18 ± 0.026 a0.86 ± 0.003 b 0.90 ± 0.014 b
W10.49 ± 0.016 ab0.65 ± 0.024 a0.46 ± 0.027 a0.51 ± 0.012 a1.16 ± 0.033 ab1.26 ± 0.050 a0.84 ± 0.037 a1.09 ± 0.021 a
W20.48 ± 0.008 b0.68 ± 0.004 a0.40 ± 0.014 b0.51 ± 0.006 a1.13 ± 0.015 b1.31 ± 0.030 a0.71 ± 0.025 b1.06 ± 0.017 a
2018CK0.50 ± 0.009 b0.50 ± 0.012 b 0.43 ± 0.002 c1.16 ± 0.021 b1.12 ± 0.017 a 0.98 ± 0.012 b
W10.53 ± 0.007 a0.59 ± 0.018 a0.46 ± 0.016 a0.57 ± 0.009 a1.24 ± 0.031 a1.13 ± 0.034 a0.79 ± 0.038 a1.18 ± 0.026 a
W20.52 ± 0.008 ab0.57 ± 0.010 a0.34 ± 0.027 b0.53 ± 0.001 b1.22 ± 0.034 a1.11 ± 0.019 a0.61 ± 0.050 b1.11 ± 0.009 a
2019CK0.50 ± 0.011 b0.45 ± 0.017 b 0.42 ± 0.003 c1.12 ± 0.031 b1.07 ± 0.046 b 0.95 ± 0.012 b
W10.55 ± 0.018 a0.86 ± 0.018 a0.57 ± 0.053 a0.64 ± 0.015 a1.24 ± 0.035 a1.67 ± 0.043 a1.17 ± 0.081 a1.34 ± 0.039 a
W20.54 ± 0.009 a0.87 ± 0.024 a0.34 ± 0.025 b0.58 ± 0.004 b1.20 ± 0.027 a1.68 ± 0.040 a0.80 ± 0.058 b1.24 ± 0.017 a
2020CK0.52 ± 0.014 b0.73 ± 0.025 b 0.48 ± 0.013 b1.16 ± 0.038 b1.52 ± 0.014 b 1.05 ± 0.023 b
W10.58 ± 0.020 a1.16 ± 0.043 a0.57 ± 0.023 a0.71 ± 0.013 a1.27 ± 0.047 a2.18 ± 0.069 a1.10 ± 0.041 a1.43 ± 0.036 a
W20.58 ± 0.009 a1.13 ± 0.027 a0.50 ± 0.026 b0.70 ± 0.007 a1.29 ± 0.005 a2.14 ± 0.049 a1.08 ± 0.047 a1.45 ± 0.004 a
Data are means (n = 3). Different lowercase letters in the same column indicate significant differences (p < 0.05, Fisher’s least significant difference).
Disclaimer/Publisher’s Note: The statements, opinions and data contained in all publications are solely those of the individual author(s) and contributor(s) and not of MDPI and/or the editor(s). MDPI and/or the editor(s) disclaim responsibility for any injury to people or property resulting from any ideas, methods, instructions or products referred to in the content.

