Article

The Influence of Sowing Rate and Foliar Fertilization on the Yield of Some Triticale Varieties in the Context of Climate Change in Northwest Romania

by
Beniamin Emanuel Andras
1,2,
Avram Fițiu
1,*,
Peter Balazs Acs
1,2,
Vasile Adrian Horga
1,
Ionut Racz
1 and
Marcel Matei Duda
1
1
Doctoral School “Agricultural Engineering Sciences”, University of Agricultural Sciences and Veterinary Medicine, 400327 Cluj-Napoca, Romania
2
Agricultural Research Development Station, 447180 Livada, Romania
*
Author to whom correspondence should be addressed.
Agriculture 2024, 14(12), 2155; https://doi.org/10.3390/agriculture14122155
Submission received: 4 November 2024 / Revised: 22 November 2024 / Accepted: 22 November 2024 / Published: 27 November 2024
(This article belongs to the Section Crop Production)

Abstract

:
Triticale is recognized worldwide because of its high protein and lysine contents, high production capacity, and adaptability to biotic and abiotic stress conditions, these qualities being taken over from wheat and rye. Triticale is widely used in various fields, such as animal feed in various forms, medicine, baking, beer and alcohol brewing, cellulose, bioethanol industry, and many others. Thus, the demand for triticale grain is increasing, and this has led to the research and improvement in culture technology to obtain superior products, both quantitatively and qualitatively. The purpose of this study was to identify the best varieties of triticale cultivated in the northwest of Romania, sown in different plots, and fertilized on the ground. Additionally, this study was carried out over a period of two years at the Livada Agricultural Research and Development Station, Satu Mare County. This study was located on acidic soil with a pH between 5.19 and 6.65 and a humus content of 2.82%. The climatic conditions in the reference period were extremely variable; in the first year, a deficit of more than 90 mm of precipitation was registered, and in the second year of this study, an increase of more than 34 mm. The effects of additional fertilization were influenced by the level of precipitation. In 2023, additional fertilization with foliar fertilizer brought production increases of 884 kg/ha, compared with 2022, where foliar fertilization in drought conditions led to a decrease in production. The Utrifun variety proved to be the most productive; this foliar fertilized and with biostimulator, sown at 550 seeds/m2, recorded an increase in production of over 4500 kg/ha compared with the Negoiu control and sown at 650 seeds/m2 and fertilized with foliar fertilizer had an increase of over 4370 kg/ha compared with the Negoiu control. It recorded a production of 9700 kg/ha sown at 550 seeds/m2 and fertilized only on the soil, and sown at 450 seeds/m2 and additionally fertilized with foliar fertilizer recorded a production of 10.900 kg/ha. Utrifun was followed by Zvelt which, sown at 450 seed/m2 and fertilized on the soil, recorded 9500 kg/ha, ensuring an increase of 1800 kg/ha compared with the Negoiu control. The lowest production was achieved by the Tulnic variety, which is 2022, sown at 650 seed/m2 and fertilized on the ground, recorded 5874 kg/ha, 1621 kg/ha less than the control variant. The increases in production obtained by these varieties will be confirmed in a subsequent study under different climatic conditions.

1. Introduction

Triticale (Triticosecale Wittmack) is the result of an artificial crossing between wheat (Triticum aestivum) and rye (Secale cereale), taking over the essential characteristics of both parents. Triticale has a high production capacity and a high protein content, characters borrowed from wheat. From rye, it borrowed a high content of lysine [1], higher than that of cereal grains, these being between 0.33 and 0.71% [2], the adaptability to unfavorable climatic conditions, the soil poor and acidic and a better resistance to diseases than wheat [3]. The protein content is close to that of wheat, being different depending on the variety, region, and applied technology; as a rule, it is between 11.4 and 14% [4]. In India, in a study of two triticale genotypes, they had a protein content of 13.1% [5]. Unfortunately, triticale does not have the same superior baking characteristics as wheat. Gluten, which is essential in baking, triticale is difficult to wash, hard and less flexible [6,7]. For the most part, triticale grains are used in animal feed, especially in feeding pigs and birds, in different forms (grains, silage, straw, hay) [8]. Mixed with Lolium multiflorum, they can be used for grazing [9]. Recently, in addition to their use as animal feed, once with genetic progress, triticale has found numerous uses, for example in the production of bioethanol [10]. In a study that took place in Lativa, the lunasin peptide was discovered in triticale grains, which has a preventive role against cancer, an anti-inflammatory effect, and reduced cholesterol, a fact for which it can also be used in human medicine [11]. The phenolic acids found in the flour and bran of triticale grains have an antioxidant, anticancer, and antibacterial role [12]. They are still used in the bakery industry, but because of the high alpha-amylase content and the low gluten content, 100% triticale flour cannot be used in a mixture of wheat flour [13]. It is used in the beer industry in a ratio of 30% triticale malt and 70% barley malt [14]. Due to the high content of essential amino acids, mineral compounds, and dietary fibers, triticale grains are valuable in human nutrition [15,16]. If Enterococcus faecium bacteria that have microbial activity against Listeria innocua are added to the triticale flour component, active films are obtained from triticale flour; these films have the ability to maintain anti-listerial activity for a period of up to 45 days, a fact for that triticale flour together with these bacteria can be used in the food packaging industry that can be used to soften cheese slices [17]. Having a high content of vegetable matter, triticale straws have a high content of lignin and hemicellulose, thus, they are an alternative source in the cellulose industry [18,19]. Triticale grains are an important source of fish feed [20,21,22].
Due to the wide areas in which triticale can be used, this species occupies considerable areas worldwide. In 2022, according to FAOSTAT [23], the harvested area of triticale worldwide was over 3.6 million hectares and a total production of over 14 million tons with a yield of 3.9 tons/ha. Of the 3.6 million hectares, over 3.1 million hectares were cultivated in Europe alone, ensuring a total production of 13 million tons and a yield of 4.1 tons/ha. Due to the arid climate conditions in Africa, triticale occupied an area of only 10 thousand hectares in 2022, harvesting over 23 thousand tons, ensuring a yield of 2.2 tons/ha (Table 1).
In 2022, the largest triticale grower in the world was Poland, with an area of 1.2 million hectares and a total production of over 5 million tons. The second place is occupied by Belarus with an area of 406 thousand hectares and a total production of 1.1 million tons. The highest yield per hectare was recorded in Germany (5.948 kg), followed by Austria (5.686 kg).
In Romania in 2022, triticale occupied an area of 56.900 hectares, registering a total production of 192 thousand tons and a yield of 3.376 kg/ha (Table 2).
The purpose of the research presented in this paper is to highlight the most productive varieties of triticale cultivated in the northwest of Romania and to highlight the role of applied technology (fertilization and plant selection) on production. The varieties chosen in this study are developed at the Fundulea National Agricultural Research-Development Institute, an institute with which the Livada Agricultural Research-Development Station (ARDS Livada) (the station where the experiment was carried out) has a collaborative relationship in several projects of research with the Romanian Ministry of Agriculture and Rural Development. ARDS Livada produces seed from the biological category “Base” in the Negoiu variety and from 2023, also in the Utrifun variety, intended for sale to farmers and economic agents. Through this study, an attempt was made to highlight and test some newer and more productive triticale varieties and adapt them to the climatic conditions in northwest Romania, and to replace the Negoiu variety, this being a variety created in 2012. Utrifun, Zvelt and Tulnic were highlighted due to the high resistance to the main foliar and spike diseases and to plant lodging. It was necessary to implement this study over a longer period and with conditions and climatic differences to test these varieties, and at the end of this study, according to the results obtained, the Negoiu variety should be replaced with new, much more productive varieties.

2. Materials and Methods

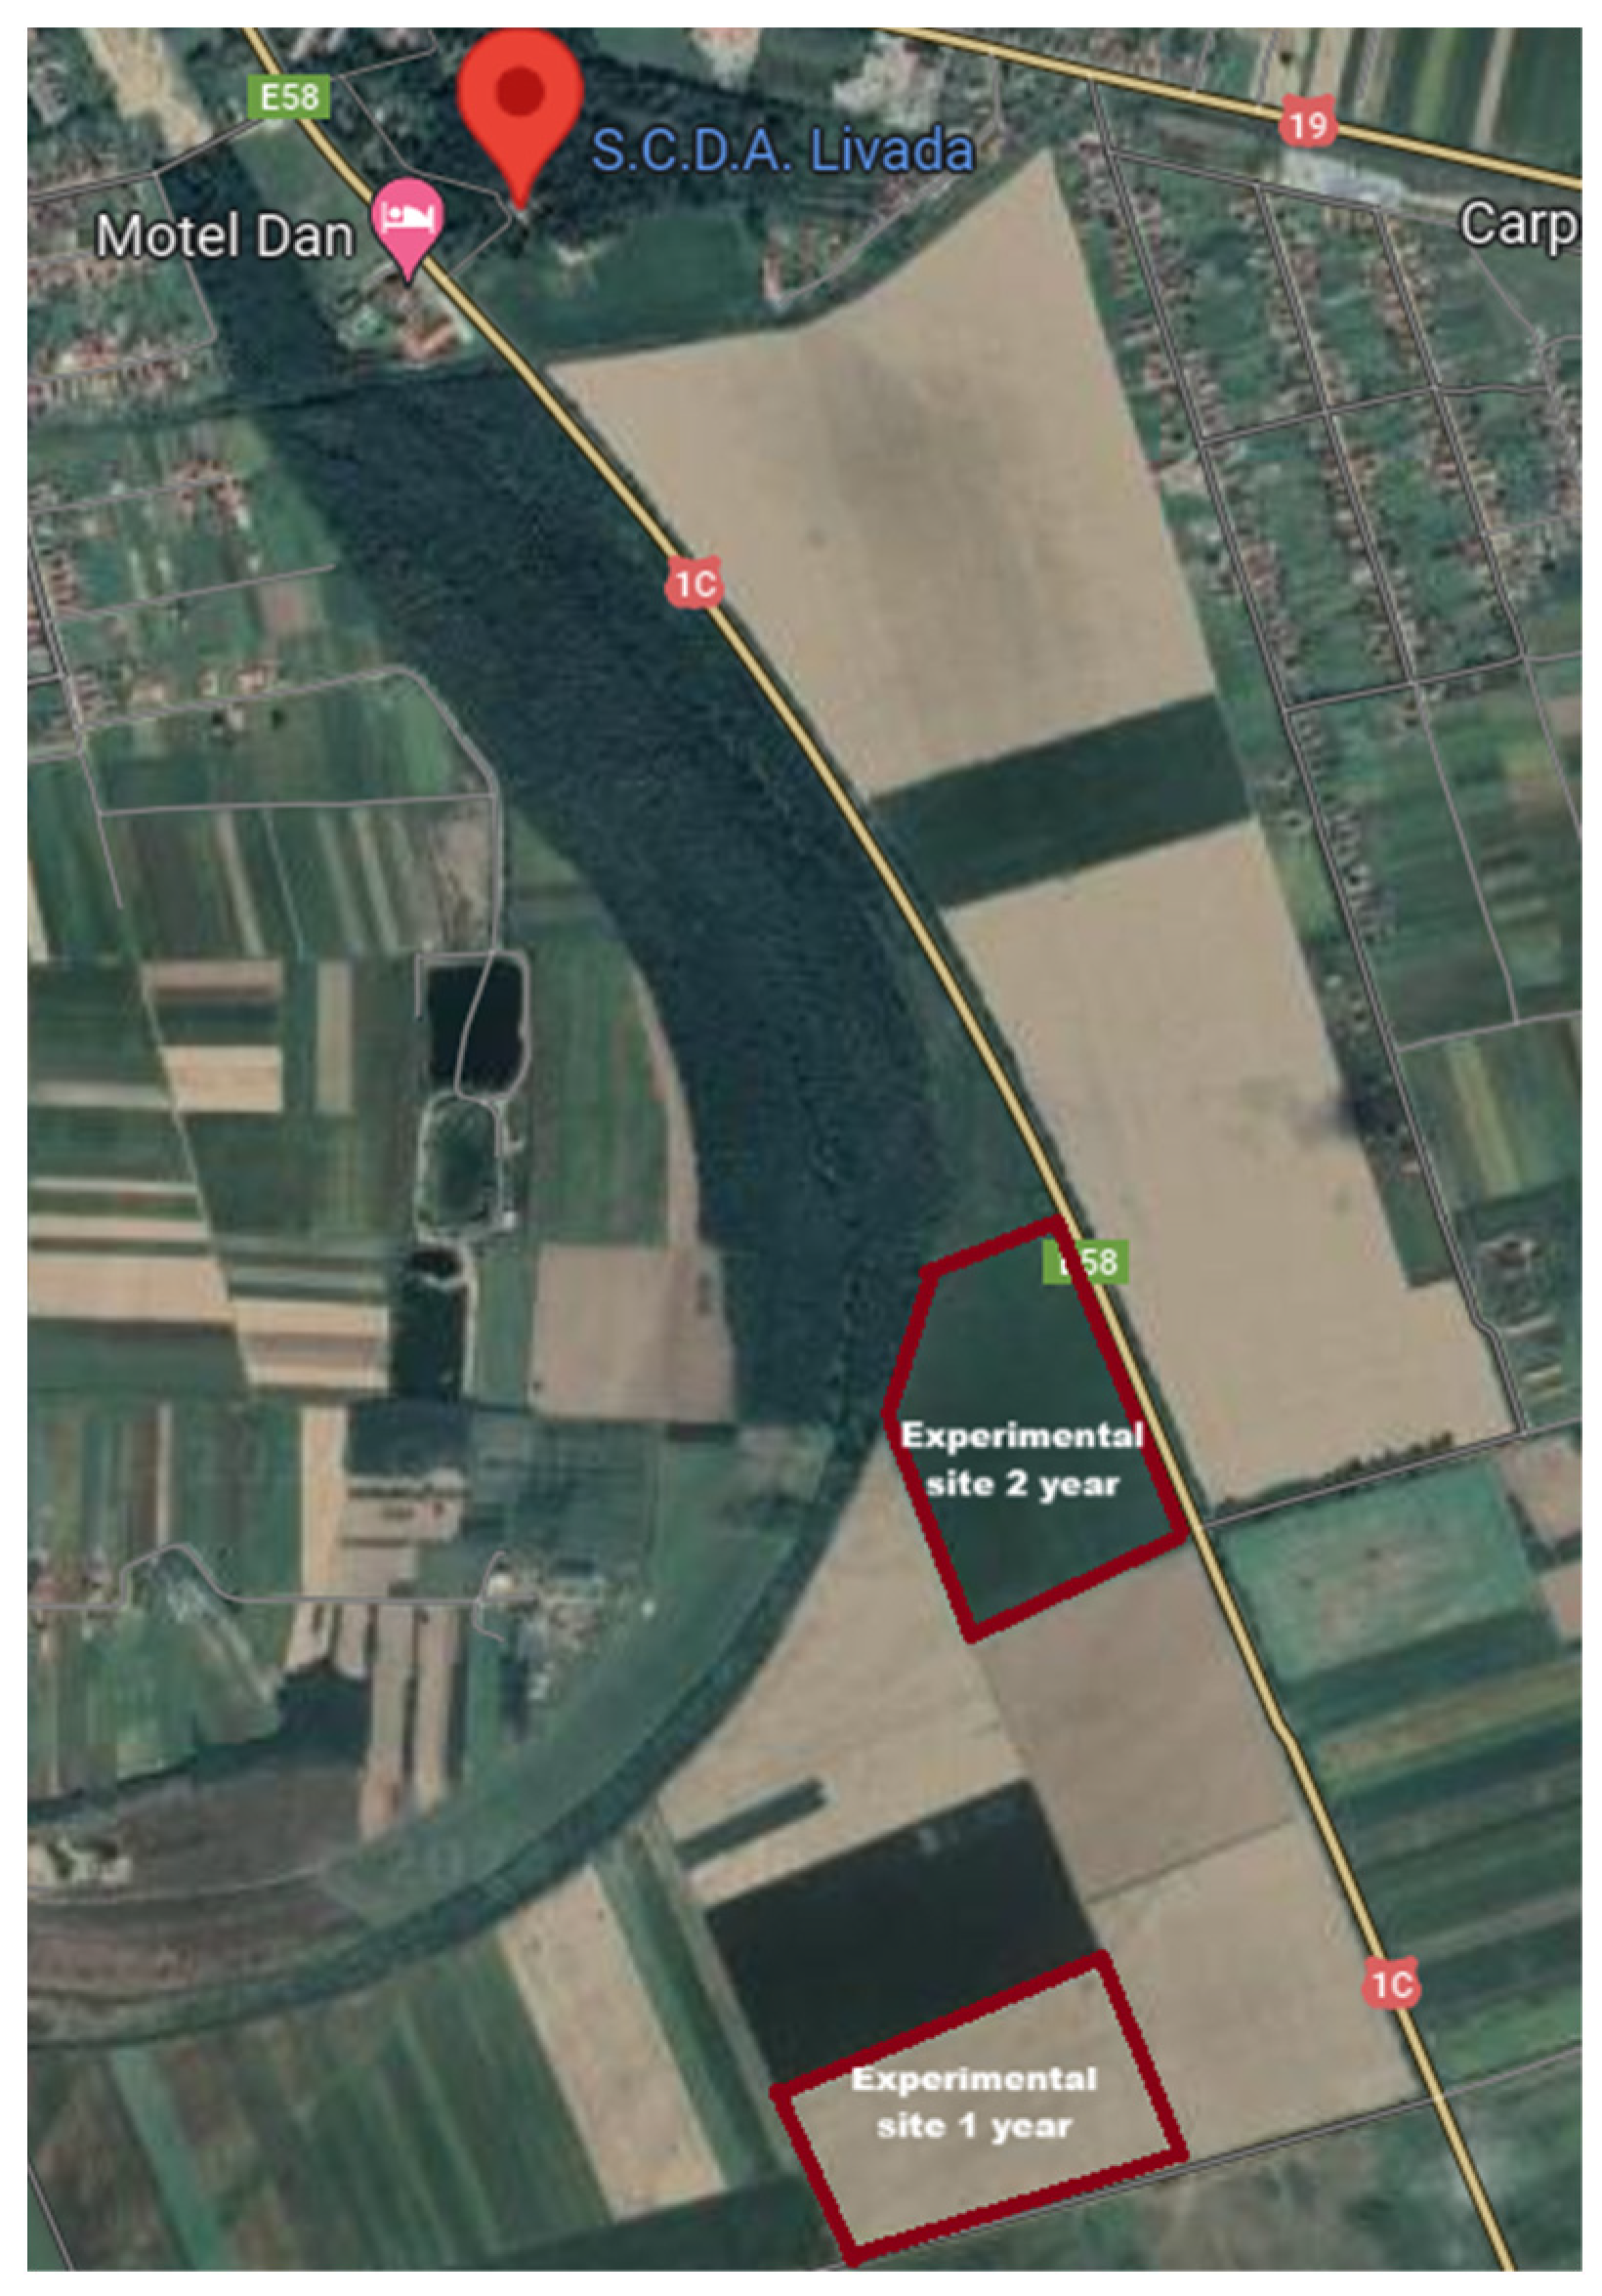
2.1. Experimental Sites, Soil and Climate

This study was carried out in Romania, in the northwest of the country, at the Agricultural Research and Development Station in the city of Livada, Satu Mare county (lat. 47°51′; long. 23°08, altitude 120–130 m), during 2021/2022, and 2022/2023 (Figure 1).
The type of soil on which the experiment was placed in a typical preluvosol (brown luvic soil), which is part of the class of Luvisols, which has an acidic reaction with a pH between 5.19 and 6.65, depending on the depth. From the point of view of humus content, it is low, having only 2.82% in the arable layer (Table 3). This type of soil consists of the following soil horizons.
Ap horizon- the processed A—it has a depth of 0–18 cm and is the horizon from the surface that is being processed. The humus content is 2.82% and has a pH of 5.19 and 20.9%g/g clay.
Ao horizon—18–40 cm deep; it has a light color, acid pH, and low humus content.
AB horizon—40–55 cm deep, it is a transitional horizon, with weak acid reaction but with a high clay content.
Bt1w horizon—55–70 cm deep, it is formed by the accumulation of elevated clay. The yellowish-reddish color is given by the accumulation of Fe oxides, a process due to the stagnation of water in the soil profile above a waterproof.
Bt2w horizon—70–110 cm deep; it has a low pH and high clay content.
As can be seen in Table 4, the climatic conditions varied from one year to another, with an increase in average monthly temperatures. The average temperature during the triticale vegetation period in the first year of this study was 7.6 °C, 0.6 °C higher than the multi-year average temperature, and the amount of precipitation was approximately 430 mm, recording a deficit of over 90 mm. The biggest precipitation deficit in 2021–2022 compared with multi-annual amounts was in the months of October (−41 mm), March (−44 mm), May (−59 mm) and June (−81 mm). In the second year of this study, the average temperature during the vegetation period was 1.8 °C higher than the average temperature in the first year, respectively 8.8 °C. The biggest temperature difference between the monthly average and the multiannual average occurred in February 2023, +6.8 °C. From the point of view of the precipitation level, it was approximately 563 mm, registering an additional precipitation of 34.8 mm; however, the rainfall was unevenly distributed during triticale vegetation periods, so in October 2022, when the sowing was carried out, a deficit of 25 mm was recorded. In May and June, when the phenophase of grain formation and filling takes place, the precipitation level was lower than the multiannual monthly amount, in May −55.8 mm and in June −20.6 mm.

2.2. Biological Material

For the establishment of the experiment, four triticale varieties were used, created at NARDI Fundulea [24]: Negoiu, Utrifun, Zvelt, and Tulnic, which are registered in the official catalog of varieties [25].
Negoiu is the longest-lived of the varieties tested, it was registered in 2012 and created through individual selection repeated annually from the combination of two lines. It has a height of 110–120 cm, and the ears are large, white-matte, and ridged. The mass of one thousand grains is between 48 and 54 g, and the hectoliter mass is 72–74 kg/hl. It has good resistance to fusarium head blight and sepotroiosis and medium resistance to brown rust. It can be used in the spirits and bioethanol industry and the bakery industry in a ratio of 1 to 1 with wheat flour.
Utrifun is a variety registered in 2018, with a plant height of 85–95 cm, with large, white spikes, and the grains are large and red in color. The weight of one thousand grains is 45–50 g, and the hectoliter mass is 72–76 kg/hl. Compared with the Negoiu variety, it shows better resistance to toppling due to the smaller plant size. It has good resistance to brown rust and fusarium wilt and medium resistance to yellow rust and spike fusarium wilt. The protein content of the grains is 12.4%. The usage domains of this variety are similar to those of the Negoiu variety.
Zvelt is a variety of triticale registered in 2020, which has a plant height of 110–120 cm with medium spikes. The mass of one thousand grains is between 45–54 g, and the hectoliter mass is between 75 and 77 kg/hl. It has an average resistance to yellow and brown rust. It presents an essential resistance to sprouting in the ear. The protein content is located at 12.5%. It is used in animal feed in different forms in the alcohol, bioethanol and bakery industries.
The Tulnic variety was registered in 2017 and is classified as a semi-early variety, which has a plant height of 110–118 cm and semi-dense, large, and pointed ears. The mass of one thousand grains is between 45 and 58 g, and the hectoliter mass is between 73 and 75 kg/hl. It is resistant to toppling plants, fusarium head blight, dwarf virus, and septoriosis. All 4 varieties show a resistance to the toxicity of aluminum ions. Tulnic is used in animal feed, the spirits industry, bioethanol, and the bakery industry.

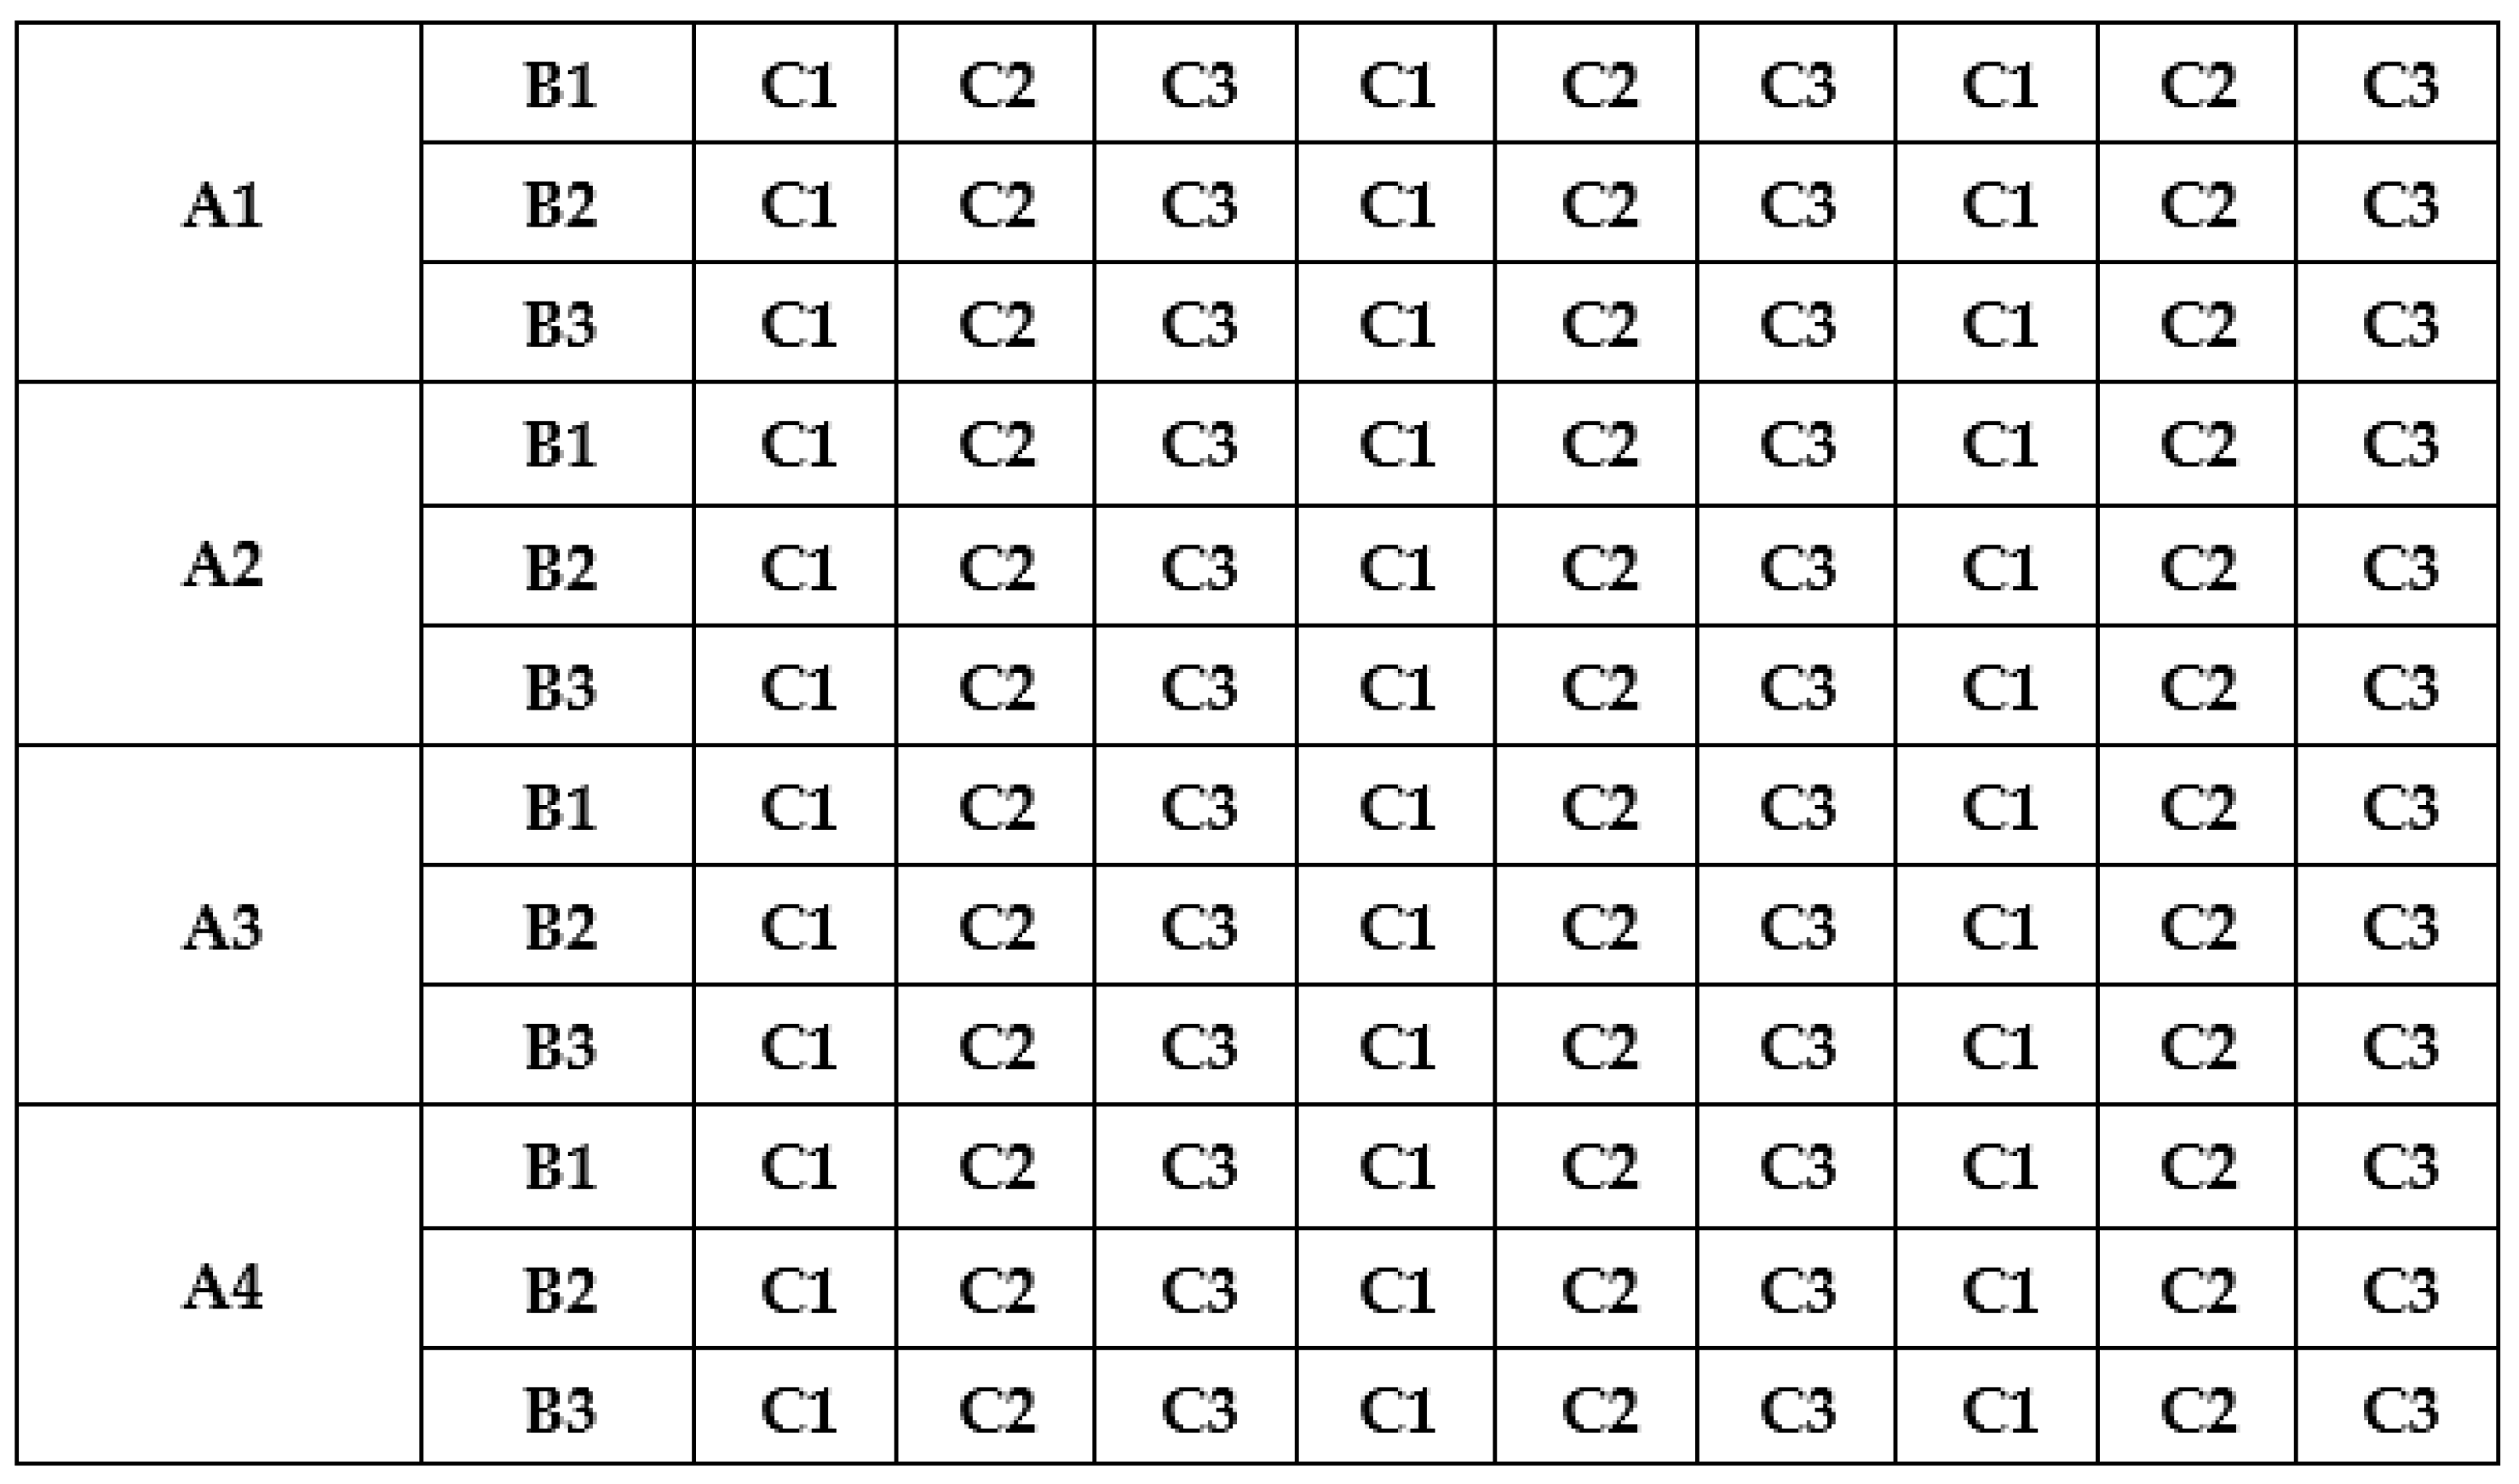
2.3. Experimental Design

The experiment was placed under the method of subdivided plots, being of the 4 × 3 × 3 type, having 3 experimental factors.
Factor A is represented by variety;
  • A1-Negoiu
  • A2-Utrifun
  • A3-Zvelt
  • A4-Tulnic
Factor B represented fertilization
  • B1-chemical fertilization in autumn and spring
  • B2-chemical fertilization + foliar fertilization
  • B3-chemical fertilization + foliar fertilization + biostimulator
Factor C was represented by the seeding rate of the 4 varieties of triticale (Figure 2):
  • C1-450 seeds/m2
  • C2-550 seeds/m2
  • C3-650 seeds/m2

2.4. Technology and Materials Used

The preceding plant: in the two years of study, it was fodder pea (Magistra Liv variety). Soil work: after the pea harvest, in July, a disc harrow work was carried out; in September, plowing was carried out at a depth of 23–25 cm, and two passes with a disc harrow were carried out.
Basic fertilization: with complex fertilizer of the type DAP 18:46:0 in a dose of 150 kg/ha, this is a chemical fertilizer that contains the 2 essential macro-elements in plant life. It has a content of 18% active substance in ammoniacal nitrogen (NH4) and 46% phosphorus petaxoide (P2O5). This type of fertilizer rich in phosphorus is applied because lands in the reference area are poorly supplied with phosphorus (P) [26].
Preparation of the germination bed: with the combiner, through which the fertilizer was incorporated into the soil.
The sowing of the 4 varieties of triticale was carried out in experimental plots, in 3 repetitions, which had an area of 12 m2, respectively 10 m2 harvested with Wintersteiger seeders (Figure 3).
Additional fertilization, spring: calcium ammonium nitrate, 27% nitrogen active substance (a.s.), in a dose of 300 kg/ha, all experimental variants. It contains 13.5% nitric nitrogen and 13.5% ammoniacal nitrogen; in addition to this macroelement, it also contains microelements: calcium 7% and magnesium 5% [27].
Fighting weeds: Sekator Progress OD herbicide in a dose of 0.15 L/ha, all experimental variants. This is a systemic herbicide used to control weeds in straw cereal crops. It contains three active substances: 100 g/L amidosulfuron, 25 g/L iodosulfuron-methyl-Na, and 250 g/L mefenpyr-diethyl. Used in a dose of 0.15 L/ha to fight weeds such as Cirsium arvense, Ambrosia artemisiifolia, Sonchus arvensis, Capsella bursa-pastoris, Matricaria chamomilla, Atriplex patula, Chenopodiumm album, Raphanus raphanistrum, Sinapsis arvense, etc. [28].
Fighting diseases: Nativo Pro in a dose of 0.6 L/ha, all experimental variants, in the month of May before planting the plants. This is a systemic fungicide that fights foliar and ear diseases in cereal crops. It contains two active substances: 175 g/L prothioconazole and 150 g/L trifloxystrobin. This fungicide fights: Septoria tritici, Erysiphe graminis, Pyrenophora tritici-repentis, Puccinia striiformis, Pucinia recondita and Fusarium spp. [29].
Before planting the plants in May:
  • The B2 variants of each variety were foliar fertilized with the product Solar 10-10-10 + Me in a dose of 3 l/ha. The product used has a nitrogen content of 10%, phosphorus 10%, potassium 10%, and trace elements such as zinc 0.15%, copper 0.03%, manganese 0.025%, and boron 0.02%. It ensures the necessary nutrients for the plants, controlling the imbalances produced, especially in the phenophases such as twinning before flowering and formation of the grain [30].
  • The B3 variants of each variety were foliarly fertilized with the Solar 10-10-10 + Me product at a dose of 3 L/ha and with the Cropmax biostimulator at a dose of 0.5 L/ha. The biostimulator is also approved for use in organic farming; it contains growth stimulants such as auxins, cytokinins, gibberellins, organic amino acids, vitamins, and vegetable enzymes. In addition to these, it also contains macro and microelements: 0.2% nitrogen, 0.4% phosphorus, 0.02% potassium, iron 220 mg/L, magnesium 550 mg/L, manganese 54 mg/L, zinc 49 mg/L, cuprin 35 mg/L, boron 70 mg/L, etc. [31].
Harvesting: it was carried out in July during the two years of testing with the Wintersteiger experimental combine (Figure 4).

2.5. Data Statistics and Analysis

The statistical processing of these data was carried out with the help of the analysis of variance (ANOVA) in order to highlight the production differences between the control variant and the variants that were fertilized with foliar fertilizer and bio-stimulator and at the same time to observe the influence of the factors and the interaction between them on the production of triticale.

3. Results

According to the analysis of the variant, in 2022, the greatest influence on the triticale yield was the experimental factor variety and the interaction between the experimental factor variety and the experimental factor fertilization. The rate of sowing and fertilization had an insignificant influence on the yield (Table 5). These results were recorded in climatic conditions of 2022 when there was a deficit of precipitation.
According to the analysis of the variant, in 2023, in optimal climatic conditions, with sufficient precipitation, the most influence on triticale yield was influenced by the experimental factors variety and fertilization, and by the interaction between the two. The experimental factor sowing rate and the interaction between and variety had a smaller influence on the yield (Table 6).

3.1. Influence of Factor A (Variety) on Production

From the point of view of the variety’s influence on production, the most productive variety was Utrifun in 2023, registering very significantly positive differences, having a production increase of 3410 kg/ha compared with the control (Negoiu). This was followed by the Zvelt variety also in 2023 registering significantly positive production differences compared with the control variety, ensuring a production increase of 1169 kg/ha. The lowest production was recorded by the Tulnic variety in 2022, with a distinctly significant negative difference (−642 kg/ha). No significant production differences were recorded in 2022 by Utrifun and Zvelt and by Tulnic in 2023 (Table 7).

3.2. Influence of Factor B (Fertilization) on Production

In 2022, due to the extreme climatic conditions, high temperatures, and lack of precipitation, foliar and biostimulator fertilization did not increase production, but on the contrary, the foliar and biostimulator fertilized variants recorded significantly negative differences in production (−169 kg /ha) in the foliar fertilized variants, and −212 kg/ha in the foliar fertilized variants and with biostimulator.
On the other hand, in 2023, when the average temperatures were close to normal and the precipitation level was above the multi-year amount, the foliar fertilized and biostimulated variants recorded increases in production. The foliar fertilized variants registered very significant positive differences compared with the variants fertilized only on the soil (884 kg/ha). The foliar and biostimulant fertilized variants registered very significant positive differences, ensuring a production increase of over 800 kg/ha (Table 8).

3.3. Influence of Factor C (Density) on Production

In northwest Romania, in the triticale cultivation technology, sowing is practiced at a density of 500 seeds/m2. In 2022 and 2023, the sowing density did not register significant production differences. Also, the control variant recorded the highest productions, with the exception of the variants sown at 450 seeds/m2, which in 2023 brought a production increase of 125 kg/ha. The biggest negative difference in production was in 2023 for the variants sown at 650 seeds/m2 (Table 9).

3.4. Influence of Factors A × B (Variety × Fertilization) on Production

In the case of the interaction between the variety and fertilization, the biggest production difference was obtained by the Utrifun variety fertilized on the ground, foliar, and with biosimulator, registering very significantly positive differences compared with the control, ensuring a production increase of 4137 kg/ha in 2023 Utrifun fertilized on the ground and with foliar had very significant positive differences, ensuring an increase of 4058 kg/ha in 2023. Utrifun, fertilized only on the ground, recorded significantly positive differences in production in 2023, ensuring a production increase of over 2000 kg /Ha. The Tulnic variety fertilized with the three fertilization schemes had distinctly significantly positive differences, ensuring a production increase of over 1500 kg/ha. The Zvelt variety in 2023 registered distinctly significantly positive differences, ensuring a production increase of over 1500 kg/ha when it was fertilized both on the soil and foliar. In the climatic conditions of 2022, Utrifun fertilized on the ground recorded significantly positive production differences, surpassing the control version by 836 kg/ha. The lowest production was obtained by the Tulnic variety fertilized only on the ground, foliar fertilized, and with biostimulator, registering a very significant negative difference in production (Table 10).

3.5. Influence of Factors A × C (Variety × Density) on Production

The highest productions were obtained by Utrifun in 2023 for all three sowing schemes, registering very significant positive differences compared with the control. It brought increases of over 3700 kg/ha sown at 550 seeds/m2, 3400 kg/ha at 650 seeds/m2, and over 3100 kg/ha sown at 450 seeds/m2. Distinctly significantly positive differences were recorded by Zvelt in 2023, sown at 550 seeds/m2 (+1488 kg/ha), and significantly positive differences sown at 450 seeds/m2 (+1231 kg/ha). Distinctly significantly negative differences were registered by Tulnic in 2022, sown at 650 seeds/m2 (−726 kg/ha), and significantly negative differences in production, sown at 550 seeds/m2, obtaining a lower production by 620 kg/ha, compared with the witness (Table 11).

3.6. Influence of Factors B × C (Fertilization × Density) on Production

In the case of the interaction between the experimental factors fertilization and sowing, the different climatic conditions in the two years of this study played an essential role so that in 2023 all the variants recorded positive production differences compared with the control variant. Very significantly positive production differences were obtained by the variants sown at 650 seeds/m2 and fertilized chemically, with foliar fertilizer and with biostimulator (+1071 kg/ha), the variants sown at 550 seeds/m2 and fertilized on the ground, with foliar fertilizer (+1026 kg/ha), the variants sown at 650 seeds/m2 and fertilized on the ground and foliar fertilizer (+940 kg/ha) and by the variants sown at 550 seeds/m2 and fertilized on the ground, with foliar fertilizer and biostimulator (+729 kg/ha). Distinctly significantly positive production differences were obtained in the variants that were sown at 450 seeds/m2 and had all three levels of fertilization (+714 kg/ha). The variants sown at 450 seeds/m2, fertilized on the ground, and with foliar fertilizer in 2023 registered distinctly significantly positive production differences (+687 kg/ha).
In 2022, due to the climatic conditions, the agreement to be sown did not favorably influence the increase in production. Distinctly significant negative differences in production were recorded for the variants sown at 650 seeds/m2 fertilized with chemical soil fertilizer, foliar fertilizer, and biostimulator (−586 kg/ha). Significantly negative production differences were recorded for the variants sown at 650 seeds/m2 fertilized on the ground and with foliar fertilizer, these having a lower production than the control by over 450 kg/ha (Table 12).

3.7. Influence of Factors A × B × C (Variety × Fertilization × Density) on Production

In the case of the interaction of the three experimental factors, the highest productions were obtained in 2023, the production differences being very significantly positive. These productions were obtained by the Utrifun variety at different sowing plots and fertilization schemes. The highest production was obtained when it was sown at 550 seeds/m2 and fertilized on the ground with foliar fertilizer, fertilized with biosimulator, 11,913 kg/ha, over 4500 kg/ha more than the control variant. Also, the production of the Utrifun variety decreases with the number of fertilizations. Utrifun sown at 650 seeds/m2 and fertilized on the ground and with foliar fertilizer obtained 11,343 kg/ha, ensuring a production increase of 4378 kg/ha. Utrifun sown at 550 seeds/m2, fertilized on the ground, and with foliar fertilizer recorded productions of 11,400 kg/ha. The high plot to be sown at Utrifun did not bring production increases. The variants sown at a plot of 650 seeds/m2 and fertilized on the ground with foliar fertilizer and biostimulator achieved a production increase compared with the control of over 3900 kg/ha. Utrifun sown at 450 seeds/m2 and fertilized with chemical fertilizer on the ground, foliar fertilized and with biostimulator recorded an increase in production compared with the control of over 3800 kg/ha. At a plot of 450 seeds/m2, only fertilized on the ground and with foliar fertilizer, managed to obtain a production of over 10,900 kg/ha, the difference in production compared with the control being very significantly positive.
Distinctly significantly positive production differences were registered in 2023 by the Utrifun, Zvelt, and Tulnic varieties, the productions being over 8800 kg/ha. The Utrifun variety sown at 550 seeds/m2 and fertilized on the ground obtained a production of 9718 kg/ha, having an increase of over 2200 kg/ha compared with the control, and sown at 450 seeds/m2, managed to register a production of 9645 kg/ha. The increase in the number of plants per square meter has a negative influence on production in the case of Utrifun; thus, sown at 650 seeds/m2 and fertilized on the ground, it recorded a production of 9409 kg/ha. Slender sown at 450 seeds/m2 and fertilized on the ground recorded production of over 9500 kg/ha, and at 550 seeds/m2, it recorded only 9188 kg/ha, the increase in the number of plants per square meter negatively influencing production, but the interaction between Zvelt sown at 550 seeds/m2, fertilized on the ground, with foliar fertilizer recorded production of 9206 kg/ha, 2119 kg/ha higher than the control. The lowest production that presented distinctly significantly positive production differences was of the Tulnic variety, which was sown at 550 seeds/m2 and received two fertilization options (+1719 kg/ha).
In 2022, significantly positive production differences were registered by Utrifun sown at 450 seeds/m2 and fertilized on the ground (+1048 kg/ha) and sown at 550 seeds/m2 (+902 kg/ha); thus, the increase in sowing thickness at Utrifun negatively influences production capacity. In 2023, the varieties Zvelt and Tulnic recorded significantly positive differences in production; thus, Zvelt sown at 450 seeds/m2, fertilized on the ground and with foliar fertilizer, obtained over 1260 kg/ha more than the control variant, and Tulnic fertilized and sown in the same way as Zvelt obtained an increase of 1332 kg/ha compared with the control variant. Zvelt was sown at 650 seeds/m2 and fertilized on the ground, and with foliar fertilizer, obtained 8235 kg/ha, with more than 1200 kg/ha compared with the control. In addition, Tulnic sown at 650 seeds/m2, fertilized on the ground, and with foliar fertilizer recorded production of over 8600 kg/ha, 1683 kg/ha more than the control.
In the two years of the experimental study, statistically ensured negative production differences were recorded by the Tulnic variety. In 2022, sown at 650 seeds/m2 and fertilized on the soil with foliar fertilizer and biostimulator recorded very significant negative differences in production, obtaining 6689 kg/ha and a negative difference in the production of 1571 kg/ha. Distinctly significant negative differences were recorded when it was sown at 550 seeds/m2 (−1440 kg/ha) and at 450 seeds/m2 (−1140 kg/ha), and when it received all three levels of fertilization, thus can deduce that in 2022 the production of Tulnic decreased once with the increase in the sowing area. In 2023, it registered significantly negative production differences, the biggest difference being when it was sown at 650 seeds/m2 and only chemically fertilized (−1621 kg/ha). Sown at 550 seeds/m2 and fertilized on the ground, it obtained 6009 kg/ha, 1467 kg/ha less than the control. Tulnic sown at 650 seeds/m2 fertilized on the ground and with foliar fertilizer obtained 7345 kg/ha and a negative difference in production of 1039 kg/ha, the difference being significantly negative (Table 13).

4. Discussion

This study was carried out on a typical preluvosl, and its type of fertilization is very important to ensure a high yield of triticale. Based on the results obtained from the long-term experience at the Livada Agricultural Development Research Station, it was found that the best fertilization scheme is the one applied in this study. 150 kg of commercial complex fertilizer substance of type 18:46:0 NPK was applied in the fall to prepare the soil for sowing. The typical preluvosol is sufficiently supplied with potassium but poorly supplied with phosphorus, and ensuring a quantity of 70 kg (a.s.) of the active substance phosphorus is essential for obtaining a high yield. Studies were carried out at SCDA Livada through which 90 kg of the active substance phosphorus was applied, but the results obtained concluded that this amount was too high and did not lead to a significant increase in yield; thus, 150 kg/ha being the amount of complex fertilizer that is applied to autumn crops in the northwest area of Romania. In the spring, it is additionally fertilized with calcium ammonium nitrate 27% nitrogen-active substance. The amount of fertilizer is 400 kg/ha, but in this study, it was fertilized with 300 kg/ha because triticale was grown after fodder peas, which is a nitrogen-fixing legume. Calcium ammonium nitrate, by its composition, has a role in addition to acting as a fertilizer as an amendment neutralizing the acid reaction of the soil through the calcium content of the soil, this fertilization scheme being the one applied in the northwest of Romania to the autumn agricultural crops. This study was carried out to improve the fertilization scheme by applying some foliar fertilizers and to evaluate their impact on the yield increase. A foliar fertilizer of the type NPK 10:10:10 plus microelements was used; the amount used was 3 l/ha, and the Cropmax biostimulator, which is also a product used in ecological agriculture, contains the main macro and micro-elements that have plants need, multi-vitamins, vegetable enzymes, organic amino acids, growth stimulants such as gibberellins, auxins, cytokinins, this product influences the root system and ripening fruits. It is known that additional fertilization with foliar fertilizers brings increases in production this being the purpose of this study to highlight whether foliar fertilization ensures an increase in yield. The doses used were those recommended by the manufacturer. As can be seen, additional fertilization with the product Solar 10:10:10 plus microelements ensures increased production.
Obtaining high yields is due to their cultivation technology. In addition to choosing the most productive varieties, it is necessary to ensure the plants’ nutrient requirements during the growing season and establish the optimal sowing density so that the triticale plants have enough space for development. In this case, studies were carried out at the global level regarding the growth of the stock through interventions in the cultivation scheme. Triticale responds very well to fertilization, especially nitrogen fertilization. The yield of these is given by the dose of fertilizer and environmental factors. Mainly the protein content is given by the amount of nitrogen that is available to the plants, where it is possible to intervene with foliar fertilizer to supplement the necessary nutrients needed by the plants. The accumulation of most amino acids in grains depends on fertilization, most being accumulated at a quantity of 120 kg/ha of nitrogen. Fertilization is the factor that most influences production growth, and foliar fertilization can stimulate production growth [32].
In Estonia, a study was carried out on the influence of nitrogen fertilization in different vegetation phenophases on grain yield and quality, and it was found that nitrogen fertilization in the development stage of EC47 plants led to a reduction in plant fall and an increase in protein content [33].
And the area where the triticale is located has an important influence in terms of production. In Poland, this was demonstrated through a study that consisted of the testing of 11 triticale cultivations that were evaluated in 58 localities in which two culture managements were used, moderate and conventional and high management [34]. Thanks to the genetic progress of the last decades, spring triticale was also created, which were tested together with 55 genotypes of winter triticale in Poland; it was found that the spring forms sown earlier, having a longer vegetation period and on more fertile soils they can ensure productions of 8000 kg/ha [35].
In a study from Bulgaria regarding the application of foliar fertilizers to the triticale crop, an increase in yield was found, but this increase was not statistically significant, so it was concluded that foliar fertilization could not replace mineral fertilization or be used alone [36]. Studies were carried out in which the fertilization took place with green organic fertilizer (Lumbricus rubellus) and in which the plant preceding the triticale crop was also taken into account. The highest yield was in the case of fertilization with 1750 kg/ka Lumbrical, having durum wheat as the precursor plant [37]. In a study from Turkey, it was found that zinc-based foliar fertilizers were effective, especially in drought conditions, and that the application of foliar fertilizers had a positive effect on the yield, the number of grains/ear, and the weight of 1000 grains [38].
In Romania, two genotypes were tested, including the preceding plant, different soil works, and several doses and times of application, the yield being influenced by all these factors, responding favorably, especially to a limitation of soil preparation [39]. In addition, in Romania, studies were carried out on the impact of fertilization and weed control with the help of herbicides in the Lapus depression, in the northwest of the country, where productions of over 7400 kg/ha up to 9000 kg/ha were obtained [40].
Moreover, the sowing rate is an essential technological factor in increasing yield and decreasing sowing expenses. In a study in Poland from the beginning of 2000, several batches of triticale were established that were sown at different densities, and it was found that at the density of 200 grains/m2, the plants recorded an optimal number of shoots and leaves recording the highest yield [41]. In Turkey, the optimal density that was established following a study was 550 grains/m2 and a nitrogen dose of 12 kg/day [42]. In Mediterranean countries, the optimal sowing density is between 100 and 300 plants/m2, and the sowing season should be as early as possible [43]. These studies are necessary to improve the triticale culture technology and to obtain the highest possible yield. However, in addition to obtaining high production, it is also necessary to store it. For this, modern seed storage warehouses are needed; they are a project that aims to implement systems for monitoring humidity, temperature, air pressure, and movement in the warehouses; all this information is processed in an internet database [44].

5. Conclusions

The current study was carried out over a period of 2 years in NorthWest Romania on a typical preluvosol with an acid pH. Following this study, we can note that the climatic factors are the ones that influence the production capacity the most, especially the lack of precipitation. In a year with a moisture deficit, the application of foliar fertilizers and the biostimulator does not increase production. But in a favorable year, foliar fertilization and the biostimulator bring significant increases in production. The Utrifun variety reacted best to the fertilization factor, ensuring increases of over 4500 kg/ha sown at 550 seeds/m2, this being the most productive variety. If the fertilization scheme was reduced and the rate of sowing increased, it obtained an increase of over 4000 kg/ha. It was followed by Zvelt and Tulnic in the year with more precipitation. In 2022, in the absence of precipitation, the least productive was Tulnic, which was sown at 650 seeds/m2 fertilized chemically, foliarly, and with biostimulators obtained only 6689 kg/ha. The following studies will aim to confirm that climatic conditions have a direct influence on the production capacity of triticale varieties, also monitoring the extent to which seeding rate and foliar fertilization can improve the production potential of triticale.

Author Contributions

Conceptualization, Resources, Data Collection and Writing—original draft B.E.A.; Methodology A.F.; Validation, A.F., V.A.H. and M.M.D.; Software, P.B.A.; Formal analysis, P.B.A. and V.A.H.; Visualization, Supervision, I.R.; Validation, Writing—review and editing, Supervision M.M.D. All authors have read and agreed to the published version of the manuscript.

Funding

This research received no external funding.

Institutional Review Board Statement

Not applicable.

Informed Consent Statement

Not applicable.

Data Availability Statement

All data are included within the article.

Acknowledgments

The authors express gratitude to the University of Agricultural Sciences and Veterinary Medicine, Cluj-Napoca, Romania, and the Agricultural Research Development Station, Livada, Romania, for supporting the publication of this article.

Conflicts of Interest

The authors declare no conflicts of interest related to this article.

References

  1. Fraś, A.; Gołębiewska, K.; Gołębiewski, D.; Wiśniewska, M.; Gzowska, M.; Mańkowski, D.R. Utilisation of triticale (X Triticosecale Wittmack) and residual oat flour in breadmaking. Czech J. Food Sci. 2021, 39, 226–233. [Google Scholar] [CrossRef]
  2. Fraś, A.; Gołębiewska, K.; Gołębiewski, D.; Mańkowski, D.R.; Boros, D.; Szecówka, P. Variability in the chemical composition of triticale grain, flour and bread. J. Cereal Sci. 2016, 71, 66–72. [Google Scholar] [CrossRef]
  3. Hulse, J.H.; Spurgeon, D. Triticale. Sci. Am. 1974, 231, 72–81. [Google Scholar] [CrossRef]
  4. Heger, J.; Eggum, B.O. The nutritional values of some high-yielding cultivars of triticale. J. Cereal Sci. 1991, 14, 63–71. [Google Scholar] [CrossRef]
  5. Sehgal, K.L.; Bajaj, S.; Sekhon, K.S. Studies on the composition, quality and processing of triticale Part I. Physico-chemical characteristics. Mol. Nutr. Food Res. 1983, 27, 31–37. [Google Scholar] [CrossRef]
  6. Peña, R.J. Food Uses of Triticale, Triticale Improvement and Production; FAO Plant Production and Protection Paper 179; FAO: Rome, Italy, 2004; pp. 37–48. ISBN 92-5-105182-8. [Google Scholar]
  7. Martinek, P.; Vinterová, M.; Burešová, I.; Vyhnánek, T. Agronomic and quality characteristics of triticale (X Triticosecale Wittmack) with HMW glutenin subunits 5+10. J. Cereal Sci. 2008, 47, 68–78. [Google Scholar] [CrossRef]
  8. Glamočlija, N.; Starčević, M.; Ćirić, J.; Šefer, D.; Glišić, M.; Baltić, M.Z.; Marković, R.; Spasić, M.; Glamočlija, D. The importance of triticale in animal nutrition. Vet. J. Repub. Srp. 2018, 18, 73–94. [Google Scholar] [CrossRef]
  9. Baron, V.S.; Juskiw, P.E.; Aljarrah, M. Triticale as a Forage. In Triticale; Springer Nature: Berlin/Heidelberg, Germany, 2015; pp. 189–212. [Google Scholar]
  10. Mupondwa, E.; Li, X.; Tabil, L. Integrated bioethanol production from triticale grain and lignocellulosic straw in Western Canada. Ind. Crops Prod. 2018, 117, 75–87. [Google Scholar] [CrossRef]
  11. Nakurte, I.; Klavins, K.; Kirhnere, I.; Namniece, J.; Adlere, L.; Matvejevs, J.; Kronberga, A.; Kokare, A.; Strazdina, V.; Legzdina, L.; et al. Discovery of lunasin peptide in triticale (X Triticosecale Wittmack). J. Cereal Sci. 2012, 56, 510–514. [Google Scholar] [CrossRef]
  12. Jańczak-Pieniążek, M.; Horvat, D.; Viljevac Vuletić, M.; Kovačević Babić, M.; Buczek, J.; Szpunar-Krok, E. Antioxidant Potential and Phenolic Acid Profiles in Triticale Grain under Integrated and Conventional Cropping Systems. Agriculture 2023, 13, 1078. [Google Scholar] [CrossRef]
  13. Galoburda, R.; Straumite, E.; Sabovics, M.; Kruma, Z. Dynamics of Volatile Compounds in Triticale Bread with Sourdough: From Flour to Bread. Foods 2020, 9, 1837. [Google Scholar] [CrossRef]
  14. Ambriz-Vidal, T.N.; Mariezcurrena-Berasain, M.D.; Heredia-Olea, E.; Martinez DL, P.; Gutierrez-Ibañez, A.T. Potential of Triticale (X Triticosecale Wittmack) Malts for Beer Wort Production. J. Am. Soc. Brew. Chem. 2019, 77, 282–286. [Google Scholar] [CrossRef]
  15. Biel, W.; Kazimierska, K.; Bashutska, U. Nutritional value of wheat, triticale, barley and oat grains. Acta Sci. Pol. Zootech. 2020, 19, 19–28. [Google Scholar] [CrossRef]
  16. Cionca, I.; Lupuț, I.; Rusu, T. Triticale review: Navigating past achievements, current realities and future horizons in agricultural innovation. Agricultura 2024, 129–130, 28–35. [Google Scholar]
  17. Salvucci, E.; Rossi, M.; Colombo, A.; Pérez, G.; Borneo, R.; Aguirre, A. Triticale flour films added with bacteriocin-like substance (BLIS) for active food packaging applications. Food Packag. Shelf Life 2019, 19, 193–199. [Google Scholar] [CrossRef]
  18. Bates, I.; Plazonić, I.; Seleš, V.R.; Barbarić-Mikočević, Ž. Determining the quality of paper substrates containing triticale pulp for printing industry. Nord. Pulp Pap. Res. J. 2020, 35, 272–278. [Google Scholar] [CrossRef]
  19. Tarrés, Q.; Ehman, N.V.; Vallejos, M.E.; Area, M.C.; Delgado-Aguilar, M.; Mutjé, P. Lignocellulosic nanofibers from triticale straw: The influence of hemicelluloses and lignin in their production and properties. Carbohydr. Polym. 2017, 163, 20–27. [Google Scholar] [CrossRef]
  20. Dawood, M.A.O.; Amer, A.A.; Elbialy, Z.I.; Gouda, A.H. Effects of including triticale on growth performance, digestive enzyme activity, and growthrelated genes of Nile tilapia (Oreochromis niloticus). Aquaculture 2020, 528, 735568. [Google Scholar] [CrossRef]
  21. Marković, G.; Ćirković, M.; Lujić, J.; Pantović, J. Comparison of the Nutritive Value of Wheat and Triticale in Fish Diet. In Proceedings of the VI International Conference “Water & Fish” Faculty of Agriculture, Belgrade-Zemun, Serbia, 12–14 June 2013; pp. 233–237. [Google Scholar]
  22. Hughes, S.G. Use of triticale as a replacement for wheat middlings in diets for Atlantic salmon. Aquaculture 1990, 90, 173–178. [Google Scholar] [CrossRef]
  23. Food and Agriculture Organization of the United Nations. Crops and Livestock Products. Available online: https://www.fao.org/faostat/en/#data/QCL (accessed on 11 August 2024).
  24. National Agricultural Research and Development Institute Fundulea. Available online: https://www.incda-fundulea.ro/index_en.html (accessed on 11 August 2024).
  25. Ministry of Agricuture and Rural Development, State Institute for Testing and Registration of Varieties, SITRV Catalog. Available online: https://istis.ro/catalog-oficial/ (accessed on 11 August 2024).
  26. Agromax Grains. Products. Fertilizers. DAP 18-46-0. Available online: https://www.agromaxgrains.ro/produse/ingrasaminte/dap-18-46-0 (accessed on 21 August 2024).
  27. eDepo Construct. Online Store for Construction Materials and Chemical Fertilizers. Nitrolimestone 50 kg. Available online: https://edepo-construct.ro/produs/nitrocalcar-50kg (accessed on 21 August 2024).
  28. Agro Bayer Romania. Products. Crop Protection. Herbicides. Sekator Progress OD. Available online: https://www.cropscience.bayer.ro/cpd/erbicide-bcs-sekator-progress-od-ro-ro (accessed on 21 August 2024).
  29. Agro Bayer Romania. Products. Crop Protection. Fungicides. Natico Pro 325 SC. Available online: https://www.cropscience.bayer.ro/cpd/fungicide-bcs-nativo-pro-325-sc-ro-ro (accessed on 21 August 2024).
  30. Plant Master. The Master of Your Culture. Products. Fertilizers. Solar 10-10-10 + ME (3 l). Available online: https://www.plantmaster.ro/ingrasamant-solar-10-10-10me-3l/?srsltid=AfmBOoqT8kJzbwnoReVj46VlQxkmHZ3-NEzyGOxBKmdSnGAyHLqHPbqlzaI (accessed on 21 August 2024).
  31. Pesticide.ro. Products. Liquid Fertilizers. Cropmax Biostimulator. Available online: https://www.pesticid.ro/biostimulator-cropmax?srsltid=AfmBOoqoGDYFGGcL06iSSmtnPB0YoNBxeZxDQ_uAqoP5yVg7ZFnyp8Bf (accessed on 21 August 2024).
  32. Dobreva, S. Triticale—Past and future. Agric. Sci. Technol. 2016, 8, 271–275. [Google Scholar] [CrossRef]
  33. Alaru, M.; Mǿller, B.; Hansen, Ă. Triticale yield formation and quality influenced by different N fertilisation regimes. Agron. Res. 2004, 2, 3–12. [Google Scholar]
  34. Derejko, A.; Studnicki, M. Effect of cultivar, crop management, location and growing season on the grain yield of triticale. Biom. Lett. 2019, 56, 239–252. [Google Scholar] [CrossRef]
  35. Wójcik-Gront, E.; Studnicki, M. Long-Term Yield Variability of Triticale (× Triticosecale Wittmack) Tested Using a CART Model. Agriculture 2021, 11, 92. [Google Scholar] [CrossRef]
  36. Dobreva, S.; Kirchev, H.; Muhova, A. Grain yield of triticale varieties depending on the foliar fertilization in the conditions of increasing norms of fertilization of the soil with nitrogen. Res. J. Agric. Sci. 2018, 50, 122–126. [Google Scholar]
  37. Muhova, A.; Kirchev, H. Agronomic performance of triticale varieties (x Triticosecale Wittm.) grown under fertilization with organic manure from red Californian Worms. Sci. Pap. Ser. A Agron. 2020, 63, 428–436. [Google Scholar]
  38. Kinaci, E.; Gulmezoglu, N. Grain yield and yield components of triticale upon application of different foliar fertilizers. Interciencia 2007, 32, 624–628. [Google Scholar]
  39. Dumbravă, M.; Ion, V.; Epure, L.I.; Bășa, A.G.; Ion, N.; Dușa, E.M. Grain Yield and Yield Components at Triticale under Different Technological Conditions. Agric. Agric. Sci. Procedia 2016, 10, 94–103. [Google Scholar] [CrossRef]
  40. Cionca, I.; Lupuț, I.; Rusu, T. Exploring the pretability potential of triticale cultivation in the Lăpuș depression, Romania: A scientific analysis. Agricultura 2024, 129–130, 190–198. [Google Scholar]
  41. Jaśkiewicz, B. The influence of sowing density and nitrogen application method on yielding and morphological characters of winter triticale cv. Woltario. Biul. Inst. Hod. I Aklim. Roślin 2009, 252, 169–177. [Google Scholar]
  42. Saglam, N.; Ustunalp, G. Efectul diferitelor densități de semănat și al dozelor de azot asupra randamentului și componentelor randamentului în Triticale (X Triticosecale Wittmack). APCBEE Procedia 2014, 8, 354–358. [Google Scholar] [CrossRef]
  43. Bassu, S.; Asseng, S.; Giunta, F.; Motzo, R. Optimizing triticale sowing densities across the Mediterranean Basin. Filed Crops Res. 2013, 144, 167–178. [Google Scholar] [CrossRef]
  44. Mesaros, D.; Duda, M.; Moldovan, C.; Muntean, S. Internet of things applied in grin reception base. Sci. Bull. Electr. Eng. Fac. 2022, 22, 2. [Google Scholar]
Figure 1. The location of the Research Station and the experimental plots.
Agriculture 14 02155 g001
Figure 2. Layout of the experience.
Agriculture 14 02155 g002
Figure 3. Sowing experiences with the Wintersteiger seeder.
Agriculture 14 02155 g003
Figure 4. Harvesting experiences with the Wintersteiger combine.
Agriculture 14 02155 g004
Table 1. Cultivated areas and production of triticale worldwide in 2022 (FAO, 2022).
Crt. No.The RegionArea (ha)Total Production (t)Yield (kg/ha)
1Mondial 3,616,65514,157,8803914
2Europa3,152,09413,008,7414127
3Asia300,155707,688,632357
4Oceania 61,900117,2001893
5Americas92,183300,6903261
6Africa10,32323,5602282
ha—hectares; t—tons.
Table 2. Largest growers of triticale (Triticosecale Wittmatck), 2022 (FAO, 2022).
Crt. No.CountryArea (ha)Total Production (t)Yield (kg/ha)
1Poland1,232,7105,440,2704413
2Belarus406,0001,192,8802938
3France339,7001,613,7304750
4Germany 324,4001,929,7005948
5Spain280,350634,8902264
6China199,671386,0711933
7Russian Federation108,810306,8742820
8Turkiye99,930320,0003211
9Lithuania63,100204,5603241
10Australia61,900117,2001893
11Romania 56,900192,4103376
12Hungary55,340186,4803369
13Austria51,500292,8705686
14Czechia40,570207,6205117
ha—hectares; t—tons.
Table 3. Soil characteristics from the experimental field in Livada.
UM
cm
cm
Ap
0–18
0.15
Ao
18–40
AB
40–55
40–55
Bt1w
55–70
55–70
Bt2w
70–110
80–95
20–3030–40
Humus (C × 1.72)%2.821.440.900.900.843.24
N total%0.1680.1020.0720.0680.064-
C:N-8.219.1510.1410.3410.57-
pH in water-5.196.246.656.535.625.28
Clay (<0.002 mm)%g/g20.921.123.127.032.433.1
Apparent densityg/cm31.351.541.491.48-1.48
Hydraulic Conductivitymm/h31.275.873.110.35-1.04
UM—unit of measure; Ap, Ao, AB, Bt1w, Bt2w—soil horizon; C:N—carbon-nitrogen ratio, N total—nitrogen total.
Table 4. Monthly and mean temperature and monthly and the amount of rainfall during the two cropping seasons (2021/2022 and 2022/2023).
YearClimatic FactorMonthMean Temp. (°C)The Amount (mm)
Oct.Nov.Dec.Jan.Feb.Mar.Apr.MayJun.
2021/
2022
Temp. (°C)9.05.31.1−1.82.84.48.916.322.17.6
Multi-year average9.84.80.1−2.10.14.710.515.819.07.0
Difference ±−0.80.51.00.32.7−0.3−1.60.53.10.6
Rainfall (mm)13.565.4119.376.646.11.386.917.910.3 437.3
Multi-year sum54.655.861.049.043.945.750.576.491.1 528.0
Difference ±−41.09.658.327.62.2−44.036.4−59.0−81.0 −90.7
2022
/2023
Temp. (°C)11.86.23.14.81.56.49.616.319.78.8
Multi-year average9.84.80.1−2.00.14.710.515.819.07.0
Difference ±21.436.81.41.7−0.90.50.71.8
Rainfall (mm)29.278.8111.369.166.045.873.319.770.2 563.4
Multi-year sum54.256.261.849.344.245.750.975.590.8 528.6
Difference ±−2522.649.519.821.80.122.4−55.8−20.6 34.8
Table 5. Analysis of the variant 2021/2022.
VariantSymbolSum of SquareDegrees of FreedomMean SquareSample FTheoretical FSignificance
VarietyA7,514,889.0032,504,963.007.6624.76; 9.78X
FertilizationB1,860,164.002930,082.102.5863.63; 6.23-
DensityC56,385.16228,192.580.2283.18-
Variety × FertilizationAB8,582,245.0061,430,374.003.9772.74; 4.20;X
Variety × DensityAC1,050,622.006175,103.601.4192.29-
Fertilization × DensityBC844,106.004211,026.501.7102.56-
Variety × Density × FertilizationABC1,823,710.0012151,975.801.2321.95-
Variety errorA error2,002,939.006333,823.20---
Density errorB error4,490,939.0016280,683.70---
Fertilization errorC error5,962,956.0048124,228.20---
Total-42,327,090.00107 ---
Table 6. Analysis of the variant 2022/2023.
VariantSymbolSum of SquareDegrees of FreedomMean SquareSample FTheoretical FSignificance
VarietyA189,024,500.00363,008,160.0032.6974.76; 9.78; 23.70XXX
FertilizationB17,857,010.0028,928,506.0031.4083.63; 6.23; 10.97XXX
DensityC1,436,056.002718,028.203.7293.18; X
Variety × FertilizationAB49,507,840.0068,251,308.0029.0262.74; 4.20; 6.80XXX
Variety × DensityAC2,787,522.006464,586.902.4122.29X
Fertilization × DensityBC972,472.404243,118.101.2632.56-
Variety × Density × FertilizationABC1,143,120.001295,259.980.4951.95-
Variety errorA error11,562,260.0061,927,044.00---
Density errorB error4,548,401.0016284,275.10---
Fertilization errorC error9,241,658.0048192,534.50---
Total-293,316,300.00107----
Table 7. The influence of the variety on triticale production, 2022–2023.
YearVariantSymbolProduction (kg/ha)%The DifferenceSignificance
2022NegoiuA1 (Ck)8202.07100.00.00Ck
2023NegoiuA1 (Ck)7434.41100.00.00Ck
2022UtrifunA28385.30102.2184.22Ns
2023UtrifunA210,845.07145.93410.67***
2022ZveltA38130.8999.1−71.19Ns
2023ZveltA38604.00115.71169.59*
2022TulnicA47559.9392.2−642.1500
2023TulnicA47810.37105.1375.96Ns
2022: LSD (p 5%) 385.26 kg/ha; LSD (p 1%) 583.40 kg/ha; LSD (p 0.1%) 937.21 kg/ha. 2023: LSD (p 5%) 925.65 kg/ha; LSD (p 1%) 1401.69 kg/ha; LSD (p 0.1%) 2251.78 kg/ha. Ck—control, Ns—non-significant, *—significantly positive, ***—very significantly positive, 00—distinctly significantly negative Lsd—Least Significant Difference.
Table 8. The influence of fertilization on triticale production, 2022–2023.
YearVariantSymbolProduction (kg/ha)%The DifferenceSignificance
2022Chemical fertilizationB1 (Ck)8197.42100.00.00Ck
2023Chemical fertilizationB1 (Ck)8099.03100.00.00Ck
2022Chemical fertilization + foliar fertilizationB28027.4497.9−169.970
2023Chemical fertilization + foliar fertilizationB28983.75110.9884.72***
2022Chemical fertilization + foliar fertilization + biostimulatorB37984.5397.4−212.890
2023Chemical fertilization + foliar fertilization + biostimulatorB38937.61110.4838.58***
2022: LSD (p 5%) 166.98 kg/ha; LSD (p 1%) 222.98 kg/ha; LSD (p 0.1%) 290.93 kg/ha. 2023: LSD (p 5%) 266.42 kg/ha; LSD (p 1%) 366.96 kg/ha; LSD (p 0.1%) 505.20 kg/ha. Ck—control, 0–-significantly negative, ***—very significantly positive, Lsd—Least Significant Difference.
Table 9. The influence of sowing rate on triticale production, 2022–2023.
YearVariant
(Seeds/m2)
SymbolProduction (kg/ha)%The DifferenceSignificance
2022550C2 (Ck)8128.22100.00.00Ck
2023550C2 (Ck)8683.53100.00.00Ck
2022450C18071.4299.3−56.81Ns
2023450C18809.39101.4125.86Ns
2022650C38009.7595,5−118.47Ns
2023650C38527.4798.2−156.05Ns
2022: LSD (p 5%) 264.73 kg/ha; LSD (p 1%) 364.63 kg/ha; LSD (p 0.1%) 501.99 kg/ha. 2023: LSD (p 5%) 207.88 kg/ha; LSD (p 1%) 277.59 kg/ha; LSD (p 0.1%) 362.19 kg/ha. Ck—control, Ns—non-significant, Lsd—Least Significant Difference.
Table 10. The influence of variety and fertilization on triticale production, 2022–2023.
YearVariantSymbolProduction (kg/ha)%The DifferenceSignificance
2022Negoiu × Chemical fertilizationA1 × B17943.00100.00.00Ck
2023Negoiu × Chemical fertilizationA1 × B17555.11100.00.00Ck
2022Utrifun × Chemical fertilizationA2 × B18779.44110.5836.44*
2023Utrifun × Chemical fertilizationA2 × B19590.89126.92035.78**
2022Zvelt × Chemical fertilizationA3 × B18156.44102.7213.44Ns
2023Zvelt × Chemical fertilizationA3 × B19114.44120.61559.33**
2022Tulnic × Chemical fertilizationA4 × B18244.11103.8301.11Ns
2023Tulnic × Chemical fertilizationA4 × B16135.6781.2−1419.450
2022Negoiu × Chemical fertilization + foliar fertilizationA1 × B28244.67100.000.00Ck
2023Negoiu × Chemical fertilization + foliar fertilizationA1 × B27186.44100.00.00Ck
2022Utrifun × Chemical fertilization + foliar fertilizationA2 × B27997.2297.0−247.44Ns
2023Utrifun × Chemical fertilization + foliar fertilizationA2 × B211,244.78156.54058.33***
2022Zvelt × Chemical fertilization + foliar fertilizationA3 × B28136.0098.7−108.67Ns
2023Zvelt × Chemical fertilization + foliar fertilizationA3 × B28739.11121.61552.67**
2022Tulnic × Chemical fertilization + foliar fertilizationA4 × B27728.8993.7−515.78Ns
2023Tulnic × Chemical fertilization + foliar fertilizationA4 × B28764.67122.01578.22**
2022Negoiu × Chemical fertilization + foliar fertilization + biostimulatorA1 × B38418.56100.00.00Ck
2023Negoiu × Chemical fertilization + foliar fertilization + biostimulatorA1 × B37561.67100.00.00Ck
2022Utrifun × Chemical fertilization + foliar fertilization + biostimulatorA2 × B38379.2299.5−39.33Ns
2023Utrifun × Chemical fertilization + foliar fertilization + biostimulatorA2 × B311,699.56154.74137.89***
2022Zvelt × Chemical fertilization + foliar fertilization + biostimulatorA3 × B38100.2296.2−318.33Ns
2023Zvelt × Chemical fertilization + foliar fertilization + biostimulatorA3 × B37958.44105.2396.78Ns
2022Tulnic × Chemical fertilization + foliar fertilization + biostimulatorA4 × B37034.5683.6−1384.00000
2023Tulnic × Chemical fertilization + foliar fertilization + biostimulatorA4 × B38530.78112.8969.11Ns
2022: LSD (p 5%) 618.89 kg/ha; LSD (p 1%) 881.62 kg/ha; LSD (p 0.1%) 1287.89 kg/ha. 2023: LSD (p 5%) 1021.06 kg/ha; LSD (p 1%) 1517.74 kg/ha; LSD (p 0.1%) 2372.49 kg/ha. Ck—control, Ns—non-significant, *—significantly positive, **—distinctly significantly positive ***—very significantly positive, 0—significantly negative, 000—very significantly negative, Lsd—Least Significant Difference.
Table 11. The influence of the variety and the sowing rate on triticale production, 2022–2023.
YearVariantSymbolProduction (kg/ha)%The DifferenceSignificance
2022Negoiu × 450 seeds/m2A1 × C18095.89100.00.00Ck
2023Negoiu × 450 seeds/m2A1 × C17624.89100.00.00Ck
2022Utrifun × 450 seeds/m2A2 × C18385.67103.6289.78Ns
2023Utrifun × 450 seeds/m2A2 × C110,728.56140.73103.67***
2022Zvelt × 450 seeds/m2A3 × C17960.1198.3−135.78Ns
2023Zvelt × 450 seeds/m2A3 × C18856.44116.21231.56*
2022Tulnic × 450 seeds/m2A4 × C17844.0096.9−251.89Ns
2023Tulnic × 450 seeds/m2A4 × C18027.67105.3402.78Ns
2022Negoiu × 550 seeds/m2A1 × C28213.33100.00.00Ck
2023Negoiu × 550 seeds/m2A1 × C27300.22100.00.00Ck
2022Utrifun × 550 seeds/m2A2 × C28408.89102.4195.56Ns
2023Utrifun × 550 seeds/m2A2 × C211,010.44150.83710.22***
2022Zvelt × 550 seeds/m2A3 × C28292.56101.079.22Ns
2023Zvelt × 550 seeds/m2A3 × C28788.56120.41488.33**
2022Tulnic × 550 seeds/m2A4 × C27592.5692.4−620.780
2023Tulnic × 550 seeds/m2A4 × C27634.89104.6334.67Ns
2022Negoiu × 650 seeds/m2A1 × C38297.00100.00.00Ck
2023Negoiu × 650 seeds/m2A1 × C37378.11100.00.00Ck
2022Utrifun × 650 seeds/m2A2 × C38361.33100.864.33Ns
2023Utrifun × 650 seeds/m2A2 × C310,796.22146.33418.11***
2022Zvelt × 650 seeds/m2A3 × C38140.0098.1−157.00Ns
2023Zvelt × 650 seeds/m2A3 × C38167.00110.7788.89Ns
2022Tulnic × 650 seeds/m2A4 × C37571.0091.2−726.0000
2023Tulnic × 650 seeds/m2A4 × C37768.56105.3390.44Ns
2022: LSD (p 5%) 466.05 kg/ha; LSD (p 1%) 673.84 kg/ha; LSD (p 0.1%) 1010.69 kg/ha. 2023: LSD (p 5%) 983.59 kg/ha; LSD (p 1%) 1464.65 kg/ha; LSD (p 0.1%) 2297.10 kg/ha. Ck—control, Ns—non-significant, *—significantly positive, ** - distinctly significantly positive, ***—very significantly positive, 0—significantly negative, 00—distinctly significantly negative, Lsd—Least Significant Difference.
Table 12. The influence of the fertilization and the sowing thickness on triticale production, 2022–2023.
YearVariantSymbolProduction (kg/ha)%The DifferenceSignificance
2022Chemical fertilization × 450 seeds/m2B1 ×x C18176.42100.00.00Ck
2023Chemical fertilization × 450 seeds/m2B1 × C18342.08100.00.00Ck
2022Chemical fertilization + foliar fertilization × 450 seeds/m2B2 × C17983.5897.6−192.83Ns
2023Chemical fertilization + foliar fertilization × 450 seeds/m2B2 × C19029.17108.2687.08**
2022Chemical fertilization + foliar fertilization + biostimulator × 450 seeds/m2B3 × C18054.2598.5−122.17Ns
2023Chemical fertilization + foliar fertilization + biostimulator × 450 seeds/m2B3 × C19056.92108.6714.83**
2022 Chemical fertilization × 550 seeds/m2B1 × C28227.17100.00.00Ck
2023Chemical fertilization × 550 seeds/m2B1 × C28098.08100.00.00Ck
2022Chemical fertilization + foliar fertilization × 550 seeds/m2B2 × C28109.9298.6−117.25Ns
2023Chemical fertilization + foliar fertilization × 550 seeds/m2B2 × C29124.67112.71026.58***
2022Chemical fertilization + foliar fertilization + biostimulator × 550 seeds/m2B3 × C28043.4297.8−183.75Ns
2023Chemical fertilization + foliar fertilization + biostimulator × 550 seeds/m2B3 × C28827.83109.0729.75***
2022 Chemical fertilization × 650 seeds/m2B1 × C38438.67100.00.00Ck
2023Chemical fertilization × 650 seeds/m2B1 × C37859.92100.00.00Ck
2022Chemical fertilization + foliar fertilization × 650 seeds/m2B2 × C37986.5894.6−452.080
2023Chemical fertilization + foliar fertilization × 650 seeds/m2B2 × C38797.42112.0940.50***
2022Chemical fertilization + foliar fertilization + biostimulator × 650 seeds/m2B3 × C37851.7593.0−586.9200
2023Chemical fertilization + foliar fertilization + biostimulator × 650 seeds/m2B3 × C38928.08113.61071.17***
2022: LSD (p 5%) 380.91 kg/ha; LSD (p 1%) 518.34 kg/ha; LSD (p 0.1%) 699.19 kg/ha. 2023: LSD (p 5%) 396.61 kg/ha; LSD (p 1%) 536.90 kg/ha; LSD (p 0.1%) 717.74 Kg/ha. Ck—control, Ns—non-significant, **—distinctly significantly positive, ***—very significantly positive, 0—significantly negative, 00—distinctly significantly negative, Lsd—Least Significant Difference.
Table 13. The influence of variety, fertilization and the sowing rate on triticale production, 2022–2023.
YearVariantSymbolProduction (kg/ha)%The DifferenceSignificance
2022Negoiu × Chemical fertilization × 450 seeds/m2A1 × B1× C17746.33100.00.00Ck
2023Negoiu × Chemical fertilization × 450 seeds/m2A1 × B1 × C17693.33100.00.00Ck
2022Utrifun × Chemical fertilization × 450 seeds/m2A2 × B1 × C18794.33113.51048.00*
2023Utrifun × Chemical fertilization × 450 seeds/m2A2 × B1 × C19645.00125.41951.67**
2022Zvelt × Chemical fertilization × 450 seeds/m2A3 × B1 × C17980.33103.0234.00Ns
2023Zvelt × Chemical fertilization × 450 seeds/m2A3 × B1 × C19506.67123.61813.33**
2022Tulnic ×Chemical fertilization × 450 seeds/m2A4 × B1 × C18148.67105.7438.33Ns
2023Tulnic × Chemical fertilization × 450 seeds/m2A4 × B1 × C16523.3384.8−1170.00Ns
2022Negoiu × Chemical fertilization × 550 seeds/m2A1 × B1 × C27840.33100.00.00Ck
2023Negoiu × Chemical fertilization × 550 seeds/m2A1 × B1 × C27476.33100.00.00Ck
2022Utrifun × Chemical fertilization × 550 seeds/m2A2 × B1 × C28742.67111.5902.33*
2023Utrifun × Chemical fertilization × 550 seeds/m2A2 × B1 × C29718.00130.02241.67**
2022Zvelt × Chemical fertilization × 550 seeds/m2A3 × B1 × C28453.00107.8612.67Ns
2023Zvelt ×Chemical fertilization × 550 seeds/m2A3 × B1 × C29188.00122.91712.33**
2022Tulnic × Chemical fertilization × 550 seeds/m2A4 × B1 × C27872.67100.432.33Ns
2023Tulnic × Chemical fertilization × 550 seeds/m2A4 × B1 × C26009.3380.4−1467.000
2022Negoiu × Chemical fertilization × 650 seeds/m2A1 × B1 × C38242.33100.00.00Ck
2023Negoiu × Chemical fertilization × 650 seeds/m2A1 × B1 × C37495.67100.00.00Ck
2022Utrifun × Chemical fertilization × 650 seeds/m2A2 × B1 × C38801.33106.8559.00Ns
2023Utrifun × Chemical fertilization × 650 seeds/m2A2 × B1 × C39409.67125.51914.00**
2022Zvelt × Chemical fertilization × 650 seeds/m2A3 × B1 × C38036.0097.5−206.33Ns
2023Zvelt × Chemical fertilization × 650 seeds/m2A3 × B1 × C38648.00115.41152.33Ns
2022Tulnic × Chemical fertilization × 650 seeds/m2A4 × B1 × C38675.00105.2432.67Ns
2023Tulnic × Chemical fertilization × 650 seeds/m2A4 × B1 × C35874.3378.4−1621.330
2022Negoiu × Chemical fertilization + foliar fertilization × 450 seeds/m2A1 × B2 × C18044.67100.00.00Ck
2023Negoiu × Chemical fertilization + foliar fertilization × 450 seeds/m2A1 × B2 × C17508.33100.00.00Ck
2022Utrifun × Chemical fertilization + foliar fertilization × 450 seeds/m2A2 × B2 × C17951.6798.8−93.00Ns
2023Utrifun × Chemical fertilization + foliar fertilization × 450 seeds/m2A2 × B2 × C110,991.00146.43482.67***
2022Zvelt × Chemical fertilization + foliar fertilization × 450 seeds/m2A3 × B2 × C17947.3398.8−97.33Ns
2023Zvelt × Chemical fertilization + foliar fertilization × 450 seeds/m2A3 × B2 × C18776.33116.91268.0*
2022Tulnic × Chemical fertilization + foliar fertilization × 450 seeds/m2A4 × B2 × C17990.6799.3−54.00Ns
2023Tulnic × Chemical fertilization + foliar fertilization × 450 seeds/m2A4 × B2 × C18841.00117.11332.67*
2022Negoiu × Chemical fertilization + foliar fertilization × 550 seeds/m2A1 × B2 × C28301.33100.00.00Ck
2023Negoiu × Chemical fertilization + foliar fertilization × 550 seeds/m2A1 × B2 × C27086.67100.00.00Ck
2022Utrifun × Chemical fertilization + foliar fertilization × 550 seeds/m2A2 × B2 × C28080.3397.3−221.00Ns
2023Utrifun × Chemical fertilization + foliar fertilization × 550 seeds/m2A2 × B2 × C211,400.33160.94313.67***
2022Zvelt × Chemical fertilization + foliar fertilization × 550 seeds/m2A3 × B2 × C28211.0098.9−90.33Ns
2023Zvelt × Chemical fertilization + foliar fertilization × 550 seeds/m2A3 × B2 × C29206.00129.92119.33**
2022Tulnic × Chemical fertilization + foliar fertilization × 550 seeds/m2A4 × B2 × C27847.0094.5−454.33Ns
2023Tulnic × Chemical fertilization + foliar fertilization × 550 seeds/m2A4 × B2 × C28805.67124.31719.00**
2022Negoiu × Chemical fertilization + foliar fertilization × 650 seeds/m2A1 × B2 × C38388.00100.00.00Ck
2023Negoiu × Chemical fertilization + foliar fertilization × 650 seeds/m2A1 × B2 × C36967.33100.00.00Ck
2022Utrifun × Chemical fertilization + foliar fertilization × 650 seeds/m2A2 × B2 × C37959.6794.9−428.33Ns
2023Utrifun × Chemical fertilization + foliar fertilization × 650 seeds/m2A2 × B2 × C311,343.00162.94378.67***
2022Zvelt × Chemical fertilization + foliar fertilization × 650 seeds/m2A3 × B2 × C38249.6794.9−138.33Ns
2023Zvelt × Chemical fertilization + foliar fertilization × 650 seeds/m2A3 × B2 × C38235.00118.21270.67*
2022Tulnic × Chemical fertilization + foliar fertilization × 650 seeds/m2A4 × B2 × C37349.0087.6−1039.000
2023Tulnic × Chemical fertilization + foliar fertilization × 650 seeds/m2A4 × B2 × C38647.33124.21683.0*
2022Negoiu × Chemical fertilization + foliar fertilization + biostimulator × 450 seeds/m2A1 × B3 × C18496.67100.00.00Ck
2023Negoiu × Chemical fertilization + foliar fertilization + biostimulator × 450 seeds/m2A1 × B3 × C17673.0100.00.00Ck
2022Utrifun × Chemical fertilization + foliar fertilization + biostimulator × 450 seeds/m2A2 × B3 × C18411.0099.0−85.67Ns
2023Utrifun × Chemical fertilization + foliar fertilization + biostimulator × 450 seeds/m2A2 × B3 ×C111,549.67150.53876.67***
2022Zvelt × Chemical fertilization + foliar fertilization + biostimulator × 450 seeds/m2A3 × B3 × C17952.6793.6−544.00Ns
2023Zvelt × Chemical fertilization + foliar fertilization + biostimulator × 450 seeds/m2A3 × B3 ×C18286.33108.0613.33Ns
2022Tulnic × Chemical fertilization + foliar fertilization + biostimulator × 450 seeds/m2A4 × B3 × C17356.6786.6−1140.0000
2023Tulnic × Chemical fertilization + foliar fertilization + biostimulator × 450 seeds/m2A4 × B3 × C18718.67113.61045.67Ns
2022Negoiu × Chemical fertilization + foliar fertilization + biostimulator × 550 seeds/m2A1 × B3 × C28498.33100.00.00Ck
2023Negoiu × Chemical fertilization + foliar fertilization + biostimulator × 550 seeds/m2A1 × B3 × C27337.67100.00.00Ck
2022Utrifun × Chemical fertilization + foliar fertilization + biostimulator × 550 seeds/m2A2 × B3 × C28403.6798.9−94.67Ns
2023Utrifun × Chemical fertilization + foliar fertilization + biostimulator × 550 seeds/m2A2 × B3 × C211,913.00162.44575.33***
2022Zvelt × Chemical fertilization + foliar fertilization + biostimulator × 550 seeds/m2A3 × B3 × C28213.6796.7−284.67Ns
2023Zvelt × Chemical fertilization + foliar fertilization + biostimulator × 550 seeds/m2A3 × B3 × C27917.00108.6633.33Ns
2022Tulnic × Chemical fertilization + foliar fertilization + biostimulator × 550 seeds/m2A4 × B3 × C27058.0083.1−1440.3300
2023Tulnic × Chemical fertilization + foliar fertilization + biostimulator × 550 seeds/m2A4 × B3 × C28089.67110.2752.00Ns
2022Negoiu × Chemical fertilization + foliar fertilization + biostimulator × 650 seeds/m2A1 × B3 × C38260.67100.00.00Ck
2023Negoiu × Chemical fertilization + foliar fertilization + biostimulator × 650 seeds/m2A1 × B3 × C37674.33100.00.00Ck
2022Utrifun × Chemical fertilization + foliar fertilization + biostimulator × 650 seeds/m2A2 × B3 × C38323.00100.862.33Ns
2023Utrifun × Chemical fertilization + foliar fertilization + biostimulator × 650 seeds/m2A2 × B3 × C311,636.00151.63961.67***
2022Zvelt × Chemical fertilization + foliar fertilization + biostimulator × 650 seeds/m2A3 × B3 × C38134.3398.5−126.33Ns
2023Zvelt × Chemical fertilization + foliar fertilization + biostimulator × 650 seeds/m2A3 × B3 × C37618.0099.3−56.33Ns
2022Tulnic × Chemical fertilization + foliar fertilization + biostimulator × 650 seeds/m2A4 × B3 × C36689.0081.0−1571.67000
2023Tulnic × Chemical fertilization + foliar fertilization + biostimulator × 650 seeds/m2A4 × B3 × C38784.00114.51109.67Ns
2022: LSD (p 5%) 776.62 kg/ha; LSD (p 1%) 1079.28 kg/ha; LSD (p 0.1%) 1513.49 kg/ha. 2023: LSD (p 5%) 1174.94 kg/ha; LSD (p 1%) 1696.50 kg/ha; LSD (p 0.1%) 2537.79 Kg/ha. Ck—control, Ns—non-significant, *—significantly positive, **—distinctly significantly positive, ***—very significantly positive, 0—significantly negative, 00—distinctly significantly negative, 000—very significantly negative, Lsd—Least Significant Difference.
Disclaimer/Publisher’s Note: The statements, opinions and data contained in all publications are solely those of the individual author(s) and contributor(s) and not of MDPI and/or the editor(s). MDPI and/or the editor(s) disclaim responsibility for any injury to people or property resulting from any ideas, methods, instructions or products referred to in the content.

