Article

Responses of N2O, CO2, and NH3 Emissions to Biochar and Nitrification Inhibitors Under a Delayed Nitrogen Application Regime

1
College of Resources and Environment, Henan Agricultural University, Zhengzhou 450046, China
2
College of Geography and Planning, Chizhou University, Chizhou 247100, China
3
Key Laboratory of Arable Land Quality Conservation in the Huanghuaihai Plain, Ministry of Agriculture and Rural Affairs, Zhengzhou 450046, China
*
Author to whom correspondence should be addressed.
These authors contributed equally to this work.
Agriculture 2024, 14(11), 1986; https://doi.org/10.3390/agriculture14111986
Submission received: 22 September 2024 / Revised: 3 November 2024 / Accepted: 5 November 2024 / Published: 5 November 2024
(This article belongs to the Section Agricultural Soils)

Abstract

:
Greenhouse gas and NH3 emissions are exacerbated by the inappropriate timing and excessive application of nitrogen (N) fertilizers in wheat cultivation in China. In this study, the impacts on N2O, CO2, and NH3 emissions of a delayed and reduced N application regime on the Huang-Huai-Hai Plain were investigated. The treatments comprised the control (N0), conventional N at 270 kg N ha−1 (N270) and optimized N application of 180 kg N ha−1 (N180), N180 + biochar at 7.5 t ha−1 (N180B7.5), N180 + biochar at 15 t ha−1 (N180B15), N180 + DMPP (a nitrification inhibitor; N180D), N180D + biochar at 7.5 t ha−1 (N180DB7.5), and N180D + biochar at 15 t ha−1 (N180DB15). Reduced N application (N180) lowered N2O and NH3 emissions. Biochar application resulted in a 4–25% and 12–16% increase in N2O and NH3 emissions, respectively. Application of DMPP significantly decreased N2O emissions by 32% while concurrently inducing a 9% increase in NH3 emissions. Co-application of DMPP and biochar significantly reduced the activity of nitrification enzymes (HAD, NOO), resulting in a reduction of 37–38% in N2O emissions and 13–14% in NH3 emissions. No significant differences in CO2 emissions were observed among the various N treatments except the N0 treatment. Application of DMPP alone did not significantly affect grain yield. However, biochar, in combination with DMPP, effectively increases grain yield. The findings suggest that the N180DB15 treatment has the potential to reduce emissions of N2O and NH3 while concurrently enhancing soil fertility (pH, SOC) and wheat yield.

Graphical Abstract

1. Introduction

Environmental change induced by the greenhouse effect is a globally significant issue of paramount concern. The emissions resulting from agricultural activities constitute an important contributor to the global inventory of greenhouse gases (GHGs) [1]. Of GHGs, N2O plays a pivotal role as an influential GHG in global warming, with a global warming potential almost 273 times that of CO2 on a centennial time scale. Emissions of N2O contribute to approximately 7% of global warming and are projected to show an annual growth rate of 0.2% [2]. Atmospheric concentrations of N2O and CO2 have reached 332 ppb and 410 ppm, respectively, according to the IPCC AR6 (2023). The levels of N2O have surged to unprecedented heights not observed in at least 800,000 years, while current CO2 concentrations represent the highest recorded levels over the past two million years.
The majority of N2O emitted from agricultural systems into the atmosphere is primarily generated within the soil, predominantly resulting from microbial activities during nitrification and denitrification [3]. The majority of anthropogenic N2O emissions, exceeding 60%, are derived from agricultural sources [4]. Atmospheric CO2, as the primary GHG, plays a pivotal role in driving global warming [5]. Emissions of CO2 in agricultural systems primarily arise from belowground plant respiration, as well as microbial metabolism of organic matter. The degradation and transformation of organic matter are primarily driven by soil microorganisms. The introduction of nitrogen (N) fertilizer disrupts the equilibrium of the original soil microbial system, thereby impacting CO2 emissions. Moreover, the type of N fertilizer significantly influences CO2 emissions [6]. The emission of NH3 into the atmosphere can result in various detrimental effects despite its lack of contribution to the greenhouse effect. Cui et al. (2024) observed that atmospheric redeposition of NH3 leads to acidification of water bodies and a decline in biodiversity and serves as an indirect driver for N2O emissions [7]. Furthermore, NH3 plays a pivotal role in the formation of fine particulate matter, such as PM2.5 [8]. The NH3 emissions from agricultural sources account for 90% of the total NH3 emissions from anthropogenic sources, with NH3 volatilization induced by N fertilization in farmland contributing approximately 40% of the NH3 emissions from agricultural sources [9]. Therefore, it is imperative to develop strategies to mitigate GHG and NH3 emissions originating from agricultural practices while simultaneously enhancing the efficiency of N fertilizer use.
Relevant field experiments have been conducted to mitigate GHG and NH3 emissions without compromising crop yields. For instance, reduction of N input can effectively mitigate emissions of gaseous N and CO2 [10] while concurrently enhancing nitrogen use efficiency (NUE) and increasing crop productivity [11]. The N input in agricultural systems on the Huang-Huai-Hai (HHH) Plain is excessively high, and a reduction from the conventional 300 to 250 kg N ha−1 has been recommended [12]. Duan et al. (2019) reported a range of 180 to 240 kg N ha−1 for the optimal annual N input for winter wheat production across the HHH Plain [13]. The efficacy of reducing N inputs on the HHH Plain to maintain high yields while minimizing N loss has been substantiated by numerous studies [14]. In addition, N-based fertilizers are applied in conjunction with synergistic agents, such as biochar, nitrification inhibitors (NIs), or a combination of dual inhibitors, to mitigate N loss by regulating the process of N conversion [15].
NIs suppress the conversion of ammonia nitrogen (NH4+-N) to nitrate nitrogen (NO3-N) by inhibiting the activity of nitrifying bacteria in the soil. Such inhibitors directly delay nitrification and indirectly reduce the substrate pool for denitrification to reduce NO3-N loss and mitigate N2O production. Compared with other commercial NIs, 3,4-dimethylpyrazole phosphate (DMPP) is highly favored because of its long-lasting inhibitory effect, stability, environmental friendliness, and a DMPP dosage of only 1% of the amount of N applied is effective [16]. The impact of DMPP on ammonia-oxidizing bacteria (AOB) has been suggested as the mechanism underlying its inhibitory effect on N2O emission [17]. Zhou et al. (2020) provided evidence of the notable capacity of DMPP to inhibit the growth of bacteria capable of complete ammonia oxidation [18]. The impact of DMPP application on NH3 volatilization is variable. An increase in soil solution NH4+ concentration has been observed with the addition of DMPP, compared to N fertilizer application alone, which could potentially lead to a heightened risk of NH3 volatilization [19]. In contrast, a meta-analysis conducted by Tufail et al. (2023) revealed that DMPP was generally ineffective in mitigating NH3 emissions, although certain studies indicated a 20% reduction in NH3 emissions from wheat fields [20]. Contradictory findings have been reported regarding the influence of DMPP on CO2 emissions. Li et al. (2023) reported that DMPP effectively decreased CO2 emissions by 8% and 19% in field and laboratory experiments, respectively, because it inhibits H+ release, which impedes the conversion of soil carbonates into CO2 [21]. Conversely, Menéndez et al. (2012) observed no significant impact on CO2 emissions in response to DMPP application [22].
Considered a sustainable approach to enhancing soil quality, the utility of biochar in agriculture has been extensively studied with regard to its impact on climate change, soil microenvironment, and fertility [23]. Nevertheless, reports of the effectiveness of biochar amendments are inconsistent. Taghizadeh-Toosi et al. (2011) observed a significant impact of biochar amendment quantity on N2O emissions [24]. Sun et al. (2017) noted that higher rates of biochar addition (2% and 4%) stimulated gaseous N discharge, whereas lower rates (0.5% and 1%) failed to induce NH3 volatilization [25]. He et al. proposed that the application of biochar at a rate of 7.5 t ha−1 combined with dual inhibitors constitutes the most effective strategy for reducing N2O, NH3, and N leaching [26]. In addition, Huang et al. (2022) identified through integration of field experiments and model predictions that the application of 15 t ha−1 biochar in conjunction with N fertilizer represents an optimal approach for enhancing soil fertility and optimizing wheat yields in northern China [27]. The incorporation of biochar into the soil elicits dynamic changes in the soil carbon pool, thereby exerting an influence on CO2 emissions. The effects of biochar amendment on CO2 emissions have varied among studies, including stimulation [28], inhibition [29], and no significant impact [30]. Due to variations in soil properties within farmland, as well as differences in biochar characteristics and input rates, biochar application can either stimulate or inhibit soil gaseous N and CO2 emissions. Hence, assessment of the potential influence of biochar amendment and application rates on gaseous N and CO2 emissions is challenging in areas characterized by diverse land use and soil types.
To date, the majority of N-based fertilizers for winter wheat have been applied at sowing. However, limited research has been conducted on the emission of GHGs and NH3 under delayed application of N. On the HHH Plain, the conventional approach to fertilization for wheat involves the application of a substantial quantity of basal N fertilizer during autumn to guarantee an ample supply of N in winter, followed by a significant topdressing of N fertilizer in spring. However, varying amounts of N are required at different growth stages of winter wheat [31]. Prior to wintering, the N requirement for winter wheat is relatively low. In temperate regions, autumn application of N significantly reduces NUE and increases N losses compared with those following spring application [32,33]. Enhanced NUE in winter wheat can be achieved by delaying N fertilizer application to periods of high demand [34]. Demand for N during the growth cycle of winter wheat is greatest at the regreening and jointing stages. Applying N at these specific stages enhances the likelihood of effective absorption and utilization by the crop. To the best of our knowledge, there is a paucity of relevant studies on GHG and NH3 emissions under delayed N application regimes. Furthermore, numerous studies have investigated the separate effects of biochar or NIs on N conversion, whereas research on the synergistic impact of biochar and NIs on GHG and NH3 emissions is deficient. Therefore, the aims of the present research were (1) to estimate GHG and NH3 emissions under delayed N application to a winter wheat crop and (2) to determine the optimal combination of N fertilizer and biochar or DMPP to minimize GHG and NH3 emissions.

2. Materials and Methods

2.1. Experimental Region

The experiment was conducted in Baizhuang Town, Anyang City, Henan Province, China (36°11′51″ N, 114°20′56″ E). The soil is categorized as fluvo-aquic, derived from alluvial sediments deposited by the Yellow River. Prior to commencing the field experiment, soil samples (0–20 cm) were collected using the multi-point sampling method with three replicates, and the physicochemical parameters were subsequently analyzed. The soil composition in the 0–20 cm layer comprised 52% sand, 24% silt, and 24% clay. The soil texture is classified as clay loam, with a cation exchange capacity (CEC) of 18.06 cmol kg−1. The soil bulk density was 1.32 g cm−3, the pH was 7.57, the available phosphorus was 12.62 mg kg−1, the total nitrogen (TN) content was 1.09 g kg−1, and the organic carbon content was 11.22 g kg−1.

2.2. Experimental Design

During the 2022/23 growing season, a field experiment was conducted using a randomized block design with eight treatments, each with three replicates, in plots measuring 2 m × 2 m. The experimental treatments comprised the control without N fertilization (N0), conventional N at 270 kg N ha−1 (N270), optimal N at 180 kg N ha−1 (N180), N180 + biochar at 7.5 t ha−1 (N180B7.5), N180 + biochar at 15 t ha−1 (N180B15), N180 + DMPP (N180D), N180D + biochar at 7.5 t ha−1 (N180DB7.5), and N180D + biochar at 15 t ha−1 (N180DB15).
Calcium superphosphate (60 kg P2O5 ha−1) and potassium chloride (45 kg KCl ha−1) were uniformly applied to all plots once before sowing. Urea was applied as the initial N fertilizer (60%) during the regreening stage on 8 February 2023 and as the topdressing N fertilizer (40%) during the jointing stage on 17 April 2023. DMPP was applied at the rate of 1% (w/w) of the N fertilizer, mixed thoroughly with the urea, and promptly applied to the topsoil through furrowing. Seeds of wheat ‘Anmai 11’ were sown on 25 October 2022, and grains were harvested on 10 June 2023. Wheat cultivation and field management were implemented in alignment with traditional local agricultural practices. A micro-zone test was conducted at the center of each plot, encompassing an area of 1 m × 1 m (totaling 1 m2). For isolated planting, a galvanized iron sheet frame measuring 1 m in length, 1 m in width, and 60 cm in height with a thickness of 1.5 mm was employed. This isolation frame was embedded into the soil prior to wheat sowing and maintained at a height of 5 cm above ground level. During the wheat harvest season, all plants within the micro-zone were harvested for assessment of both yield and dry matter quality.
The biochar, derived from corn straw through pyrolysis at 450 °C, was obtained from the Jiangsu Qinfeng Straw Technology Company (Nanjing, China) and was incorporated into the soil through tillage to a depth of 20 cm before sowing in October. The biochar contained 2.1 g N kg−1 and 507.4 g C kg−1, had a pore volume of 0.004 cm³ g−1, along with specific surface area of 1.19 m2 g−1, contact angle of 72°, pH of 9.65, total phosphorus and total potassium contents of 8.37 g kg−1 and 9.33 g kg−1, respectively.

2.3. Gas Emissions Measurement

The quantification of GHG emissions was conducted using a hermetically sealed chamber method. The upper section of the chamber comprised a movable gas-sampling box measuring 45 cm × 25 cm × 50 cm, while the lower part included a fixed pedestal in each experimental plot measuring 45 cm × 25 cm × 10 cm. A sink was incorporated at the basal frame edge to ensure complete enclosure of the chamber. The top surface of the chamber featured three apertures: one for installing a small electric fan to optimize air circulation within the chamber, one for inserting a thermometer, and a small vent for sampling purposes (the valve remained closed when not collecting samples to maintain an air-tight seal).
Four air samples were extracted from each chamber at 15 min intervals using an injector between 9:00 and 11:00 a.m. while simultaneously recording thermometer readings. The samples were continuously collected for a period of 7 days after N application, with no sampling conducted during rainy weather. Subsequently, the frequency of sampling was adjusted to every 7–10 days. Gas samples were promptly analyzed using a gas chromatograph (GC2010 Plus, Kyoto City, Japan) within 24 h after collection. An electron capture detector was employed for the analysis of N2O at a detector temperature of 300 °C and a column temperature of 30 °C, while CO2 was analyzed using a flame ionization detector. High-purity N served as the carrier gas for both analyses. N2O and CO2 fluxes were analyzed using a linear regression model [35]. The regression coefficient of gas concentration and time was accepted if R2 coefficients > 0.9. Gas emission flux was calculated as follows.
F = ρ × H × ΔC/ΔT × 273/(273 + T)
where F is the gas emission flux; ρ is the gas density under standard conditions (kg·m−3); H is the chamber height (m); ΔC/ΔT is the slope of change in gas concentration with time (μg·h−1); T is the average temperature inside the chamber (°C).
The venting method was employed to quantify NH3 volatilization [36]. The NH3 capture device is constructed from PVC plastic pipes, measuring 30 cm in height and 7.5 cm in radius. Throughout the experiment, the pipe was inserted into the soil at a depth of 12 cm. Each device is equipped with two sponges, each containing 15 milliliters of phosphate glycerin solution (5% phosphoric acid + 4% glycerin), with a diameter of 8 cm and thickness of 2 cm. The upper sponge serves to prevent atmospheric NH3 from entering the device, while the lower sponge is designed to absorb NH3 volatilized from the soil. Soil NH3 volatilization was monitored over a two-week period following each N application. Specifically, the lower layer sponge was collected daily at 8 a.m. during the first week and at two-day intervals during the second week.
The cumulative gas emissions (CE) were calculated using the time-weighted approach in accordance with emission fluxes. Specifically, compute the average of two consecutive gas flux measurements, multiply this average by the interval between measurements, and add the result to the preceding cumulative total.

2.4. Soil Collection and Analysis

Five equal portions of topsoil samples (0–20 cm depth) were collected and combined to form a composite sample using a small-scale soil sampler. Following soil sampling, stones and roots were removed, thoroughly homogenized, and sieved. The concentrations of NH4+-N, NO3-N, and DOC in the soil were quantified within 24 h post-sampling. Soil samples were collected on the second day following N application and subsequently at two-day intervals for a total of five occasions, with additional collections occurring approximately every 15 days thereafter. During wheat harvest, surface soil was collected using the same methodology and divided into two portions. One portion of fresh soil was preserved at −20 °C and promptly transported to the laboratory for enzyme activity analysis, while the other sample was allowed to air-dry naturally for further assessment of additional soil parameters. NH4+-N and NO3-N were extracted using a 2 mol L−1 KCl solution from fresh soil and quantified with a continuous flow analyzer (Hamburg, Germany). Dissolved organic carbon (DOC) was measured using a TOC analyzer (XPERT-TOC, TE Instruments, Delft, The Netherlands). Soil pH, soil organic matter, soil organic carbon (SOC), and TN were determined in accordance with the methods described by Lu (2000) [37]. The NUE was calculated with the following formula:
NUE = 100 × (GN − GN0)/Ninput
where GN and GN0 are the N uptake in aboveground parts of wheat under N treatments and the N0 fertilizer treatment.
The soil water content was measured using a time-domain reflectometer. The temperature of the soil at depths of 5 cm, 10 cm, and 15 cm was simultaneously determined using a geothermometer. The water-filled pore space (WFPS) of the soil was calculated as follows:
WFPS = VWC/(1 − BD/2.65)
where VWC represents the volumetric water content of the soil, BD represents soil bulk density, and 2.65 represents the soil particle density (g · cm⁻3) [38].

2.5. Enzyme Activity Associated with Soil N Cycling

The enzyme activities associated with N cycling in fresh soil were assessed using an enzyme-linked assay method. The experiment was conducted using a commercially available kit (JingKang Biological Engineering Technology Co., Ltd., Shanghai, China), with enzyme activity determined via a microplate reader (Molecular Devices Limited., Hongkong, China) in accordance with the manufacturer’s guidelines. The materials provided in the kit are detailed in Table S1. All procedures followed the instructions strictly (Table S2). To ensure the quality of the experiment, samples should be added using a sampler at each step, and their accuracy must be frequently verified. Samples should be added within 5 min to avoid experimental error. Additionally, the closure plate membrane only limits the disposable use. Standard curves were generated concurrently with each enzyme assay (Figure S1), and parallel control experiments were conducted. We quantified the activity of ten enzymes, namely, ammonia monooxygenase (AMO), hydroxylamine dehydrogenase (HAD), hydroxylamine oxidase (HAO), nitrite oxidoreductase (NXR), nitrous oxide reductase (NOS), nitric oxide reductase (NOR), nitric oxide dismutase (NOD), nitric oxide oxidase (NOO), denitrifying nitrate reductase (DNAR), and denitrifying nitrite reductase (DNIR).

2.6. Statistical Analyses

Significant differences among parameters from the field trials were assessed using analysis of variance (ANOVA); one-way ANOVA with treatment as a factor and two-way ANOVA were executed to examine the effects of gas emissions and wheat harvest index (yield, NUE) under co-application of DMPP and biochar treatment. ANOVA was conducted following the test of variance homogeneity, mean comparisons were conducted using the Tukey HSD test, with a significance threshold at α < 0.05. The relationships of biochar and DMPP treatments with enzyme activity and soil properties indexes were assessed by performing a principal component analysis. Random forest analysis was employed to assess the relative importance of soil properties and enzyme activity indicators in relation to gas emissions, utilizing the ‘rfPermute’ package (RStudio R 4.3.1). Correlation analysis was conducted according to Pearson (Origin 2021), and statistical analyses were performed using IBM SPSS Statistics 26.0.

3. Results

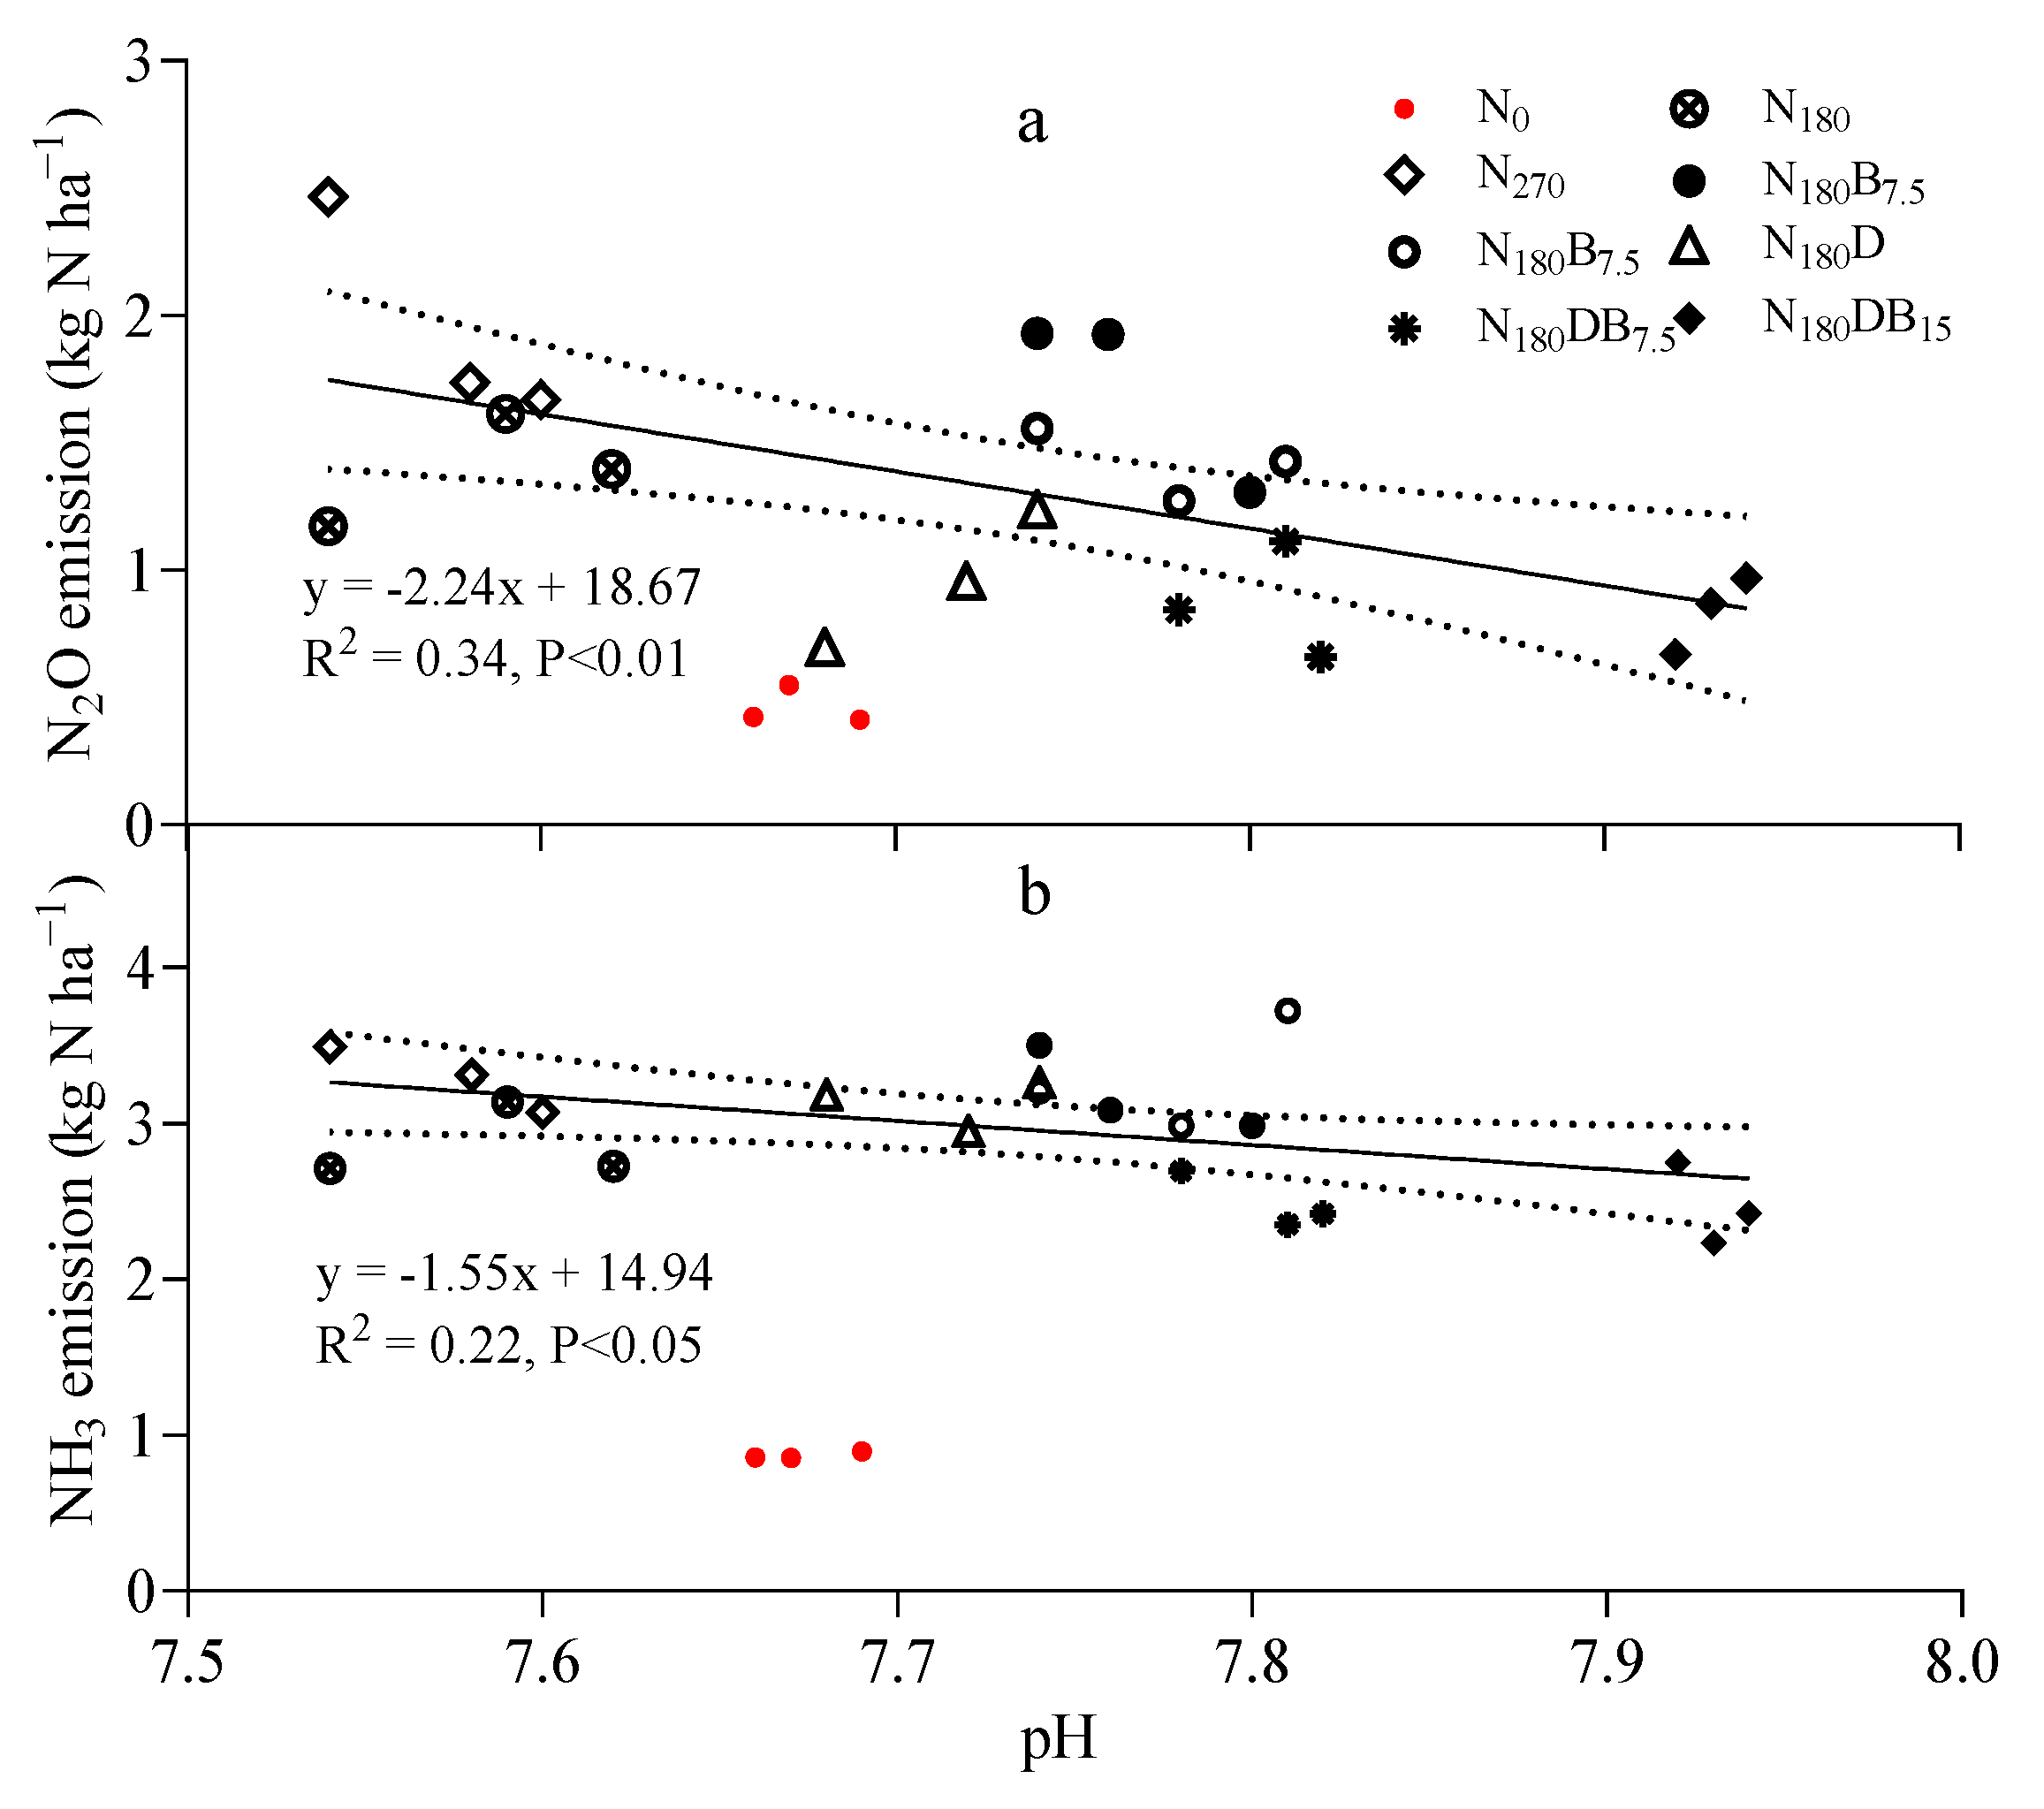
3.1. Effects of N Fertilizer, Biochar, and DMPP on Soil Characteristics

Soil bulk density was notably reduced under the biochar treatments but negligibly affected by the other treatments. Soil pH exhibited a notable decrease under the N treatments, whereas biochar or DMPP application had the opposite effect, leading to a significant increase in soil pH compared with that of the N180 treatment. The application of N alone or in combination with DMPP resulted in a marked increase in SOC, whereas the addition of biochar had a more pronounced effect on enhancing SOC. No discernible variation in TN was detected among the treatments after harvest (Table 1).

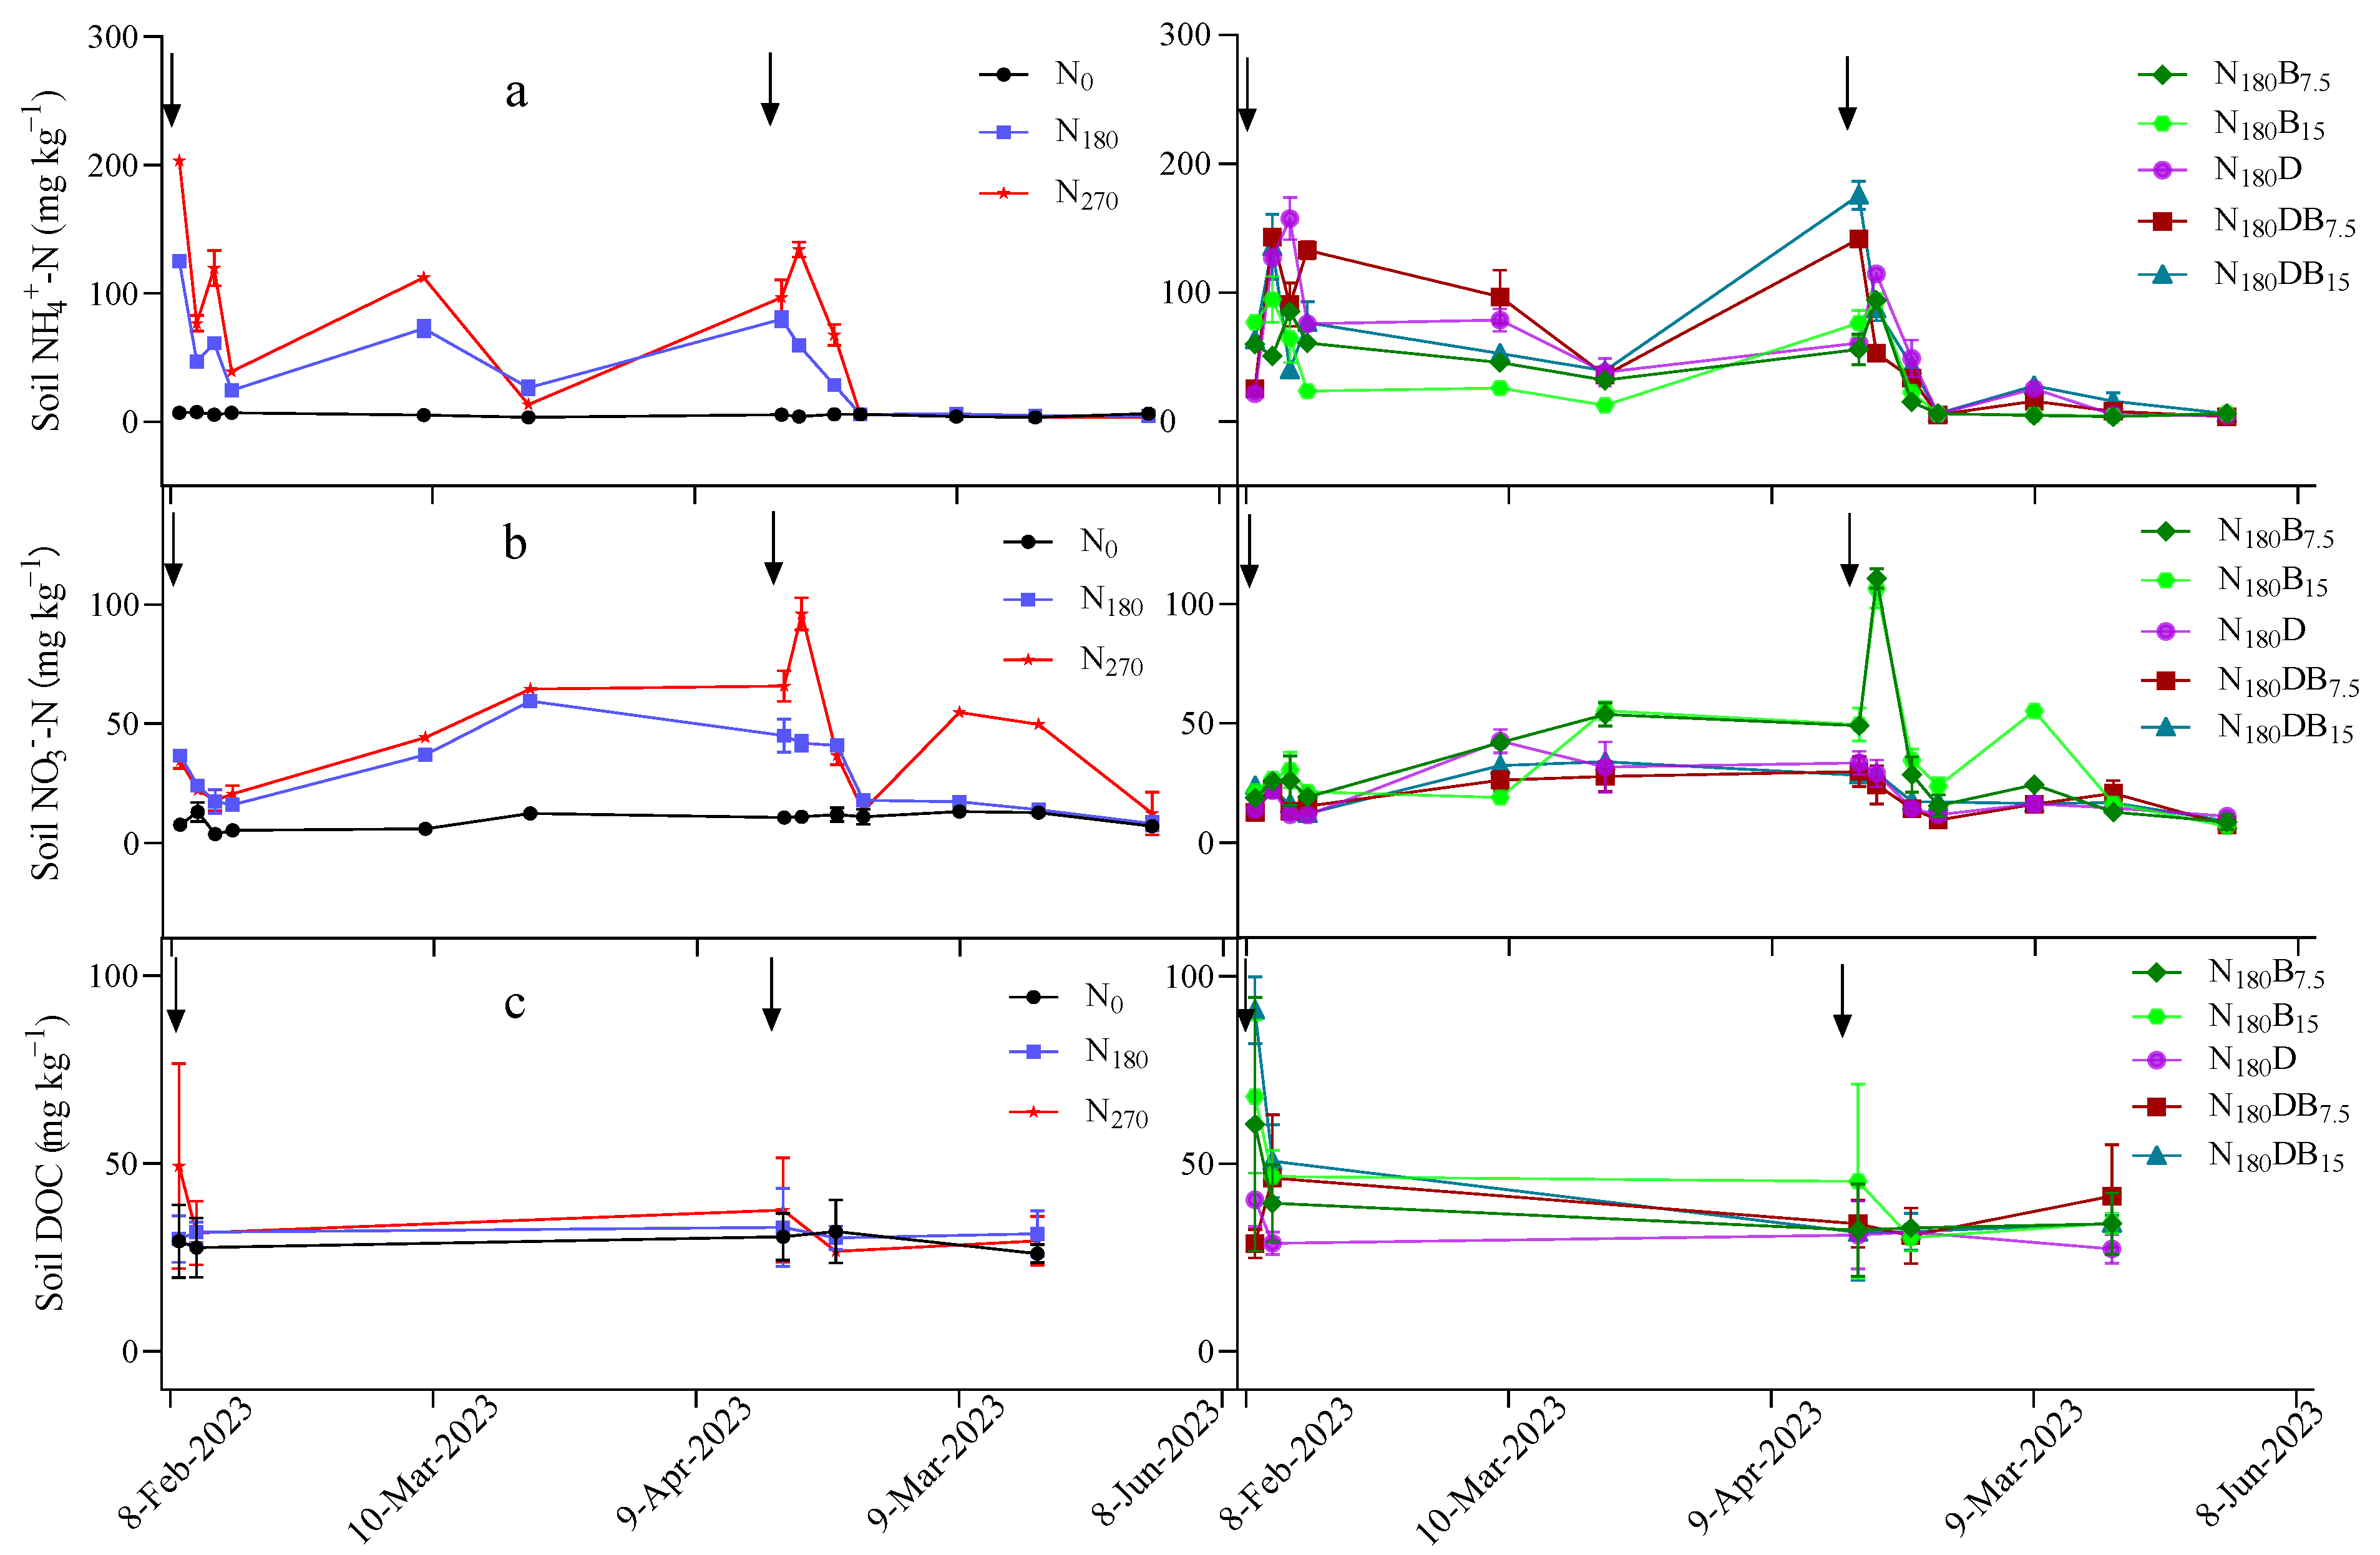
3.2. Temporal Variation in External and Soil Environment Indicators

The air temperature in the study region fluctuated within the range of 0.75–28.5 °C following N fertilization, with an average of 14.6 °C, and was accompanied by total rainfall of 80.0 mm. The soil temperature exhibited a gradual increase and peaked at 27 °C. The minimum recorded soil temperature was observed at a depth of 15 cm, averaging approximately 10.1 °C, whereas the maximum soil temperature was recorded at a depth of 5 cm with an average of approximately 13.9 °C (Figure S2). The soil WFPS exhibited a consistent pattern of fluctuation across all treatments, ranging from 16% to 69% (Figure S3).
The contents of inorganic N(IN) (NH4+-N plus NO3-N) and DOC exhibited an increasing trend subsequent to N application (Figure 1). The contents of NH4+-N, NO3-N, and DOC in the soil varied among treatments, with those of NH4+-N and NO3-N ranging from 5.49 to 67.90 mg kg−1 and 9.63 to 40.96 mg kg−1, respectively, and DOC varying between 29.12 and 47.91 mg kg−1 (Table S3). The N180 treatment and biochar addition group exhibited comparable IN contents on average, whereas the incorporation of DMPP or a combination of DMPP and biochar significantly augmented the IN content. The application of DMPP significantly impeded nitrification, leading to a substantial reduction in soil NO3-N contents and elevation in NH4+-N contents compared with those under the application of an equivalent amount of N fertilizer. This effect was particularly pronounced during the initial 2 weeks following N fertilization. The content of IN was significantly higher under the N270 treatment compared with that under the other treatments.

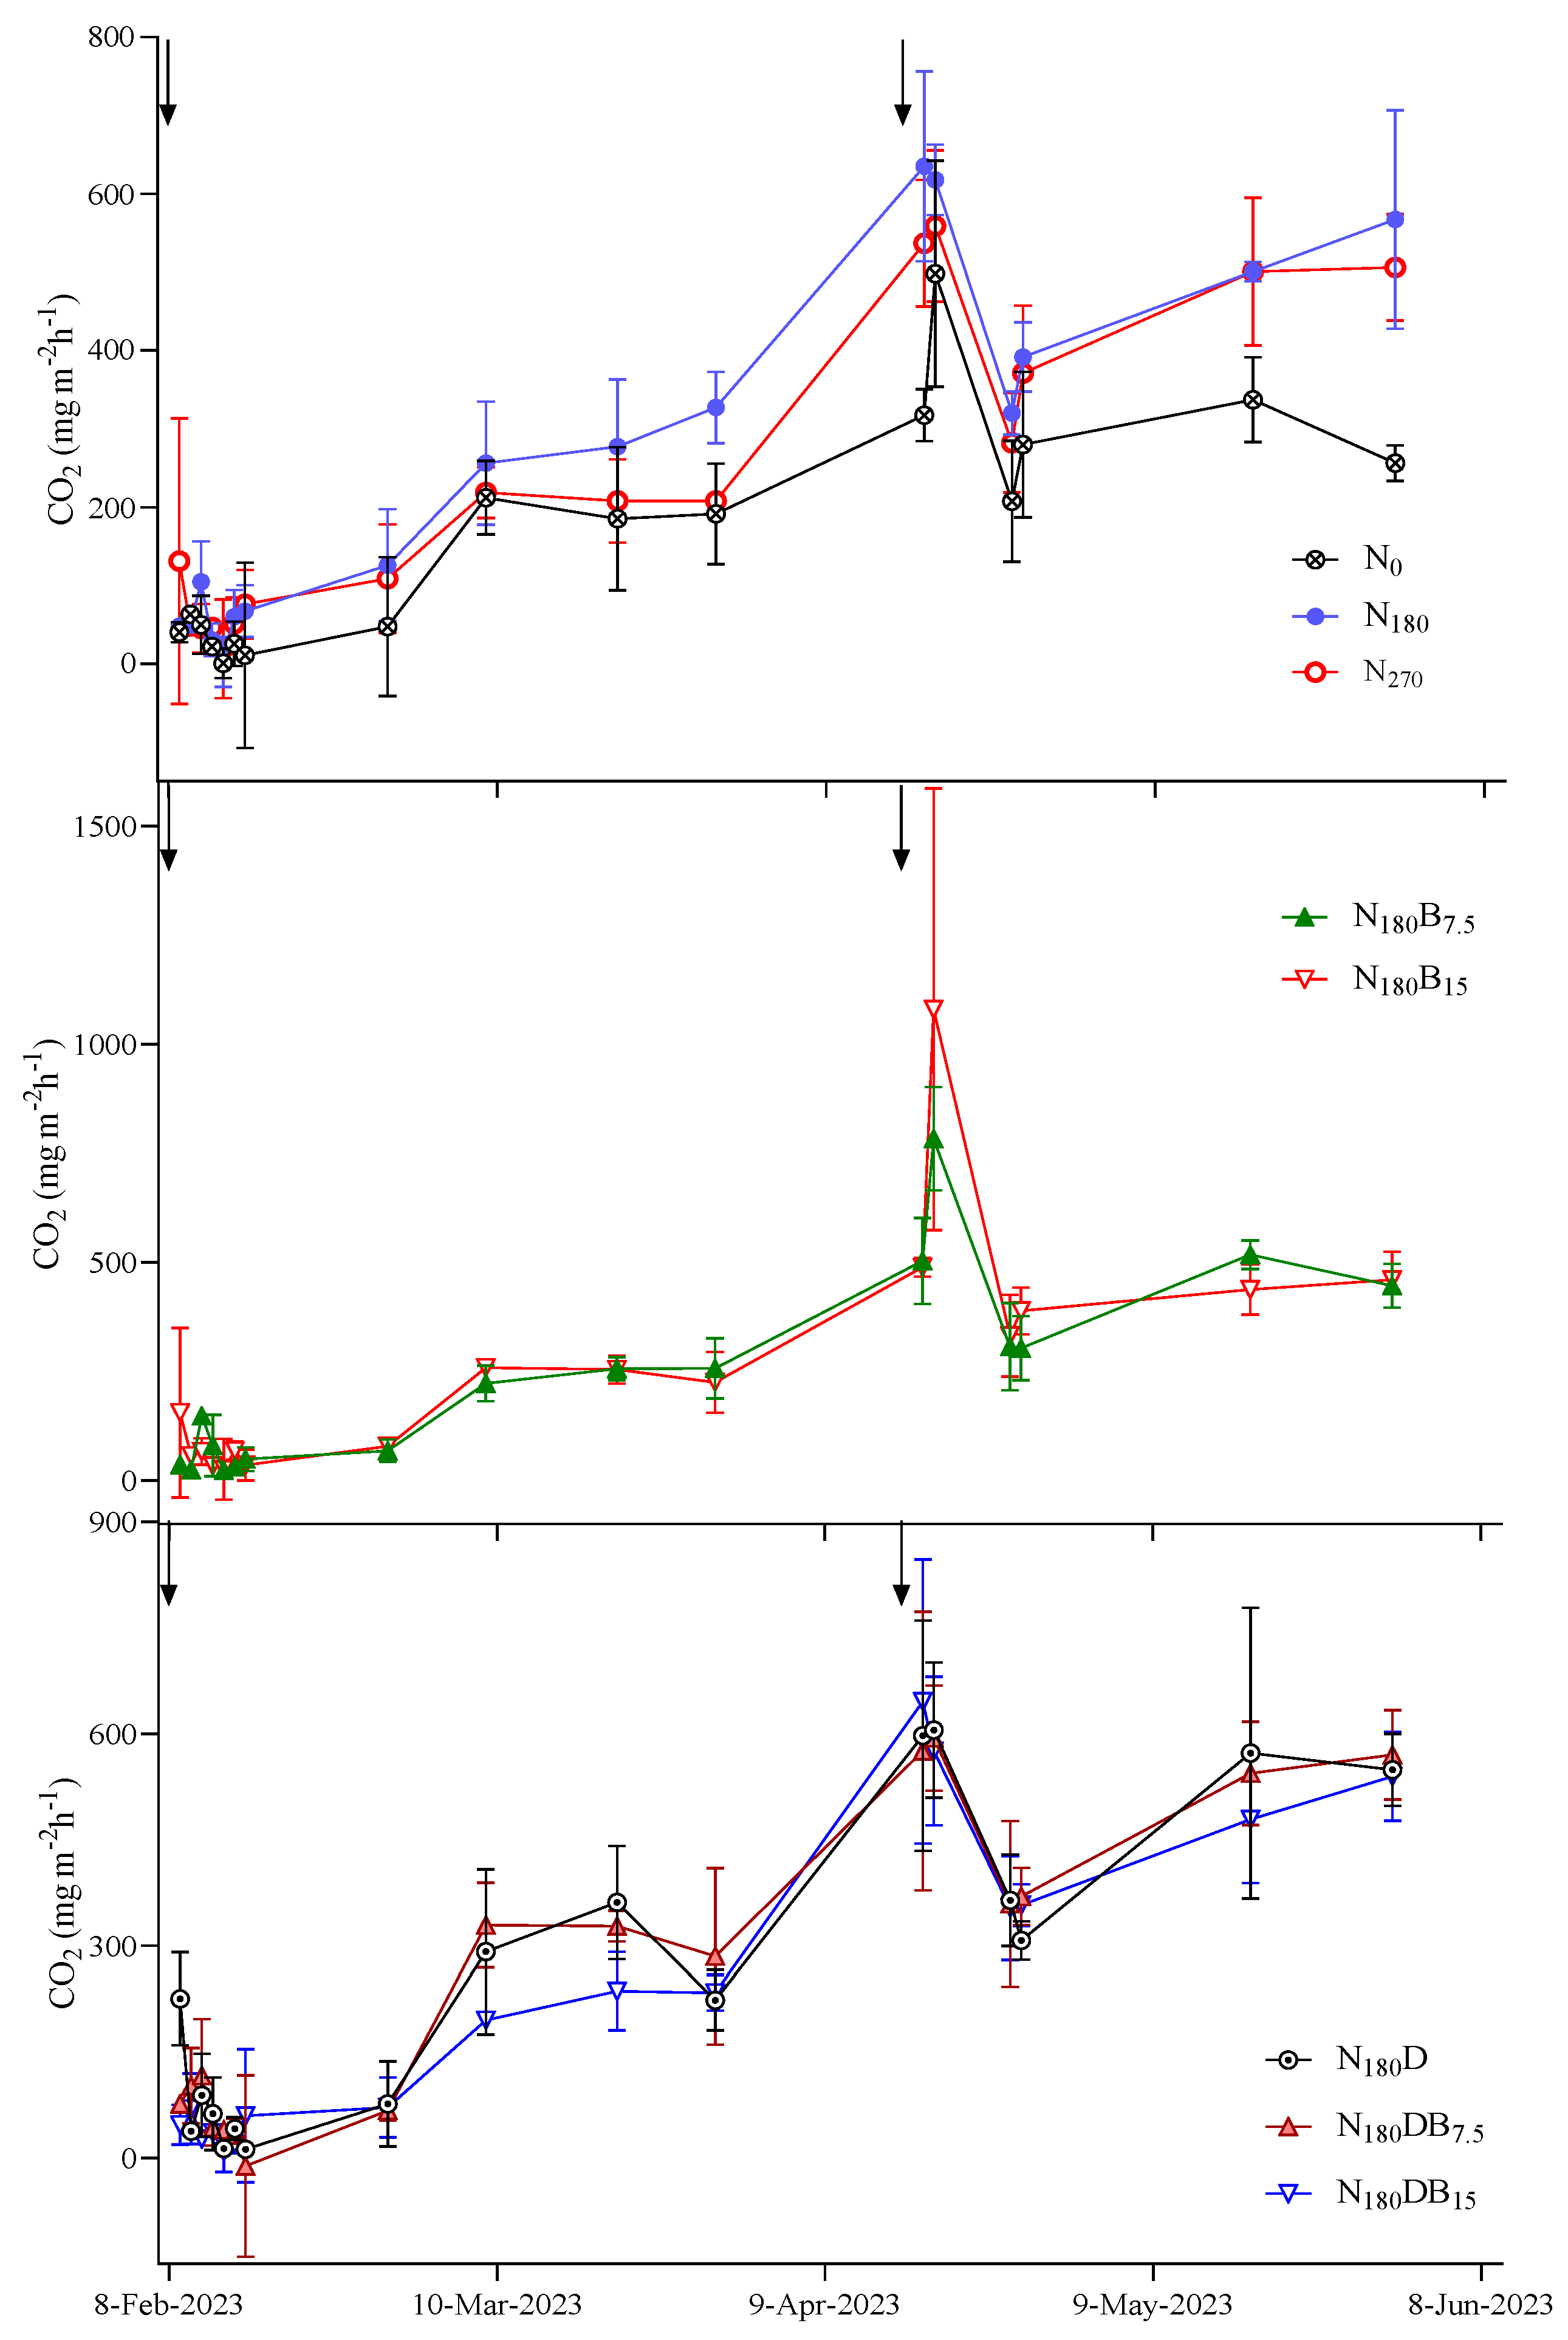
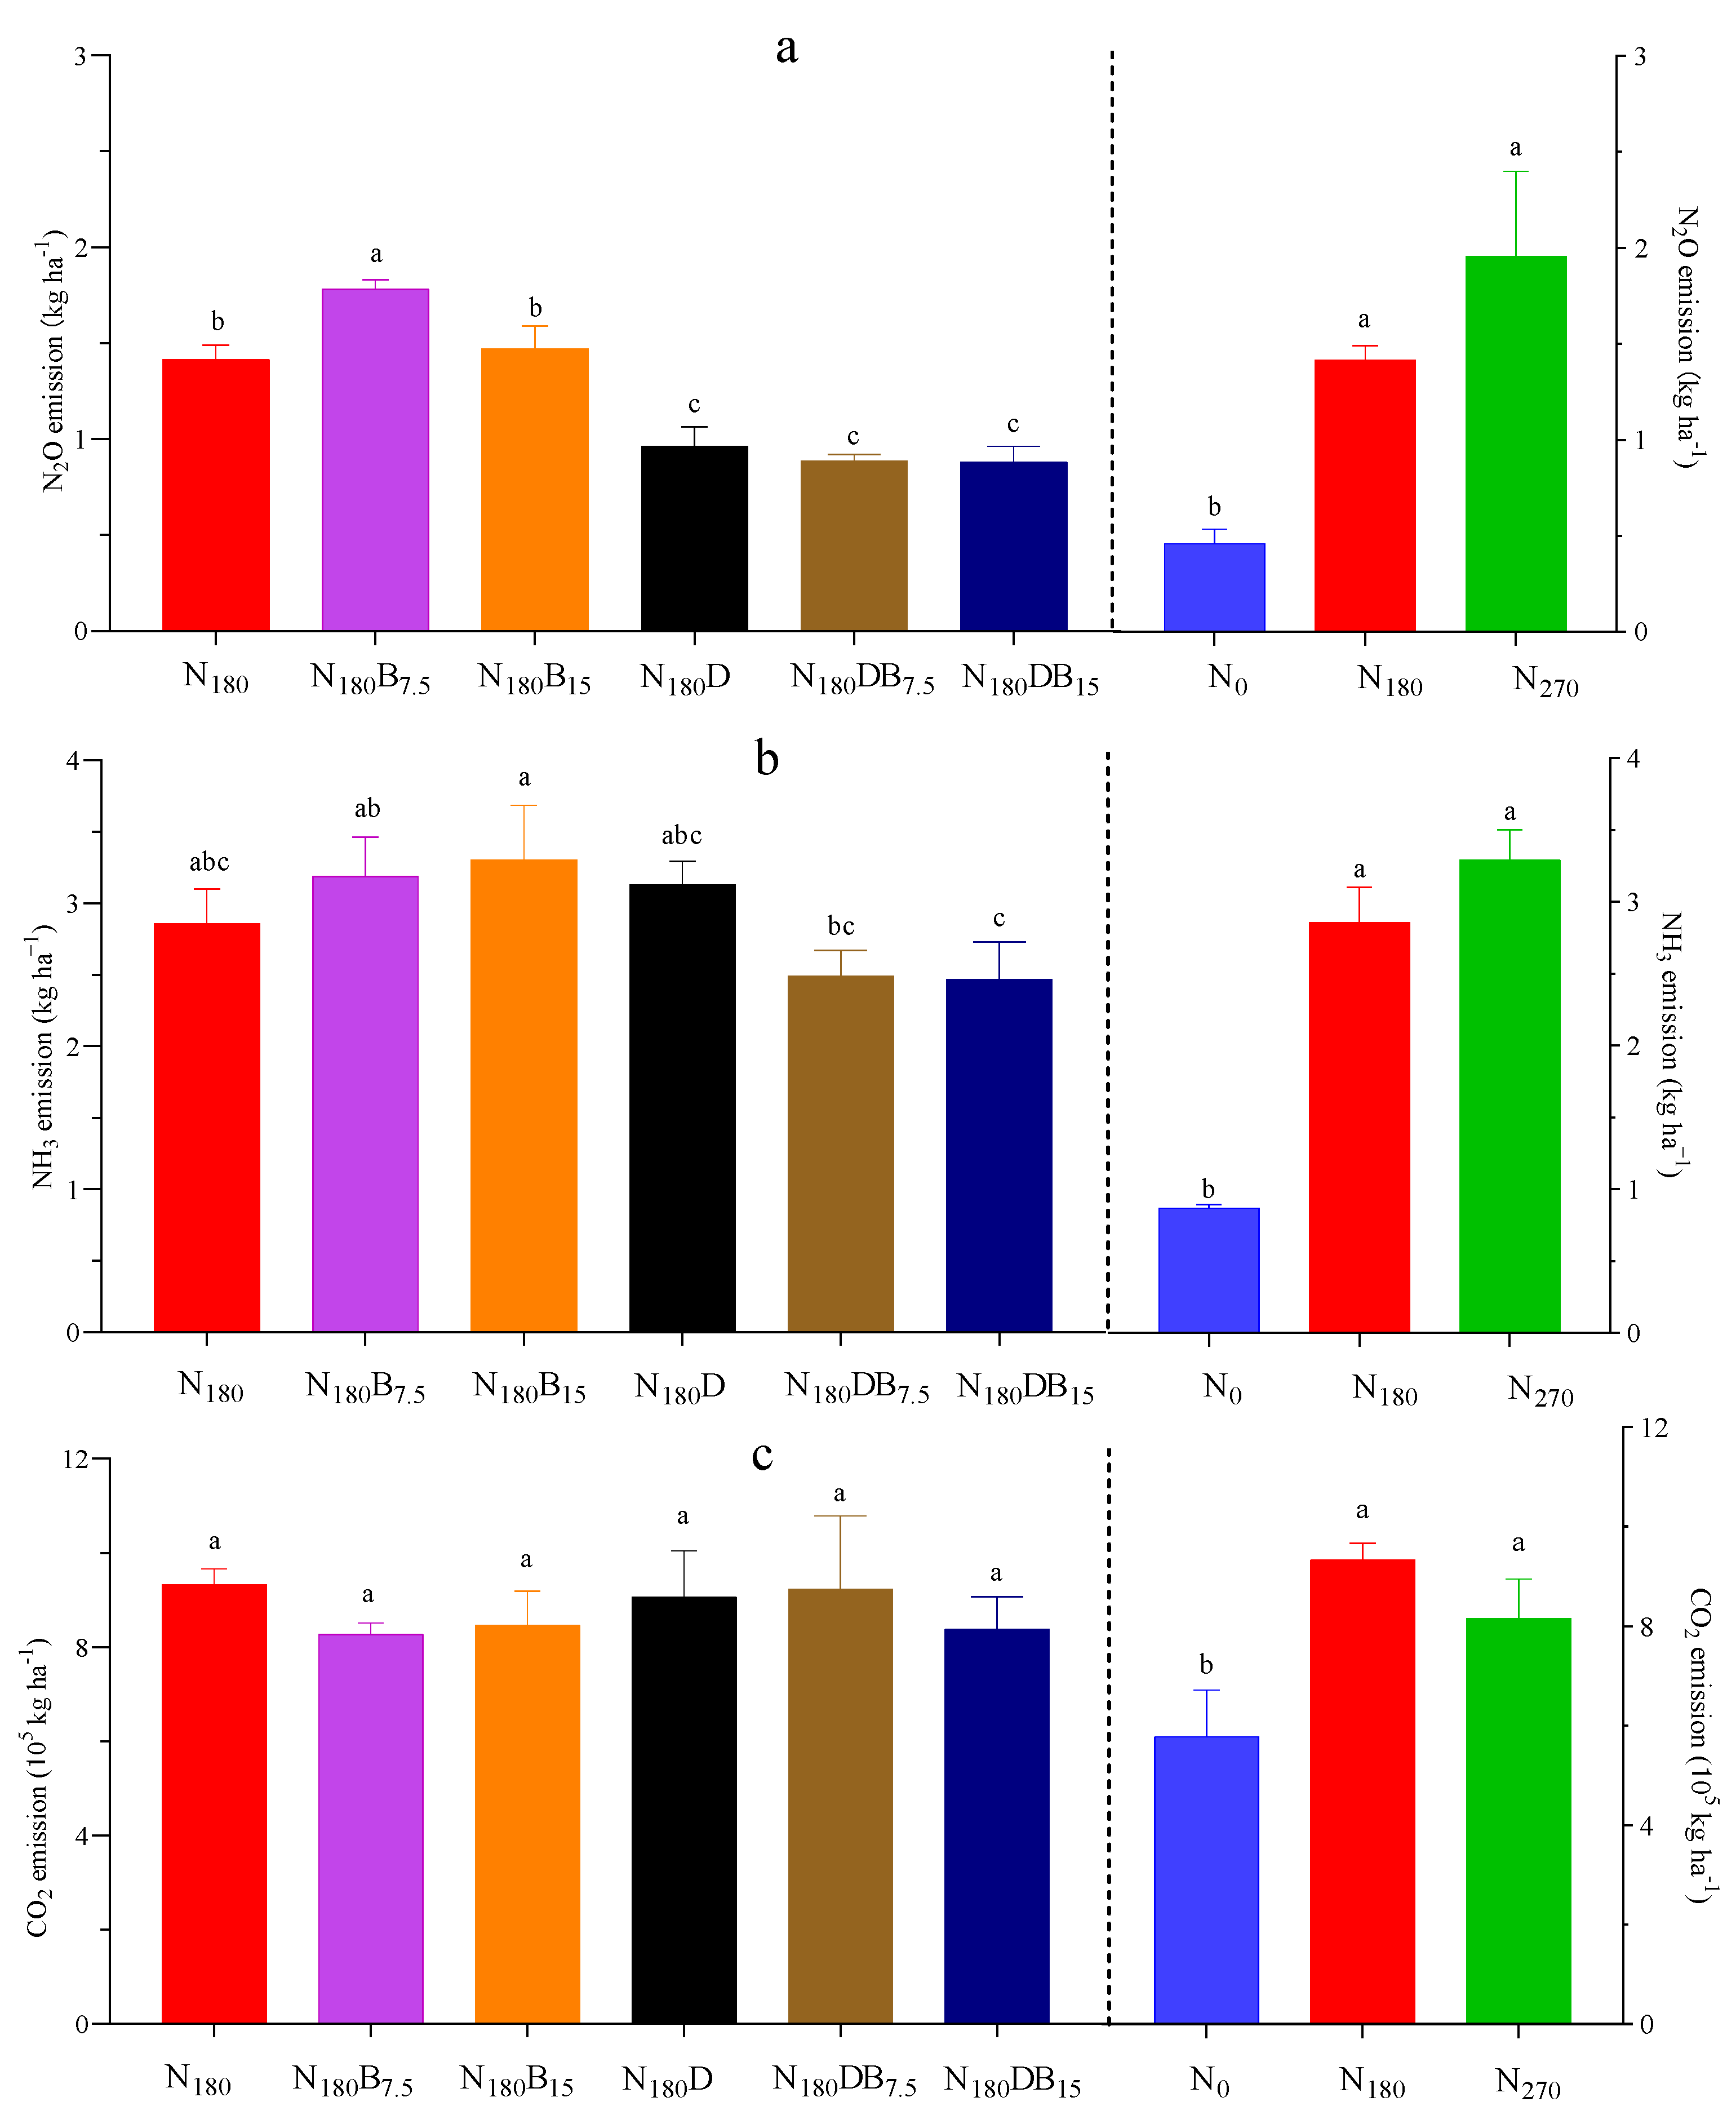
3.3. N2O and CO2 Emissions

The N2O emissions remained consistently minimal without N addition, whereas spikes in N2O flux were observed immediately following N application (Figure 2). Following the initial application of N, the N180B7.5 treatment exhibited the highest peak in N2O flux (83 μg N m−2 h−1), whereas the N2O flux during the initial N fertilization period was comparatively lower than that observed during the topdressing period. All N fertilization treatments showed N2O flux peaks after topdressing; the highest peak N2O flux (873 μg N m−2 h−1) was observed in the N2 treatment. Subsequently, the N180B15 treatment demonstrated a slightly higher N2O flux (793 μg N m−2 h−1) than the N180 treatment (768 μg N m−2 h−1). DMPP effectively suppressed N2O flux, with reductions in the peak flux of 57%, 87%, and 70% observed under the N180D, N180DB7.5, and N180DB15 treatments, respectively.
The CO2 flux peaks immediately followed the N application (Figure 3). The highest CO2 flux (1081 mg m−2 h−1) was detected 2 days after topdressing under the N180B15 treatment, whereas the maximum observed CO2 flux under the N180 treatment was 635 mg m−2 h−1. Augmentation of N fertilizer input did not lead to an elevation in CO2 flux; the CE-CO2 in the N270 treatment was lower than that of the N180 treatment. DMPP or biochar had no significant inhibitory effect on CO2 emissions. No notable disparities in CO2 emissions were observed among all treatments except for the N0 treatment, with the lowest CE-CO2 observed under the N180DB15 treatment (Figure 4).
The correlations of N2O flux with soil NO3-N and IN were significant in all treatments except for the control group. Both the biochar group and the DMPP group exhibited a significant positive correlation between N2O flux and WFPS (Table 2). The CO2 flux showed a strong negative correlation with soil NH4+-N and IN under the N-alone group and DMPP group, and a negative correlation with soil NO3-N was found in the control group. In addition, the CO2 flux was significantly negatively correlated with WFPS in the DMPP group. The highest N2O fluxes were observed at WFPS from 47% to 78% (Figure S4).
The highest CE-N2O was observed in the N270 treatment (1.96 kg N ha−1). Biochar alone resulted in an increase in N2O emissions compared with those of the N180 treatment (Figure 4). The N180B7.5 and N180B15 treatments led to a respective rise in N2O emissions by 25% and 4%. However, the addition of DMPP had a significant inhibitory effect; the N180D, N180DB7.5, and N180DB15 treatments reduced N2O emissions by 32%, 37%, and 38%, respectively.
Soil pH was negatively correlated with CE-N2O in all N treatments (p < 0.01; Figure 5a). The EF of N2O was 0.55% in the N270 treatment, and the application of biochar raised the EF value by 38% and 6% in the N180B7.5 and N180B15 treatments, respectively. The incorporation of DMPP resulted in a substantial reduction in the EF of N2O, which was particularly evident in the N180DB15 treatment (decreased to 0.23%).

3.4. NH3 Volatilization

The NH3 emissions after N application exhibited similar characteristics in all treatments (Figure 6a). The peak NH3 fluxes were observed 3 days after the initial N application and detected immediately following N topdressing (Figure 6b). Compared with the N180 treatment, the application of biochar or DMPP alone increased the NH3 flux peak. However, the addition of biochar in conjunction with DMPP successfully mitigated the maximum NH3 emissions. The NH3 flux was correlated with NH4+-N in all treatments except for the control group. In both the N and DMPP groups, the NH3 flux was significantly correlated with IN and WFPS. Only in the DMPP group was NH3 flux positively correlated with NO3-N.
The CE-NH3 was greatly enhanced following the N application. The N270 and N180 treatments resulted in significantly higher CE-NH3 than that of the control (Figure 4). The NH3 emission induced by DMPP or biochar alone was higher than that of the N180 treatment; the N180D, N180B7.5, and N180B15 treatments increased CE-NH3 by 9%, 12%, and 16%, respectively. However, the CE-NH3 was 13% and 14% lower under the N180DB7.5 and N180DB15 treatments, respectively. A negative linear correlation between soil pH and CE-NH3 was observed (Figure 5b).

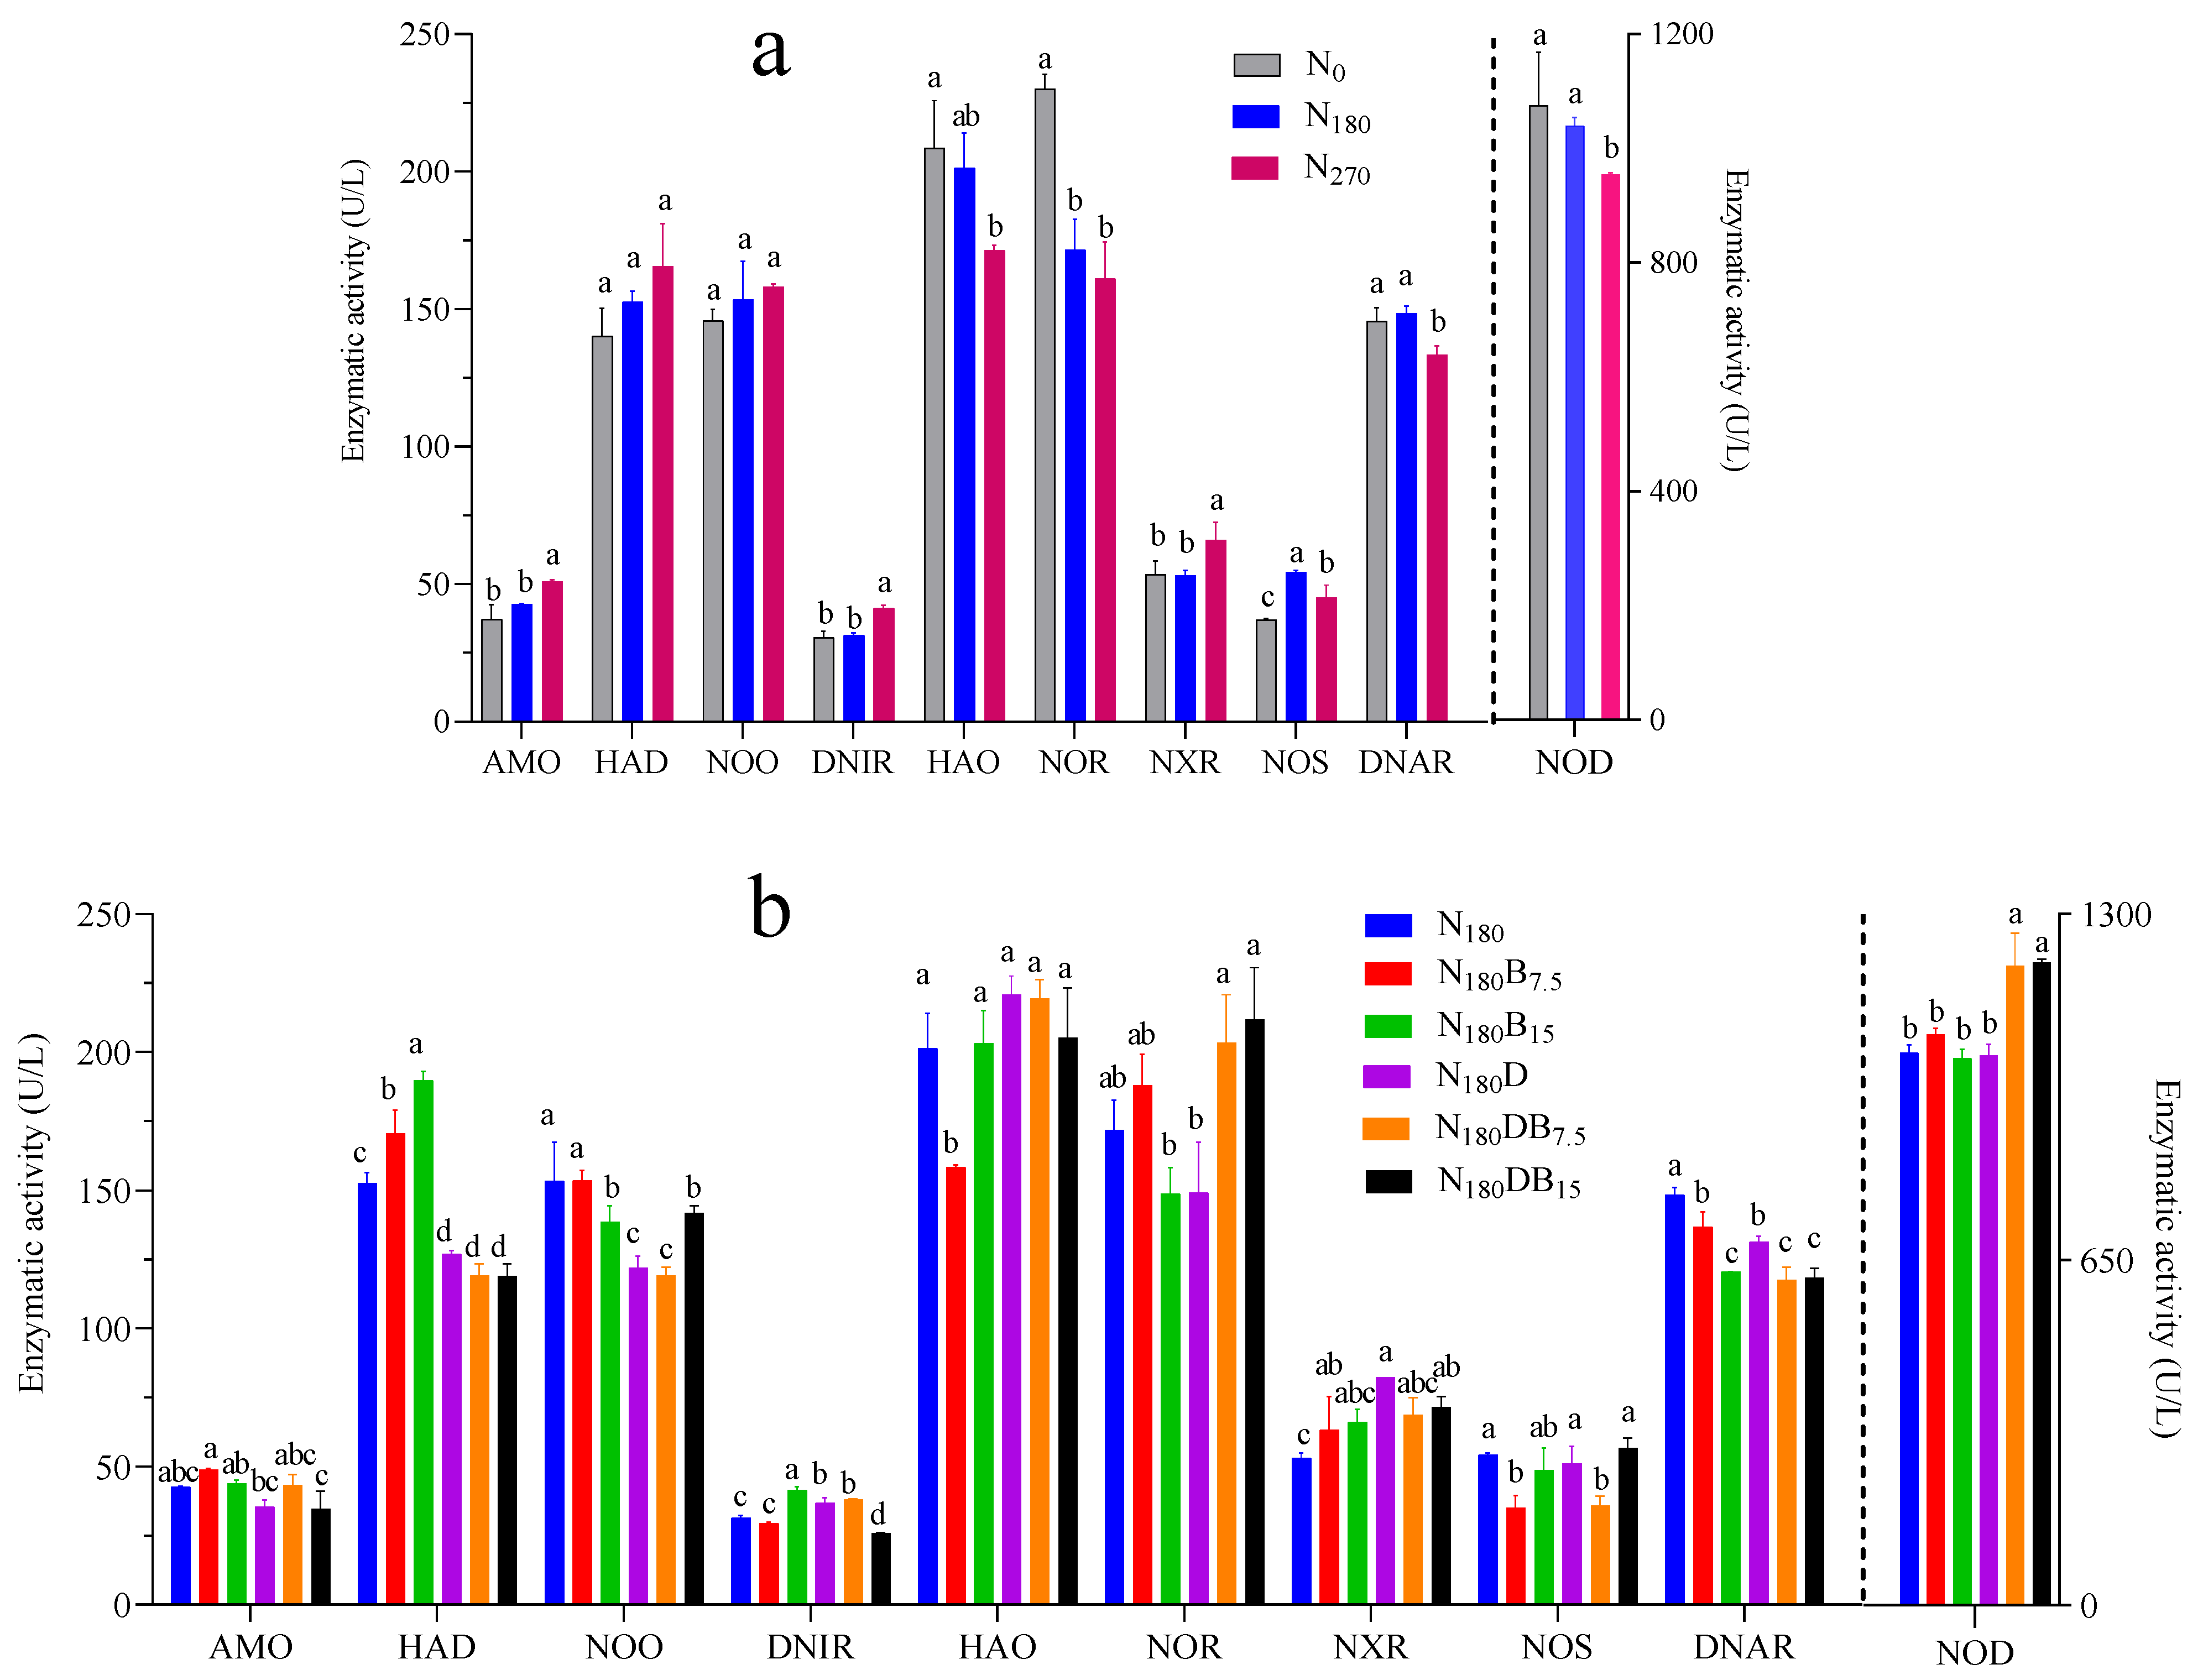
3.5. Enzyme Activities Associated with Soil N Cycling

The activities of AMO, HAD, NOO, and DNIR exhibited an enhancement with increasing nitrogen application rates (Figure 7a). The N180B7.5 treatment resulted in increased AMO activity, whereas the N180D and N180DB15 treatments led to its inhibition significantly. The application of biochar alone led to a significant enhancement in HAD activity, whereas all treatments that included DMPP substantially suppressed HAD activity. Compared with the N180 treatment, both biochar and DMPP significantly inhibited NOO activity, except for the N180B7.5 treatment. DNIR activity was inhibited significantly under the N180B15, N180D, and N180DB7.5 treatments (Figure 7b).
The activities of HAO, NOR, and NOD exhibited a gradual decline concomitant with an increase in the N application rate. Compared with the N180 treatment, the N180B7.5 treatment significantly suppressed HAO activity, whereas the other biochar or DMPP treatments exhibited a marginal enhancement of HAO activity. Both the N180DB7.5 and N180DB15 treatments significantly enhanced NOR and NOD activities in comparison with the N180 treatments.
The activities of NOS and DNAR exhibited an initial increase followed by a subsequent decline in response to the escalating nitrogen application rates. All treatments involving biochar or DMPP led to an increase in NXR activity while simultaneously suppressing DNAR activity compared to that observed in the N180 treatment.

3.6. Grain Yield and NUE

The grain yield significantly increased with the application rate of N, whereas the NUE decreased; the NUE of the N270 treatment was 7% lower than that of the N180 treatment. Application of DMPP alone increased NUE by 63%, but its contribution to grain yield increment was relatively small. Biochar application, either alone or in combination with DMPP, resulted in a notable enhancement of grain yield and NUE (Table 3).

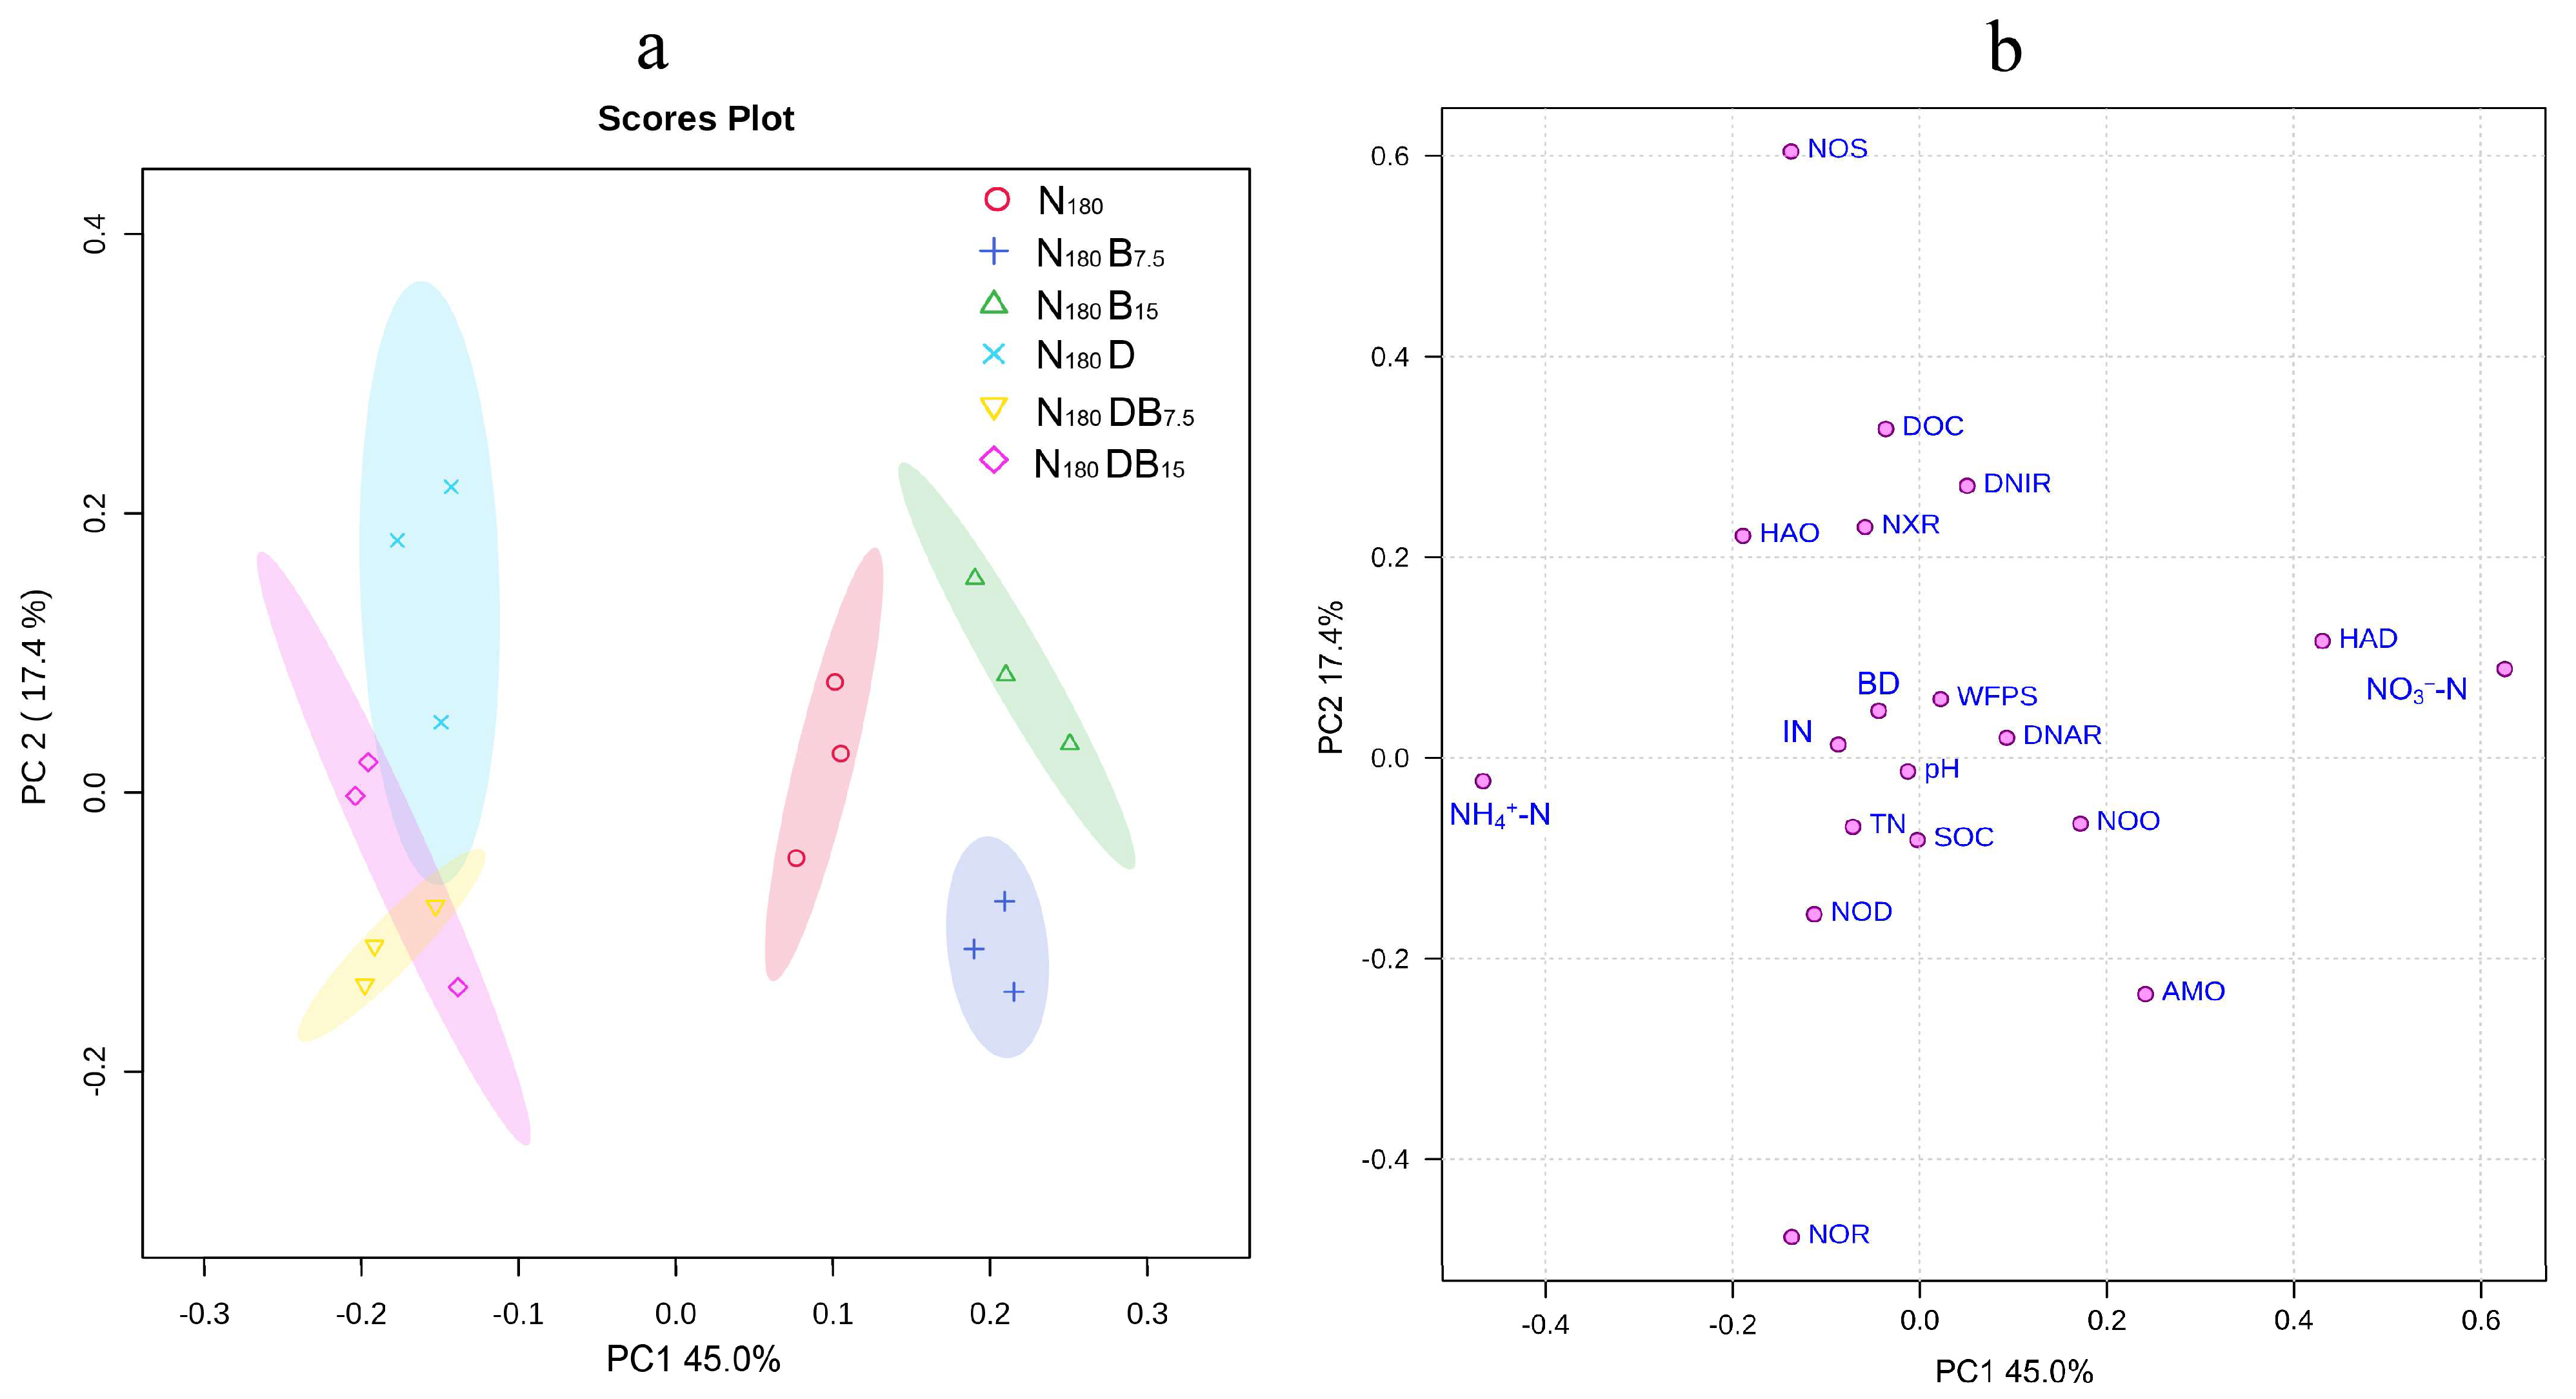
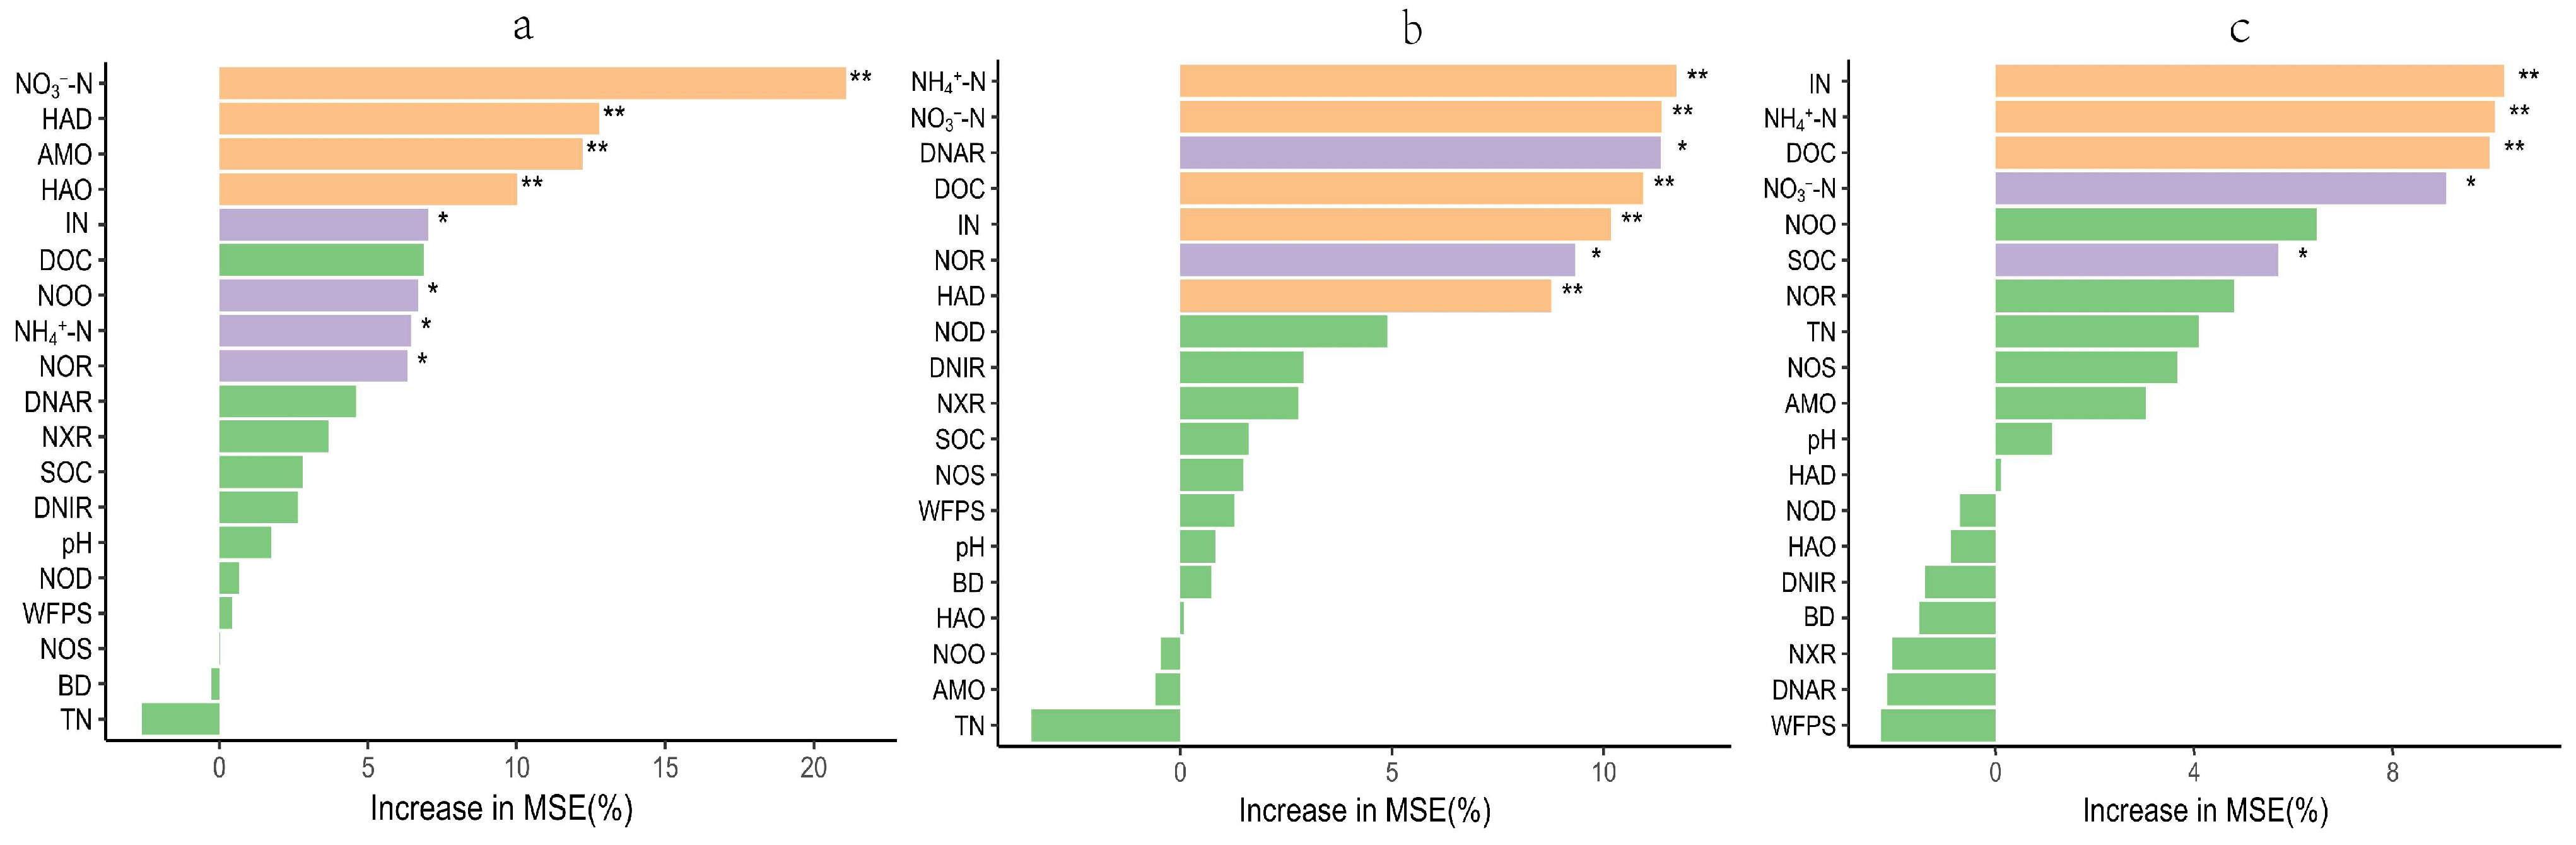
3.7. Principal Component Analysis and Random Forest Algorithm

The impacts of DMPP and biochar treatments on gaseous emissions, enzyme activity, and soil properties were assessed by conducting a principal component analysis (PCA). The first and second principal components (PC1 and PC2) explained 45% and 17% of the total variation, respectively. Both single and combined DMPP and biochar treatments were significantly separated from N180, according to PC1. Single biochar treatments (N180B7.5, N180B15) were significantly separated, whereas all DMPP addition treatments (N180D, N180DB7.5, N180DB15) exhibited aggregation (Figure 8a). NO3-N, NH4+-N, HAD, AMO, and HAO significantly contributed to PC1, whereas NOS, NOR, DOC, and DNIR significantly contributed to PC2 (Figure 8b). The random forest analysis indicated that the most critical variables affecting N2O emissions were NO3-N, HAD, AMO, HAO, IN, NOO, NH4+-N, and NOR (Figure 9a); NH4+-N, NO3-N, DNAR, DOC, IN, NOR, and HAD were the strongest predictors of NH3 emissions (Figure 9b); while CO2 emissions were remarkable, predicted by IN, NH4+-N, DOC, NO3-N, and SOC (Figure 9c). A significant interaction between biochar and DMPP was observed regarding N2O and NH3 emissions. DMPP exhibited a significant effect on N2O emissions, while biochar had a significant effect on N2O emissions and grain yield (Table 4).

4. Discussion

4.1. Impact of Biochar on N2O and NH3 Emissions

The findings of previous studies are inconsistent with regard to the response of N2O emissions to biochar in agricultural fields. Agegnehu et al. (2016) reported that the addition of willow wood biochar with compost stimulated N2O emissions exceeding those in response to conventional fertilizer treatment [39]. A meta-analysis of 56 publications revealed that biochar addition leads to a significant decrease in soil N2O emissions by approximately 28% ± 16% under field conditions. Notably, when tested in controlled laboratory settings, this reduction further increased to an impressive 54% ± 5% [40]. The present results revealed that the application of biochar led to an increase in soil N2O emissions. This observation may be associated with the specific type of biochar utilized in this experiment, which was produced at a pyrolysis temperature of 450 °C. Liu et al. (2024) reported that biochar produced at temperatures between 400 and 500 °C facilitates nitrification in the soil more effectively than biochar produced at other pyrolysis temperatures [41]. Furthermore, we observed that the lower dosage of biochar (7.5 t ha−1) elicited a more pronounced stimulation of N2O emissions than the higher dosage (15 t ha−1), which contradicts the findings reported by Troy et al. (2013) [42]. Maljanen et al. (2003) reported that denitrification played an important role in contributing to elevated soil N2O fluxes within the WFPS range of 70–90%, whereas N2O emissions resulting from nitrification were predominantly observed within a WFPS range of 30–70% [43]. The present results revealed an increase in N2O emissions in response to topdressing rather than initial N fertilization. The WFPS for the two peak N2O fluxes during the initial and topdressing N fertilizer periods were 54% and 71%, respectively. The highest N2O emissions were predominantly observed at WFPS, from 47% to 78%.
The enzymes AMO, HAD, and NXR play crucial roles in nitrification. Their activities serve as reliable indicators of soil nitrification intensity [44]. This study found that the low biochar amendment (N180B7.5) significantly enhanced AMO and HAD enzyme activity while also slightly increasing NXR activities. In contrast, the high biochar amendment (N180B15) markedly elevated NXR and HAD activity, however, its effect on AMO activity was less pronounced than that observed with the N180B7.5 treatment. This observation elucidates how varying ratios of biochar input affect N2O emissions. In the current study, CE-N2O under the N180B7.5 treatment was significantly higher, whereas CE-N2O under the N180B15 treatment exhibited a slight increase compared to those in the N180 treatment. We inferred that the increase in N2O emissions from biochar application was primarily due to enhanced nitrification rates in soil. Various ratios of biochar application exert distinct effects on the activity of enzymes involved in nitrification. This conclusion is supported by Feng et al. (2017), who suggested that biochar addition led to enhanced nitrification in cases where the total carbon/inorganic nitrogen ratio was comparatively low (<45), leading to a rise in N2O emissions [45]. Furthermore, it is plausible that a portion of the N2O emission observed in the present study could be attributed to denitrification [41]. The present findings showed that biochar addition induces augmentation of denitrifying enzyme activity (e.g., DNAR), thereby enhancing denitrification. The biochar treatments resulted in a significant increase in the DOC content compared with that of the control, thereby serving as an energy source for denitrification and subsequent stimulation of N2O emissions [46]. In summary, we contend that biochar-mediated nitrification plays a dominant role in stimulating N2O emission, whereas the increase in denitrification is primarily driven by the augmentation of N substrates, particularly NO3-N.
Liu et al. (2020) emphasized the importance of incorporating time as a dynamic factor when assessing the impact of biochar on N2O emissions [47]. The duration of the beneficial effects of biochar on the abundance and function of AOB was limited to approximately 1 month [48]. Therefore, it can be inferred that the long-term impact of biochar on AOB abundance may not be maintained. The accumulated N2O emissions under the N180B7.5 treatment were 1.36 and 1.14 times higher than those observed under the N180 treatment during the initial and topdressing fertilization periods, respectively. This finding is supported by Singh et al. (2010), who conducted a 5-month incubation experiment and observed an initial increase in soil N2O emissions upon application of manure biochar, but no significant impact was observed at a subsequent stage [49]. Therefore, we argue that the priming effect of biochar on N2O emissions is predominantly observed in the initial year following its application.
The present study confirmed that the introduction of biochar led to an increase in NH3 emissions, with a respective rise in NH3 emissions by 12% and 16% in the N180B7.5 and N180B15 treatments, respectively. Analogous findings were reported by Feng et al. (2017), whereby NH3 cumulative emissions under 3 wt % and 0.5 wt % biochar treatments exhibited a respective increase of 1.25 and 1.71 times compared with that without biochar amendment [50]. In contrast, Feng et al. (2022) demonstrated that incorporating aging biochar effectively mitigates NH3 volatilization [51]. The impact of biochar characteristics on the stimulation of NH3 volatilization was significant [52]. The biochar surface is enriched with a substantial quantity of carbonate and acidic functional groups, resulting in a reduction of H+ ions and an increase in soil pH [53]. Consistent with previous research, the current study detected a significant elevation in soil pH by 0.19–0.2 units subsequent to the introduction of biochar. We propose that the NH3 volatilization triggered by biochar application can be ascribed to the resultant elevation in soil pH.

4.2. Responses of N2O, CO2, and NH3 Emissions to DMPP and Biochar

The addition of DMPP decreased N2O emissions significantly. This result was consistent with the report of Gilsanz et al. (2016), who suggested that the simultaneous application of N with DMPP was a valid measure for the reduction of N2O emissions in agricultural systems [54]. However, the inhibitory effect varies greatly among studies and is impacted by soil properties [55]. The present study revealed that the addition of DMPP alone significantly suppressed the activities of AMO (Figure 7), thereby effectively inhibiting a crucial step in the nitrification process. The co-application of DMPP and biochar results in a 37–38% reduction in N2O emissions, compared to a 32% reduction observed with DMPP alone. Li et al. (2023) reported similar findings, suggesting that the simultaneous application of biochar with DMPP effectively suppresses ammonia oxidation, leading to a reduction in N2O emissions in the soil through synergistic effects [16]. We observed a significant reduction in the activities of HAD involved in the initial step of nitrification when DMPP and biochar were applied together; however, NXR activity was stimulated during the second step of nitrification. Significant inhibition of enzyme activity in the first step of nitrification resulted in a significant reduction in soil NO3-N content and amount of denitrification substrate, thus impacting the activity of denitrifying bacteria. Similarly, we observed significant inhibition of DNAR activity during denitrification. However, a notable increase in the activity of two other denitrification enzymes (NOR and NOD) was observed [56]. Notably, NOR dominates the conversion of NO to N2O, whereas NOD plays a dominant role in converting NO2-N to NO. Nevertheless, given the sharp reduction in substrate availability for denitrification, the emission of N2O induced by denitrification is limited. Random forest analysis further indicated that, among the variables influencing N2O emissions, enzymes associated with nitrification were the primary contributors (Figure 9a). Consequently, we propose that nitrification processes primarily contribute to N2O emissions in the present study area. In addition, we suggest that the mechanism underlying the reduction of N2O emissions through DMPP and biochar co-application mainly stems from their effective restriction on the initial step of nitrification. The impact of DMPP on the activity of nitrifying and denitrifying bacteria in diverse soil types, particularly when applied with and without biochar, requires further microbiological experiments for quantitative evaluation.
In the context of dryland agriculture, biochar significantly mitigates net CO2 exchange from ecosystems during crop production, with reductions ranging from 144% to 283% [57]. The present field experiment indicated elevated soil temperatures may have played a role in contributing to CO2 emissions (Figure 3 and Figure S1b). The increase in ground temperature stimulates the respiration of wheat roots and soil microorganisms. Interestingly, the CO2 emissions from wheat soil decreased with the increase in N input. This finding was supported by Al-Kaisi et al. (2008), who observed that the highest CO2 emissions were in the N0 treatment, and the lowest CO2 emissions were observed with the higher N application rate [58]. In the current study, all N treatments significantly stimulated CO2 emissions compared with those of the N0 treatment. Yang et al. (2022) conducted a meta-analysis of 67 publications and concluded that N fertilizer, in combination with NIs, can reduce CO2 emissions by approximately 9% [59]. Shakoor et al. (2021) reported that biochar had a significant effect in mitigating CO2 emissions from a maize crop [60]. Zhang et al. (2018) reported that biochar pyrolyzed at moderate temperatures (450–600 °C) results in limited inhibitory effects on CO2 emissions and may possess the potential to stimulate CO2 emissions [61]. We observed that treatments with DMPP or biochar slightly reduced CO2 emissions, although the inhibitory effect was not significant.
The suppression of AOB activity, particularly Nitrosomonas species, constitutes the underlying mechanism by which DMPP hinders the conversion of NH4+-N to NO2-N and retards the microbial transformation of soil NH4+-N into NO3-N [62]. The present study confirmed that treatment with DMPP effectively inhibited the activity of enzymes (e.g., HAD and NOO) involved in soil nitrification, resulting in a significant increase in soil NH4+-N content and consequently exacerbating the risk associated with NH3 volatilization. Gao et al. (2021) performed a meta-analysis and noted that DMPP significantly stimulates NH3 volatilization by 43% [63]. Similarly, we observed that the application of DMPP alone (N180D) stimulated NH3 emissions by 9% compared with that of the N180 treatment. A high-pH soil environment promotes acceleration of ammonification and thus is likely to promote NH3 volatilization. However, the present findings revealed a remarkable negative correlation between soil pH and NH3 loss (Figure 5b). The co-application of DMPP and biochar resulted in an increase in the soil pH while mitigating NH3 emission by 13–14%, indicating that the reduction in NH3 emissions cannot be solely attributed to the elevated soil pH; rather, it is likely due to the high NH4+/NH3 uptake attribute of biochar. Taghizadeh-Toosi et al. (2012) similarly observed that the addition of biochar (30 t ha−1) reduced NH3 emissions in animal urine by 45%, which was attributed to the enhanced adsorption capacity of biochar with numerous functional groups for NH3 capture [64]. Co-application of DMPP and biochar resulted in increased NH4+ in the soil, subsequently resulting in NH4+ fixation by microorganisms induced by biochar, and promoted conversion of NH3 to NH4+ driven by protonation induced by biochar to reduce NH3 volatilization [65]. Thus, we conclude that the combination of DMPP and biochar effectively reduced NH3 volatilization while suppressing the stimulation of NH3 emissions induced by the addition of DMPP or biochar alone.

4.3. Responses of Soil Indexes and Crop Productivity to Biochar and DMPP

The application of N led to a significant increase in SOC. In contrast, the absence of N input resulted in a substantial decline in SOC. These findings imply that the equilibrium of organic carbon within the soil was unstable, possibly due to a notable reduction in crop residues under no N addition [35]. The application of biochar significantly enhanced SOC by 5.4–7.1% compared with that of the N180 treatment. This finding was supported by Hu et al. (2021), who observed that biochar addition at dosages of 8 and 16 t ha−1 resulted in increases in SOC by approximately 40% and 41%, respectively [66]. The increase in SOC resulting from biochar application can primarily be attributed to its inherent characteristics and interactions with the soil, including its exceptional resistance to decomposition [27] and its ability to enhance soil quality while reducing bulk density, thus effectively mitigating the negative impact of soil structure on wheat root growth [67]. In addition, biochar confers benefits with regard to soil nutrient retention and provision whilst concurrently augmenting the soil cation exchange capacity [68]. Incorporation of wheat straw biochar at dosages of 5, 10, and 20 t ha−1 improves wheat aboveground N uptake by 24–35% and grain yield by 10–33% [14]. The present findings demonstrated that biochar addition effectively enhanced grain production and NUE, particularly at higher input rates. In addition, biochar amendment stimulated NH3 emissions and enhanced soil NO3-N, which is consistent with the results of Borchard et al. (2019) [69]. The mechanisms responsible for increased NO3-N were associated with sorption and entrapment within the porous structure of the biochar.
The incorporation of DMPP resulted in a notable improvement in NUE of 11% but only resulted in a modest increase in grain yield by 3% in this study, indicating that it was extremely difficult to achieve both yield preservation and reduction of N input from 270 to 180 kg N ha−1 solely through the addition of DMPP. In contrast, some scholars reported that ammonium sulfate applied in conjunction with DMPP effectively improved NUE during a 3-year rotation and achieved a reduction in N input from 170 to 130 kg N hm−1 in the second year without a negative impact on yield [70]. Disparities in the observed effects on yield enhancement probably reflect variations in the crop-specific response to DMPP under diverse environmental conditions. It is worth mentioning that the wheat yield and NUE were further enhanced by the combination of DMPP and biochar, particularly in the N180DB15 treatment.

5. Conclusions

The N2O and NH3 emissions in response to biochar and DMPP application were significantly altered under a delayed N application regime. Compared with conventional N application (270 t ha−1), reduced N application (180 t ha−1) applied in combination with DMPP significantly reduced N2O emission by 31%. In contrast, biochar application at 7.5 t ha−1 resulted in a 24% increase in N2O emissions, whereas application at 15 t ha−1 had minimal impact on N2O emissions. The application of N with DMPP or biochar stimulates NH3 emissions. All N treatments significantly stimulated CO2 emissions, whereas all treatments, including the addition of biochar or DMPP, slightly reduced CO2 emissions, although the inhibitory effect was not significant. Combined application of DMPP and biochar mitigated N2O and NH3 emissions and had a significant interaction effect on soil NH3 and N2O emissions. Biochar applied either alone or in combination with DMPP effectively enhanced grain yield and NUE. In summary, under a delayed and reduced N application regime, the combined application of DMPP and 15 t ha−1 biochar is the optimal strategy to reduce GHG and NH3 emissions, improve NUE, and increase grain yield. However, the findings of this experiment were validated solely during one growing season of wheat crops; further long-term field experiments are needed incorporating different types of soil and environmental factors to evaluate the synergistic mechanism of biochar and NIs at different levels and to elucidate the effects of applying NIs and biochar on N2O, CO2, and NH3 emissions, and crop yield.

Supplementary Materials

The following supporting information can be downloaded at: https://www.mdpi.com/article/10.3390/agriculture14111986/s1. Figure S1. Standard curve for the enzymatic activity involved in the nitrogen cycle. AMO, ammonia monooxygenase; HAD, hydroxylamine dehydrogenase; HAO, hydroxylamine oxidase; NXR, nitrite oxidoreductase; NOS, nitrous oxide reductase; NOR, nitric oxide reductase; NOD, nitric oxide dismutase; NOO, nitric oxide oxidase; DNAR, denitrifying nitrate reductase, DNIR, denitrifying nitrite reductase. Figure S2. Variations in meteorological indexes (a) and soil temperature (b) after application of N fertilizer. Figure S3. Variations of WFPS (c) after application of N fertilizer. Figure S4. Scatterplots for N2O fluxes and soil WFPS with fitted exponential model. The dashed blue area indicates the highest N2O flux observed in the range of 47–78% WFPS. The red area denotes the 95% confidence interval of the regression line. Table S1. Materials provided with the kit. Table S2. Enzyme activity assay procedure. Table S3. The average levels of NH4+-N, NO3-N, IN, and DOC in soil samples under various treatments following the application of N fertilization until wheat harvest. Table S4. ANOVA results should be presented for all major comparisons.

Author Contributions

H.W.: Data curation, Formal analysis, Funding acquisition, Writing—review and editing, Writing—original draft. D.W.: Investigation, Visualization, Writing—original draft. D.Z.: Investigation, Visualization, Writing—original draft. W.R.: Visualization, Writing—original draft. Q.Y.: Visualization, Writing—original draft. X.S.: Visualization, Writing—original draft. G.M.: Project administration. X.J.: Supervision. S.L.: Funding acquisition, Supervision, Writing—review and editing. All authors have read and agreed to the published version of the manuscript.

Funding

This research was funded by the National Key Research and Development Program of China (grant number 2021YFD1700900; grant number 2023YFD1900203).

Data Availability Statement

Data are contained within the article and Supplementary Material.

Conflicts of Interest

The authors declare no conflicts of interest.

References

  1. Stevens, C.J. Nitrogen in the environment. Science 2019, 363, 578–580. [Google Scholar] [CrossRef] [PubMed]
  2. Tian, H.; Xu, R.; Canadell, J.G.; Thompson, R.L.; Winiwarter, W.; Suntharalingam, P.; Davidson, E.A.; Ciais, P.; Jackson, R.B.; Janssens-Maenhout, G.; et al. A comprehensive quantification of global nitrous oxide sources and sinks. Nature 2020, 586, 248–256. [Google Scholar] [CrossRef]
  3. Bahram, M.; Espenberg, M.; Pärn, J.; Lehtovirta-Morley, L.; Anslan, S.; Kasak, K.; Koljalg, U.; Liira, J.; Maddison, M.; Moora, M.; et al. Structure and function of the soil microbiome underlying N2O emissions from global wetlands. Nat. Commun. 2022, 13, 1430. [Google Scholar] [CrossRef] [PubMed]
  4. Shakoor, A.; Shakoor, S.; Rehman, A.; Ashraf, F.; Abdullah, M.; Shahzad, S.M.; Farooq, T.H.; Ashraf, M.; Manzoor, M.A.; Altaf, M.M.; et al. Effect of animal manure, crop type, climate zone, and soil attributes on greenhouse gas emissions from agricultural soils—A global meta-analysis. J. Clean. Prod. 2021, 278, 124019. [Google Scholar] [CrossRef]
  5. Hong, C.; Burney, J.A.; Pongratz, J.; Nabel, J.E.; Mueller, N.D.; Jackson, R.B.; Davis, S.J. Global and regional drivers of land-use emissions in 1961–2017. Nature 2021, 589, 554–561. [Google Scholar] [CrossRef]
  6. Mikhael, J.E.R.; Wang, J.J.; Dodla, S.; Scaglia, G.; Dattamudi, S. Effects of biochar and N-stabilizers on greenhouse gas emissions from a subtropical pasture field applied with organic and inorganic nitrogen fertilizers. J. Environ. Manag. 2022, 306, 114423. [Google Scholar] [CrossRef]
  7. Cui, H.; Zhu, H.; Zhang, F.M.; Wang, X.Y.; Hou, S.N.; Feng, W.D. Soil amendments reduce CH4 and CO2 but increase N2O and NH3 emissions in saline-alkali paddy fields. Sci. Total Environ. 2024, 924, 171673. [Google Scholar] [CrossRef]
  8. Yang, S.L.; Wang, M.Y.; Wang, W.J.; Zhang, X.C.; Han, Q.; Wang, H.F.; Xiong, Q.Q.; Zhang, C.H.; Wang, M.S. Establishing an emission inventory for ammonia, a key driver of haze formation in the southern North China plain during the COVID-19 pandemic. Sci. Total Environ. 2023, 904, 166857. [Google Scholar] [CrossRef]
  9. Ma, R.; Zou, J.; Han, Z.; Yu, K.; Wu, S.; Li, Z.; Liu, S.; Niu, S.; Horwath, W.R.; Zhu-Barker, X. Global soil-derived ammonia emissions from agricultural nitrogen fertilizer application: A refinement based on regional and crop-specific emission factors. Glob. Chang. Biol. 2021, 27, 855–867. [Google Scholar] [CrossRef]
  10. Chen, D.Y.; Liu, H.; Ning, Y.W.; Xu, C.; Zhang, H.; Lu, X.Y.; Wang, J.D.; Xu, X.J.; Feng, Y.Y.; Zhang, Y.C. Reduced nitrogen fertilization under flooded conditions cut down soil N2O and CO2 efflux: An incubation experiment. J. Environ. Manag. 2022, 324, 116335. [Google Scholar] [CrossRef]
  11. Sui, B.; Feng, X.; Tian, G.; Hu, X.; Shen, Q.; Guo, S. Optimizing nitrogen supply increases rice yield and nitrogen use efficiency by regulating yield formation factors. Field Crop. Res. 2013, 150, 99–107. [Google Scholar] [CrossRef]
  12. Wang, G.; Luo, Z.; Wang, E.; Zhang, W. Reducing greenhouse gas emissions while maintaining yield in the croplands of Huang-Huai-Hai Plain, China. Agric. For. Meteorol. 2018, 260, 80–94. [Google Scholar] [CrossRef]
  13. Duan, J.Z.; Shao, Y.H.; He, L.; Li, X.; Hou, G.G.; Li, S.N.; Feng, W.; Zhu, Y.J.; Wang, Y.H.; Xie, Y.X. Optimizing nitrogen management to achieve high yield, high nitrogen efficiency and low nitrogen emission in winter wheat. Sci. Total Environ. 2019, 697, 134088. [Google Scholar] [CrossRef] [PubMed]
  14. Li, W.; Xie, H.; Ren, Z.; Li, T.; Wen, X.; Han, J.; Liao, Y. Response of N2O emissions to N fertilizer reduction combined with biochar application in a rain-fed winter wheat ecosystem. Agric. Ecosyst. Environ. 2022, 333, 107968. [Google Scholar] [CrossRef]
  15. Guardia, G.; Sanz-Cobena, A.; Sanchez-Martín, L.; Fuertes-Mendizábal, T.; González-Murua, C.; Álvarez, J.M.; Chadwick, D.; Vallejo, A. Urea-based fertilization strategies to reduce yield-scaled N oxides and enhance bread-making quality in a rainfed Mediterranean wheat crop. Agric. Ecosyst. Environ. 2018, 265, 421–431. [Google Scholar] [CrossRef]
  16. Li, Z.; Xu, P.; Han, Z.; Wu, J.; Bo, X.; Wang, J.; Zou, J. Effect of biochar and DMPP application alone or in combination on nitrous oxide emissions differed by soil types. Biol. Fertil. Soils. 2023, 59, 123–138. [Google Scholar] [CrossRef]
  17. Cassman, N.A.; Soares, J.R.; Pijl, A.; Lourenço, K.S.; van Veen, J.A.; Cantarella, H.; Kuramae, E.E. Nitrification inhibitors effectively target N2O-producing Nitrosospira spp. in tropical soil. Environ. Microbiol. 2019, 21, 1241–1254. [Google Scholar] [CrossRef] [PubMed]
  18. Zhou, X.; Wang, S.; Ma, S.; Zheng, X.; Wang, Z.; Lu, C. Effects of commonly used nitrification inhibitors—Dicyandiamide (DCD), 3,4-dimethylpyrazole phosphate (DMPP), and nitrapyrin—On soil nitrogen dynamics and nitrifiers in three typical paddy soils. Geoderma 2020, 380, 114637. [Google Scholar] [CrossRef]
  19. Wu, D.; Zhang, Y.X.; Dong, G.; Du, Z.L.; Wu, W.L.; Chadwick, D.; Bol, R. The importance of ammonia volatilization in estimating the efficacy of nitrification inhibitors to reduce N2O emissions: A global meta-analysis. Environ. Pollut. 2021, 271, 116365. [Google Scholar] [CrossRef]
  20. Tufail, M.A.; Irfan, M.; Umar, W.; Wakeel, A.; Schmitz, R.A. Mediation of gaseous emissions and improving plant productivity by DCD and DMPP nitrification inhibitors: Meta-analysis of last three decades. Environ. Sci. Pollut. Res. 2023, 30, 64719–64735. [Google Scholar] [CrossRef]
  21. Li, S.; Sha, Z.; Zhang, X.; Lv, J.; Chen, X.; Yang, Q. Fertilizers inclusion with nitrification inhibitors alleviate soil CO2 emissions: A meta-analysis study. J. Soil. Sediment. 2023, 23, 2011–2020. [Google Scholar] [CrossRef]
  22. Menéndez, S.; Barrena, I.; Setien, I.; González-Murua, C.; Estavillo, J.M. Efficiency of nitrification inhibitor DMPP to reduce nitrous oxide emissions under different temperature and moisture conditions. Soil. Biol. Biochem. 2012, 53, 82–89. [Google Scholar] [CrossRef]
  23. Wang, D.; Fonte, S.J.; Parikh, S.J.; Six, J.; Scow, K.M. Biochar additions can enhance soil structure and the physical stabilization of C in aggregates. Geoderma 2017, 303, 110–117. [Google Scholar] [CrossRef] [PubMed]
  24. Taghizadeh-Toosi, A.; Clough, T.J.; Condron, L.M.; Sherlock, R.R.; Anderson, C.R.; Craigie, R.A. Biochar incorporation into pasture soil suppresses in situ nitrous oxide emissions from ruminant urine patches. J. Environ. Qual. 2011, 40, 468–476. [Google Scholar] [CrossRef]
  25. Sun, H.J.; Lu, H.Y.; Chu, L.; Shao, H.B.; Shi, W.M. Biochar applied with appropriate rates can reduce N leaching, keep N retention and not increase NH3 volatilization in a coastal saline soil. Sci. Total Environ. 2017, 575, 820–825. [Google Scholar] [CrossRef]
  26. He, T.; Yuan, J.; Xiang, J.; Lin, Y.; Luo, J.; Lindsey, S.; Liao, X.; Liu, D.; Ding, W. Combined biochar and double inhibitor application offsets NH3 and N2O emissions and mitigates N leaching in paddy fields. Environ. Pollut. 2022, 292, 118344. [Google Scholar] [CrossRef]
  27. Huang, M.; Wang, C.; Qi, W.; Zhang, Z.; Xu, H. Modelling the integrated strategies of deficit irrigation, nitrogen fertilization, and biochar addition for winter wheat by AquaCrop based on a two-year field study. Field Crops Res. 2022, 282, 108510. [Google Scholar] [CrossRef]
  28. Chintala, R.; Schumacher, T.E.; Kumar, S.; Malo, D.D.; Rice, J.A.; Bleakley, B.; Chilom, G.; Clay, D.E.; Julson, J.L.; Papiernik, S.K.; et al. Molecular characterization of biochars and their influence on microbiological properties of soil. J. Hazard. Mater. 2014, 279, 244–256. [Google Scholar] [CrossRef]
  29. Wang, J.; Pan, X.; Liu, Y.; Zhang, X.; Xiong, Z. Effects of biochar amendment in two soils on greenhouse gas emissions and crop production. Plant Soil 2012, 360, 287–298. [Google Scholar] [CrossRef]
  30. Wu, Z.; Zhang, Q.; Zhang, X.; Duan, P.; Yan, X.; Xiong, Z. Biochar-enriched soil mitigated N2O and NO emissions similarly as fresh biochar for wheat production. Sci. Total Environ. 2020, 701, 134943. [Google Scholar] [CrossRef]
  31. De Santis, M.A.; Giuliani, M.M.; Flagella, Z.; Reyneri, A.; Blandino, M. Impact of nitrogen fertilisation strategies on the protein content, gluten composition and rheological properties of wheat for biscuit production. Field Crop. Res. 2020, 254, 107829. [Google Scholar] [CrossRef]
  32. Malhi, S.S.; Grant, C.A.; Johnston, A.M.; Gill, K.S. Nitrogen fertilization management for no-till cereal production in the Canadian Great Plains: A review. Soil Tillage Res. 2001, 60, 101–122. [Google Scholar] [CrossRef]
  33. Thilakarathna, S.K.; Hernandez-Ramirez, G.; Puurveen, D.; Kryzanowski, L.; Lohstraeter, G.; Powers, L.A.; Quan, N.; Tenuta, M. Nitrous oxide emissions and nitrogen use efficiency in wheat: Nitrogen fertilization timing and formulation, soil nitrogen, and weather effects. Soil Sci. Soc. Am. J. 2020, 84, 1910–1927. [Google Scholar] [CrossRef]
  34. Ravier, C.; Meynard, J.M.; Cohan, J.P.; Gate, P.; Jeuffroy, M.H. Early nitrogen deficiencies favor high yield, grain protein content and N use efficiency in wheat. Eur. J. Agron. 2017, 89, 16–24. [Google Scholar] [CrossRef]
  35. He, T.; Liu, D.; Yuan, J.; Luo, J.; Lindsey, S.; Bolan, N.; Ding, W. Effects of application of inhibitors and biochar to fertilizer on gaseous nitrogen emissions from an intensively managed wheat field. Sci. Total Environ. 2018, 628, 121–130. [Google Scholar] [CrossRef]
  36. Sun, G.L.; Zhang, Z.G.; Xiong, S.W.; Guo, X.Y.; Han, Y.C.; Wang, G.P.; Feng, L.; Lei, Y.P.; Li, X.F.; Yang, B.F.; et al. Mitigating greenhouse gas emissions and ammonia volatilization from cotton fields by integrating cover crops with reduced use of nitrogen fertilizer. Agric. Environ. Res. 2022, 332, 107946. [Google Scholar] [CrossRef]
  37. Lu, R.K. Soil Agricultural Chemistry Analysis; Chinese Agriculture and Technology Press: Beijing, China, 2000; pp. 13–14+108–109+147–149+168–169+181+194–195. (In Chinese) [Google Scholar]
  38. Liao, X.; Niu, Y.; Liu, D.; Chen, Z.; He, T.; Luo, J.; Lindsey, S.; Ding, W. Four-year continuous residual effects of biochar application to a sandy loam soil on crop yield and N2O and NO emissions under maize-wheat rotation. Agric. Ecosyst. Environ. 2020, 302, 107109. [Google Scholar] [CrossRef]
  39. Agegnehu, G.; Bass, A.M.; Nelson, P.N.; Bird, M.I. Benefits of biochar, compost and biochare compost for soil quality, maize yield and greenhouse gas emissions in a tropical agricultural soil. Sci. Total Environ. 2016, 543, 295–306. [Google Scholar] [CrossRef]
  40. Cayuela, M.L.; Jeffery, S.; van Zwieten, L. The molar H: Corg ratio of biochar is a key factor in mitigating N2O emissions from soil. Agric. Ecosyst. Environ. 2015, 202, 135–138. [Google Scholar] [CrossRef]
  41. Liu, Q.; Wu, Y.; Ma, J.; Jiang, J.; You, X.; Lv, R.; Zhou, S.; Pan, C.; Liu, B.; Xu, Q.; et al. How does biochar influence soil nitrification and nitrification-induced N2O emissions? Sci. Total Environ. 2024, 908, 168530. [Google Scholar] [CrossRef]
  42. Troy, S.M.; Lawlor, P.G.; O’Flynn, C.J.; Healy, M.G. Impact of biochar addition to soil on greenhouse gas emissions following pig manure application. Soil Biol. Biochem. 2013, 60, 173–181. [Google Scholar] [CrossRef]
  43. Maljanen, M.; Liikanen, A.; Silvola, J.; Martikainen, P.J. Nitrous oxide emissions from boreal organic soil under different land-use. Soil Biol. Biochem. 2003, 35, 689–700. [Google Scholar] [CrossRef]
  44. Sun, H.W.; Jiang, T.T.; Zhang, F.; Zhang, P.; Zhang, H.; Yang, H.; Lu, J.B.; Ge, S.J.; Ma, B.; Ding, J.; et al. Understanding the effect of free ammonia on microbial nitrification mechanisms in suspended activated sludge bioreactors. Environ. Res. 2021, 200, 111737. [Google Scholar] [CrossRef]
  45. Feng, Z.; Zhu, L. Impact of biochar on soil N2O emissions under different biochar-carbon/fertilizer-nitrogen ratios at a constant moisture condition on a silt loam soil. Sci. Total Environ. 2017, 584, 776–782. [Google Scholar] [CrossRef]
  46. Liu, J.; Shen, J.; Li, Y.; Su, Y.; Ge, T.; Jones, D.L.; Wu, J. Effects of biochar amendment on the net greenhouse gas emission and greenhouse gas intensity in a Chinese double rice cropping system. Eur. J. Soil Biol. 2014, 65, 30–39. [Google Scholar] [CrossRef]
  47. Liu, H.; Li, H.; Zhang, A.; Rahaman, M.A.; Yang, Z. Inhibited effect of biochar application on N2O emissions is amount and time-dependent by regulating denitrification in a wheat-maize rotation system in North China. Sci. Total Environ. 2020, 721, 137636. [Google Scholar] [CrossRef]
  48. Lin, Y.X.; Ding, W.X.; Liu, D.Y.; He, T.H.; Yoo, G.; Yuan, J.J.; Chen, Z.M.; Fan, J.L. Wheat straw-derived biochar amendment stimulated N2O emissions from rice paddy soils by regulating the amoA genes of ammonia-oxidizing bacteria. Soil Biol. Biochem. 2017, 113, 89–98. [Google Scholar] [CrossRef]
  49. Singh, B.P.; Hatton, B.J.; Singh, B.; Cowie, A.L.; Kathuria, A. Influence of biochars on nitrous oxide emission and nitrogen leaching from two contrasting soils. J. Environ. Qual. 2010, 39, 1224–1235. [Google Scholar] [CrossRef] [PubMed]
  50. Feng, Y.; Sun, H.; Xue, L.; Liu, Y.; Gao, Q.; Lu, K.; Yang, L. Biochar applied at an appropriate rate can avoid increasing NH3 volatilization dramatically in rice paddy soil. Chemosphere 2017, 168, 1277–1284. [Google Scholar] [CrossRef]
  51. Feng, Y.; Feng, Y.; Liu, Q.; Chen, S.; Hou, P.; Poinern, G.; Jiang, Z.T.; Fawcett, D.; Xue, L.H.; Lam, S.S.; et al. How does biochar aging affect NH3 volatilization and GHGs emissions from agricultural soils? Environ. Pollut. 2022, 294, 118598. [Google Scholar] [CrossRef]
  52. Sha, Z.; Li, Q.; Lv, T.; Misselbrook, T.; Liu, X. Response of ammonia volatilization to biochar addition: A meta-analysis. Sci. Total Environ. 2019, 655, 1387–1396. [Google Scholar] [CrossRef]
  53. Gul, S.; Whalen, J.K.; Thomas, B.W.; Sachdeva, V.; Deng, H. Physico-chemical properties and microbial responses in biochar-amended soils: Mechanisms and future directions. Agric. Ecosyst. Environ. 2015, 206, 46–59. [Google Scholar] [CrossRef]
  54. Gilsanz, C.; Báez, D.; Misselbrook, T.H.; Dhanoa, M.S.; Cárdenas, L.M. Development of emission factors and efficiency of two nitrification inhibitors, DCD and DMPP. Agric. Ecosyst. Environ. 2016, 216, 1–8. [Google Scholar] [CrossRef]
  55. McGeough, K.L.; Watson, C.J.; Müller, C.; Laughlin, R.J.; Chadwick, D.R. Evidence that the efficacy of the nitrification inhibitor dicyandiamide (DCD) is affected by soil properties in UK soils. Soil Biol. Biochem. 2016, 94, 222–232. [Google Scholar] [CrossRef]
  56. Lv, S.; Zheng, F.; Wang, Z.; Hayat, K.; Veiga, M.C.; Kennes, C.; Chen, J. Unveiling novel pathways and key contributors in the nitrogen cycle: Validation of enrichment and taxonomic characterization of oxygenic denitrifying microorganisms in environmental samples. Sci. Total Environ. 2024, 908, 168339. [Google Scholar] [CrossRef]
  57. Azeem, M.; Hayat, R.; Hussain, Q.; Ahmed, M.; Pan, G.; Tahir, M.I.; Imran, M.; Irfan, M.; Mehmood-ul-Hassan, M.U.H. Biochar improves soil quality and N2 fixation and reduces net ecosystem CO2 exchange in a dryland legume-cereal cropping system. Soil Tillage Res. 2019, 186, 172–182. [Google Scholar] [CrossRef]
  58. Al-Kaisi, M.M.; Kruse, M.L.; Sawyer, J.E. Effect of nitrogen fertilizer application on growing season soil carbon dioxide emission in a corn–soybean rotation. J. Environ. Qual. 2008, 37, 325–332. [Google Scholar] [CrossRef]
  59. Yang, M.; Hou, Z.; Guo, N.; Yang, E.; Sun, D.; Fang, Y. Effects of enhanced-efficiency nitrogen fertilizers on CH4 and CO2 emissions in a global perspective. Field Crop. Res. 2022, 288, 108694. [Google Scholar] [CrossRef]
  60. Shakoor, A.; Arif, M.S.; Shahzad, S.M.; Farooq, T.H.; Ashraf, F.; Altaf, M.M.; Ahmed, W.; Tufail, M.A.; Ashraf, M. Does biochar accelerate the mitigation of greenhouse gaseous emissions from agricultural soil? A global meta-analysis. Environ. Res. 2021, 202, 111789. [Google Scholar] [CrossRef]
  61. Zhang, L.; Jing, Y.; Xiang, Y.; Zhang, R.; Lu, H. Responses of soil microbial community structure changes and activities to biochar addition: A meta-analysis. Sci. Total Environ. 2018, 643, 926–935. [Google Scholar] [CrossRef]
  62. Yang, J.; Li, X.; Xu, L.; Hu, F.; Li, H.; Liu, M. Influence of the nitrification inhibitor DMPP on the community composition of ammonia-oxidizing bacteria at microsites with increasing distance from the fertilizer zone. Biol. Fertil. Soils 2013, 49, 23–30. [Google Scholar] [CrossRef]
  63. Gao, J.C.; Luo, J.F.; Lindsey, S.; Shi, Y.L.; Sun, Z.L.; Wei, Z.B.; Wang, L.L. Benefits and risks for the environment and crop production with application of nitrification inhibitors in China. J. Soil Sci. Plant Nutr. 2021, 21, 497–512. [Google Scholar] [CrossRef]
  64. Taghizadeh-Toosi, A.; Clough, T.J.; Sherlock, R.R.; Condron, L.M. A wood based low-temperature biochar captures NH3-N generated from ruminant urine-N, retaining its bioavailability. Plant Soil 2012, 353, 73–84. [Google Scholar] [CrossRef]
  65. Mandal, S.M.; Thangarajan, R.; Bolan, N.S.; Sarkar, B.; Khan, N.; Ok, Y.S.; Naidu, R. Biochar-induced concomitant decrease in ammonia volatilization and increase in nitrogen use efficiency by wheat. Chemosphere 2016, 142, 120–127. [Google Scholar] [CrossRef] [PubMed]
  66. Hu, Y.; Sun, B.; Wu, S.; Feng, H.; Gao, M.; Zhang, B.; Liu, Y. After-effects of straw and straw-derived biochar application on crop growth, yield, and soil properties in wheat (Triticum aestivum L.)-maize (Zea mays L.) rotations: A four-year field experiment. Sci. Total Environ. 2021, 780, 146560. [Google Scholar] [CrossRef]
  67. Olmo, M.; Lozano, A.M.; Barrón, V.; Villar, R. Spatial heterogeneity of soil biochar content affects soil quality and wheat growth and yield. Sci. Total Environ. 2016, 562, 690–700. [Google Scholar] [CrossRef]
  68. Adhikari, S.; Moon, E.; Timms, W. Identifying biochar production variables to maximise exchangeable cations and increase nutrient availability in soils. J. Clean. Prod. 2024, 446, 141454. [Google Scholar] [CrossRef]
  69. Borchard, N.; Schirrmann, M.; Cayuela, M.L.; Kammann, C.; Wrage-Mönnig, N.; Estavillo, J.M.; Fuertes-Mendizábal, T.; Sigua, G.; Spokas, K.; Ippolito, J.A.; et al. Biochar, soil and land-use interactions that reduce nitrate leaching and N2O emissions: A meta-analysis. Sci. Total Environ. 2019, 651, 2354–2364. [Google Scholar] [CrossRef]
  70. Alonso-Ayuso, M.; Gabriel, J.L.; Quemada, M. Nitrogen use efficiency and residual effect of fertilizers with nitrification inhibitors. Eur. J. Agron. 2016, 80, 1–8. [Google Scholar] [CrossRef]
Figure 1. Temporal fluctuations in NH4+-N (a), NO3-N (b), and DOC concentrations (c) within the topsoil (0–20 cm) following the application of N. The black arrow indicates the timing of the N application.
Agriculture 14 01986 g001
Figure 2. Dynamic variation in N2O emission following N application. The black arrow denotes the timing for the N application.
Agriculture 14 01986 g002
Figure 3. Dynamic variation in CO2 emission following N application. The black arrow denotes the timing for the N application.
Agriculture 14 01986 g003
Figure 4. Cumulative emissions of N2O (a), NH3 (b), and CO2 (c). Distinct letters denote differences among treatments in cumulative gas emission according to a Fisher HSD post-hoc test, α < 0.05.
Agriculture 14 01986 g004
Figure 5. Linear relationship of N2O (a) and NH3 (b) emissions with soil pH. The dotted line is expressed as the 95% confidence interval, and the red dots represent no N treatment and do not participate in regression analysis.
Agriculture 14 01986 g005
Figure 6. Temporal variation of NH3 fluxes following the initial (a) and subsequent (b) N applications.
Agriculture 14 01986 g006
Figure 7. Enzymatic activity (U/L) in the N cycle of soil under varying N input levels (a) and under all N180 treatments (b). Distinct letters denote differences among treatments according to a Fisher LSD post-hoc test. AMO, ammonia monooxygenase; HAD, hydroxylamine dehydrogenase; HAO, hydroxylamine oxidase; NXR, nitrite oxidoreductase; NOS, nitrous oxide reductase; NOR, nitric oxide reductase; NOD, nitric oxide dismutase; NOO, nitric oxide oxidase; DNAR, denitrifying nitrate reductase, DNIR, denitrifying nitrite reductase.
Agriculture 14 01986 g007
Figure 8. Principal component analysis (PCA) (a) and load diagram (b) for related indexes of enzyme activity and soil properties under different treatments.
Agriculture 14 01986 g008
Figure 9. Random forest analysis indicating the effects of soil properties and enzyme activity on N2O (a), NH3 (b), and CO2 (c). TN, total N; SOC, soil organic carbon; DOC, dissolved organic carbon; BD, bulk density; WFPS, water-filled pore space; AMO, ammonia monooxygenase; HAD, hydroxylamine dehydrogenase; HAO, hydroxylamine oxidase; NXR, nitrite oxidoreductase; NOS, nitrous oxide reductase; NOR, nitric oxide reductase; NOD, nitric oxide dismutase; NOO, nitric oxide oxidase; DNAR, denitrifying nitrate reductase, DNIR, denitrifying nitrite reductase. * p < 0.05, ** p < 0.01.
Agriculture 14 01986 g009
Table 1. Indices of soil characteristics following wheat harvest.
TreatmentBDpHSOC (g kg−1)TN (g kg−1)
N01.35 ± 0.05 a7.67 ± 0.02 a11.41 ± 0.19 b1.08 ± 0.13 a
N1801.38 ± 0.04 a7.58 ± 0.04 b12.47 ± 0.08 a1.11 ± 0.03 a
N2701.39 ± 0.02 a7.57 ± 0.03 b12.82 ± 0.38 a1.13 ± 0.01 a
N1801.38 ± 0.04 ab7.58 ± 0.04 d12.47 ± 0.08 b1.11 ± 0.03 a
N180B7.51.28 ± 0.04 bc7.77 ± 0.03 b13.15 ± 0.78 ab1.18 ± 0.13 a
N180B151.21 ± 0.08 c7.78 ± 0.04 b13.35 ± 0.17 ab1.14 ± 0.13 a
N180D1.41 ± 0.05 a7.71 ± 0.03 c12.54 ± 0.28 b1.16 ± 0.15 a
N180DB7.51.30 ± 0.02 abc7.80 ± 0.02 b13.24 ± 0.54 ab1.28 ± 0.11 a
N180DB151.26 ± 0.01 c7.93 ± 0.01 a13.48 ± 0.74 a1.19 ± 0.10 a
Note: ANOVA was conducted to compare the results under varying N input levels and across all N180 treatments, respectively. BD, bulk density; SOC, soil organic carbon; TN, total nitrogen. Distinct letters denote differences among treatments in soil indicators according to a Fisher HSD post-hoc test, α < 0.05.
Table 2. Correlation of gaseous fluxes with different forms of IN and WFPS.
Gas EmissionGroupNH4+-N
(mg kg−1)
NO3-N
(mg kg−1)
IN
(mg kg−1)
WFPS
N2Ocontrol0.0140.2440.2680.129
Only N group0.1610.336 *0.249 *0.217
Biochar group0.1810.321 *0.281 **0.429 **
DMPP group0.385 **0.199 *0.392 **0.197 *
NH3control0.3880.350−0.0570.492 *
Only N group0.298 **0.0510. 2560.480 **
Biochar group0.451 **0.0000.2800.175
DMPP group0.646 **0.361 **0.652 **0.371 *
CO2control−0.2930.406 *0.2760.094
Only N group−0.390 **0.160−0.297 *0.203
Biochar group−0.1700.222−0.0510.034
DMPP group−0.331 **0.102−0.294 **−0.236 *
Note: * p < 0.05, ** p < 0.01. Control (N0); Only N group (N180, N270); biochar group (N180B7.5, N180B15); DMPP group (N180D, N180DB7.5 and N180DB15). IN, inorganic N; WFPS, water-filled pore space.
Table 3. Variation of wheat yield and NUE among different treatments.
TreatmentsGrain Yield
(kg ha−1)
Straw Yield
(kg ha−1)
Above Ground N Uptake
(kg N ha−1)
NUE
(%)
N06295 ± 217 b6048 ± 778 b134 ± 18.3 b-
N1806910 ± 86 ab10020 ± 459 a229 ± 2.4 a52.5 ± 9.6 a
N2707628 ± 570 a9838 ± 1368 a258 ± 36.7 a45.8 ± 7.0 a
N1806910 ± 86 b10020 ± 459 a229 ± 2.4 a52.5 ± 9.6 a
N180B7.57820 ± 189 a9830 ± 347 a258 ± 10 a68.6 ± 4.9 a
N180B157399 ± 214 ab10956 ± 671 a257 ± 10.5 a68.3 ± 5.0 a
N180D7134 ± 118 ab9841 ± 457 a249 ± 12.7 a63.4 ± 15.4 a
N180DB7.57560 ± 233 ab10800 ± 167 a256 ± 9.3 a67.7 ± 13.7 a
N180DB157852 ± 577 a9911 ± 339 a259 ± 16.9 a69.4 ± 1.5 a
Note: ANOVA was conducted to compare the results under varying N input levels and across all N180 treatments, respectively. Distinct letters denote differences among treatments according to a Fisher HSD post-hoc test.
Table 4. Two-way ANOVA of the responses of DMPP and biochar on the N2O, NH3, CO2 emissions, grain yield, and NUE.
FactorsDFEC-N2OEC-NH3EC-CO2Grain YieldNUE
SSFpSSFpSSFpSSFpSSFp
DMPP11.88287.11<0.0010.8011.82<0.051.89 × 1050.25>0.057.79 × 10−50.10>0.050.050.01>0.05
Biochar20.097.04<0.050.080.55>0.051.84 × 1061.24>0.050.015.94<0.050.010.02>0.05
DMPP × Biochar20.1511.68<0.051.108.10<0.051.32 × 1060.89>0.050.002.49>0.050.010.01>0.05
Model52.1364.91<0.0011.975.83<0.053.35 × 1060.90>0.050.013.39<0.050.060.01>0.05
Error120.08 0.81 8.93 × 10⁶ 0.01 0.1140.01
Disclaimer/Publisher’s Note: The statements, opinions and data contained in all publications are solely those of the individual author(s) and contributor(s) and not of MDPI and/or the editor(s). MDPI and/or the editor(s) disclaim responsibility for any injury to people or property resulting from any ideas, methods, instructions or products referred to in the content.

