Article

Analysis of Physicochemical Properties, Enzyme Activity, Microbial Diversity in Rhizosphere Soil of Coconut (Cocos nucifera L.) Under Organic and Chemical Fertilizers, Irrigation Conditions

Hainan Key Laboratory of Tropical Oil Crops Biology, Coconut Research Institute, Chinese Academy of Tropical Agricultural Sciences, Wenchang 571339, China
*
Authors to whom correspondence should be addressed.
These authors contributed equally to this work.
Agriculture 2024, 14(11), 1937; https://doi.org/10.3390/agriculture14111937
Submission received: 8 October 2024 / Revised: 27 October 2024 / Accepted: 28 October 2024 / Published: 30 October 2024
(This article belongs to the Section Agricultural Soils)

Abstract

:
The application of chemical fertilizers and organic fertilizers, as well as irrigation, is an important agricultural practice that can increase crop yields and affect soil biogeochemical cycles. This study conducted coconut field experiments to investigate the effects of conventional fertilization (NCF), optimized fertilization (MCF), conventional fertilization + organic fertilizer (NOF), optimized fertilization + organic fertilizer (MOF), conventional fertilization + organic fertilizer + irrigation (NOFW), and optimized fertilization + organic fertilizer + irrigation (MOFW) treatments on soil physicochemical properties, soil enzyme activity, bacterial and fungal community structure and diversity, and compared the controls (CK, non-fertilizer and non-irrigation). The results showed that MOFW significantly increased soil electrical conductivity (EC), organic matter (OM), alkaline nitrogen (AN), available phosphorus (AP), available potassium (AK), available calcium (ACa), and available magnesium (AMg) levels. At the same time, it also significantly enhanced the activities of soil catalase (CE), polyphenol oxidase (POE), sucrase (SE), urease (UE), acid protease (APE), and acid phosphatase (APPE) (p < 0.05). The PCA analysis of soil microorganisms in the coconut rhizosphere soil showed indicated significant changes in bacteria and fungi community structure under fertilization treatments. The fertilization application leaded to an increase in the relative abundance and diversity of bacteria, but a decrease in fungi. Acidobacteriota, Proteobacteria, and Actinobacterota were the dominant bacterial phyla, and Ascomycota, Basidiomycota, Rozellomycota, and Mortierellomycota were the significant fungal phyla. Compared with CK, MOFW significantly increased the abundance of Acidobacteriota, Proteobacteria, Basidiomycota, and Mortierellomycota. Redundancy analysis (CCA) and Mantel test further revealed that pH, EC, OM, and AP were the main soil fertility factors driving changes in microbial communities. CE, SE, UE, APE, APPE were significantly correlated with microbial communities. Compared with NOFW, MOFW has a lower proportion of N, P, and K fertilizers in its fertilizer composition. The results indicated that MOFW can better improve the nutrient and enzyme status of the soil, which is a promising method for maintaining the balance of soil microorganisms in coconut orchards, and accordingly, reducing chemical fertilizers within a certain range can not only ensure consistency with conventional fertilizers, but also effectively improve soil conditions.

1. Introduction

Coconut, as an important tropical fruit and oil crop, is widely planted in tropical regions around the world. It is not only an important source of edible oil, but also an important raw material for chemical industry [1]. The appropriate application of nitrogen, phosphorus, and potassium fertilizers can dramatically increase coconut yield. Coconuts require a large amount of fertilizer and water, and sufficient sunlight can effectively promote photosynthesis, nutritional growth, and reproductive development, which is a significant guarantee for high and stable coconut production. The demand for fertilizer types varies in different production periods [2]. The nitrogen absorption of coconut mainly occurs before flowering, and the nitrogen absorption after flowering significantly decreases, while the potassium and phosphorus absorption increases [3]. So far, most research has focused on the effects of fertilizers on coconuts [2]. The application of chemical fertilizers is the principal causation of resource waste and environmental damage [4]. Organic fertilizers include various necessary nutrients for plant growth, such as mineral elements, trace elements, sugars, fats and beneficial microorganism, and they can improve the physical and chemical properties of soil, increase the abundance and activity of microorganisms, and improve crop production and quality [5,6]. Soil fungi and bacteria are two important components of the soil microbial community. The soil microbial community plays multiple functions in ecosystems and participates in numerous ecological processes, such as enhancing plant nutrient utilization and promoting plant growth and development by biological nitrogen fixation and phosphorus dissolution of rhizosphere soil [7,8]. Although the structure of microbial community reflects the functional potential of soil microorganisms, soil enzyme activity may more accurately reflect the processes occurring in soil [9]. Combing organic and inorganic fertilizers can improve the diversity of microorganisms, making their distribution more uniform than inorganic fertilizers and unfertilized soil. Even in the short term, organic fertilizers replacing some chemical fertilizers can optimize the structure of microbial communities, promote the proliferation of beneficial soil microorganisms, and inhibit harmful soil bacteria [10]. Accordingly, exploring the alteration in soil microbial communities under different fertilization conditions, especially the effects of different fertilizer and organic fertilizer ratios on soil microbial communities and soil physicochemical properties, is important. The reasonable combination of organic fertilizer and chemical fertilizer is of great significance in improving our understanding of the coconut microbial ecosystem. Therefore, it is important to determine the optimal combination of organic fertilizers and chemical fertilizers.
Fertilization has a significant impact on the composition of soil microbial communities. The relative abundance of several bacterial genera varies with the use of different fertilizers, and different fertilizers also cause different changes. Fertilizers not only change the bacterial community, but also alter the fungal community. Inorganic fertilizers can reduce soil fungal diversity [11], while organic fertilizers can affect the abundance of different fungal genus [12].
In recent years, the biodiversity of agricultural ecosystems and soil microbial communities have been considered important indicators of the health, productivity and sustainability of soil [13]. According to reports, fertilization is a very important strategy for managing crop production, as it can improve soil fertility [14]. Previous studies have shown that inorganic and organic fertilization directly affect the structure, abundance, and activity of soil microbial communities by providing nutrients [15,16,17,18,19,20], and indirectly alter soil pH, which has a significant impact on the structure, abundance, and activity of soil microbial communities [17]. Organic fertilizers can increase the richness and diversity of bacterial communities compared to the application of mining fertilizers. Therefore, reducing the dosage of chemical fertilizers will optimize the structure of soil microbial communities and increase microbial diversity, thereby improving soil fertility [21].
Increasing soil bacteria and Actinobacterota can promote plant growth and improve the soil environment. In contrast, an increase in fungi and a decrease in bacteria can lead to diseases and affect healthy plant growth [22]. The species diversity and community structure of soil microorganisms determine the ability of soil to resist pathogens; this is of great significance for the sustainable development of soil ecosystems, environmental regulation, and the utilization of sustainable resources [23].
The rhizosphere is the closest surface between plants and soil, and it is also the place where plant roots, soil, microorganisms, and the environment interact. The changes in the structure and functional diversity of rhizosphere microbial communities may lead to a decrease in beneficial microorganisms, an increase in fungal diseases, and a decrease in crop production [24].
The rhizosphere microbiota is a crucial environmental factor affecting plant health and adaptability [25], and soil moisture is a pivotal factor influencing on the rhizosphere soil microbiota environment [26]. Irrigation is a momentous driving factor in regulating soil moisture. Previous studies have shown that soil microbial diversity increases firstly and then decreases with increasing irrigation water volume [27]. The abundance of soil microbial communities is also sensitive to irrigation amount [28]. In addition, the application of microbial fertilizers is also a common way to improve the crop rhizosphere microecological environment [29]. Microbial fertilizer refers to a soil fertilizer containing multiple useful microorganisms, which regulates the plant growth environment by life activities and growth metabolites, improves nutrient conditions, stimulates plant growth and development, resists pest and disease hazards, accelerates soil nutrient transformation, promotes soil nutrient status, and enhances the yield and quality of corresponding agricultural products [30].
The addition of organic fertilizers may have an impact on soil productivity, nutrient availability, and the mineralization process of organic compounds [31]. Organic matter is the energy source for microorganisms and also causes changes in their diversity and activity [32].
The application of organic fertilizers can promote organic carbon storage and sequestration rate, adjust soil carbon nitrogen ratio, stabilize pH level, reduce bulk density, improve nutrient retention capacity, soil fertility, and fertilization efficiency, enhance the rhizosphere microbial environment, stimulate crop roots secreting organic acids, amino acids, and sugars, and promote crop nutrient absorption (such as nitrogen, phosphorus, potassium, etc.) [33,34,35]. The application of organic fertilizers also enhances enzymatic reactions and microbial activity related to soil carbon, nitrogen, and phosphorus conversion, promotes the spread of beneficial microorganisms, and improves the reproduction of soil microbial communities [36,37,38].
At present, there are no reports on the effects of different fertilization treatments on soil nutrients, enzyme activity, and microbial diversity in coconut rhizosphere soil. Therefore, this study aimed to investigate the effects of different fertilization treatments on the microbial community and diversity of coconut rhizosphere soil, to evaluate the effects of different fertilizations on nutrient and enzyme activity, and to conduct correlation analysis between important rhizosphere soil physicochemical properties, enzyme activity, and microbial community characteristics, in order to provide a scientific basis for coconut fertilization management.

2. Materials and Methods

2.1. Study Site and Field Experiment Design

The field experiment was implemented from January 2022 to April 2024 at the coconut planting base in Baofang Township, Dongge Town, Wenchang City, Hainan Province, China (19°21′ N, 111°03′ E). The area belongs to a tropical monsoon oceanic climate, with an annual average precipitation of 1529.8~1948.6 mm and temperature of 23.9 °C. The rainy season is mainly concentrated between May and October, accounting for 80% of the annual rainfall. The average altitude is about 40 m, and the soil is classified as coastal sandy loam. The basic soil properties before the fertilization experiment include pH 5.67, organic matter (OM) 11.564 g/kg, electrical conductivity (EC) 40.252 us/cm, alkaline nitrogen (AN) 80.565 mg/kg, available phosphorus (AP) 4.012 mg/kg, and available potassium (AK) 25.103 mg/kg.
The experiment was conducted using a completely random block design (6 m × 24 m), including 7 experimental treatments (Figure 1), 3 biological replicates, and a total of 21 plots, with a plant spacing of 6 m and a row spacing of 6 m. There was an isolated plant row between the two experimental treatments, with a total of 300 coconuts in all experiments and isolation. Each experimental plot covered an area of 76 m2, and the three biological replicates had a total plot area of 228 m2. The 7 treatments were as follows: non-fertilizer and non-irrigation (CK), conventional fertilizer (NCF), optimized fertilizer (MCF), conventional fertilizer + organic fertilizer (NOF), optimized fertilizer + organic fertilizer (MOF), conventional fertilizer + organic fertilizer + irrigation (NOFW), optimized fertilizer + organic fertilizer + irrigation (MOFW). CK served as a control. The organic fertilizer used in this experiment (N + P2O5 + K2O ≥ 6.0%, organic content ≥ 40.0%, live bacteria ≥ 20 million/g) was purchased from Hainan Sanjiangpu Xinxing Fertilizer Co., Ltd. (Haikou, China), and the chemical fertilizer was purchased from China National Chemical Fertilizer Co., Ltd. (Beijing, China). Organic fertilizers are mainly made from sheep manure. Conventional and optimized chemical fertilizers in this experiment included urea (N 46%), superphosphate (P2O5 16%), and potassium sulfate (K2O 50%). The conventional fertilization rates were 900 kg/hm2 (N), 300 kg/hm2 (P2O5), and 1200 kg/hm2 (K2O). The optimized fertilization rates were 600 kg/hm2 (N), 150 kg/hm2 (P2O5), and 900 kg/hm2 (K2O), respectively. Irrigation was 45,000 m3/hm2.

2.2. Soil Sampling

Six-year-old red dwarf coconuts (Wen coconut No. 3) were in this experiment as the research object, and coconuts were the fruiting tree. Fertilization experiments were conducted in 1 January 2022, 1 January 2023, and 1 January 2024, respectively.
Soil samples were collected on 5 April 2024 using a 5 cm-diameter spiral drill to collect rhizosphere soil samples. Then, we took 5 fresh samples from each experiment community and mixed them completely to form a composite sample for further research. After removing the obtained roots, all soil samples were sieved through a sieve (with a pore size of approximately 0.425 mm), and each sample was divided into two subsamples. One subsample was used to measure soil physicochemical indicators, while the other subsample was immediately stored at −80 °C for future extraction, PCR amplification, and sequencing of soil microbial genomic DNA.

2.3. Soil Physicochemical Analysis

After air-drying and sieving (with a pore size of approximately 0.425 mm), the soil sample was subjected to physicochemical analysis. The soil pH was measured using a soil water mixture (1:2.5) and a pH meter (F2, METTLER TOLEDO, Columbus, OH, USA). The EC was measured using a portable conductivity meter (S8 m, METTLER TOLEDO, Columbus, OH, USA). OM was treated using potassium dichromate volumetric external heating method. AN was carried out using the alkaline hydrolysis diffusion method. AP was analyzed using molybdenum antimony colorimetric method and UV spectrophotometer (XU-5, Yifu Instrument Manufacturing Co., Ltd., Shanghai, China). AK was extracted using NH4Ac extraction flame photometry (6400A, Shanghai, China). The ACa and AMg contents were determined by DTPA extraction atomic absorption spectrophotometry (SHIMADZU AA6300F, Agilent, Santa Clara, CA, USA). All the above operation methods referred to Bao (2000) [39].

2.4. Soil Enzymes Assay

The activities of CE, POE, SE, UE, APE and APPE in all rhizosphere soil sample solutions in coconut were quantitatively determined. We weighed 0.15 g of fresh soil (with a sieving aperture of approximately 0.425 mm), placed it in a 5 mL EP tube, and extracted it using CE, POE, SE, UE, APE, and APPE assay kits (Suzhou Geruisi Biotechnology Co., Ltd., Suzhou, China, www.geruisibio.com (accessed on 8 June 2023). Then, we used a visible spectrophotometer (XU-5, E-spectrum Instrument Manufacturing Co., Ltd., Shanghai, China) to measure the activity of CE (510 mm), POE (475 mm), SE (540 mm), UE (578 mm), APE (680 mm), and APPE (405 mm) in the extracts. Their extraction method and soil enzyme activity calculation were operated according to the instructions of the reagent kit (ensuring that the soil sample was completely immersed in the reagent).

2.5. Extraction, PCR Amplification, and Sequencing of Soil Microbial DNA

The total DNA of soil microorganisms was extracted using the soil genomic DNA rapid extraction kit from Shanghai Shengong Bioengineering Co., Ltd. (Shanghai, China). After extraction, the DNA sample was sent to Baimaike Biotechnology Co., Ltd.(Baimaike, Beijing, China). for sequencing using dry ice. The entire process included PCR amplification, mixing and purification of PCR products, and library construction. The bacterial 16S rDNA V3-V4 region was amplified using a two-round method, with upstream primer 338F: 5′-ACTCCTACGGGAGGCAGCA-3′, downstream primer 806R: 5′-GACTACHVGGGTWTCTAAT-3′, fungal ITS1 amplification, upstream primer sequence: ITS1F: 5′-CTTGTCATTTAGAAGTA-3′, downstream primer sequence: ITS2:5′-GCTGCGTTCATGATGC-3′. The reaction system contained 10 μL of 5–50 ng genomic DNA, 0.3 μL of *Vn F (10 μM), 0.3 μL of *Vn R (10 μM), 5 μ L of KOD FX Neo Buffer, 2 μL of dNTP (2 mM) and KOD FX Neo 0.2 μL, and the reagents of genomic DNA, *Vn F, *Vn R, KOD FX Neo Buffer, dNTP and KOD FX Neo were purchased from Shanghai Shengong Bioengineering Co., Ltd. (Shanghai, China). Amplification conditions: 5 min at 95 °C, 30 s at 95 °C, 30 s at 50 °C, 40 s at 72 °C, 25 cycles of amplification, and 7 min extension at 72 °C. Then, used the first PCR product as a template, Illumina bridge PCR compatible primers were used, with a reaction system of 20 μL: PCR purified primers of 5 μL, *MPPI-a (2 μM) 2.5 μL, *MPPI-b (2 μM) 2.5 μL, and 2 × Q5HF MM10 μL, and they also were purchased from Shanghai Shengong Bioengineering Co., Ltd. (Shanghai, China). Amplification conditions: 98 °C for 30 s, 98 °C for 10 s, 65 °C for 30 s, 72 °C for 30 s, amplification for 10 cycles, extension at 72 °C for 5 min. PCR products were recovered and quantified using magnetic bead method. Mixed the PCR products of each processed sample in equal amounts to ensure sufficient sample detection concentration. Finally, 21 mixed samples were sent to BioTech Co., Ltd. (Beijing, China) for high-throughput sequencing using the Illumina MiSeq platform.

2.6. Data Analysis

This study conducted a taxonomic analysis of OTU representative sequences with 97% similarity (USEARCH, version 10.0), and statistically analyzed the bacterial and fungal community composition of each sample at the levels of kingdom, phylum, class, order, family, and genus. We drew a bar chart of species classification and a heatmap of species abundance. Using 16S and 18S sequences, the alpha diversity indexes (Chao1, Shannon, Simpson index, and coverage) were calculated after resampling and unifying the sequencing depth. Draw a dilution curve (based on OTUs richness) for dilution analysis. Beta diversity analysis presented the diversity matrix of species based on binary_jaccard. We conducted principal component analysis (PCA, NMDS), redundancy analysis of environmental factors and sample composition (CCA), and mantle test analysis based on R language. We also conducted the analysis of OTU partitioning, alpha diversity index calculation, and dilution analysis using Mothur software (1.40.45); completed a paired t-test and plotting using Graphpad 6 software; and used R’s vegan software (5.3) package to analyze CCA and mantle test. After standardizing the OUT data (taking logarithms), we selected the species with the highest number, and drew heatmaps using R software (3.2.5). Each color block in the heatmap represents the abundance of a genus in a sample. The samples are arranged horizontally and vertically, and the similarity between samples and the composition of each taxonomic community are analyzed in clustering. The Spearman rank correlation analysis method was used to evaluate the relationship between soil microbial diversity and soil characteristics [40,41,42].

2.7. Statistical Analysis

We conducted one-way ANOVA using Student’s test, and then using the LSD method for multiple comparisons to determine statistical differences between different treatments, and considered a significance level of p < 0.05. All statistical analyses were conducted using SPSS 21.0 software (SPSS, Chicago, IL, USA).

3. Results

3.1. Physicochemical Properties of Rhizosphere Soil in Coconut

All experimental treatments showed significant dynamics in soil physicochemical properties, and compared with the control (CK), the fertilization treatments reduced soil pH. Fertilization treatments enhanced soil EC, OM, AN, AP, AK, ACa, and AMg. The EC of all fertilization treatments was significantly higher than that of CK, and the EC of MOFW was significantly higher than that of MCF and NCF. The concentrations of OM, AN, and AK of MOFW, NOFW, MOF, and NOF were significantly higher than those of CK. The concentration of AP of MOFW was significantly higher than that of MOF, NOF, MCF, NCF, and CK. The concentrations of ACa and AMg in MOFW and NOFW treatments were significantly higher than those in MCF, NCF, and CK treatments. At the same time, the concentration of AMg in MOF and NOF treatments was significantly higher than that in NCF and CK treatments (Figure 2, p < 0.05).

3.2. Enzyme Activity of Rhizosphere Soil in Coconut

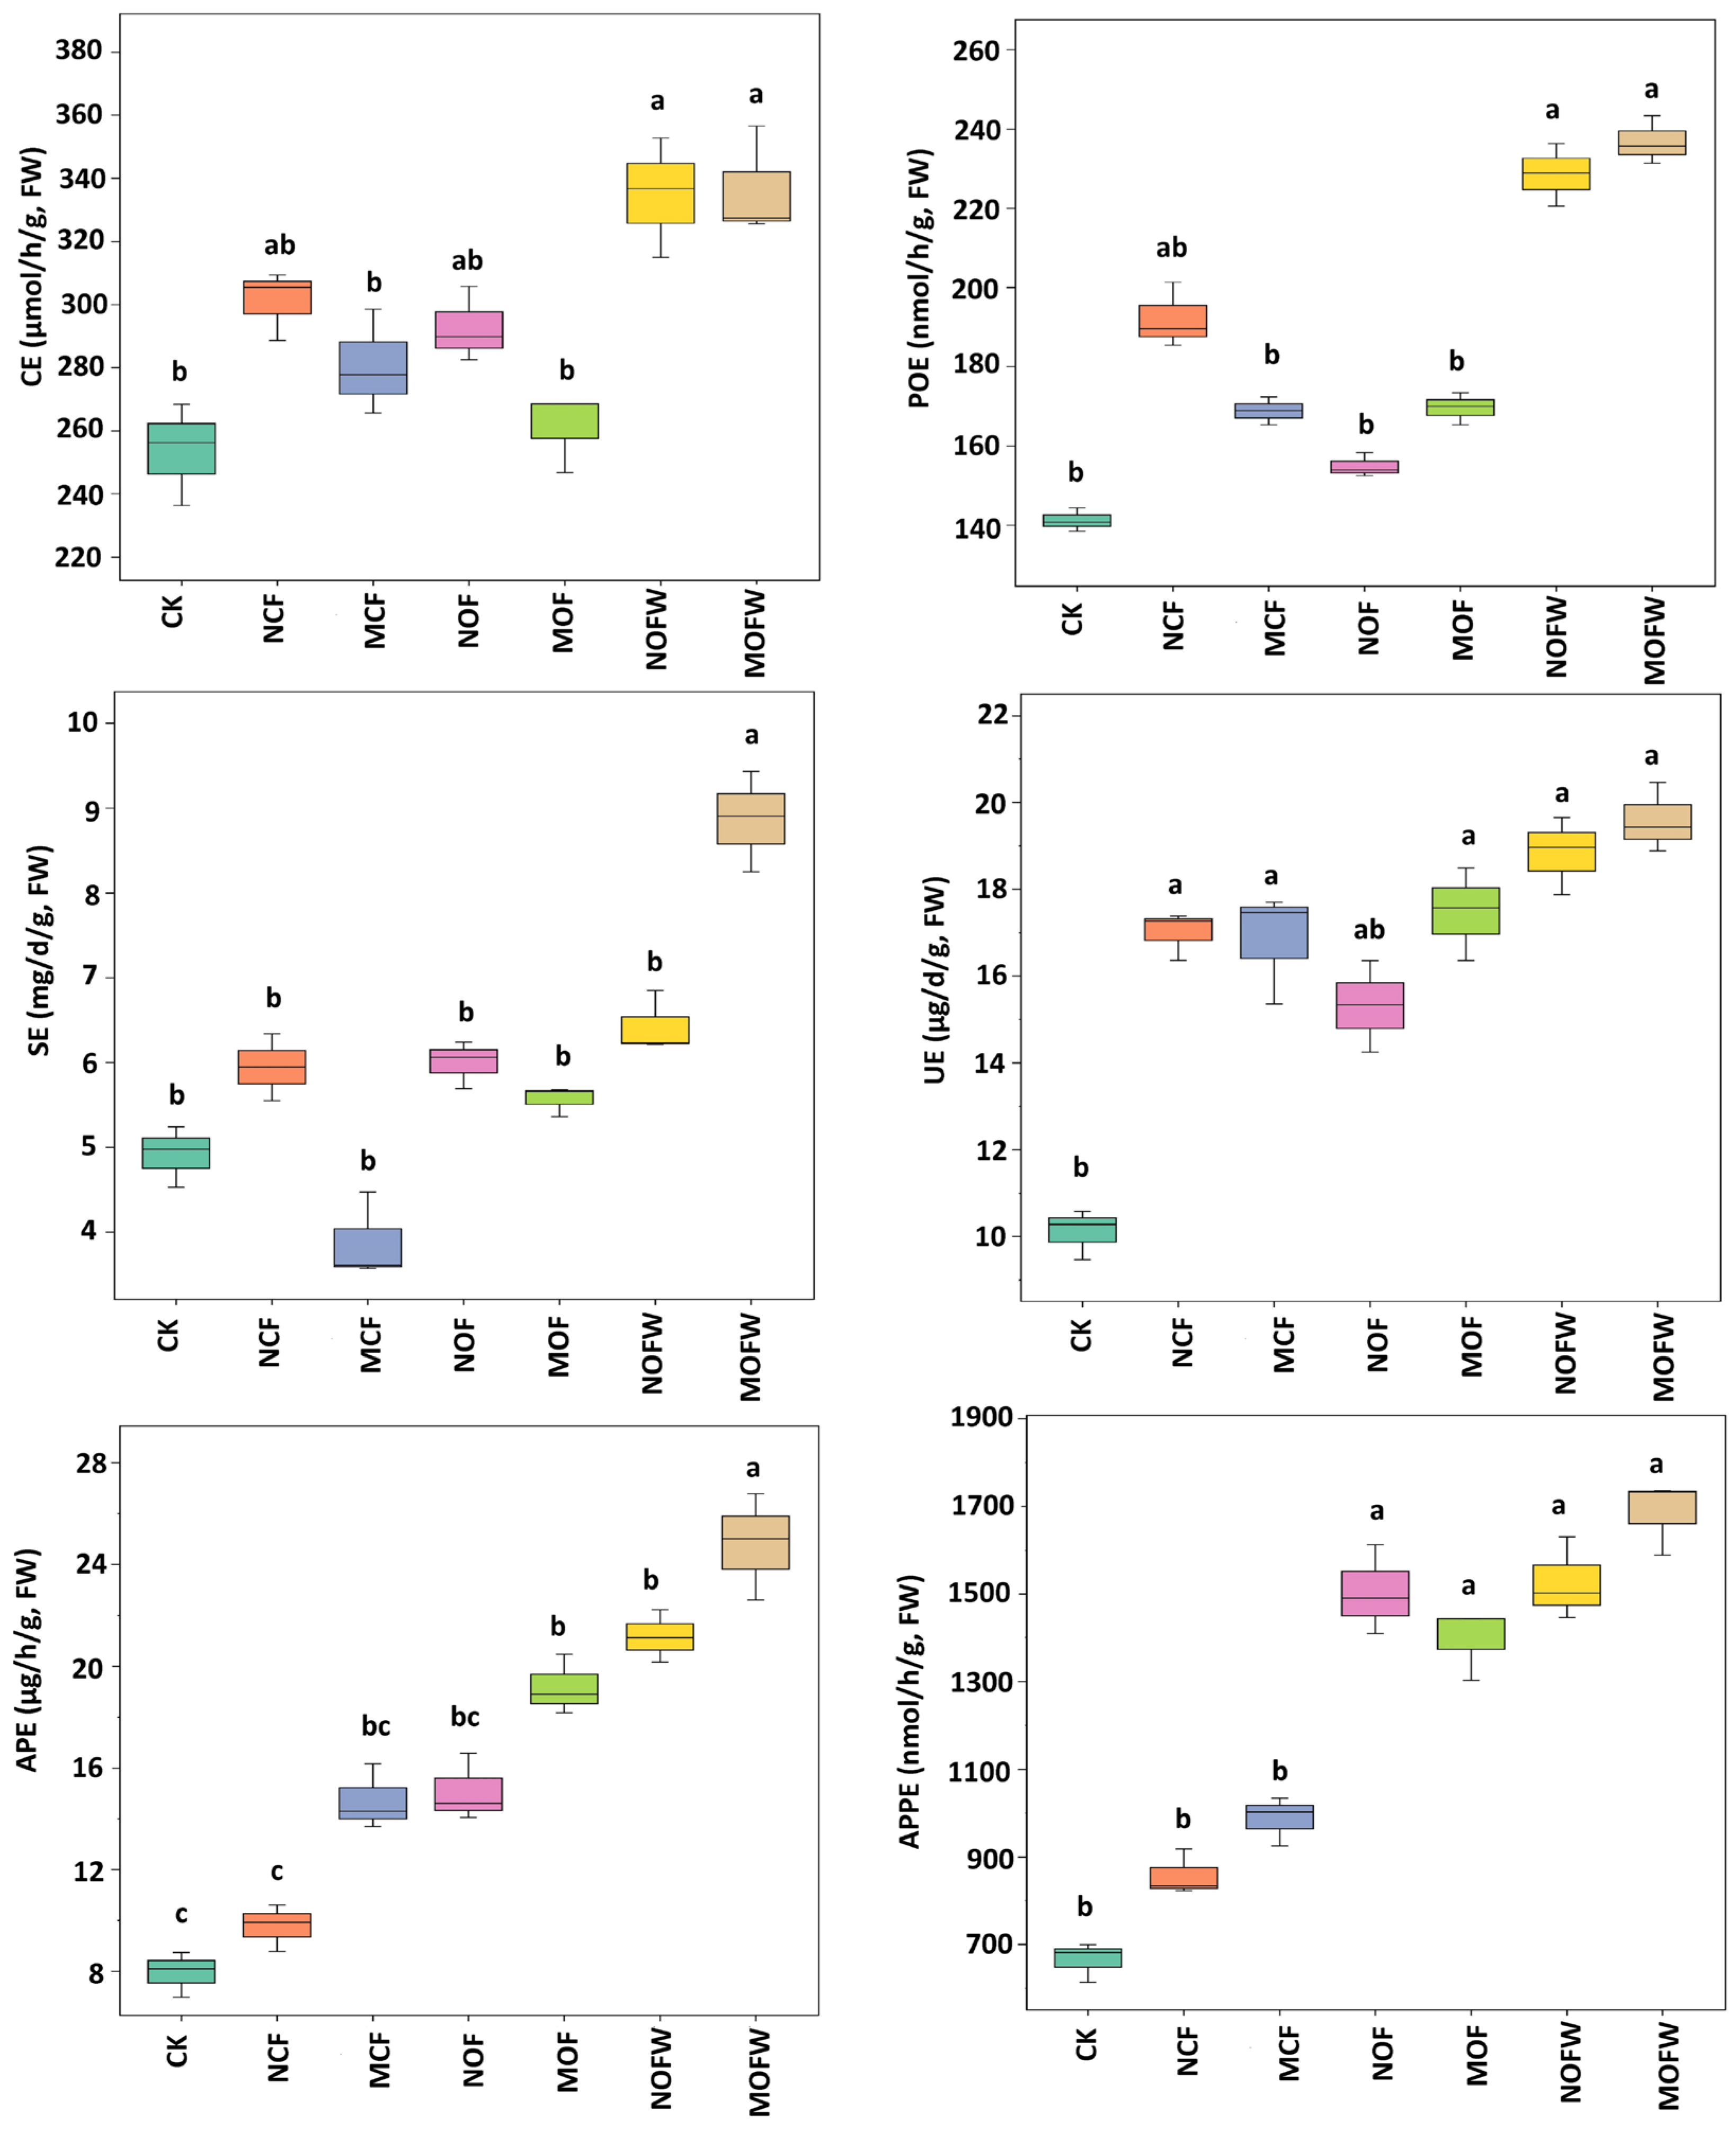
Compared with CK, the fertilization treatments enhanced soil CE, POE, SE, UE, APE, and APPE activities. Among them, the CE, POE, SE, UE, APE, and APPE activities of MOFW were the highest. The CE activity of MOFW and NOFW was significantly higher than that of MOF, MCF, NCF, and CK. The POE activity of MOFW and NOFW was significantly higher than that of MOF, NOF, MCF, and CK. The SE activity of MOFW was significantly higher than that of CK treatment. The activity of UE in MOFW, NOFW, MOF, MCF, and NCF was significantly higher than that in CK. The APE activity of MOFW was significantly higher than that of NOFW, MOF, NOF, MCF, NCF, and CK. In addition, the APE activity of NOEW and MOF was significantly higher than that of NCF and CK. The APPE activity of MOFW, NOFW, MOF, and NOF was significantly higher than that of MCF, NCF, and CK (Figure 3, p < 0.05).

3.3. Diversity and Community Structure of Rhizosphere Soil Microorganisms

3.3.1. Sequencing Data Preprocessing Results

The rarefaction curves of the 21 samples eventually flattened, and the sequencing was close to saturation (Figure 4A,B), indicating that the sampling was basically reasonable and could correctly reflect the microbial communities in the 21 soils. Combined with the coverage rates of each sample (0.9964~0.9997) (Table 1), it was found that sequence basically had all microbial groups, and the community structure composition of microorganisms could be obtained. The sequence length of bacterial library was 411~418, and the sequence length of fungal library was 241~249. To some extent, the thin curve reflected the diversity of the sample (Table S1). When the read length exceeded 30,000 in sequencing, a plateau was observed on the curve. This discovery indicated that the sequencing results effectively captured the diversity present in the current substrate samples (Figure 4A,B). The OTU number of bacteria in the 21 samples was approximately 1.49~2.5 times that of fungi, indicating that the rhizosphere soil microorganisms under fertilization treatment were mainly bacteria. (Table 1).
For bacteria, we obtained 542,065 valid sequences (Table S1) and 1690 operational taxonomic units (OTUs) (Figure 4C). At a similarity level of 97%, the number of OTUs for each sample was obtained. The number of OTUs in each sample was different; the minimum number of OTUs is CK, which was 1118. The MOFW had the highest number of OTUs (1402), followed by NOFW (1322), and there was no significant deviation among the other four treatments (approximately 1200). This indicated that MOFW treatment had the richest bacterial community, while CK treatment had the poorest bacterial community abundance. In addition, there were significant differences between CK and other treatments (Figure 4C, Table 1); tt the same irrigation level, the OTU number of bacteria in mixed fertilizer treatments was MOFW > NOFW.
For fungi, we obtained 551,238 valid sequences (Table S1) and 1772 operational taxonomic units (OTUs) (Figure 4D). At a similarity level of 97%, the number of OTUs for each sample was obtained. The number of OTUs in each sample was different; The MCF had the fewest OTUs, with 556. The CK had the highest number of OTUs (750), while there was no significant deviation among the other four treatments (approximately 650). CK treatment had the richest fungal community, while MCF treatment had the poorest fungal community abundance, followed by NOF and MOFW treatment. In addition, there were significant differences between CK and the other six treatments (Figure 4D, Table 1). In summary, under the same irrigation treatment, the trend of changes in the number of fungal OTUs was NOFW > MOFW, but there was no significant difference.
A Venn diagram was used to represent the number of common and unique OTUs in the sample. By combining species represented by OTUs, we could observe common microorganisms under different treatments. For bacteria, in the Venn diagram (Figure 4E), we could see that the number of common overlapping OTUs was 1232, and the number of independent OTUs was 18, 8, 6, 3, 4, 1, and 1, respectively (CK, NCF, MCF, NO, MOF, MOFW and NOFW). Among all the treatments, CK had the highest number of independent OTUs, indicating the greatest difference between CK and other treatments. On the contrary, the minimum number of OTUs indicated the highest similarity between this treatment and other treatments, with only one in MOFW and NOFW. For fungi, in the Venn diagram (Figure 4F), we could see that the number of common overlapping OTUs was 423, and the number of independent OTUs was 34, 29, 17, 13, 11, 10, and 8, respectively (CK, MOF, MCF, NOFW, NOF, MOFW and NCF). Among all the treatments, CK had the highest number of independent OTUs at 34, followed by MOF. The minimum number of independent OTUs for NCF was eight. This indicated that there were significant differences in fungi among different fertilization treatments.

3.3.2. Diversity of Rhizosphere Soil Microbial Communities

Alpha diversity is a widely used method for analyzing community surveys, whose indicators summarize the richness, evenness, or structure of ecological communities. Alpha diversity reflects the species richness diversity of a single sample, and which has multiple indicators: chao1, ACE, Shannon, and Simpson. The ACE and chao1 indices reflect the richness of microbial communities [42]. Both indicators of MOFW were greater than 1400, which was the highest among all treatments, indicating that MOFW have the most species in its bacterial community. The number of NOFW species ranked second (about 1300 species), there were no significant difference between MOF and NOF. However, the number of MCF, NCF, and CK species was lower. At the same irrigation level, the bacterial community richness grade of mixed fertilizer treatments was MOFW > NOFW (Table 1).
The Simpson and Shannon indices reflect the degree of species diversity. The Simpson and Shannon indices of MOFW were the highest, indicating that the bacterial community diversity was the highest under this treatment, following by MCF, MOF, NOF, NOFW. However, the Simpson and Shannon indices of CK were much lower than those of other treatments, indicating that the bacterial community diversity of CK was also extremely low (Table 1).
The chao1 values of soil fungi under different fertilization treatments were arranged as follows: CK > MOF > NOF > NCF > MOFW > NOFW > MCF. The ACE values were CK > MOF > NOFW > NOF > MOFW > NCF > MCF. Among them, the abundance of soil fungi in CK treatment was higher, while the abundance of soil fungi in MCF was the lowest. The Simpson and Shannon index values of CK treatment were the highest, indicating a higher diversity of fungal communities under CK treatment. The Simpson index value of NOFW treatment was the lowest, and the Shannon index value of MCF treatment was the lowest, indicating that the fungal community diversity of NOFW and MCF was lower (Table 1).
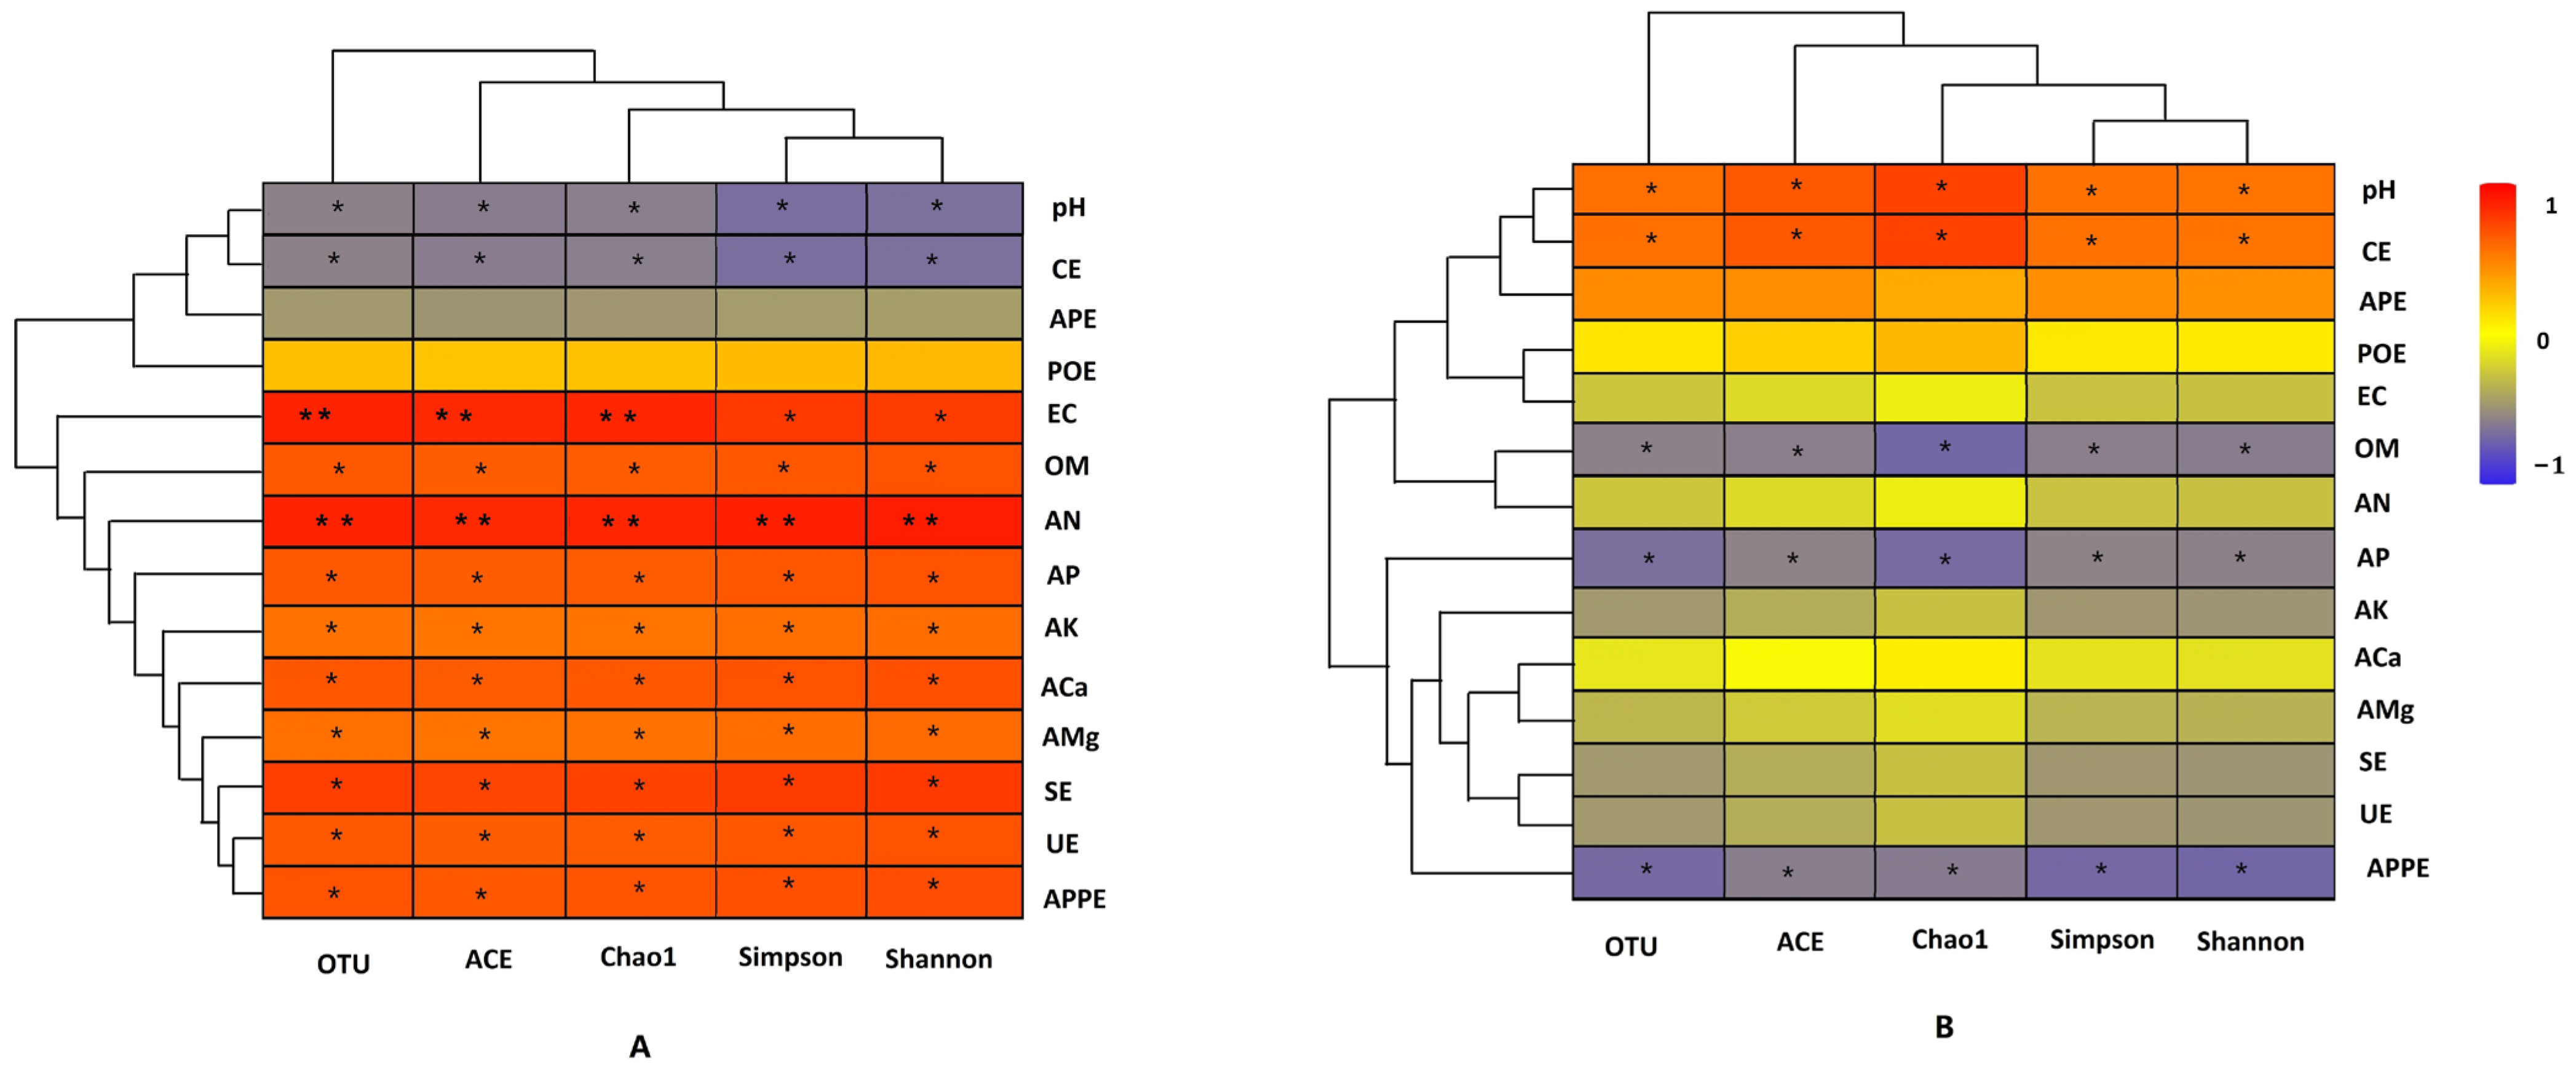
The Spearman rank correlation analysis method was used to evaluate the relationship between soil bacterial and fungal diversity and soil characteristics. The OTU, ACE, chao1, Simpson, and Shannon of soil bacteria were significantly positively correlated with EC, OM, AN, AP, AK, ACa, AMg, SE, UE, and APPE, but significantly negatively correlated with pH and CE (Figure 5, p < 0.05). However, the OTU, ACE, chao1, Simpson, and Shannon values of soil fungi were significantly positively correlated with pH and CE, but significantly negatively correlated with OM, AP, and APPE (Figure 5, p < 0.05).

3.3.3. Microbial Community Composition of Rhizosphere Soil

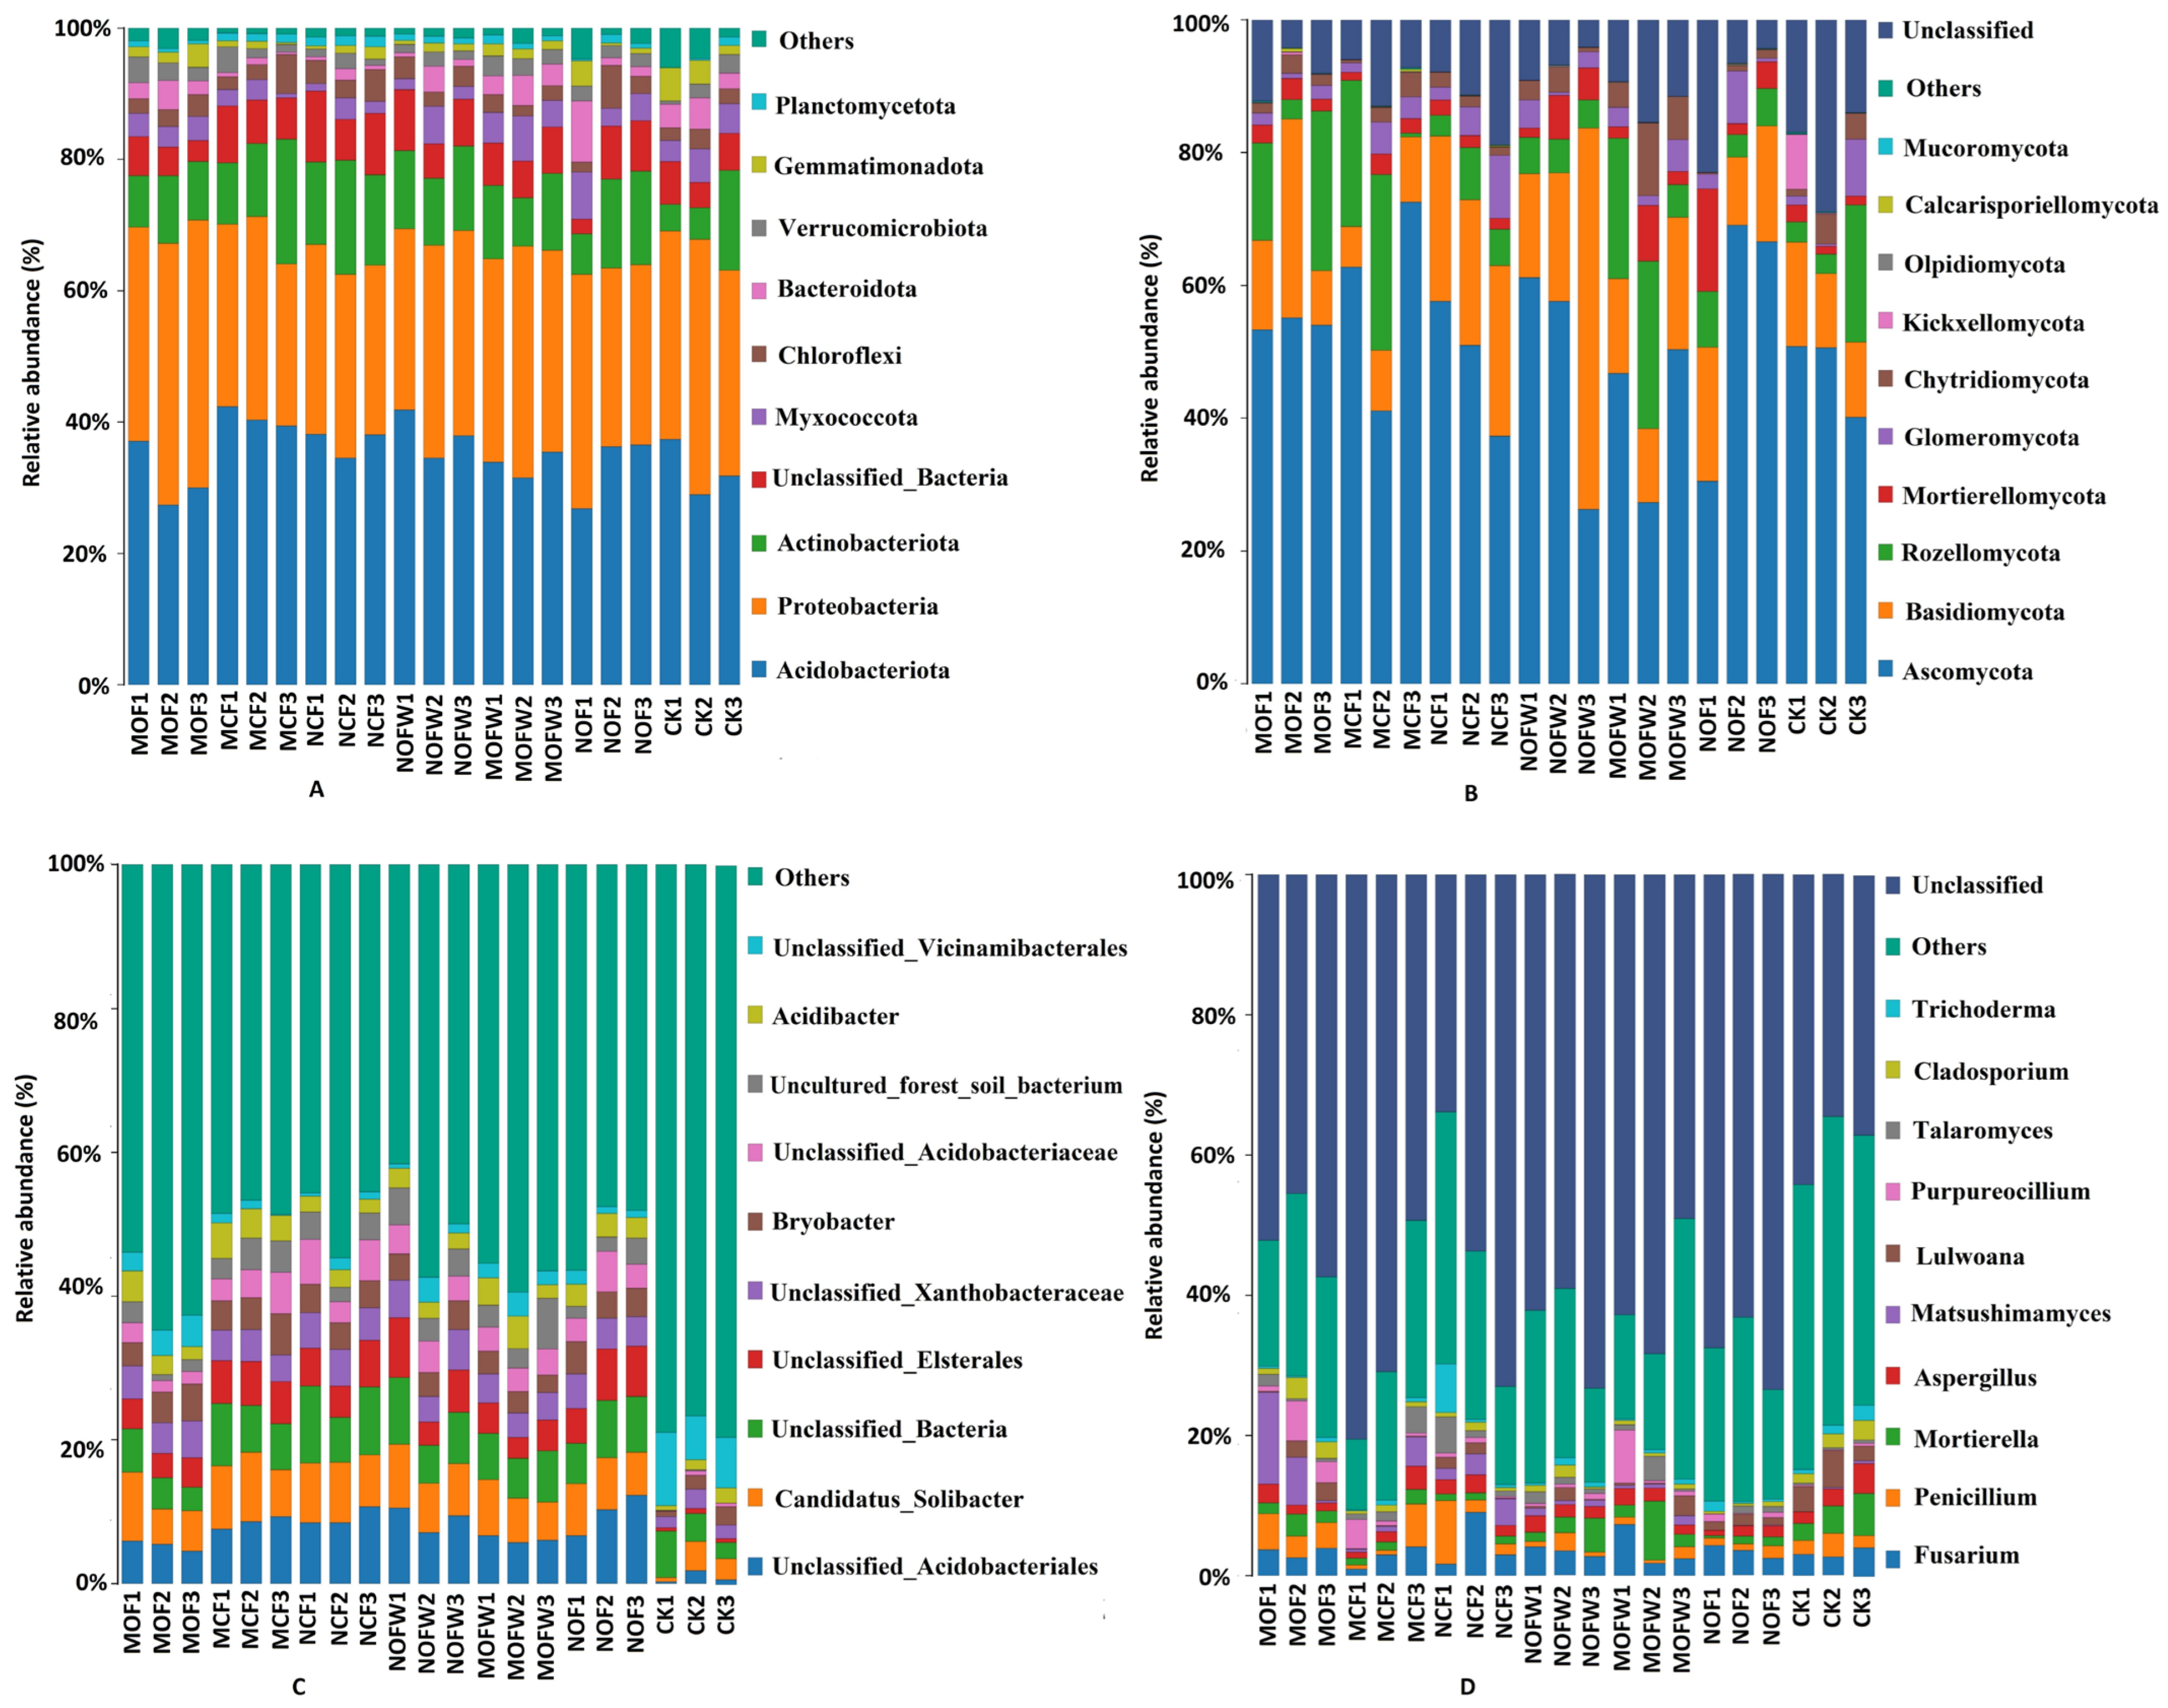
At the phylum level, after high-throughput sequencing of 21 samples in coconut rhizosphere soil, the proportion of bacteria ranked in the top 10 was basically over 95%, except for other phyla. Although there were differences in relative content, the top 10 bacterial phyla were the same in the seven treatments (Figure 6A, Table S2), including Acidobacteriota, Proteobacteria, Actinobacterota, Myxococcata, Chloroflexi, Bacteroidota, Verrucomicrobota, Gemmatimonadota, Planctomycota, Unclassified_Bacteria. The bacterial community was mainly composed of Acidobacteriota (31.46~40.71%), Proteobacteria (27.59~37.77%), and Actinobacterota (8.05~14.53%). The relative abundance of Acidobacteriota in MCF was higher than in other treatments. The relative abundance of Proteobacteria was high in MOF, and the relative abundance of Actinobacterota was high in NCF. In the seven treatments, the top 10 fungi phyla were Ascomycota, Basidiomycota, Rozellomycota, Mortierellomycota, Glomeromycota, Chytridiomycota, Kickxellomycota, Oppidiomycota, Calcarisporellomycota, Mucoromycota (Figure 6B, Table S2). The fungal communities were Ascomycota (41.47~58.84%), Basidiomycota (8.32~30.78%), Rozellomycota (4.92~17.12%) and Mortierellomycota (1.72~7.09%) were the main ones. Compared with other treatments, the relative abundance of Ascomycota in MCF, Basidiomycota in NOFW, Rozellomycota in MOFW, and Mortierellomycota in NOF were the highest.
At the genus level, the bacterial composition of all experimental treatments was similar, however, the abundance of bacterial composition in the CK differed significantly from those in the fertilized treatments. Except for others, the relative abundance of Unclassified_Acidobacteriales, Candidatus_Solibacteria, Unclassified_Bacteria, Unclassified_Elsterales and Unclassified_Xanthobacteraceae in the fertilization treatments was higher than that in the CK. The relative abundance of bacterial composition varied among different fertilization treatments, but was not significant (Figure 6C, Table S2).
At the genus level, the fungal composition of all experimental treatments was similar, except for others and unclassified. Among them, Fusarium, Penicillium, Mortierella, Aspergillus, Matsushimamyces and Lulwoana had higher relative abundances. Furthermore, Penicillium, Mortierella, Aspergillus and Lulwoana had higher relative abundances in CK treatment. Moreover, Penicillum also had a high relative abundance in MOF and NCF, Mortierella had a high relative abundance in MOF, Aspergillus had a high relative abundance in NCF, and Matsushimamyces had a high relative abundance in NCF and MOF. Additionally, there were differences in Fusarium among all experimental treatments, but these were not significant (Figure 6D, Table S2).
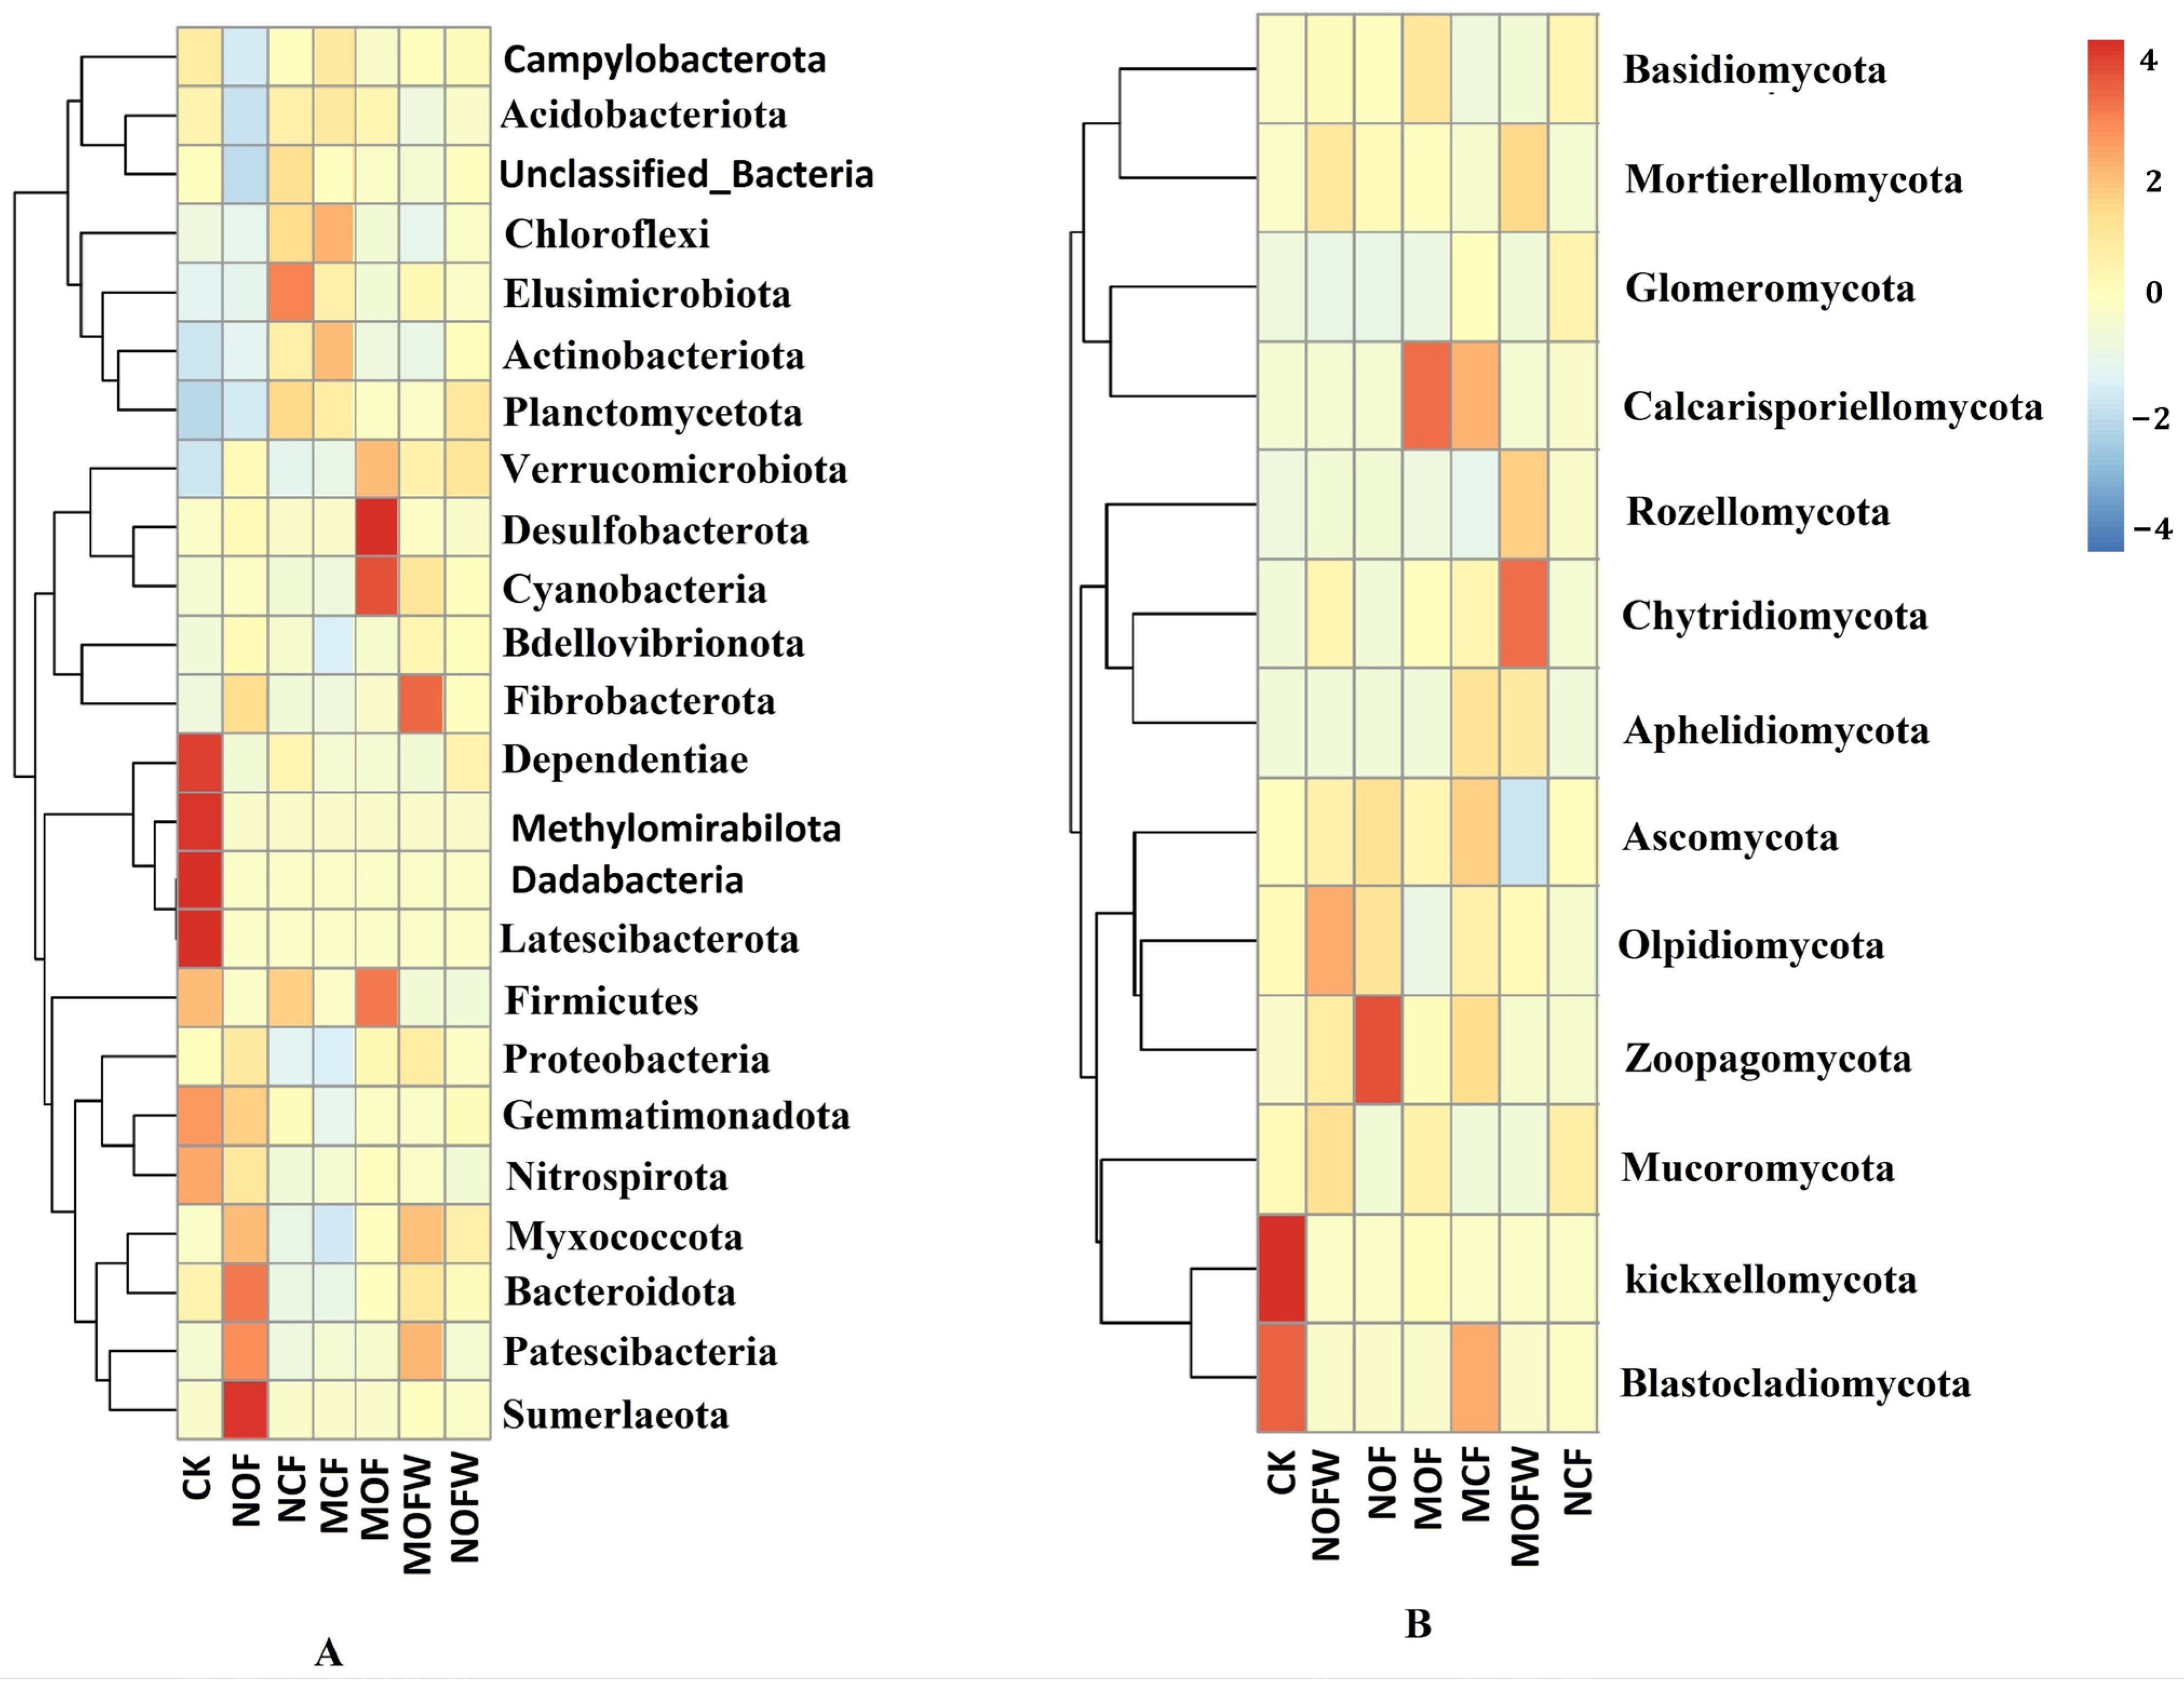
As shown in Figure 7A, the heatmap and cluster analysis based on binary_Jaccard differences indicated that the experimental treatments had a significant impact on the relative abundance of different members in the soil bacterial phylum. Compared with other experimental treatments, the relative abundance of Gemmatimonadota, Firmicutes and Nitrospirota in CK treatment showed a significant increase, while the relative abundance of Actinobacteriota, Planctomycetota, Verrucomicrobiota decreased significantly. The relative abundance of Bacteroidota and Firmicutes significantly increased in NOF treatment, while the relative abundance of Planctomycetota and Acidobacteriota significantly decreased. The relative abundance of Firmicutes in NCF significantly increased. The relative abundance of Chloroflexi and Actinobacteriota significantly increased in MCF treatment. The relative abundance of Cyanobacteria, Desulfobacterota and Verrucomicrobiota significantly increased in MOF treatment. The relative abundance of Fibrobacterota in MOFW showed a significant increase, while Chloroflexi and Actinobacteriota decreased significantly. The above research results indicated that Chloroflexi and Actinobacteriota undergo opposite changes in NCF and MOFW treatments. Verrucomicrobiota also showed opposite trends in CK and MOF treatments. This also indicated that different fertilization treatments have inconsistent effects on certain bacterial species. Moreover, different fertilization treatments had a significant impact on the relative abundance of different members of soil bacterial genera (Figure S1A).
Additionally, the experimental treatments also had a significant impact on the relative abundance of different members in the soil fungal phylum. Compared to other experimental treatments, the relative abundance of Kickxellomycota and Ascomycota significantly increased in the CK treatment. The relative abundance of Olpidiomycota in NOFW significantly increased. The relative abundance of Zoopagomycota in NOF significantly increased. The relative abundance of Calcarisporiellomycota in MOF significantly increased. The relative abundance of Blastocladiomycota and Calcarisporiellomycota in MCF significantly increased. The relative abundance of Basidiomycota and Mortierellomycota treated with MOFW showed a significant increase; nevertheless, Ascomycota decreased significantly (Figure 7B).
Furthermore, compared with CK, the effect of fertilization treatments on the relative abundance of different members of soil fungal genus was obvious (Figure S1B). The above research results indicated that fertilization treatments had a significant impact on the relative abundance of fungal species.

3.4. Differential Analysis of Rhizosphere Soil Microbial Communities

In the principal component analysis (PCA) of bacterial variation, PC1 accounted for 44.58%, and PC2 accounted for 13.33%. In PC1 vs. PC2 comparison, the brown point (CK), and the orange point (NCF) were farthest from the origin and farther from each other. The distance between the yellow dot (MCF) and other dots was the third largest. We found that the distances between CK, PCF, and MCF treatments were relatively large compared to the other four treatments, and the distances between the three treatments were also very long, indicating significant differences in bacterial composition among the three treatments. The closer the distance between two samples, the more similar their composition. NOF, NOFW, MOF, and MOFW are close to each other. The bacterial community composition of the four experimental treatments was similar, and cohesive groups were formed between NOF and NOFW, as well as between MOF and MOFW (Figure 8A,C).
In PCA analysis of fungal variation, PC1 was 42.93% and PC2 was 14.79%. In PC1 vs. PC2 comparison, CK had the farthest distance from other points, while NCF and MCF had the second farthest distance from other processes. Except for these three treatments, the other four treatments were very similar. The composition of the seven fungal treatments was very similar, with each treatment having its own independent composition (Figure 8B,D).

3.5. Relationship Between Rhizosphere Soil Microbial Community and Physicochemical Factors

The relationship between soil microbial community, chemistry, and enzyme activity components was analyzed by redundancy (CCA) (Figure 9). In the analysis of the relationship between soil bacterial communities and chemistry, the two axes of CCA explained 23.33% of the total variation; the first axis explains 15.26% of the variation, indicating that pH, EC, OM, AN, AP, AK, AMg, and ACa were the essential factors affecting bacterial communities (Figure 9A). In the analysis of the relationship between soil bacterial communities and enzyme activity, the two axes of CCA explained 21.57% of the total variation, and the contribution rate of the first axis was 14.77%, indicating that SE, UE, APE, and APPE were the crucial factors affecting bacterial communities (Figure 9C).
In the analysis of the relationship between soil fungal communities and physicochemical properties, the two axes of CCA explained 13.24% of the total variation; the first axis explains 6.83% of the variation, indicating that pH, EC, OM, and AP were the vital factors affecting fungal communities (Figure 9B). In the analysis of the relationship between soil fungal communities and enzyme activity, the two axes of CCA explained 14.43% of the total variation, and the contribution rate of the first axis was 7.45%, indicating that CE, SE, UE, APE, and APPE were key factors affecting bacterial communities (Figure 9D).
In addition, Mantel test results showed that soil pH, EC, OM, AN, AP, AK, AMg, ACa, SE, UE, APE, APPE were significantly correlated with bacterial community composition, while soil pH, EC, OM, AP, CE, SE, UE, APE, APPE were significantly correlated with fungal community composition (Figure 9E, p < 0.05). The results indicated that soil pH, EC, OM, and AP were the main soil fertility factors driving changes in microbial communities.
The Mantel test results also showed that soil pH was significantly positively correlated with CE and APE, but significantly negatively correlated with OM, AN, AP, AK, and UE. EC is significantly positively correlated with AK, AMg, SE, and UE. OM was significantly positively correlated with UE and APPE, but significantly negatively correlated with APE. AN is significantly positively correlated with AP, AK, and POE, but significantly negatively correlated with CE and APE. AP was significantly positively correlated with AK, ACa, and AMg. AK was significantly positively correlated with ACa and AMg, but significantly negatively correlated with CE. ACa was significantly positively correlated with AMg before. There was a significant positive correlation between AMg and SE. CE was significantly positively correlated with APE, but significantly negatively correlated with APPE. SE was significantly positively correlated with APE. UE was significantly negatively correlated with APE (Figure 9E, p < 0.05). This indicated a close correlation between soil chemical composition and enzyme activity.
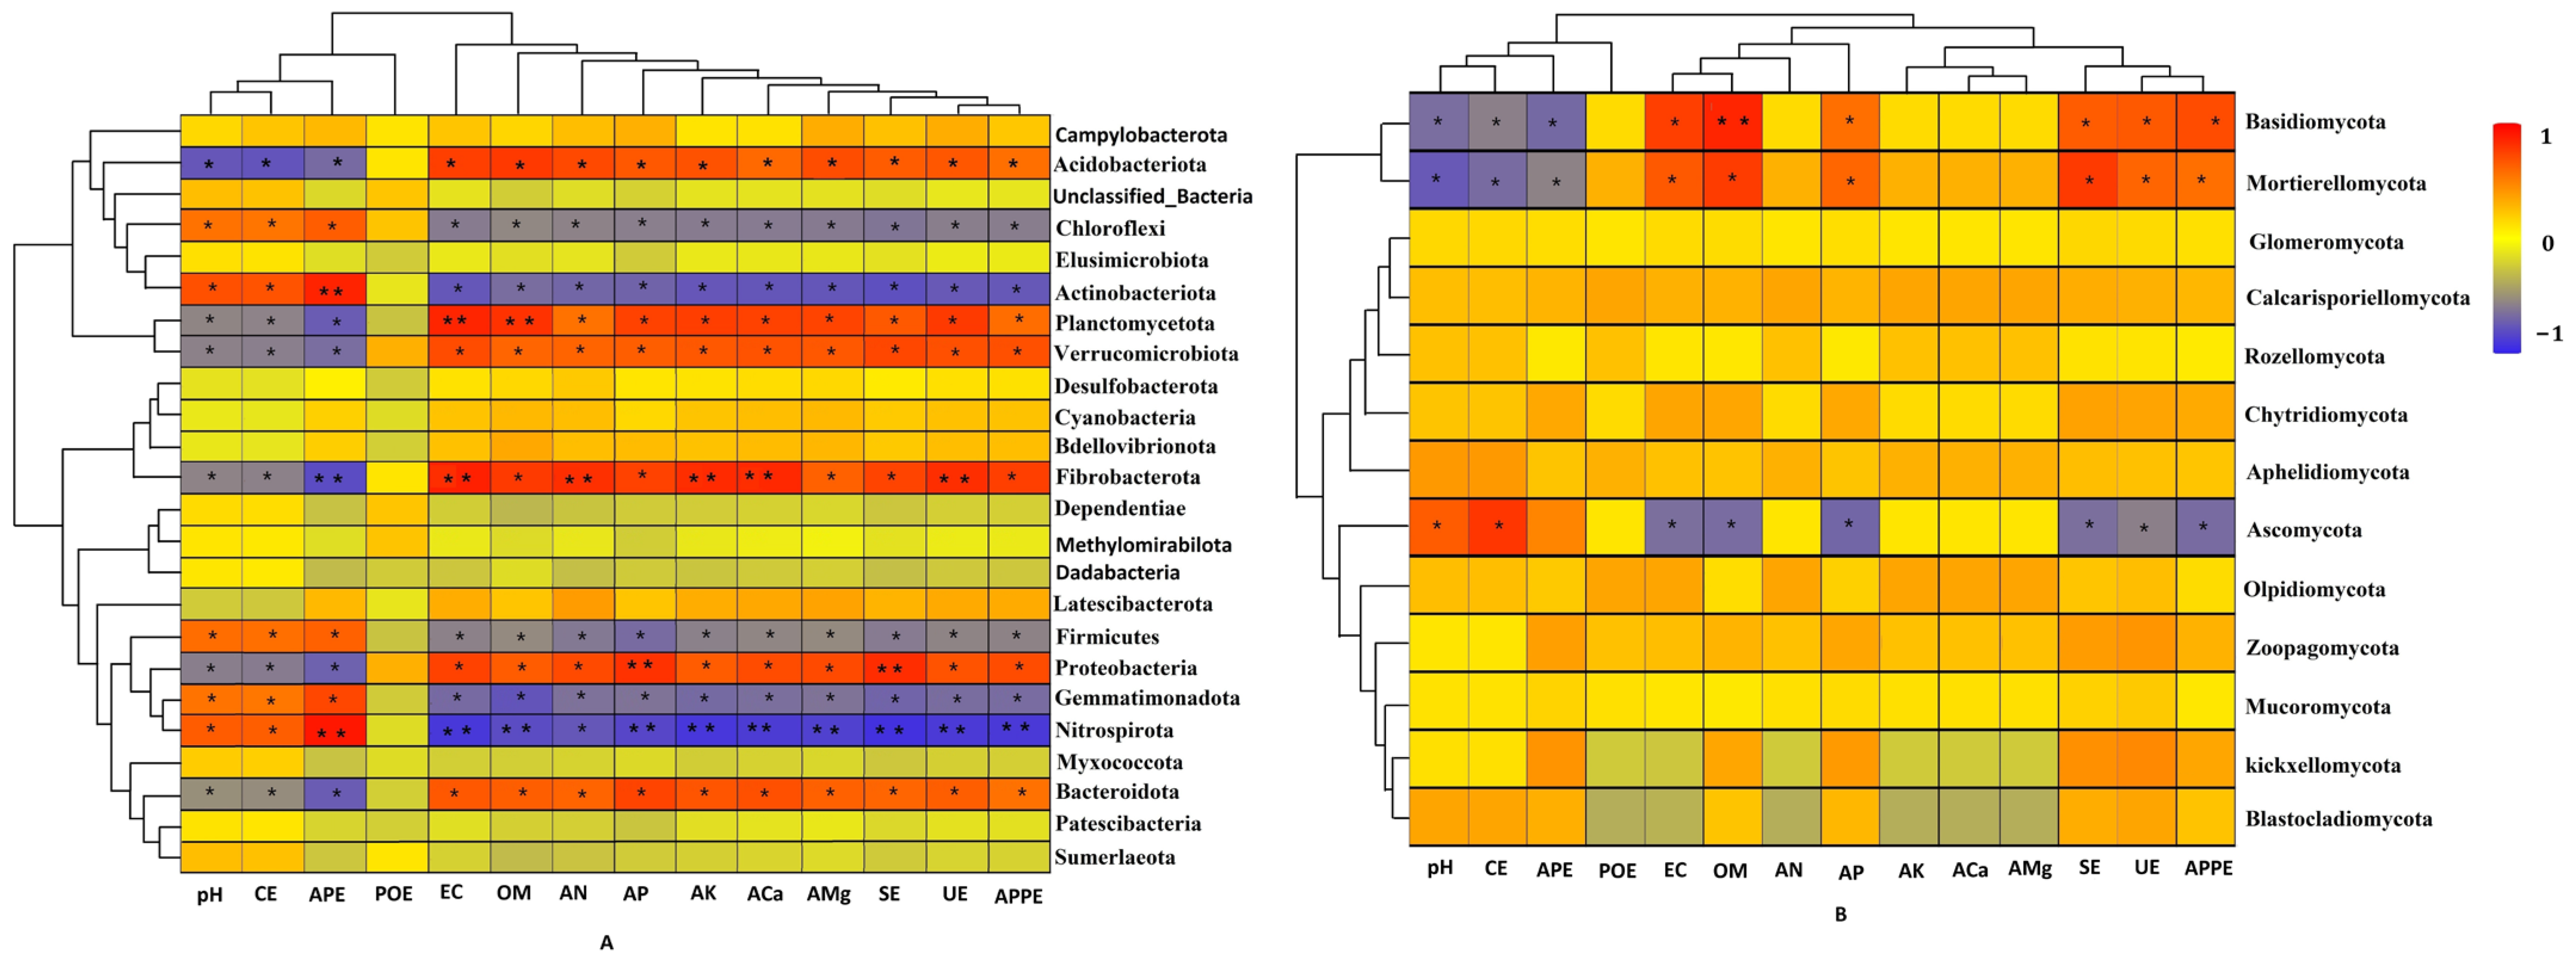
Spearman’s rank correlation was used to evaluate the relationship between the abundance of bacterial and fungal phyla and soil physicochemical properties, as well as soil enzyme activity (Figure 10). In terms of bacterial phyla, Acidobacteriota, Planctomycetota, Verrucomicrobiota, Fibrobacterota, Proteobacteria, Bacteroidetes were all significantly positively correlated with EC, OM, AN, AP, AK, ACa, AMg, SE, UE, and APPE, but significantly negatively correlated with pH, CE, and APE (p < 0.05). However, Chloroflexi, Actinobacteriota, Firmicutes, Gemmatimonadota, Nitrospirota were all significantly positively correlated with pH, CE, and APE, but significantly negatively correlated with EC, OM, AN, AP, AK, ACa, AMg, SE, UE, and APPE (Figure 10A, p < 0.05). In terms of fungal phyla, Basidiomycota and Mortierellomycota were significantly positively correlated with EC, OM, AP, SE, UE, and APPE, but significantly negatively correlated with pH, CE, APE (p < 0.05). Nevertheless, Ascomycota was significantly positively correlated with pH, CE, and APE, but significantly negatively correlated with EC, OM, AP, SE, UE, and APPE (Figure 10B, p < 0.05).

4. Discussion

Soil microorganisms are the most active and important component of soil ecosystems, playing a crucial role in driving soil organic matter decomposition, nutrient cycling, and energy flow. The rhizosphere serves as a gateway for nutrients and water to enter plants, and the diversity of microbial systems is closely related to the rhizosphere. Consequently, varieties in the rhizosphere microbial community have become an important biological indicator for evaluating soil quality. Fertilization is the most common yield increasing measure in agricultural production, which not only affects soil quality and nutrient cycling, but also has an impact on soil microbial community structure and diversity. The soil microbial biomass carbon and nitrogen, soil respiration, and microbial functional activity change with the variation of fertilizer application [43].

4.1. Effect of Organic Fertilizer Treatment on Basic Chemical Properties and Enzyme Activities of Rhizosphere Soil in Coconut

Fertilization can improve the nutrient absorption environment of roots, alter soil physicochemical properties [13], and cause changes in the rhizosphere soil microbial community [15,16,17,18,19,20]. This study indicated that the soil pH of each fertilized treatment decreased to varying degrees compared to the unfertilized treatment, which was consistent with previous research results [19,20]. This may be due to the accumulation of nitrate produced by the decomposition of urea after fertilization into the soil, leading to a decrease in soil pH [21]. However, organic matter is rich in organic matter and produces various organic acids during the decomposition process, which have a buffering effect on soil pH [44,45,46]. Maintaining an appropriate soil pH is crucial for the normal growth and development of crops [47]. Excessive or insufficient soil pH can affect the absorption and utilization of nutrients by crops. Fertilization treatments enhanced soil EC, OM, AN, AP, AK, ACa, and AMg. Compared with the non-fertilization and non-irrigation treatment (CK), the optimized fertilizer + organic fertilizer + irrigation (MOFW) treatment significantly improved the rhizosphere soil EC, OM, AN, AP, AK, ACa, and AMg. This indicated that the combination of optimized fertilizer + organic fertilizers + irrigation significantly improved the availability of soil nutrients. In addition, under the same irrigation conditions, the rhizosphere soils EC, OM, AN, AK, ACa, and AMg of MOFW had higher values than those of conventional fertilizer + organic fertilizer (NOFW) treatment (Figure 2), indicating that reducing the proportion of fertilizer does not reduce soil nutrients. Furthermore, the rhizosphere soils EC, OM, AN, AK, ACa, and AMg treated with optimized fertilizer + organic fertilizer (MOF) and conventional fertilizer + organic fertilizer (NOF) had higher values than those treated with optimized fertilizer and conventional fertilizer (Figure 2). Fertilization can directly increase soil rhizosphere nutrients, but optimizing the combination of chemical and organic fertilizers improves soil properties [48,49]. Previous studies have shown that organic fertilizer treatment can improve the physical and chemical properties of soil, create a favorable soil environment, activate effective soil nutrients, and provide necessary nutrients for plant growth and microbial activity [50,51]. The nutrients provided by organic fertilizer treatment and the use for microbial growth both lead to an increase in soil nutrients [52,53]. The application of organic–inorganic fertilizers combined with irrigation can increase the effective nutrient content of soil [54]. The Mantel test results also showed a significant positive correlation between effective N, P, and K. Therefore, optimized fertilizer + organic fertilizer + irrigation (MOFW) treatment can better promote the increase in EC, OM, AN, AP, AK, ACa, and AMg of coconut rhizosphere soil (Figure 9E).
Compared with CK, fertilization treatments enhanced the activities of CE, POE, SE, UE, APE, and APPE. Among them, CE, POE, SE, UE, APE, and APPE of MOFW showed the highest activity. It is worth noting that MOFW significantly enhanced the activity of CE, POE, SE, UE, APE, and APPE. Moreover, the CE, POE, APE, and APPE of MOFW and NOFW were significantly higher than those of optimized fertilizer (MCF) or conventional fertilizer (NCF) treatments (Figure 3). This indicated that the combination of optimized fertilizer, organic fertilizer, and irrigation significantly improved soil enzyme activity. APPE is considered an important indicator of soil quality; its higher activity is due to stimulating soil microbial growth, organic matter enrichment, and improving nutrient cycling in the soil [55].

4.2. Effect of Different Fertilizer Treatments on Microbial Community Abundance, Diversity, and Composition of Rhizosphere Soil in Coconut

This study found that the OTU number of bacteria in 21 samples was about 1.49~2.5 times that of fungi, indicating that bacteria are the main microorganisms of coconut rhizosphere soil. The number of microorganisms can be used as an indicator of soil fertility and ecological environment. Generally, the more bacteria in the soil, the higher its fertility [56], which is more beneficial for crops. However, the higher the number of fungi and Actinobacteriota in the soil, the lower the soil fertility and the less conducive it is to crop growth [57].
The diversity and richness of bacterial communities can be represented by diversity indices (Simpson and Shannon) and richness indices (ACE, chao1). Diversity index and richness index are important indicators for measuring community diversity. The larger the index, the higher the richness and diversity of the microbial community. In this study, the soil rhizosphere bacterial diversity was lower under the treatments of non-fertilization and non-irrigation (CK), conventional fertilizer (NCF), and optimized fertilizer (MCF) compared to other fertilization treatments (NOF, MOF, MOFW, and NOFW). Among them, the bacterial community diversity was highest under the optimized fertilizer + organic fertilizer + irrigation (MOFW) treatment (Table 1). Soil microbial diversity is closely related to microbial stability, soil quality, and nutrient cycling, and is susceptible to external organic matter input [58]. The application of organic fertilizer improves soil fertility, supplements soil organic matter content, and provides sufficient nutrition for soil microorganisms. Therefore, under the condition of applying organic fertilizer, as the proportion of chemical fertilizer decreases, the diversity of microorganisms increases [59]. Additionally, the combined application of organic fertilizer and chemical fertilizer has a certain complementary effect and can improve the physical and chemical properties of soil [60]. For example, a high proportion of chemical fertilizers can reduce the diversity and richness of soil bacteria in rapeseed and rice [61]. Soil with high organic carbon content has higher microbial diversity [62]. From the treatments of conventional fertilizers (NCF) and optimized fertilizers (MCF), it can be seen that reducing the application of fertilizers does not affect the diversity and richness of microorganisms. This indicates that reducing the use of chemical fertilizers within a certain range can not only ensure consistency with conventional fertilizers, but also effectively improve soil conditions [63].
This study also showed that the ACE and chao1 of CK treatment were the highest, followed by NCF. However, the ACE and chao1 of MCF were the lowest, followed by MCF, NCF, and MOFW. This indicated that the abundance of soil fungal communities in CK was relatively high, while the abundance of soil fungal communities in MCF was the lowest. The Simpson and Shannon index values of CK treatment were the highest, indicating that the fungal community diversity of CK treatment was relatively high. The Simpson index value of NOFW treatment was the lowest, and the Shannon index value of MCF treatment was the lowest, indicating that the fungal community diversity of NOFW and MCF was relatively low (Table 1). The application of organic fertilizers significantly reduces fungal diversity, while the addition of inorganic fertilizers reduces fungal richness [64]. Climate, especially temperature and precipitation, affects the growth and distribution of fungi [65]. Under the same combination of organic and chemical fertilizers, there are significant differences in the abundance and diversity of fungal communities between irrigated and non-irrigated areas. It is worth noting that this study found that fertilization treatments significantly reduced the abundance and diversity of fungal communities of rhizosphere soil in coconut, especially optimized fertilizer + organic fertilizer + irrigation (MOFW) treatment.
The main advantageous bacteria in this study were Acidobacteriota, Proteobacteria, and Actinobacteria, this was consistent with the report about soil microorganisms by Han et al. (2014) [66]. But their relative abundance was not the same. This indicated that there were differences in the relative abundance of dominant bacteria of rhizosphere soil in coconut under different fertilization treatments. Previous studies have found that the diversity, abundance, and microbial community structure of rhizosphere bacteria are influenced by vegetation species, soil type, and soil fertility [22]. Proteobacteria belong to the eutrophic group and typically reproduce rapidly in nutrient rich soils. This indicates that after organic fertilizer treatment, soil fertility and microbial abundance increase, making it suitable for the growth of eutrophic microorganisms [67,68]. Acidobacteria are mostly acidophilic bacteria, and their abundance is significantly negatively correlated with soil pH [69]. In this study, the optimized fertilizer (MCF) treatment significantly increased the relative abundance of Acidobacteriota. The optimized fertilizer + organic fertilizer (MOF) treatment significantly increased the relative abundance of Proteobacteria, while conventional fertilizer (NCF) treatment significantly increased the relative abundance of Actinobacteria (Figure 6A). Compared with other experimental treatments, the relative abundance of Gemmatimonadota, Firmicutes, and Nitrospirota in CK treatment showed a significant increase, while the relative abundance of Actinobacterota, Plantaromycota, and Verrucomicrobiota decreased significantly. The relative abundance of Bacteroidota and Firmicutes significantly increased in NOF treatment, while Plantaromycota, Acidobacteriota, and Campylobacteria significantly decreased. The relative abundance of Elusimicrobiota and Firmicutes in NCF significantly increased. The relative abundance of Chloroflexi and Actinobacterota significantly increased in MCF treatment. The relative abundance of Cyanobacteria, Desulfobacteriota, and Verrucomicrobiota significantly increased in MOF treatment. The relative abundance of Fibrobacterota treated with MOFW showed a significant increase, while Chloroflexi and Actinobacterota decreased significantly. The above research results indicated that Chloroflexi and Actinobacterota undergo opposite changes in NCF and MOFW treatments. This also indicated that compared with the application of conventional chemical fertilizers (NCF) alone, MOFW significantly reduced Chloroflexi and Actinobacterota. Verrucomicrobiota also showed opposite trends in CK and MOF treatments (Figure 7A). This also indicated that different fertilization treatments had inconsistent effects on certain bacterial species. Irrigation water has an impact on soil bacterial communities [70,71]. In the study, there were significant differences in the abundance and diversity of fungal communities between irrigated and non-irrigation under the same organic and chemical fertilizer treatments.
We evaluated the relationship between the abundance of bacterial phyla and soil physicochemical properties, as well as soil enzyme activity, using Spearman’s rank correlation (Figure 10A). Research found that Acidobacteriota, Plantomycota, Verrucomicrobiota, Fibrobacterota, Proteobacteria, and Bacteroidetes were significantly positively correlated with EC, OM, AN, AP, AK, ACa, AMg, SE, UE, and APPE, but significantly negatively correlated with pH, CE, and APE (p < 0.05). However, Chloroflexi, Actinobacteria, Firmicutes, Gemmatimonadota, and Nitrospira all showed significant positive correlations with pH, CE, and APE, but significant negative correlations with EC, OM, AN, AP, AK, ACa, AMg, SE, UE, and APPE (p < 0.05). The above results from this study indicated that optimized fertilizer + organic fertilizer + and irrigation (MOFW) treatment significantly increased the abundance of Proteobacteria, Acidobacteriota, Planctomycota, Verrucomicrobiota, Fibrobacterota, and Bacteroidetes. Proteobacteria is believed to be able to degrade more organic matter in soil [43], indicating that the increase in organic matter input after this fertilization treatment significantly enhances the abundance of Proteobacteria. Bacteroidetes are highly efficient degradation products of complex carbohydrates. The decomposition of polysaccharides enables soluble sugars to be utilized by other organisms, recovering carbon, nitrogen, and water, which has a wide impact on the environment and can be used as a sensitive biological indicator for agricultural soil utilization [5]. Acidobacteriota has a wide range of metabolic and genetic functions, and may play an important ecological role by degrading polysaccharides from plants and fungi [6]. Both nitrogen and phosphorus application can increase the relative abundance of Chloroflexia. Planctomycetota is an important functional microbial genus for nitrogen transformation, which converts ammonia nitrogen and nitrite nitrogen into nitrogen gas. Studies have shown that the relative abundance of Planctomycetota increases under nitrogen soil conditions [43]. Correspondingly, optimized fertilizer + organic fertilizer + irrigation (MOFW) treatment significantly reduced the relative abundance of Actinobacteria and Chloroflexi, as well as the abundance of firmicutes. Many plant pathogenic bacteria belong to Firmicutes, indicating that this fertilization method reduces the threat of soil pathogenic bacteria to plant health [43]. The above results indicate that microorganisms with nutrient degradation function and high metabolic activity survive well under organic fertilizer, chemical fertilizer, and irrigation water treatment.
Additionally, this study also found that the main dominant fungi were Ascomycota, Basidiomycota, Rozellomycota, and Mortierellomycota (Figure 6B). Similar to the dominant fungal phyla in the rhizosphere soil of Camellia oleifera forest [72], it indicated that Ascomycota and Basidiomycota played an important role in soil microorganisms. Compared with non-fertilization and non-irrigation (CK), conventional fertilizer (MCF) treatment significantly improved Ascomycota, conventional fertilizer + organic fertilizer + irrigation (NOFW) treatment significantly improved Basidiomycota, optimized fertilizer + organic fertilizer + irrigation (MOFW) treatment significantly improved Rozellomycota, and conventional fertilizer + organic fertilizer (NOF) treatment significantly improved Mortierellomycota (Figure 6B). Compared with other experimental treatments, the relative abundance of Kickxellomycota and Ascomycota in CK treatment was significantly increased. The relative abundance of Olpidiomycota treated with NOFW was significantly increased. The relative abundance of Zoopagomycota treated with NOF significantly increased. The relative abundance of Calcarisporellomycota treated with MOF was significantly increased. The relative abundance of Blastocladiomycota and Calcisporellomycota significantly increased in MCF treatment. The relative abundance of Basidiomycota and Mortierellomycota treated with MOFW showed a significant increase, while Ascomycota decreased significantly. The above research results indicated that fertilization treatments also had a significant impact on the relative abundance of fungal species. Moreover, it was found that both Basidiomycota and Mortierellomycota were significantly positively correlated with EC, OM, AP, SE, UE, and APPE, but significantly negatively correlated with pH, CE, and APE (Figure 10B, p < 0.05). Nevertheless, Ascomycota was significantly positively correlated with pH, CE, and APE, but significantly negatively correlated with EC, OM, AP, SE, UE, and APPE (p < 0.05). After fertilization, the relative abundance of Ascomycota was higher than that of CK, and the optimized fertilizer + organic fertilizer + irrigation (MOFW) treatment significantly increased the relative abundance of Basidiomycota and Mortierellomycota. This is a fungal group that mainly functions to decompose plant lignification residues and organic carbon, and accelerate nutrient cycling [33,34]. This may be because fertilizers, organic fertilizers, and irrigation water enter the soil, and the improvement of soil conditions is beneficial for the survival of Ascomycota. After fertilization, the relative abundance of Basidiomycota was also higher than that of CK treatment. Previous studies have shown that Basidiomycota is an important decomposer of soil litter or organic matter [43]. The background organic matter content of the coconut soil in this study was low, and the application of a mixture of organic and chemical fertilizers, combined with water, was more conducive to the reproduction and growth of Basidiomycota. However, the relative abundance differences of fungal groups under different fertilization conditions were also significant. The CCA analysis and Mantel test results also indicated a significant correlation between the main nutrients and microbial diversity in soil. Therefore, the effects of different fertilization conditions on soil physicochemical properties and enzyme activity may indirectly affect soil microbial diversity.
It was found by the principal component analysis (PCA) that the bacteria of CK, NCF, and MCF treatments were significantly different from the other four treatments, indicating significant differences in bacterial community structure and composition among the three treatments. Meanwhile, there were significant differences compared to the other four fertilization treatments. The bacterial community structure and composition of conventional fertilizer + organic fertilizer treatment (NOF), conventional fertilizer + organic fertilizer + irrigation treatment (NOFW), optimized fertilizer + organic fertilizer treatment (MOF), and optimized fertilizer + organic fertilizer + irrigation treatment (MOFW) were similar to each other (Figure 8A,C). Except for CK, NCF, and MCF treatments, the fungal community structure and composition of the other four treatments were very similar (Figure 8B,D). This study differed from some other studies. This may be attributed to the diversity and community structure of soil microbial communities being influenced by plant type, soil, planting methods, and fertilization methods [73].

4.3. The Relationship Between Physicochemical Properties, Enzyme Activity, and Microorganisms of Rhizosphere Soil in Coconut Under Different Fertilization Treatments

Soil nutrients, enzyme activity, and microbial communities are important factors in maintaining the microecological environment of plant roots, and they interact and constrain each other [13]. It was found that bacterial diversity of coconut rhizosphere soil in was significantly correlated with soil pH, EC, OM, AN, AP, AK, AMg, and ACa, while fungal diversity was significantly correlated with soil pH, EC, OM, and AP (Figure 9A,B,E). The results indicate that soil pH, EC, OM, and AP were the main soil fertility factors driving changes in microbial communities. This also indicated that environmental factors were the main factors affecting the diversity of bacterial and fungal communities. pH, EC, and organic matter have significant effects on soil microbial structure and diversity. There is a significant positive correlation between soil water content and soil EC [21]. Therefore, the combination of fertilization and irrigation treatment has a positive impact on the soil nutrition effective components and soil microbial diversity in coconut. The relative abundance of Proteobacteria was significantly higher than other phyla, and it has nitrogen fixation function. The increase in Proteobacteria is beneficial for the effective transformation of soil nitrogen, and the nitrogen cycling process has an impact on pH. Therefore, pH changes are closely related to the abundance of Proteobacteria [34]. Some studies have also found a positive correlation between soil organic matter and microbial diversity [35], and this study also indicated a significant positive correlation between soil organic matter (OM), available phosphorus (AP), and microbial diversity index. There is research confirming a significant correlation between phosphorus and bacterial communities [36]. The soil fungal community is mainly influenced by available phosphorus and nitrate nitrogen [37,38]. Similarly, this study found a significant correlation between bacterial diversity and enzymes (such as APE, APPE, SE, UE) of rhizosphere soil in coconut, while fungal diversity was significantly correlated with soil enzymes (such as APE, APPE, SE, CE, UE) (Figure 8C–E). Additionally, changes in microbial activity are driven by both abiotic and biotic factors [74]. Enzymatic degradation provides essential nutrients for microbial growth and affects the composition of microbial communities [75,76]. Low doses of organic fertilizers have led to the activation of many secondary potentially active microorganisms, which react rapidly to additional substrates [77]. The application of fertilizers and biochar/organic fertilizer significantly increase the enzyme activity of two soil compartments compared to the application of inorganic fertilizers [78]. This indicates that organic soil amendments have a better effect on improving enzyme activity, but the changes in acid phosphatase and phenol oxidase activity are more pronounced. The application of fertilizers is crucial for improving soil enzyme activity [79]. The application of biochar or organic fertilizer has a significant impact on enzyme activity in soil. Previous reports have also confirmed soil enzyme activity was correlation with soil properties, including water content, total nitrogen, available phosphorus, available potassium, ammonium+ and nitrate- [80].

5. Conclusions

This study aimed not only to investigate the microbial community characteristics of coconut rhizosphere soil under different fertilization treatments by high-throughput sequencing technology, but also to evaluate the effects of different fertilization methods on nutrient and enzyme activity in coconut rhizosphere soil. The results showed that optimized fertilization + organic fertilizer + irrigation (MOFW) treatment significantly increased the levels of EC, OM, AN, AP, AK, ACa, AMg, and also significantly enhanced the activities of CE, POE, SE, UE, APE, and APPE. Fertilization reduced soil pH and acidified the soil; The application of fertilizers leaded to an increase in the relative abundance and diversity of soil bacteria, but a decrease in fungi. Compared with the control (CK), MOFW significantly increased the abundance of Acidobacteriota, Proteobacteria, Basidiomycota, and Mortierellomycota. Soil pH, EC, OM, and AP were the main soil fertility factors driving changes in microbial communities. Besides, soil CE, SE, UE, APE, APPE were significantly correlated with microbial communities. Acidobacteriota, Proteobacteria, Basidiomycota, and Mortierellomycota were positively correlated with soil EC, OM, AP, APPE, SE, and UE, but significantly negatively correlated with pH, CE, and APE. This study revealed the changes in microbial diversity and community structure of coconut rhizosphere soil under different fertilization conditions, as well as their main driving factors, providing a theoretical basis for rational fertilization and application in coconut production. Additionally, this suggested that decreasing chemical fertilizers can not only ensure consistency with conventional fertilizers, but also effectively improve soil quality.

Supplementary Materials

The following supporting information can be downloaded at: https://www.mdpi.com/article/10.3390/agriculture14111937/s1. Table S1: Bacterial and fungal statistics of sample sequencing data processing results; Table S2. Relative abundance percentage of bacteria and fungi in coconut rhizosphere soil under different fertilization conditions in phylum and genus; Figure S1: Heatmap and cluster analysis of relative abundance of soil bacterial (A) and fungal (B) communities in genus. Notes: CK: non-fertilizer and non-irrigation (control); NCF: conventional fertilizer; MCF: optimized fertilizer; NOF: conventional fertilizer + organic fertilizer; MOF: optimized fertilizer + organic fertilizer; NOFW: conventional fertilizer + organic fertilizer + irrigation; MOFW: optimized fertilizer + organic fertilizer + irrigation. The color gradient (red, yellow, blue) represents the relative abundance of coconut rhizosphere soil microbial community in genus from high to low in different treatments.

Author Contributions

Conceptualization, L.L.; methodology, L.L., C.T. and W.Y.; software, C.T.; validation, Y.L.; writing—original draft preparation, L.L., C.T. and Y.L.; writing—review and editing, L.L.; visualization, L.L.; supervision, L.L.; project administration, L.L. and W.Y.; funding acquisition, W.Y. All authors have read and agreed to the published version of the manuscript.

Funding

This work was funded by the National Key R&D Program of China (2023YFD2200700) and Hainan Province Major Science and Technology Plan Project (zdkj201902).

Institutional Review Board Statement

Not applicable.

Data Availability Statement

Data are contained within the article or Supplementary Materials.

Conflicts of Interest

The authors declare no conflicts of interest.

References

  1. Lu, L.L.; Liu, R.; Xiao, Y.; Li, J.; Shen, X.; Li, H.; Fan, H. Research Progress on Coconut Germplasm Resources, Cultivation and Utilization. J. Trop. Crop. 2021, 42, 1795–1803. (In Chinese) [Google Scholar]
  2. Lu, L.L.; Huang, Y.K.; Yang, Y.D. Research Methods and Fertilization of Coconut Nutrition-Diagnosis and Analysis; China Agriculture Press: Beijing, China, 2022; pp. 1–121. (In Chinese) [Google Scholar]
  3. Feng, M.; Liu, L.; Zeng, P.; Sun, C.; Wei, Q. The content and variation patterns of N, P, and K in coconut leaves at different maturity levels. J. Jiangxi Agri. 2009, 21, 64–69. (In Chinese) [Google Scholar] [CrossRef]
  4. Yang, A.Z.; Tang, H.Y.; Nie, Y.C.; Zhang, X. Responses of cotton growth, yield, and biomass to nitrogen split application ratio. Eur. J. Agron. 2011, 35, 164–170. [Google Scholar] [CrossRef]
  5. Wan, L.J.; He, M.; Tian, Y.; Zheng, Y.Q.; Lv, Q.; Xie, R.J.; Ma, Y.Y.; Deng, L.; Yi, S.L.; Li, J. Effects of partial substitution of chemical fertilizer with organic fertilizer on Ponkan growth and yield and soil biological properties. J. Plant Nutr. Fertil. 2022, 28, 675–687. [Google Scholar] [CrossRef]
  6. Chen, Y.M.; Xiao, H.J.; Zhao, H.; Qin, S.; Gou, J.L.; Zhao, T.F.; Hu, G.; Zhao, L.X.; He, C.X.; Zhang, M.; et al. Effects of commercial organic fertilizer as substitution of chemical fertilizer on growth, yield of spring maize and soil fertility. Southwest China J. Agric. Sci. 2022, 35, 148–152. (In Chinese) [Google Scholar]
  7. Sheteiwy, M.S.; Ali, D.F.S.; Xiong, Y.C.; Brestic, M.; Skalicky, M.; Hamoud, Y.A.; Ulhassan, Z.; Shaghaleh, H.; AbdElgawad, H.; Farooq, M.; et al. Physiological and biochemical responses of soybean plants inoculated with Arbuscular mycorrhizal fungi and Bradyrhizobium under drought stress. BMC Plant Biol. 2021, 21, 195. [Google Scholar] [CrossRef]
  8. Sheteiwy, M.S.; Elgawad, H.A.; Xiong, Y.C.; Macovei, A.; Brestic, M.; Skalicky, M.; Shaghaleh, H.; Hamoud, Y.A.; El-Sawah, A.M. Inoculation with Bacillus amyloliquefaciens and mycorrhiza confers tolerance to drought stress and improve seed yield and quality of soybean plant. Physiol. Plant. 2021, 172, 2153–2169. [Google Scholar] [CrossRef]
  9. Martina, K.; Hana, K.; Ondrej, U.; Strejcek, M.; Jirina, S.; Jindrich, P.T.; Jiri, B.; Katerina, D.; Hana, S. Response of Soil Microbes and Soil Enzymatic Activity to 20 Years of Fertilization. Agronomy 2020, 10, 1542. [Google Scholar] [CrossRef]
  10. Yang, H.; Jin, F.R.; Guan, T.W.; Xu, H.X.; Hu, X.P.; Xie, Q. Short-term effect of partial substitution of inorganic fertilizer with organic fertilizer on soil fertility and fungal communities in greenhouse. Acta Agric. Boreali-Occident. Sin. 2021, 30, 422–430. [Google Scholar] [CrossRef]
  11. Ding, J.; Jiang, X.; Guan, D.; Zhao, B.; Ma, M.; Zhou, B. Influence of inorganic fertilizer and organic manure application on fungal communities in a long-term field experiment of Chinese Mollisols. Appl. Soil Ecol. 2017, 111, 114–122. [Google Scholar] [CrossRef]
  12. Sommermann, L.; Geistlinger, J.; Wibberg, D.; Deubel, A.; Zwanzig, J.; Babin, D.; Schlüter, A.; Schellenberg, I. Fungal community profiles in agricultural soils of a long-term field trial under different tillage, fertilization and crop rotation conditions analyzed by high-throughput ITS-amplicon sequencing. PLoS ONE 2018, 13, e0195345. [Google Scholar] [CrossRef] [PubMed]
  13. Wang, Z.; Liu, Y.; Zhao, L.; Zhang, W.; Liu, L. Change of soil microbial community under long-term fertilization in a reclaimed sandy agricultural ecosystem. Peer. J. 2019, 7, e6497. [Google Scholar] [CrossRef] [PubMed]
  14. Cai, A.; Xu, M.; Wang, B.; Zhang, W.; Liang, G.; Hou, E. Manure acts as a better fertilizer for increasing crop yields than synthetic fertilizer does by improving soil fertility. Soil Tillage Res. 2019, 189, 168–175. [Google Scholar] [CrossRef]
  15. Okore, C.; Ogechukwu, M.; Bright, O.; Assumpta, U.; Agaptus, O.; Uloma, N.; Chimahhalam, A. Effects of NPK fertilizer on soil enzymes and micro biota. GRF Davos. Planet@Risk 2014, 2, 249–254. [Google Scholar]
  16. Geisseler, D.; Scow, K.M. Long-term effects of mineral fertilizers on soil microorganisms—A review. Soil Biol. Biochem. 2014, 75, 54–63. [Google Scholar] [CrossRef]
  17. Xu, L.; Yi, M.; Yi, H.; Guo, E.; Zhang, A. Manure and mineral fertilization change enzyme activity and bacterial community in millet rhizosphere soils. World J. Microbiol. Biotechnol. 2018, 34, 8. [Google Scholar] [CrossRef]
  18. Holík, L.; Hlisnikovský, L.; Honzík, R.; Trögl, J.; Burdová, H.; Popelka, J. Soil microbial communities and enzyme activities after long-term application of inorganic and organic fertilizers at different depths of the soil profile. Sustainability 2019, 11, 3251. [Google Scholar] [CrossRef]
  19. Chang, E.; Chung, R.; Tsai, Y. Effect of different application rates of organic fertilizer on soil enzyme activity and microbial population. Soil Sci. Plant Nutr. 2017, 53, 132–140. [Google Scholar] [CrossRef]
  20. Wang, Q.; Ma, M.; Jiang, X.; Guan, D.; Wei, D.; Zhao, B. Impact of 36 years of nitrogen fertilization on microbial community composition and soil carbon cycling-related enzyme activities in rhizospheres and bulk soils in northeast China. Appl. Soil Ecol. 2019, 136, 148–157. [Google Scholar] [CrossRef]
  21. Van der Bom, F.; Nunes, I.; Sophie, N.; Hansen, V.; Bonnichsen, L.; Magid, J.; Nybroe, O.; Stoumann, L. Long-term fertilisation form, level and duration affect the diversity, structure and functioning of soil microbial communities in the field. Soil Biol. Biochem. 2018, 122, 91–103. [Google Scholar] [CrossRef]
  22. Cai, J.; Zhang, J.; Yu, S.; Lin, H.X.; Li, K.M.; Chen, S.B.; Ou, W.J. Effects of fertilization methods on bacterial diversity and community structure characteristics of cassava rhizosphere soil. J. Fujian Univ. Agric. (Nat. Sci. Ed.) 2022, 51, 15–20. [Google Scholar]
  23. Liu, Z.X.; Liu, J.J.; Xu, Y.X.; Zhang, W.; Mi, G.; Yao, Q.; Wang, G.H. Effects of different continuous cropping years of soybeans on the structure of the bacterial community of black soil. Acta Ecol. Sin. 2019, 39, 4337–4346. [Google Scholar]
  24. Zhang, Z.Y.; Chen, H.; Yang, Y.H.; Chen, T.; Lin, R.Y.; Chen, X.J.; Lin, W.X. Effects of contiInuous cropping on bacterial community diversity in rhizosphere soil of Rehmanniaglutinosa. Chin. J. Appl. Ecol. 2010, 21, 2843–2848. [Google Scholar] [CrossRef]
  25. Lundberg, D.S.; Lebeis, S.L.; Paredes, S.H.; Yourstone, S.; Gehring, J.; Malfatti, S.; Tremblay, J.; Engelbrektson, A.; Kunin, V.; Rio, T.G.D.; et al. Defining the core Arabidopsis thaliana root microbiome. Nature 2012, 488, 86–90. [Google Scholar] [CrossRef] [PubMed]
  26. Caporaso, J.G.; Kuczynski, J.; Stombaugh, J.; Bittinger, K.; Bushman, F.D.; Costello, E.K.; Fierer, N.; Peña, A.G.; Goodrich, J.K.; Gordon, J.I.; et al. QIIME allows analysis of high-throughput community sequencing data. Nat. Methods 2010, 7, 335–336. [Google Scholar] [CrossRef]
  27. Yao, L.; Kong, L.; Yang, Q.; Nian, H.; Liang, J. Analysis of Microbial Diversity in Rhizosphere Soil of Panax notoginseng under Different Water and Microbial Fertilizer Conditions. Agronomy 2024, 14, 922. [Google Scholar] [CrossRef]
  28. Ye, Q.; Park, J.; Laurence, J.S.; Parthasarathy, R.; Misra, A.; Spencer, P. Ternary phase diagram of model dentin adhesive exposed to over-wet environments. J. Dent. Res. 2011, 90, 1434–1438. [Google Scholar] [CrossRef]
  29. Aguirre-von-Wobeser, E.; Rocha-Estrada, J.; Shapiro, L.R.; de la Torre, M. Enrichment of Verrucomicrobia, Actinobacteria and Burkholderiales drives selection of bacterial community from soil by maize roots in a traditional milpa agroecosystem. PLoS ONE 2018, 13, e0208852. [Google Scholar] [CrossRef]
  30. Fu, H.; Yuan, G.; Jeppesen, E.; Ge, D.; Li, W.; Zou, D.; Huang, Z.; Wu, A.; Liu, Q. Local and regional drivers of turnover and nestedness components of species and functional beta diversity in lake macrophyte communities in China. Sci. Total Environ. 2019, 687, 206–217. [Google Scholar] [CrossRef]
  31. Gomez, E.; Ferreras, L.; Toresani, S. Soil bacterial functional diversity as influenced by organic amendment application. Bioresour. Technol. 2006, 97, 1484–1489. [Google Scholar] [CrossRef]
  32. Liu, C.A.; Zhou, L.M. Soil organic carbon sequestration and fertility response to newly-built terraces with organic manure and mineral fertilizer in a semi-arid environment. Soil Tillage Res. 2017, 172, 39–47. [Google Scholar] [CrossRef]
  33. Yin, H.; Zhao, W.; Li, T.; Cheng, X.; Liu, Q. Balancing straw returning and chemical fertilizers in China: Role of straw nutrient resources. Renew. Sustain. Energy Rev. 2018, 81, 2695–2702. [Google Scholar] [CrossRef]
  34. Chen, Y.; Fu, X.; Liu, Y. Effect of farmland scale on farmers’ application behavior with organic fertilizer. Int. J. Environ. Res. Public. Health 2022, 19, 4967. [Google Scholar] [CrossRef] [PubMed]
  35. Jiang, Y.; Li, K.; Chen, S.; Fu, X.; Feng, S.; Zhuang, Z. A sustainable agricultural supply chain considering substituting organic manure for chemical fertilizer. Sustain. Prod. Consum. 2022, 29, 432–446. [Google Scholar] [CrossRef]
  36. Tao, R.; Liang, Y.; Wakelin, S.A.; Chu, G. Supplementing chemical fertilizer with an organic component increases soil biological function and quality. Appl. Soil Ecol. 2015, 96, 42–51. [Google Scholar] [CrossRef]
  37. Ji, L.; Wu, Z.; You, Z.; Yi, X.; Ni, K.; Guo, S.; Ruan, J. Effects of organic substitution for synthetic N fertilizer on soil bacterial diversity and community composition: A 10-year field trial in a tea plantation. Agric. Ecosyst. Environ. 2018, 268, 124–132. [Google Scholar] [CrossRef]
  38. Yan, B.; Zhang, Y.; Wang, Y.; Rong, X.; Peng, J.; Fei, J.; Luo, G. Biochar amendments combined with organic fertilizer improve maize productivity and mitigate nutrient loss by regulating the C–N–P stoichiometry of soil, microbiome, and enzymes. Chemosphere 2023, 324, 138293. [Google Scholar] [CrossRef]
  39. Bao, S. Soil Agrochemical Analysis; China Agricultural Press: Beijing, China, 2000. [Google Scholar]
  40. Chen, L.; Swenson, N.G.; Ji, N.; Mi, X.; Ren, H.; Guo, L.; Ma, K. Differential soil fungus accumulation and density dependence of trees in a subtropical forest. Science 2019, 366, 124–128. [Google Scholar] [CrossRef]
  41. Chen, H.; Boutros, P.C. VennDiagram: A package for the generation of highly-customizable Venn and Euler diagrams in R. BMC Bioinform. 2011, 12, 35. [Google Scholar] [CrossRef]
  42. Willis, A.D. Rarefaction, Alpha Diversity, and Statistics. Front. Microbiol. 2019, 10, 2407. [Google Scholar] [CrossRef]
  43. Xu, J.; Zhang, F.; Li, B.; Wang, J.; Cheng, Z. The effect of fertilization on the characteristics of rhizosphere microbial community in oil soybean. Arid. Zone Res. 2021, 38, 1741–1749. [Google Scholar] [CrossRef]
  44. Sa, X.; Li, M. Effects of different fertilization treatments on inter-root soil nutrients and fungal communities of ‘Cabernet Sauvignon’ grapes. Microbiol. Bull. 2023, 50, 4876–4893. [Google Scholar]
  45. Kaur, K.; Kapoor, K.K.; Gupta, A.P. Impact of organic manures with and without mineral fertilizers on soil chemical and biological properties under tropical conditions. J. Plant Nutr. Soil Sci. 2005, 168, 117–122. [Google Scholar] [CrossRef]
  46. Esteves, C.; Fangueiro, D.; Mota, M.; Martins, M.; Braga, R.P.; Ribeiro, H. Partial replacement of chemical fertilizers with animal manures in an apple orchard: Effects on crop performance and soil fertility. Sci. Hortic. 2023, 322, 112426. [Google Scholar] [CrossRef]
  47. Hartemink, A.E.; Barrow, N. Soil pH-nutrient relationships: The diagram. Plant Soil. 2023, 486, 209–215. [Google Scholar] [CrossRef]
  48. Agegnehu, G.; Nelson, P.N.; Bird, M.I. Crop yield, plant nutrient uptake and soil physicochemical properties under organic soil amendments and nitrogen fertilization on Nitisols. Soil Tillage Res. 2016, 160, 1–13. [Google Scholar] [CrossRef]
  49. Gopinath, K.; Saha, S.; Mina, B.; Pande, H.; Kundu, S.; Gupta, H.S. Influence of organic amendments on growth, yield and quality of wheat and on soil properties during transition to organic production. Nutr. Cycl. Agroecosys. 2008, 82, 51–60. [Google Scholar] [CrossRef]
  50. Bhatt, M.K.; Labanya, R.; Joshi, H.C. Influence of long-term chemical fertilizers and organic manures on soil fertility—A review. Univers. J. Agric. Res. 2019, 7, 177–188. [Google Scholar]
  51. Sharma, A.; Chetani, R. A review on the effect of organic and chemical fertilizers on plants. Int. J. Res. Appl. Sci. Eng. Technol. 2017, 5, 677–680. [Google Scholar] [CrossRef]
  52. Liu, J.; Shu, A.; Song, W.; Shi, W.; Li, M.; Zhang, W.; Li, Z.; Liu, G.; Yuan, F.; Zhang, S.; et al. Long-term organic fertilizer substitution increases rice yield by improving soil properties and regulating soil bacteria. Geoderma 2021, 404, 115287. [Google Scholar] [CrossRef]
  53. Han, J.; Dong, Y.; Zhang, M. Chemical fertilizer reduction with organic fertilizer effectively improve soil fertility and microbial community from newly cultivated land in the Loess Plateau of China. Appl. Soil Ecol. 2021, 165, 103966. [Google Scholar] [CrossRef]
  54. Káš, M.; Mühlbachová, G.; Kusá, H.; Pechová, M. Soil phosphorus and potassium availability in long-term field experiments with organic and mineral fertilization. Plant Soil Environ. 2016, 62, 558–565. [Google Scholar] [CrossRef]
  55. Adetunji, A.T.; Lewu, F.B.; Mulidzi, R.; Ncube, B. The biological activities of β-glucosidase, phosphatase and urease as soil quality indicators: A review. J. Soil Sci. Plant Nutr. 2017, 17, 794–807. [Google Scholar] [CrossRef]
  56. Jiang, J.; Song, M. The role of plants and soil microorganisms in regulating nutrient cycling in ecosystems. Chin. J. Ecol. 2010, 34, 979–988. [Google Scholar]
  57. Ma, Y.; Wei, M.; Wang, X. Changes in the microbial community and enzyme activity in the root zone of cucumber under continuous cropping in a solar greenhouse. J. Appl. Ecol. 2004, 15, 1005–1008. [Google Scholar]
  58. Fan, X.G.; Jin, K.; Li, Z.M.; Rong, X.N. Research progress on soil microbial diversity under different fertilization and farming systems. J. Plant Nutr. Fertil. 2010, 16, 744–751. [Google Scholar]
  59. Hu, Y.H.; Zhao, Y.; Ren, Z.G.; Yang, S.Y.; Tang, H.Z.; Zhang, X.B.; Wang, B.B.; Lv, L.W. Effects of bioorganic fertilizer on the fungal community of the pineapple rhizosphere and incidence of heart rot. J. Fruit. Sci. 2022, 39, 1678–1690. [Google Scholar]
  60. Xu, Y.C.; Shen, Q.R.; Ran, W. Effects of long-term no-tillage and application of organic fertilizer on soil microbial biomass carbon, nitrogen and phosphorus. Acta Pedol. Sin. 2002, 39, 83–90. [Google Scholar]
  61. Venter, Z.S.; Jacobs, K.; Hawkins, H.J. The impact of crop rotation on soil microbial diversity: A meta-analysis. Pedobiologia 2016, 59, 215–223. [Google Scholar] [CrossRef]
  62. Li, C.Y.; Li, X.L.; Zhang, Y.X.; Sun, H.F.; Li, C.Y.; Jing, L.Q.; Yang, X.G.; Liu, K. Response of soil microbial community structure to different degradation in alpine swamp wetland in the source region of the Yellow River. J. Environ. Sci. 2018, 42, 3971–3984. [Google Scholar]
  63. Zhao, Z.J.; Sun, J.P.; Dai, X.L.; Liu, Y.H. Effects of straw returning combined with reduced fertilization on rice yield and soil nutrients. Jiangsu Agric. Sci. 2022, 50, 66–71. [Google Scholar]
  64. Chen, C.; Zhang, J.N.; Lu, M.; Qin, C.; Chen, Y.H.; Yang, L.; Shen, Q.R. Microbial communities of an arable soil treated for 8 years with organic and inorganic fertilizers. Biol. Fertil. Soil. 2016, 52, 455–467. [Google Scholar] [CrossRef]
  65. Feng, B.; Yang, Z. Studies on diversity of higher fungi in Yunnan, southwestern China: A review. Plant Divers. 2018, 40, 165–171. [Google Scholar] [CrossRef] [PubMed]
  66. Han, Y.F.; Yi, W.H.; Wang, W.B.; Wang, Y.P.; Wang, H.T. Study of soil bacterial diversity in continuous poplar plantation based on high-throughput sequencing technology. Shandong Univ. J. (Sci. Ed.) 2014, 49, 1–6. [Google Scholar]
  67. Zhang, Y.J.; Zhang, S.; LI, S.; Jin, B.H.; Quan, Y.J.; Wang, W.P.; Yang, K.; He, H.X. Effects of Panax notoginseng bionic planting on rhizosphere soil microbial diversity in Shilin County. J. Yunnan Agric. Univ. (Nat. Sci. Ed.) 2021, 36, 1–7. [Google Scholar]
  68. Sha, Y.X.; Huang, Z.Y.; Li, Y.X.; Zhao, P. Effects of biological inoculants on the structure and function of soil microbial communities. J. Agric. Environ. Sci. 2022, 41, 2752–2762. [Google Scholar]
  69. Ding, X.J.; Huang, Y.L.; Jin, R.Y.; Ma, F.Y.; An, R.; Tian, Q.; Chen, B.J. Study on the structure and diversity of soil bacteria in four plantations in the Yellow River Delta based on high-throughput sequencing. Acta Ecol. Sin. 2018, 38, 5857–5864. [Google Scholar]
  70. Li, Z.; Li, Z.; Letuma, P.; Zhao, H.; Zhang, Z.; Lin, W.; Chen, H.; Lin, W. A positive response of rice rhizosphere to alternate moderate wetting and drying irrigation at grain filling stage. Agric. Water Manag. 2018, 207, 26–36. [Google Scholar] [CrossRef]
  71. Moreno, J.L.; Bastida, F.; Ondoño, S.; García, C.; Manuela, A.A.; Francisco, R.L. Agro-forestry management of Paulownia plantations and their impact on soil biological quality: The effects of fertilization and irrigation treatments. Appl. Soil Ecol. 2017, 117, 46–56. [Google Scholar] [CrossRef]
  72. Fei, Y.; Huang, Y.; Zhang, X.; Zhang, Y.; Cao, G.; Chen, S.; Lan, S.; Wang, D. Effects of different organic fertilizer treatments on the soil microbial community structure in the purple-soil Camellia oleifera forest. Chinese J. Appl. Env. Biol. 2020, 26, 919–927. [Google Scholar] [CrossRef]
  73. Chen, W.; Zhang, X.; Hu, Y.; Zhao, Y. Effects of Different Proportions of Organic Fertilizer in Place of Chemical Fertilizer on Microbial Diversity and Community Structure of Pineapple Rhizosphere Soil. Agronomy 2024, 14, 59. [Google Scholar] [CrossRef]
  74. Semenov, M.; Krasnov, G.; Semenov, V.; Ksenofontova, N.; Zinyakova, N.B.; van Bruggen, A.H.C. Does fresh farmyard manure introduce surviving microbes into soil or activate soil-borne microbiota? J. Environ. Manag. 2021, 294, 113018. [Google Scholar] [CrossRef]
  75. Bowles, T.M.; Acosta-Martínez, V.; Calderón, F.; Jackson, L.E. Soil enzyme activities, microbial communities, and carbon and nitrogen availability in organic agroecosystems across an intensively-managed agricultural landscape. Soil Biol. Biochem. 2014, 68, 252–262. [Google Scholar] [CrossRef]
  76. Zheng, Q.; Hu, Y.; Zhang, S.; Noll, L.; Böckle, T.; Dietrich, M.; Wanek, W. Soil multifunctionality is affected by the soil environment and by microbial community composition and diversity. Soil Biol. Biochem. 2019, 136, 107521. [Google Scholar] [CrossRef]
  77. Zhang, X.; Li, P.; Zhao, M.; Wang, S.; Sun, B.; Zhang, Y.; Wang, Y.; Chen, Z.; Xie, H.; Jiang, N.; et al. Organic Fertilizer with High Nutrient Levels Affected Peanut-Growing Soil Bacteria More Than Fungi at Low Doses. Agronomy 2024, 14, 765. [Google Scholar] [CrossRef]
  78. Ai, C.; Liang, G.; Sun, J.; Wang, X.; Zhou, W. Responses of extracellular enzyme activities and microbial community in both the rhizosphere and bulk soil to long-term fertilization practices in a fluvo-aquic soil. Geoderma 2012, 173–174, 330–338. [Google Scholar] [CrossRef]
  79. Zhang, L.; Chen, W.; Burger, M.; Yang, L.; Gong, P.; Wu, Z. Changes in Soil Carbon and Enzyme Activity as a Result of Different Long-Term Fertilization Regimes in a Greenhouse Field. PLoS ONE 2015, 10, e0118371. [Google Scholar] [CrossRef]
  80. Akça, M.O.; Namlı, A. Effects of poultry litter biochar on soil enzyme activities and tomato, pepper and lettuce plants growth. Eurasian J. Soil Sci. 2015, 4, 161–168. [Google Scholar] [CrossRef]
Figure 1. Experimental design for different fertilization of coconut fields. (A) Field layout for 7 experimental treatments. (B) Three biological replicates with 7 experimental treatments, each with an area of 76 m2. Notes: CK: non-fertilizer and non-irrigation (control); NCF: conventional fertilizer; MCF: optimized fertilizer; NOF: conventional fertilizer + organic fertilizer; MOF: optimized fertilizer + organic fertilizer; NOFW: conventional fertilizer + organic fertilizer + irrigation; MOFW: optimized fertilizer + organic fertilizer + irrigation.
Agriculture 14 01937 g001
Figure 2. Physicochemical properties of rhizosphere soil in coconut under different fertilization conditions. Notes: DW: dry weight; CK: non-fertilizer and non-irrigation (control); NCF: conventional fertilizer; MCF: optimized fertilizer; NOF: conventional fertilizer + organic fertilizer; MOF: optimized fertilizer + organic fertilizer; NOFW: conventional fertilizer + organic fertilizer + irrigation; MOFW: optimized fertilizer + organic fertilizer + irrigation. EC: electrical conductivity; OM: organic matter; AN: alkaline nitrogen; AP: available phosphorus; AK: available potassium; ACa: available calcium; AMg: available magnesium. The values are the averages of 3 biological replicates for each treatment. Different lowercase letters indicate significant differences in fertilizer treatments (analysis of variance Student’s LSD test, p < 0.05). The vertical error bar represents the standard error bar.
Agriculture 14 01937 g002
Figure 3. Enzyme activities of coconut rhizosphere soil under different fertilization conditions. Notes: FW: fresh weight; CK: non-fertilizer and non-irrigation (control); NCF: conventional fertilizer; MCF: optimized fertilizer; NOF: conventional fertilizer + organic fertilizer; MOF: optimized fertilizer + organic fertilizer; NOFW: conventional fertilizer + organic fertilizer + irrigation; MOFW: optimized fertilizer + organic fertilizer + irrigation; CE: catalase; POE: polyphenol oxidase; SE: sucrase; UE: Urease; APE: acid protease; APPE: acid phosphatase. The values are the average of 3 biological replicates for each treatment. Different lowercase letters indicate significant differences in fertilizer treatments (analysis of variance Student’s LSD test, p < 0.05). The vertical error bar represents the standard error bar.
Agriculture 14 01937 g003
Figure 4. Rarefaction curves of bacterial community (A) and fungal community (B) from different treatment samples. The horizontal axis represents the sorting depth, and the vertical axis represents the median of the alpha diversity index calculated 10 times. The number of OTUs from bacteria (C) and fungi (D) in rhizosphere soil samples from 7 treatments. Venn plots of bacterial (E) and fungi (F) in rhizosphere soil samples from 7 different treatments.
Agriculture 14 01937 g004
Figure 5. Spearman rank correlation analysis the relationship between soil characteristics and soil bacteria (A) and fungi (B) diversity indices. Notes: EC: electrical conductivity; OM: organic matter; AN: alkaline nitrogen; AP: available phosphorus; AK: available potassium; ACa: available calcium; AMg: available magnesium; CE: catalase; POE: polyphenol oxidase; SE: sucrase; UE: Urease; APE: acid protease; APPE: acid phosphatase. There are significant differences between “*” and “**” at p < 0.05 and p < 0.01, respectively.
Agriculture 14 01937 g005
Figure 6. Relative abundance analysis of dominant soil microbial communities of rhizosphere soil in coconut. (A) Dominant rhizosphere soil bacterial community in phylum; (B) dominant rhizosphere soil fungal community in phylum; (C) dominant rhizosphere soil bacterial community in genus; (D) dominant rhizosphere soil fungal community in genus. Notes: CK: non-fertilizer and non-irrigation (control); NCF: conventional fertilizer; MCF: optimized fertilizer; NOF: conventional fertilizer + organic fertilizer; MOF: optimized fertilizer + organic fertilizer; NOFW: conventional fertilizer + organic fertilizer + irrigation; MOFW: optimized fertilizer + organic fertilizer + irrigation.
Agriculture 14 01937 g006
Figure 7. The heatmap and cluster analysis of the relative abundance of bacteria (A) and fungi (B) communities in phylum based on binary_jaccard. Notes: CK: non-fertilizer and non-irrigation (control); NCF: conventional fertilizer; MCF: optimized fertilizer; NOF: conventional fertilizer + organic fertilizer; MOF: optimized fertilizer + organic fertilizer; NOFW: conventional fertilizer + organic fertilizer + irrigation; MOFW: optimized fertilizer + organic fertilizer + irrigation. The color gradient (red, yellow, blue) represents the relative abundance of coconut rhizosphere soil microbial community in phylum from high to low in different treatments.
Agriculture 14 01937 g007
Figure 8. Principal component analysis (PCA) and cluster tree of microbial diversity. (A) PCA for bacterial Diversity; (B) PCA for fungal diversity; (C) cluster tree at the bacterial phylum level; (D) cluster tree at the fungal phylum level. Notes: CK: non-fertilizer and non-irrigation (control); NCF: conventional fertilizer; MCF: optimized fertilizer; NOF: conventional fertilizer + organic fertilizer; MOF: optimized fertilizer + organic fertilizer; NOFW: conventional fertilizer + organic fertilizer + irrigation; MOFW: optimized fertilizer + organic fertilizer + irrigation.
Agriculture 14 01937 g008
Figure 9. The environmental driving factors of soil microbial community composition. Redundancy analysis (CCA) of bacterial (A) and fungal (B) communities and physicochemical properties from coconut rhizosphere soil. Redundancy analysis (CCA) of bacterial (C) and fungal (D) communities and enzyme activity from coconut rhizosphere soil. The direction of the arrow represents the correlation with the first two standard axes, and the length of the arrow represents the strength of the correlation. (E) The edge width corresponds to the Mantel statistic of distance correlation. The edge color represents the statistical significance based on 9999 permutations. The pairwise comparison of soil fertility, enzyme activity factors, and soil bacterial and fungal communities. Stars represented Spearman’s correlation coefficients, with “*” p < 0.05, “**” p < 0.01 and “***” p < 0.001, respectively. Notes: CK: non-fertilizer and non-irrigation (control); NCF: conventional fertilizer; MCF: optimized fertilizer; NOF: conventional fertilizer + organic fertilizer; MOF: optimized fertilizer + organic fertilizer; NOFW: conventional fertilizer + organic fertilizer + irrigation; MOFW: optimized fertilizer + organic fertilizer + irrigation; EC: electrical conductivity; OM: organic matter; AN: alkaline nitrogen; AP: available phosphorus; AK: available potassium; ACa: available calcium; AMg: available magnesium; CE: catalase; POE: polyphenol oxidase; SE: sucrase; UE: Urease; APE: acid protease; APPE: acid phosphatase.
Agriculture 14 01937 g009
Figure 10. Spearman’s rank correlation between soil nutrients and relative abundance of different bacteria (A) and fungi (B) in phylum. Notes: EC: electrical conductivity; OM: organic matter; AN: alkaline nitrogen; AP: available phosphorus; AK: available potassium; ACa: available calcium; AMg: available magnesium; CE: catalase; POE: polyphenol oxidase; SE: sucrase; UE: Urease; APE: acid protease; APPE: acid phosphatase. There are significant differences between “*” and “**” at p < 0.05 and p < 0.01, respectively.
Agriculture 14 01937 g010
Table 1. Alpha diversity index of bacteria and fungi under different fertilization treatments.
Microbial CommunityTreatmentsOTUACEChao1SimpsonShannonCoverage
BacteriaCK1118 ± 1.34 b1266 ± 1.01 b1295 ± 1.22 b0.9889 ± 0.004 b7.9140 ± 0.02 a0.9964 ± 0.003 a
NCF1176 ± 1.02 ab1264 ± 0.97 ab1283 ± 1.01 b0.9884 ± 0.002 b7.8952 ± 0.03 a0.9977 ± 0.006 a
MCF1161 ± 1.11 ab1255 ± 1.18 ab1280 ± 1.15 b0.9936 ± 0.001 a8.3356 ± 0.06 a0.9976 ± 0.008 a
NOF1260 ± 1.34 ab1276 ± 1.02 ab1313 ± 1.34 ab0.9909 ± 0.002 a8.0785 ± 0.03 a0.9972 ± 0.006 a
MOF1262 ± 1.32 a1368 ± 1.05 a1391 ± 1.20 a0.9918 ± 0.006 a8.2896 ± 0.08 a0.9971 ± 0.008 a
NOFW1322 ± 1.42 a1387 ± 1.03 a1395 ± 1.24 a0.9908 ± 0.001 a8.2612 ± 0.05 a0.9980 ± 0.004 a
MOFW1402 ± 1.41 a1481 ± 1.11 a1517 ± 1.02 a0.9938 ± 0.006 a8.4901 ± 0.08 a0.9976 ± 0.006 a
FungiCK750 ± 1.02 a903 ± 1.08 a927 ± 1.02 a0.9739 ± 0.004 a7.0966 ± 0.05 a0.9985 ± 0.005 a
NCF672 ± 0.98 ab706 ± 0.87 ab756 ± 1.04 ab0.9724 ± 0.006 a6.9655 ± 0.08 a0.9993 ± 0.009 a
MCF556 ± 0.88 b582 ± 0.97 b598 ± 1.03 b0.9598 ± 0.007 a6.5597 ± 0.09 a0.9997 ± 0.005 a
NOF639 ± 1.23 ab718 ± 1.02 ab769 ± 1.15 ab0.9659 ± 0.007 a6.7788 ± 0.07 a0.9988 ± 0.009 a
MOF729 ± 0.87 a898 ± 0.93 a906 ± 1.23 a0.9641 ± 0.008 a6.8733 ± 0.05 a0.9986 ± 0.006 a
NOFW685 ± 0.88 ab739 ± 0.76 ab742 ± 1.01 ab0.9052 ± 0.008 a6.7092 ± 0.08 a0.9992 ± 0.009 a
MOFW670 ± 1.03 ab715 ± 0.84 ab744 ± 1.05 ab0.9596 ± 0.008 a6.6961 ± 0.05 a0.9992 ± 0.006 a
Note: The values are mean ± standard deviation (n = 3), and different lowercase letters indicate significant differences (p < 0.05) based on one-way analysis of variance combined with Student’s LSD test. CK: non-fertilizer and non-irrigation (control), NCF: conventional fertilizer, MCF: optimized fertilizer, NOF: conventional fertilizer + organic fertilizer, MOF: optimized fertilizer + organic fertilizer, NOFW: conventional fertilizer + organic fertilizer + irrigation, MOFW: optimized fertilizer + organic fertilizer + irrigation.
Disclaimer/Publisher’s Note: The statements, opinions and data contained in all publications are solely those of the individual author(s) and contributor(s) and not of MDPI and/or the editor(s). MDPI and/or the editor(s) disclaim responsibility for any injury to people or property resulting from any ideas, methods, instructions or products referred to in the content.