Article

Are Governmental Policies an Effective Way to Reduce Agricultural Carbon Emissions? An Empirical Study of Shandong in Main Grain Producing Areas of China

1
School of Public Administration, China University of Geosciences, Wuhan 430070, China
2
School of Land Science and Technology, China University of Geosciences, Beijing 100083, China
3
Key Laboratory of Land Consolidation and Rehabilitation, Ministry of Natural Resources, Beijing 100083, China
*
Authors to whom correspondence should be addressed.
Agriculture 2024, 14(11), 1940; https://doi.org/10.3390/agriculture14111940
Submission received: 3 September 2024 / Revised: 19 October 2024 / Accepted: 29 October 2024 / Published: 30 October 2024
(This article belongs to the Section Agricultural Economics, Policies and Rural Management)

Abstract

:
In the context of global and national carbon reduction targets, agricultural carbon emissions have become a critical focus. As global food demand increases, numerous agricultural policies have been implemented. Faced with limited policy resources, evaluating the impact of these policies on agricultural carbon emissions and production is essential. This study examined the relationship between food production and agricultural carbon emissions during the stage of agricultural development in Shandong Province, one of China’s major grain-producing regions, using the decoupling model. Additionally, the coupled coordination model was employed to assess the specific influence of agricultural policy clusters on this transformation. The results indicate that Shandong is transitioning from high-input, extensive farming to green, low-carbon, modern agriculture, with most cities shifting from strong negative decoupling to strong decoupling. Over time, the role of agricultural policies in driving this shift has grown more significant. Future policymaking should prioritize the overall quality of agricultural producers and maintain a continuous focus on sustainable, green development. Ensuring that policy directions align with evolving stages of agricultural development and adjusting them in real-time will be crucial.

1. Introduction

Reducing carbon emissions is a global priority. Since the Paris Agreement came into force in 2016, countries have implemented stringent measures to curb emissions, aiming to limit global temperature rise to within 2 °C, with efforts to cap it at 1.5 °C. Agriculture accounts for nearly one-third of global greenhouse gas emissions, making it essential to address agricultural carbon outputs [1,2]. The extensive use of fertilizers and pesticides significantly increases emissions [3,4,5], with global fertilizer use having quadrupled in the past 50 years [6,7,8]. Rising fossil fuel consumption in agriculture also contributes to large-scale emissions. While agricultural plastic films enhance crop yields, they generate waste that indirectly contributes to carbon emissions. Modern agriculture practices, such as improved irrigation systems and mechanization, can mitigate these impacts [9]. Technological innovation and economic development, particularly in recycling-based farming and scientific fertilization, have proven effective in reducing emissions while sustaining food production, especially in developing countries [10,11,12,13]. However, as global food demand continues to rise, agricultural inputs are expected to grow. By 2050, the global population is projected to increase by 50%, driving a 60–110% rise in food demand [14]. In regions where agricultural knowledge is less advanced, inefficient farming practices persist, resulting in higher input costs and lower productivity [15,16]. Without timely government intervention, agricultural carbon emissions are expected to increase by 30% by 2050, posing serious threats to global environmental efforts [17].
In the ongoing exploration of modernized agriculture, rural modernization is a critical direction of agricultural development. However, the rapid expansion of the agricultural economy has been significantly driven by increased reliance on chemical fertilizers and pesticides. Although agricultural growth and carbon emissions are linked [18,19], China’s agricultural carbon emissions and economic growth are becoming increasingly decoupled as agricultural development progresses [20]. Despite this trend, a correlation persists between agricultural output and carbon emissions, with increased food production still heavily reliant on higher emissions [21]. Therefore, to balance the dual goals of enhancing food production and reducing carbon emissions, targeted agricultural policies are essential. Although “carbon” was only recently introduced into global policy frameworks, many countries have already implemented measures aimed at improving agricultural efficiency sustainability [22,23]. Agricultural policies play a crucial role in guiding and supporting production by encouraging the adoption of more efficient and environmentally friendly practices through incentives and regulations. However, optimizing the allocation of limited policy resources remains a significant challenge. To better understand the diverse impacts of different policies, classifying them into policy clusters offers a practical approach to research [24]. Current research on agricultural policy primarily focuses on technological advancements, energy innovation, economic factors, waste management, and mechanization. Policies that support the development of clean technologies by providing research and development funding, tax incentives, sustainable intensification, and precision agriculture can help boost yields while reducing resource consumption and environmental impact [25,26,27]. Additionally, with green financial incentives, governments can actively promote green technology innovation and encourage agricultural producers to adopt carbon-reducing practices, such as carbon caps, carbon trading, and carbon offset programs [28,29]. These initiatives may involve measures like reducing the use of formula fertilization through soil testing, minimizing pesticides and plastic usage [30], and implementing carbon sequestration techniques such as cover cropping, crop rotation, and agroforestry. Furthermore, agricultural policies should promote the efficient waste management, converting waste into energy or other valuable resources to reduce emissions [31]. Simultaneously, policies should focus on fostering innovation in carbon emission control, ensuring targeted reductions without compromising agricultural productivity [32].
Common methods for estimating carbon emissions impact include the SBM model [33,34,35], regression models [36,37], and the Tapio decoupling model [38,39]. Regression models require high-quality data, while the SBM model focuses on resource allocation at a point in time, making it less effective for capturing the evolving relationship over time. The decoupling model directly analyzes the relationship between economic activities and environmental impacts, and it is more flexible with respect to various data structures and research goals. The decoupling model, initially introduced by the Organization for Economic Co-operation and Development (OECD) [40] and subsequently refined by Tapio [41], analyzes the interplay between economic growth and environmental pressures. Decoupling typically refers to reducing reliance on natural resources and mitigating environmental impacts without compromising economic growth. An increasing number of countries are adopting decoupling as a policy goal to separate environmental impacts from economic growth [42]. Due to its flexibility and broad applicability, the decoupling model is widely used to examine the relationship between agricultural carbon emissions and economic growth and the dependency of regional agricultural development on agricultural resource inputs. This study used a decoupling model to analyze the relationship between agricultural carbon emissions and output, focusing on regional agricultural production’s dependence on resource inputs [43]. Changes in this dependency reflect shifts in regional agricultural development. The coupled coordination model (CCD) is another essential tool for evaluating the interaction between resource utilization and ecological protection, as well as assessing the degree of sustainable development [44]. It measures the interaction and coherence between systems and their progress toward sustainable development. The CCD model has been widely applied to analyze the interaction between urbanization and the ecological environment [45], economic development and the ecological environment [46], and ecosystem services and urban development [47]. It is also useful for assessing and comparing the outcomes of policy interventions [48]. Therefore, this study used the CCD model to examine how policy implementation affects the decoupling of agricultural carbon emissions, comparing the effects of different policy clusters and offering recommendations for policy formulation in Shandong Province.
The factors influencing agricultural carbon emissions have been extensively studied, as seen in the existing literature. China is one of the world’s largest carbon emitters. In response to the rising carbon emissions from economic development and population expansion, the Chinese government set the goals of carbon peaking by 2030 and carbon neutrality by 2060. To achieve the targets, many relevant policies have been implemented by Chinese government across several major food-producing regions including Shandong. However, few studies have specifically examined how policy clusters affect both agricultural carbon emissions and food production. This study proposes a framework for evaluating the roles of policy clusters in the decoupling of agricultural carbon emissions from grain production. It systematically analyzes the characteristics of agricultural carbon emissions and food production, as well as the effects of agricultural policy clusters. The specific objectives of this study were (1) to investigate the developmental trends in agricultural carbon emissions and grain production in Shandong Province and verify their relationship and (2) to assess the influence of agricultural policies on carbon emissions and grain production while exploring the impact of different policy clusters. This study identifies the spatiotemporal characteristics of how agricultural policy clusters affect agricultural production, providing a reference for targeted policy evaluations and offering effective recommendations for future policy formulation.

2. Materials and Methods

2.1. Study Area

Shandong Province, located in eastern China between latitudes 34°22.9′ to 38°24.01′ N and longitudes 114°47.5′ to 122°42.3′ E (Figure 1), covers an area of 157,600 km2. Of this, 83,800 km2, or 53.17%, is cropland. As one of China’s major agricultural regions, Shandong is characterized by plains and a warm temperate monsoon climate, with ample sunshine and concentrated summer rainfall. The province operates a double-cropping system. Known as the Granary, Cotton, and Oil Repository and the Home of Fruits and Aquatic Products, Shandong has long led China in agricultural value-added. It is also a pioneering region for green, low-carbon, high-quality development in China.

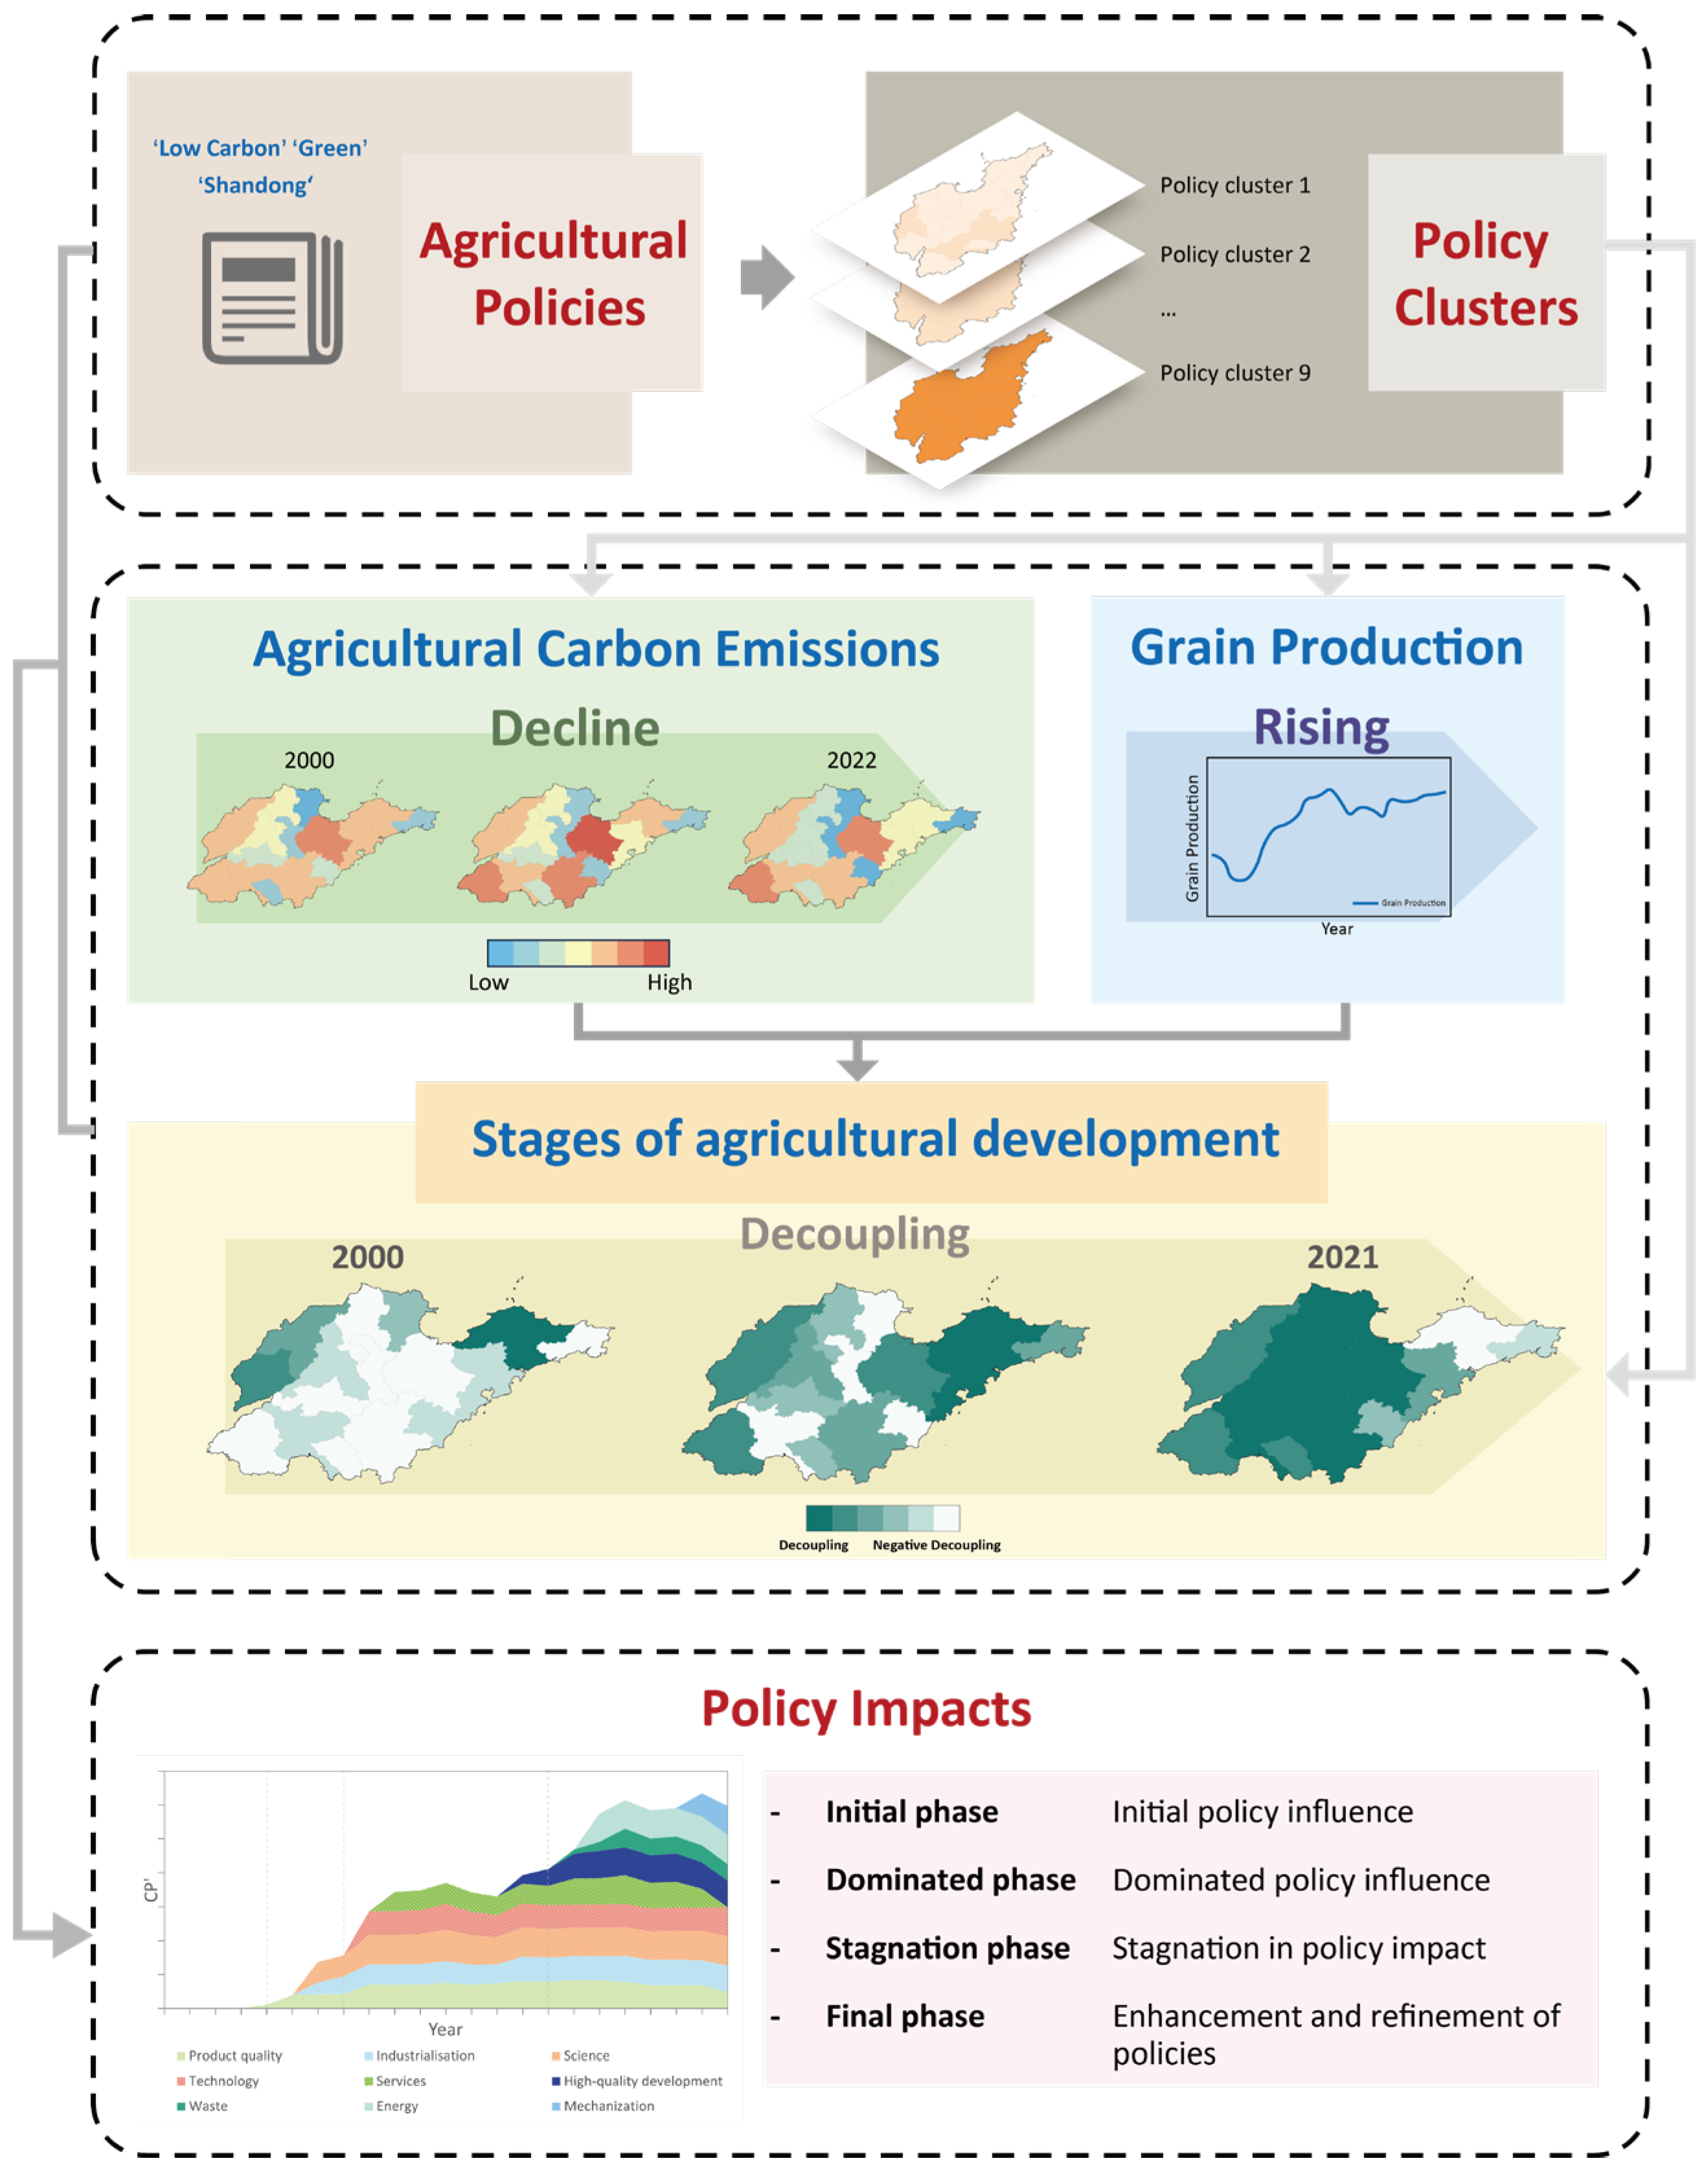
2.2. Research Framework

As China progresses toward its carbon peak and carbon neutrality goals, addressing agricultural carbon emissions has become increasingly critical. Agricultural carbon emissions and grain yield are central to agricultural production. To reduce carbon emissions while maintaining or enhancing crop yields, the Chinese government has implemented a variety of agricultural policies. Given the diverse focuses of these policies, it is essential to evaluate their effectiveness in reducing agricultural carbon emissions and supporting sustained agricultural production. This study assessed the impact of these policies by first identifying nine policy clusters on the basis of their modes of action and objectives, assigning scores according to their implementation frequency. The impact of these nine policy clusters on different stages of agricultural development, characterized by agricultural carbon emissions and grain yield, was analyzed, with their spatiotemporal characteristics summarized. Finally, the division of agricultural policy effects in Shandong informed specific policy recommendations. The findings aim to provide targeted policy recommendations for optimizing sustainable agricultural development in Shandong Province through effective policy implementation (Figure 2).

2.3. Data Sources

The data used to calculate agricultural carbon emissions from 2000 to 2022 were sourced from Shandong Statistical Yearbook (2001–2023) [49], encompassing information on the total sown area, effective irrigation area, total power of agricultural machinery, and other relevant metrics. Notably, due to the administrative merger of Laiwu into Jinan in 2019, the data from Laiwu for the years 2000 to 2018 have been consolidated with those of Jinan. Policy data in this study were obtained from the official website of the Shandong Provincial Department of Agriculture and Rural Affairs, http://nync.shandong.gov.cn (accessed on 12 July 2024).

2.4. Types and Clusters of Policies

Policies were identified using the keywords “carbon” and “green”, with irrelevant policies manually excluded. According to the purpose of the policy, policies were categorized into nine clusters: industrialization, waste, services, high-quality development, mechanization, technology, science, energy, and product quality (Table 1). Industrialization policies promote agricultural industrialization; waste policies regulate agricultural waste management; services policies provide policy and financial support for agricultural development, improving production conditions and service environments; high-quality development policies focus on sustainable and ecological development; mechanization policies promote the use of agricultural machinery; technology policies optimize farming methods and provide technical advice; science policies are oriented toward the development of agricultural science and technology and the promotion of scientific innovation in agriculture; energy policies promote the development of green and clean energy for agricultural production; and product quality policies promote the improvement of the quality of agricultural products. The policy scoring methodology is as follows (1)–(3):
N p , t , C = N u m b e r   o f   t h e   t i m e s   p   i m p l e m e n t i n g   i n   C   i n   t , if   p   has   specified   implementation   areas , 1 , if   p   is   implemented   in   all   cities   in the   implementation   year , 0 , if   p   is   implemented   in   all   cities   in the   unimplementation   year .
P S p , t , C = N p , t , C m a x N p
C P S c , t , C = p c P S p , c , t
where Np,t,C is the number of times policy p is implemented in city C in year t. It counts how many counties in city C have implemented policy p. If all counties in city C have implemented policy p, it then counts the number of businesses, cooperatives, and other institutions included in the pilot list for policy p in city C. PSp,t,C is the score of agricultural policy p in city C in year t. CPSc,t,C is the score of cluster c in city C in year t. Figure 3 shows the percentage of nine policy cluster scores in all policy scores from 2000 to 2022.

2.5. Carbon Emission Calculation

This study focused solely on narrow-sense agriculture, specifically carbon emissions from the grain production sector. These emissions are categorized into five sources: carbon emissions from agricultural machinery use, agricultural plastic film production and use, pesticide production and use, irrigation, and fertilizer production and use [49]. Agricultural carbon emissions are the sum of these five sources, calculated as follows (4):
E = T i δ i
where E represents agricultural carbon emissions; i represents the source of agricultural carbon emissions; T represents the representative data of the source of agricultural carbon emissions; and δ represents the carbon emission coefficient of the source. The relevant carbon emission coefficients are shown in Table 2.

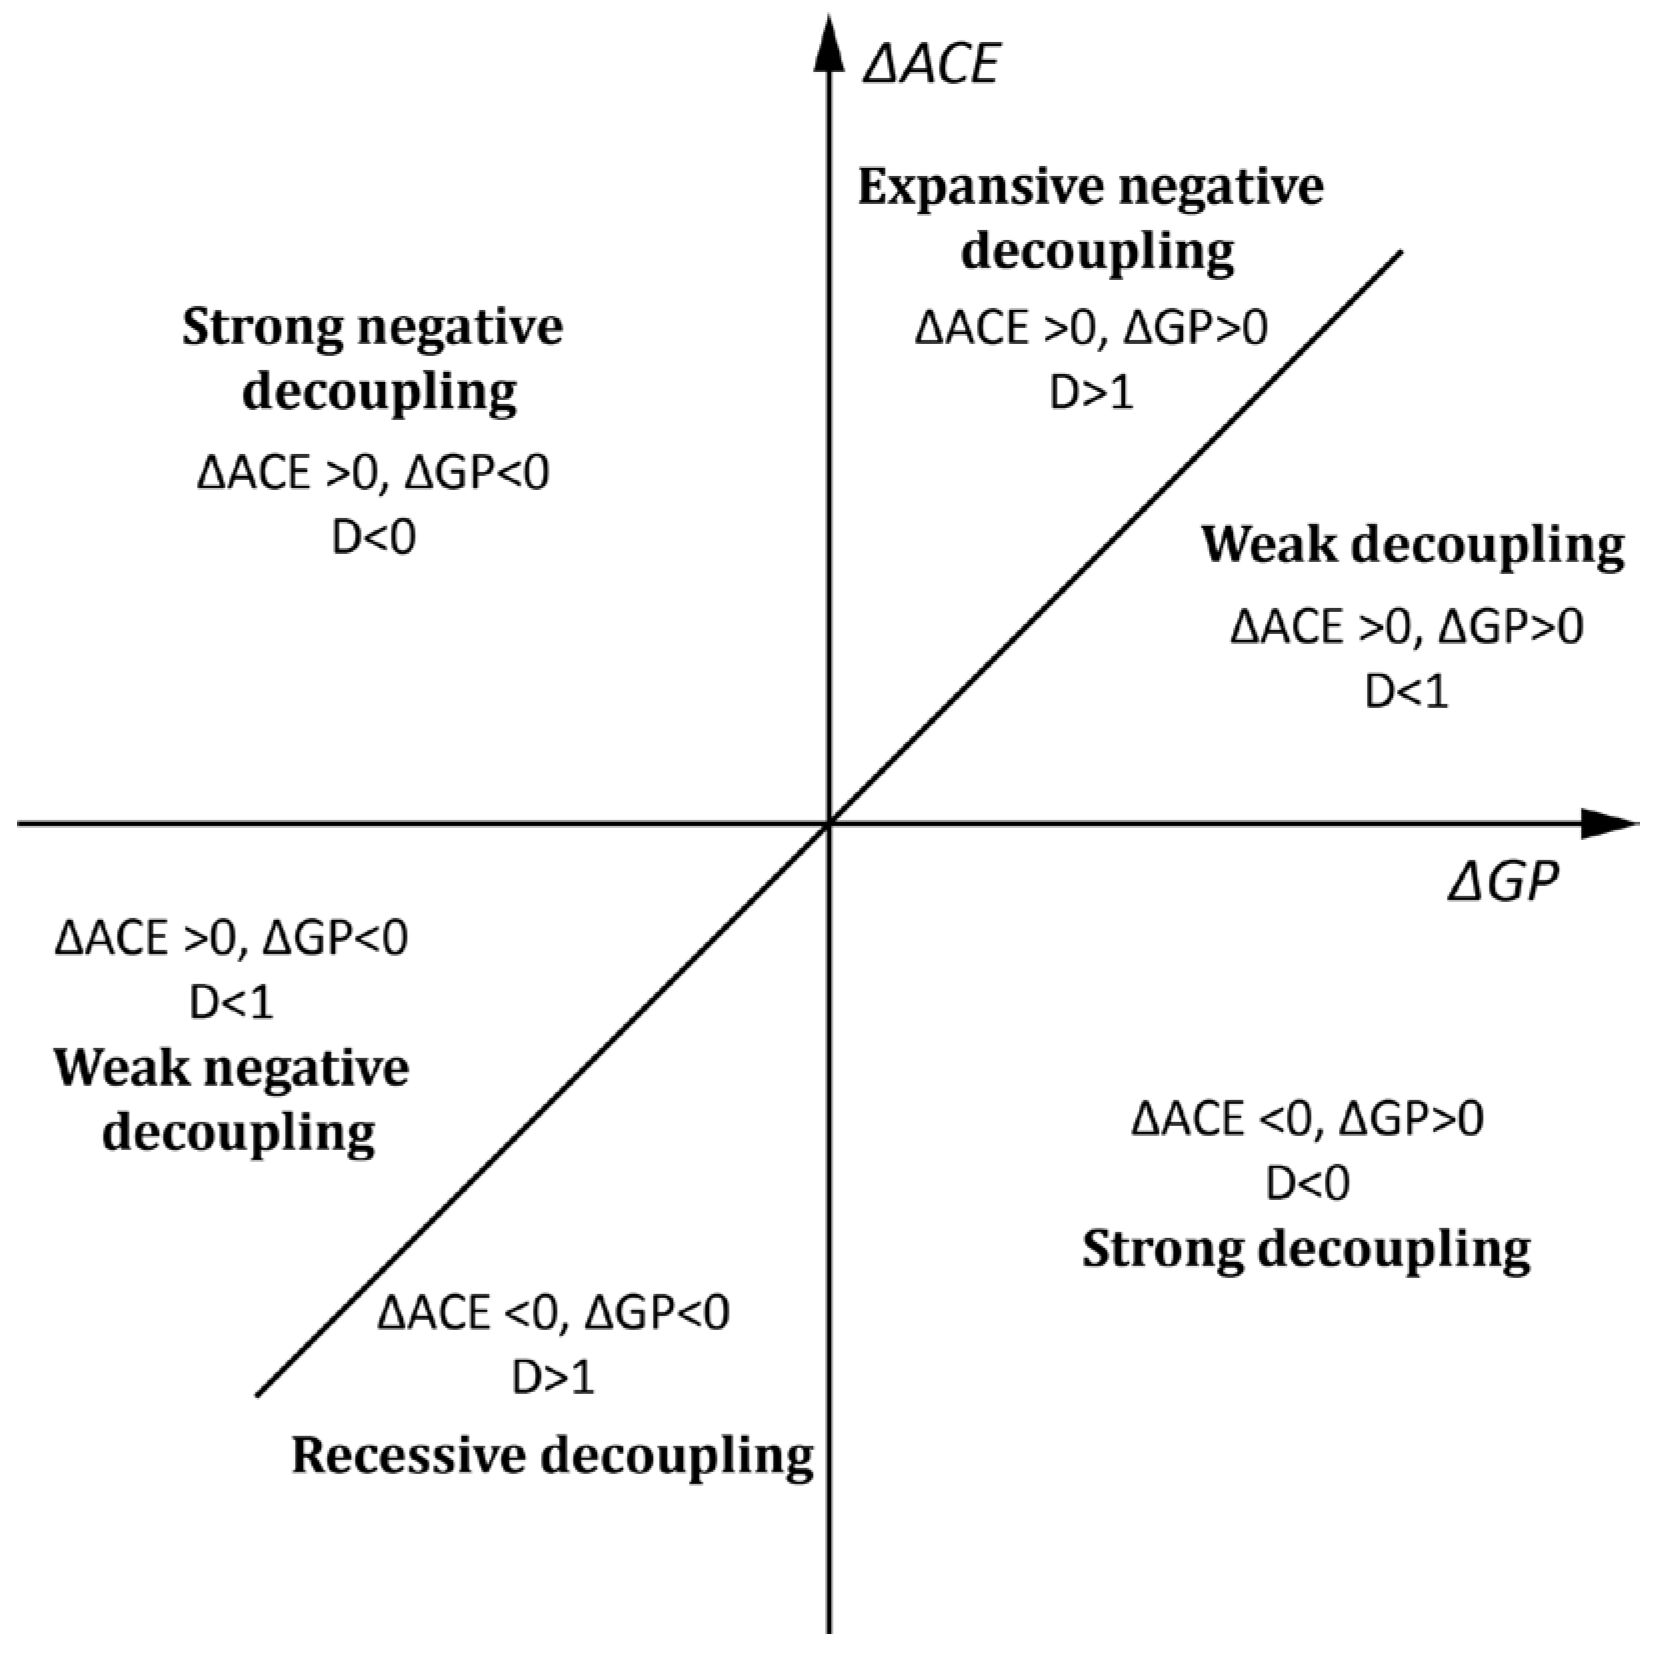
2.6. Stages of Agricultural Development on Carbon Emissions

Although carbon emissions are inherent in agricultural production, there are strategies to mitigate them as agriculture develops. These include the controlled application of chemical fertilizers and pesticides, the enhancement of agricultural waste recycling, and the promotion of mechanization and the scaling of agricultural operations, all of which can significantly reduce the carbon footprint associated with farming. In this study, the Tapio Decoupling Model was utilized to quantify the decoupling status between agricultural carbon emissions and grain production, providing insights into the current state of agricultural development. The model’s formula is as follows:
D = A C E t A C E 0 / A C E 0 G P t G P 0 / G P 0 = Δ A C E / A C E 0 Δ G P / G P 0
where D represents the decoupling coefficient between agricultural carbon emissions and grain production and ACE and GP denote agricultural carbon emissions and grain production, respectively. The variables t and 0 represent the target and base years, respectively, while ΔACE and ΔGP represent changes in agricultural carbon emissions and grain production over the specified period. When ΔGP is equal to zero, a very small 0.001 is used instead of 0 to ensure that the formula calculates correctly. The decoupling state is illustrated in Figure 4, where a smaller D indicates a stronger decoupling state when GP is greater than 0.

2.7. Policy Influences

There is a complex interaction between agricultural development and policy. Policies, through incentives or penalties, can promote agricultural progress aligned with its current stage of development, but they may hinder it if the policy design is disconnected from the goals or actual conditions. Furthermore, the responsiveness of agricultural development to policy and regional differences in agricultural modernization can impact the effectiveness of policy implementation. Therefore, agricultural development and policy form a coupled system, and aligning these two elements is essential for achieving sustainable agricultural development. To investigate the impact of agricultural policies on the development trajectory that balances carbon emission reduction with increased agricultural productivity, this study constructed a coupled coordination model [53,54]. The specific formula is as follows:
C P = D S × P S D S + P S 2 2 k
T = α D S + β P S C P = T × C P
where CP represents the degree of coupling, describing and measuring the relationship between the decoupling state of grain production and agricultural carbon emissions and agricultural policies. DS’ denotes the standardized decoupling state of grain production and agricultural carbon emissions, with strong negative decoupling assigned a value of −3, weak negative decoupling −2, expansive negative decoupling −1, recessive decoupling 1, weak decoupling 2, and strong decoupling 3. PS’ represents the standardized scores of agricultural policies for each city. The parameter k is an adjustment factor used to enhance the discriminative power of the results, set to 2 in this study [55,56,57]. T represents the growth index of the decoupling state and agricultural policies, reflecting the overall level of the decoupling state of grain production and agricultural carbon emissions and the issuance of agricultural policies. The parameters α and β, reflecting the relative importance of the decoupling state and agricultural policy scores, were both set to 0.5 in this study. Furthermore, this study employed Pearson’s correlation coefficient to verify the correlation between policy scores and the state of decoupling. CP’ indicates the degree of development coupling, comprehensively reflecting the interactive degree and overall development level between the decoupling state of grain production and agricultural carbon emissions and agricultural policies. The degree of development coupling, CP’, ranges from 0 to 1, with higher values indicating a higher degree of coupling between the decoupling state and agricultural policies and lower values indicating a lower degree of coupling. This study used 0.3, 0.5, and 0.8 as classification thresholds. The degrees of coupled coordination are classified into four levels: low (0 ≤ CP’ < 0.3), lower (0.3 ≤ CP’ < 0.5), moderate (0.5 ≤ CP’ < 0.8), and high (0.8 ≤ CP’ ≤ 1) [58,59].

3. Results

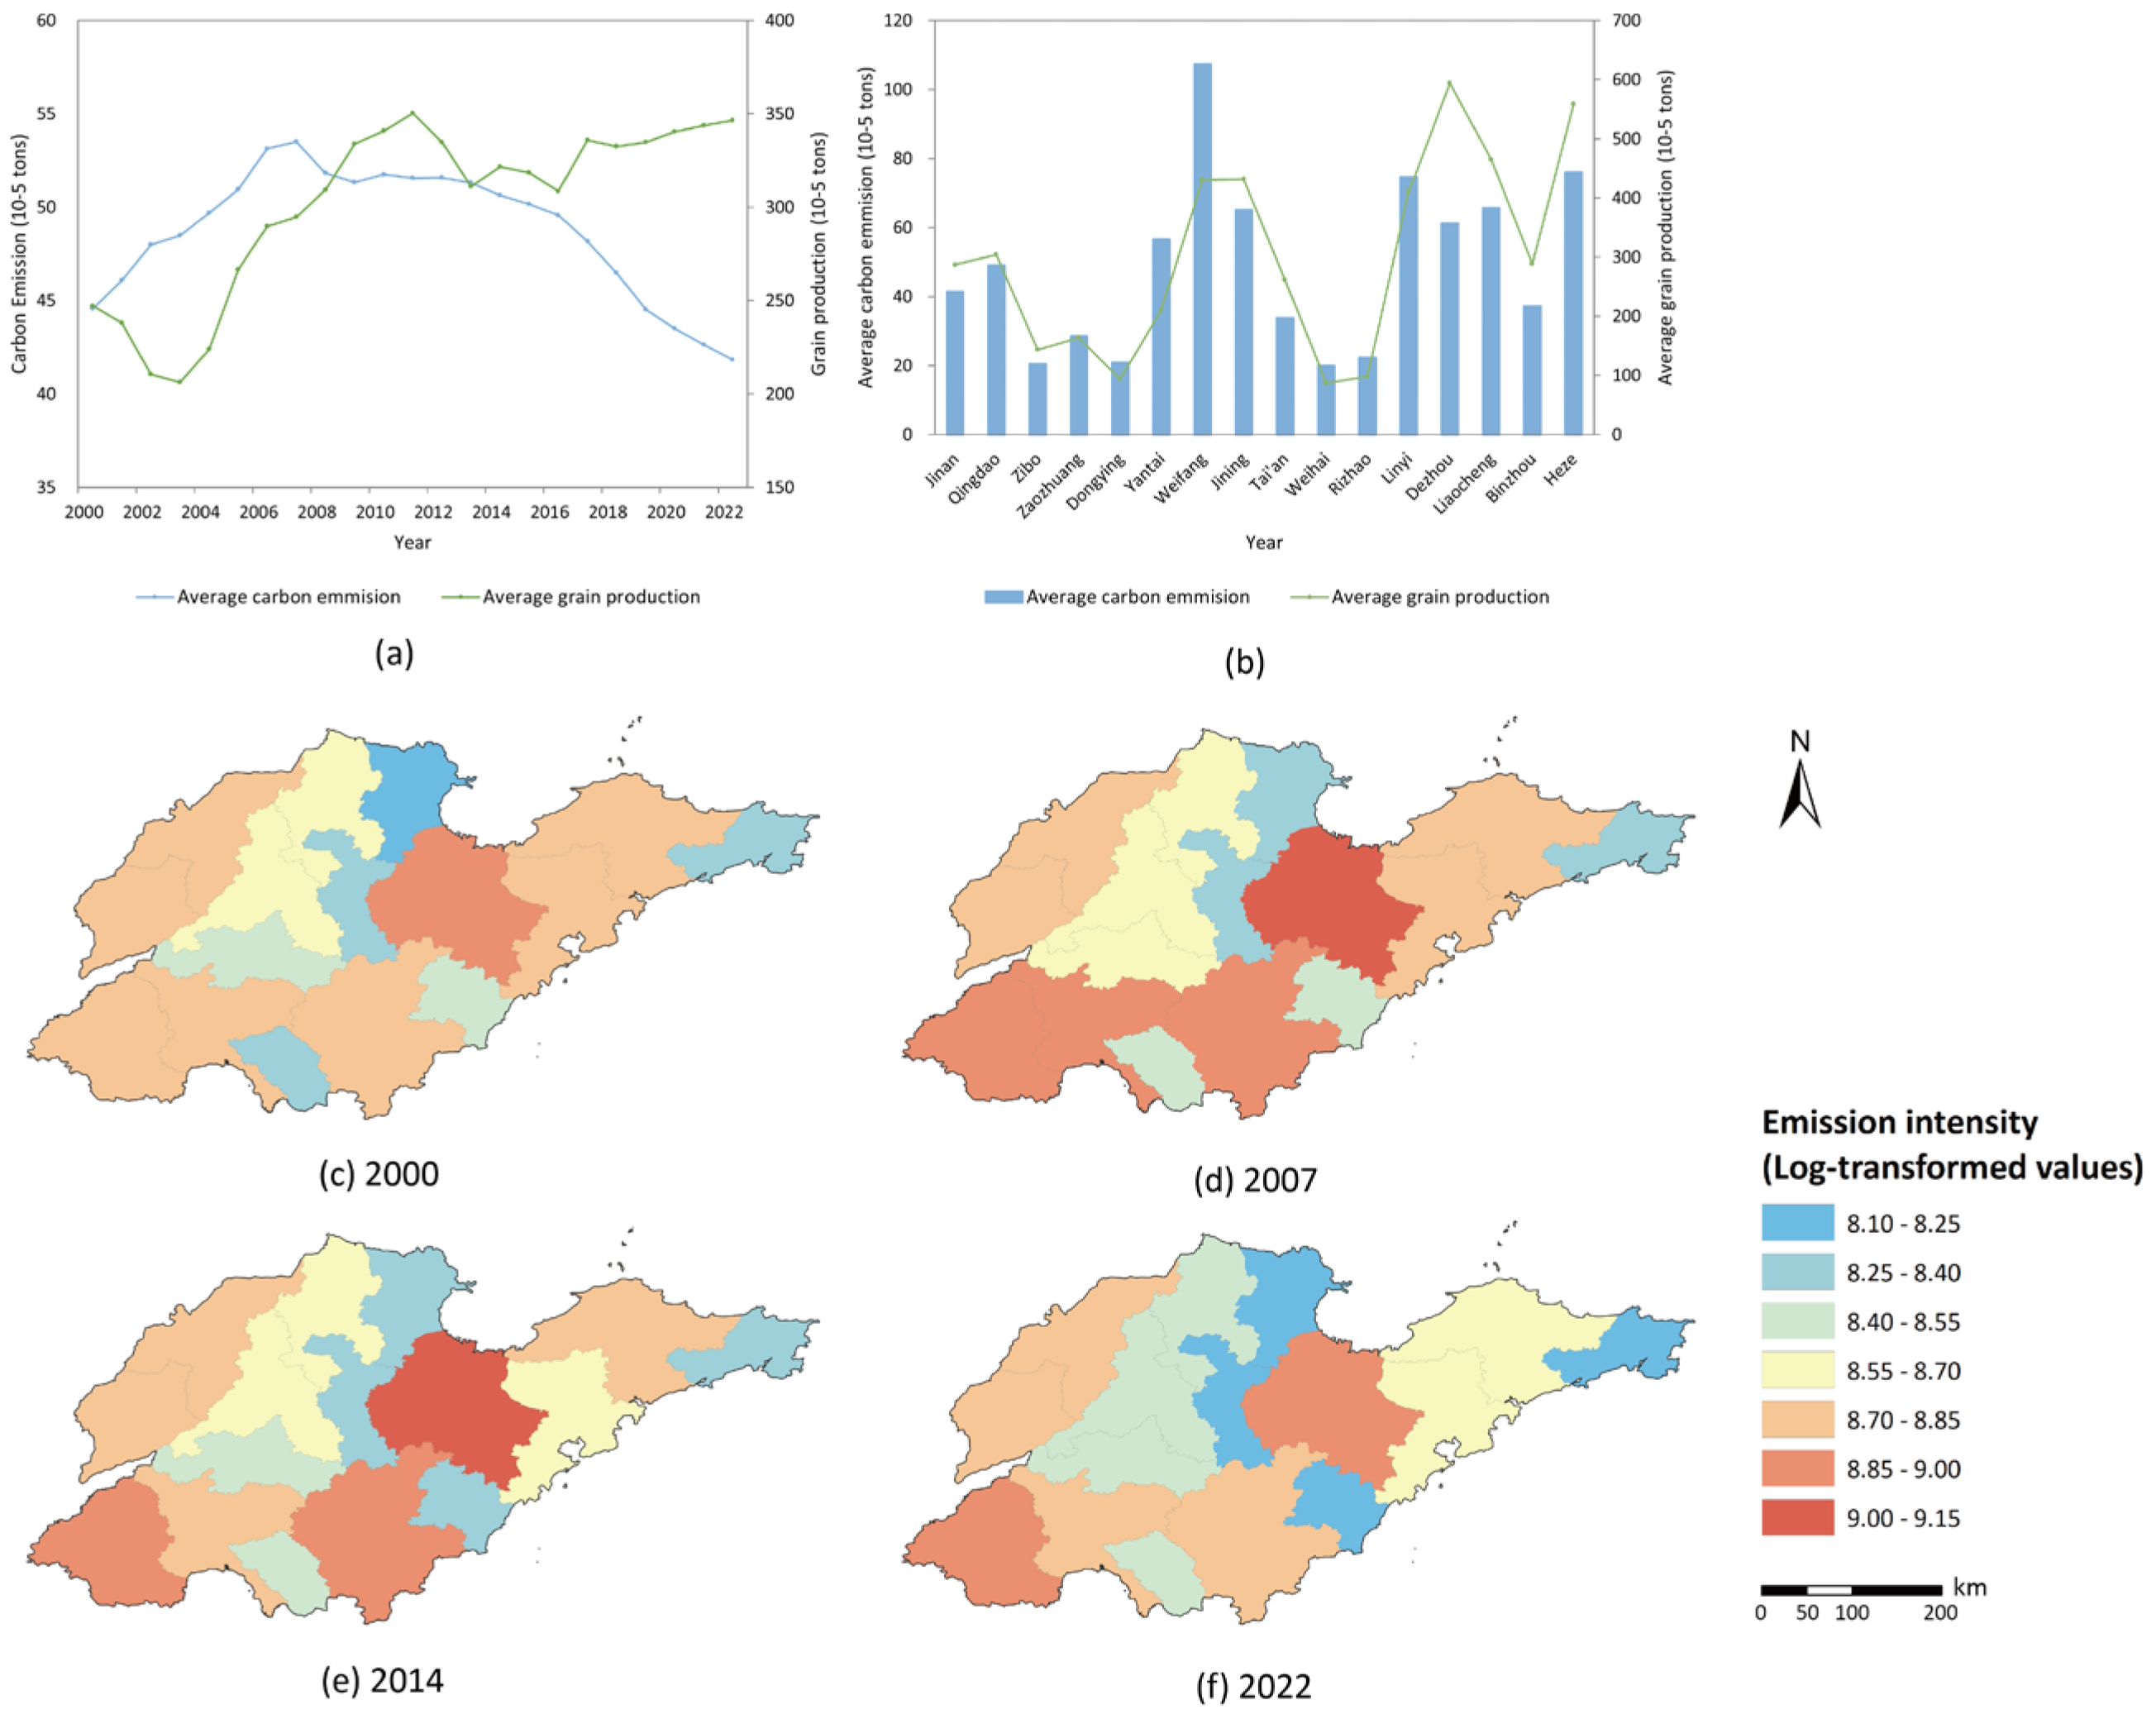
3.1. Agricultural Carbon Emissions

Figure 5 shows the trends in agricultural carbon emissions across Shandong Province from 2000 to 2022. Most regions initially experienced an increase in emissions, followed by a decline (Figure 5a). Zibo, Weihai, and Rizhao recorded relatively low agricultural carbon emissions, while Weifang, Heze, and Linyi exhibited higher emissions (Figure 5b). On average, agricultural carbon emissions in the province decreased by 27,300 tons, or 6.12%, from 2000 to 2022. In 2000, Weifang had the highest agricultural carbon emissions, while Weihai had the lowest (Figure 5c). By 2022, Rizhao recorded the lowest emissions, while Weifang remained at the highest level. Rizhao experienced the most significant reduction, with a decrease of 41.79% (Figure 5f), while Zaozhuang saw the largest increase, with a rise of 14.45%. From 2000 to 2007, emission growth was primarily concentrated in southern cities (Figure 5d). However, from 2007 to 2022, significant reductions were observed in the eastern and southern cities, while emissions in the western cities remained relatively stable (Figure 5e).

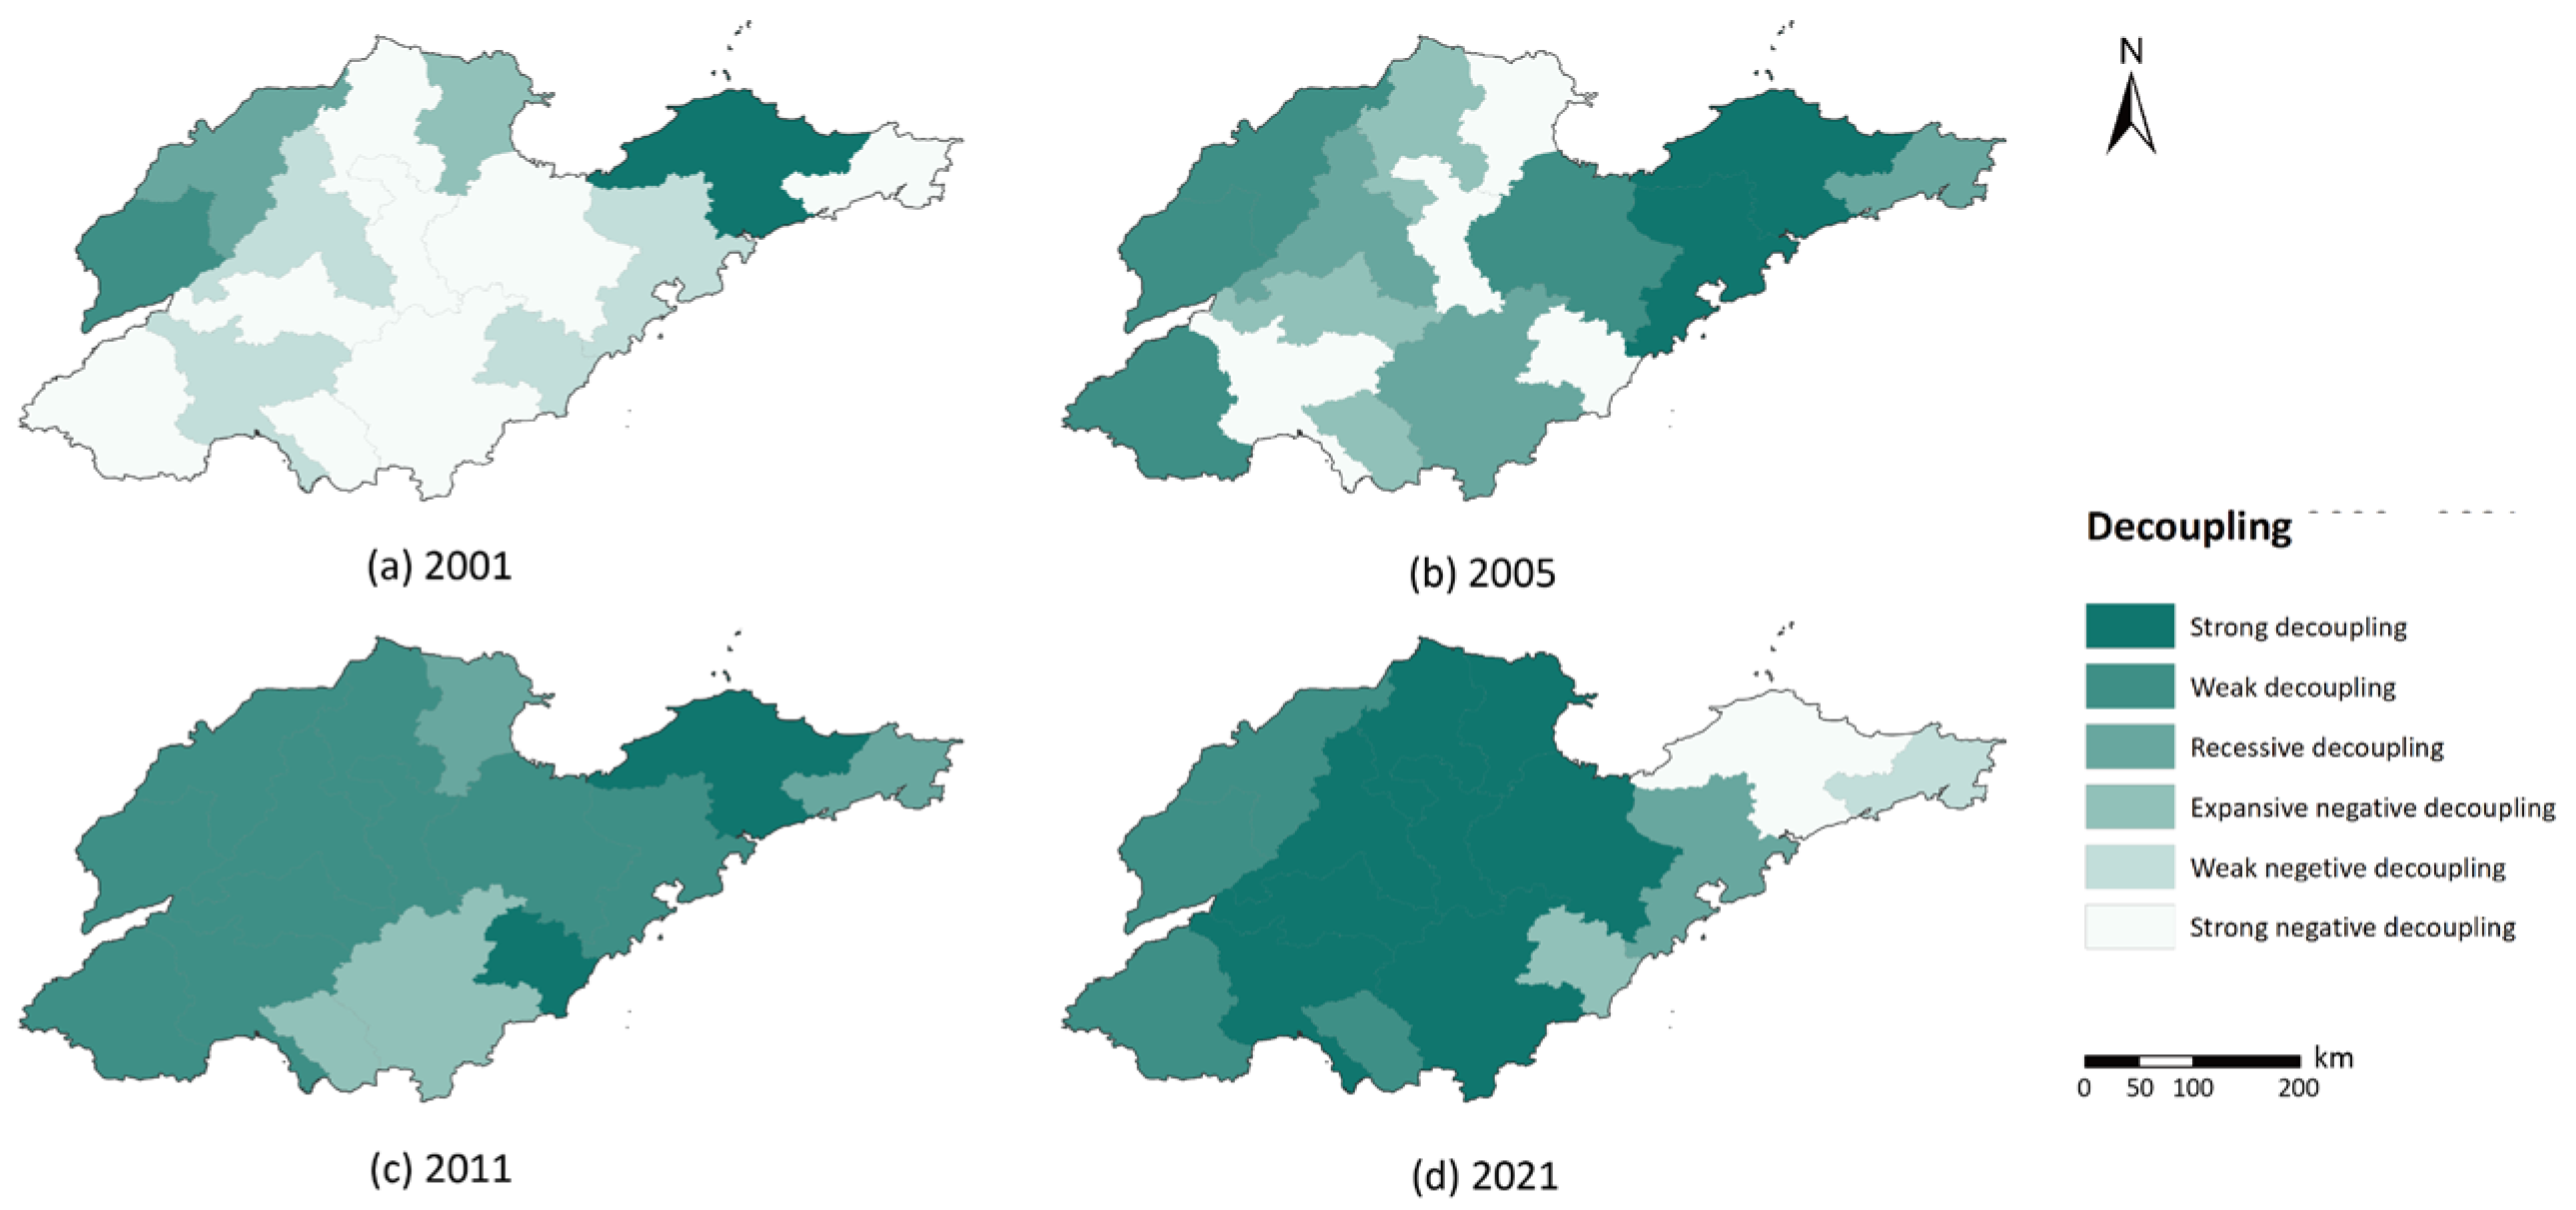
3.2. Stages of Agricultural Development on Carbon Emissions

The decoupling analysis reveals four distinct stages in the relationship between agricultural carbon emissions and food production in Shandong Province (Figure 6). Despite the goal of agricultural modernization, traditional extensive farming practices persist in certain areas, with agricultural output often increasing at the cost of higher carbon emissions, particularly in the early stages of development. Stage 1, from 2000 to 2003, is characterized by a strong negative decoupling across most cities, where high carbon emissions were essential to sustain food production (Figure 6a). This stage marks the early phase of agricultural development, featuring low crop yields and high emissions, reflecting an inefficient, extensive farming model. In Stage 2, from 2004 to 2009, a transition toward recessive decoupling and expansive negative decoupling occurred, with some cities even beginning to exhibit strong decoupling (Figure 6b). This trend indicated that although many areas were still in the early stages of modernization, there was a shift from extensive farming toward low-carbon and high-yield practices. Stage 3, from 2010 to 2019, saw a shift for most cities toward weak decoupling, reflecting a reduction in the reliance on carbon emissions for food production growth. This reflected a positive trend overall (Figure 6c). Stage 4, from 2020 to the present, is defined by strong decoupling becoming the dominant pattern, signifying substantial progress in reducing carbon emissions while increasing food production. However, some cities regressed from strong decoupling to strong negative decoupling, suggesting that these areas have diverging agricultural practices (Figure 6d).
According to the progress of decoupling, the cities in Shandong Province can be classified into three clusters. The first category consists of cities that achieved strong decoupling around 2019, characterized by early and rapid agricultural modernization. This group includes Jinan, Zibo, Dongying, Weifang, Jining, Tai’an, Linyi, and Binzhou, which are primarily located in the central region of the province. The second category includes cities that are currently at a weak decoupling stage but have not yet achieved strong decoupling. These cities have high agricultural output with relatively low input, yet there remains room for further improvement. This group includes Qingdao, Zaozhuang, Liaocheng, Heze, and Dezhou, located in the eastern, western, and southern peripheries of the province. The third category comprises cities with fluctuating and unstable decoupling progress, including Yantai, Weihai, and Rizhao, located in the northeast and southeast regions.

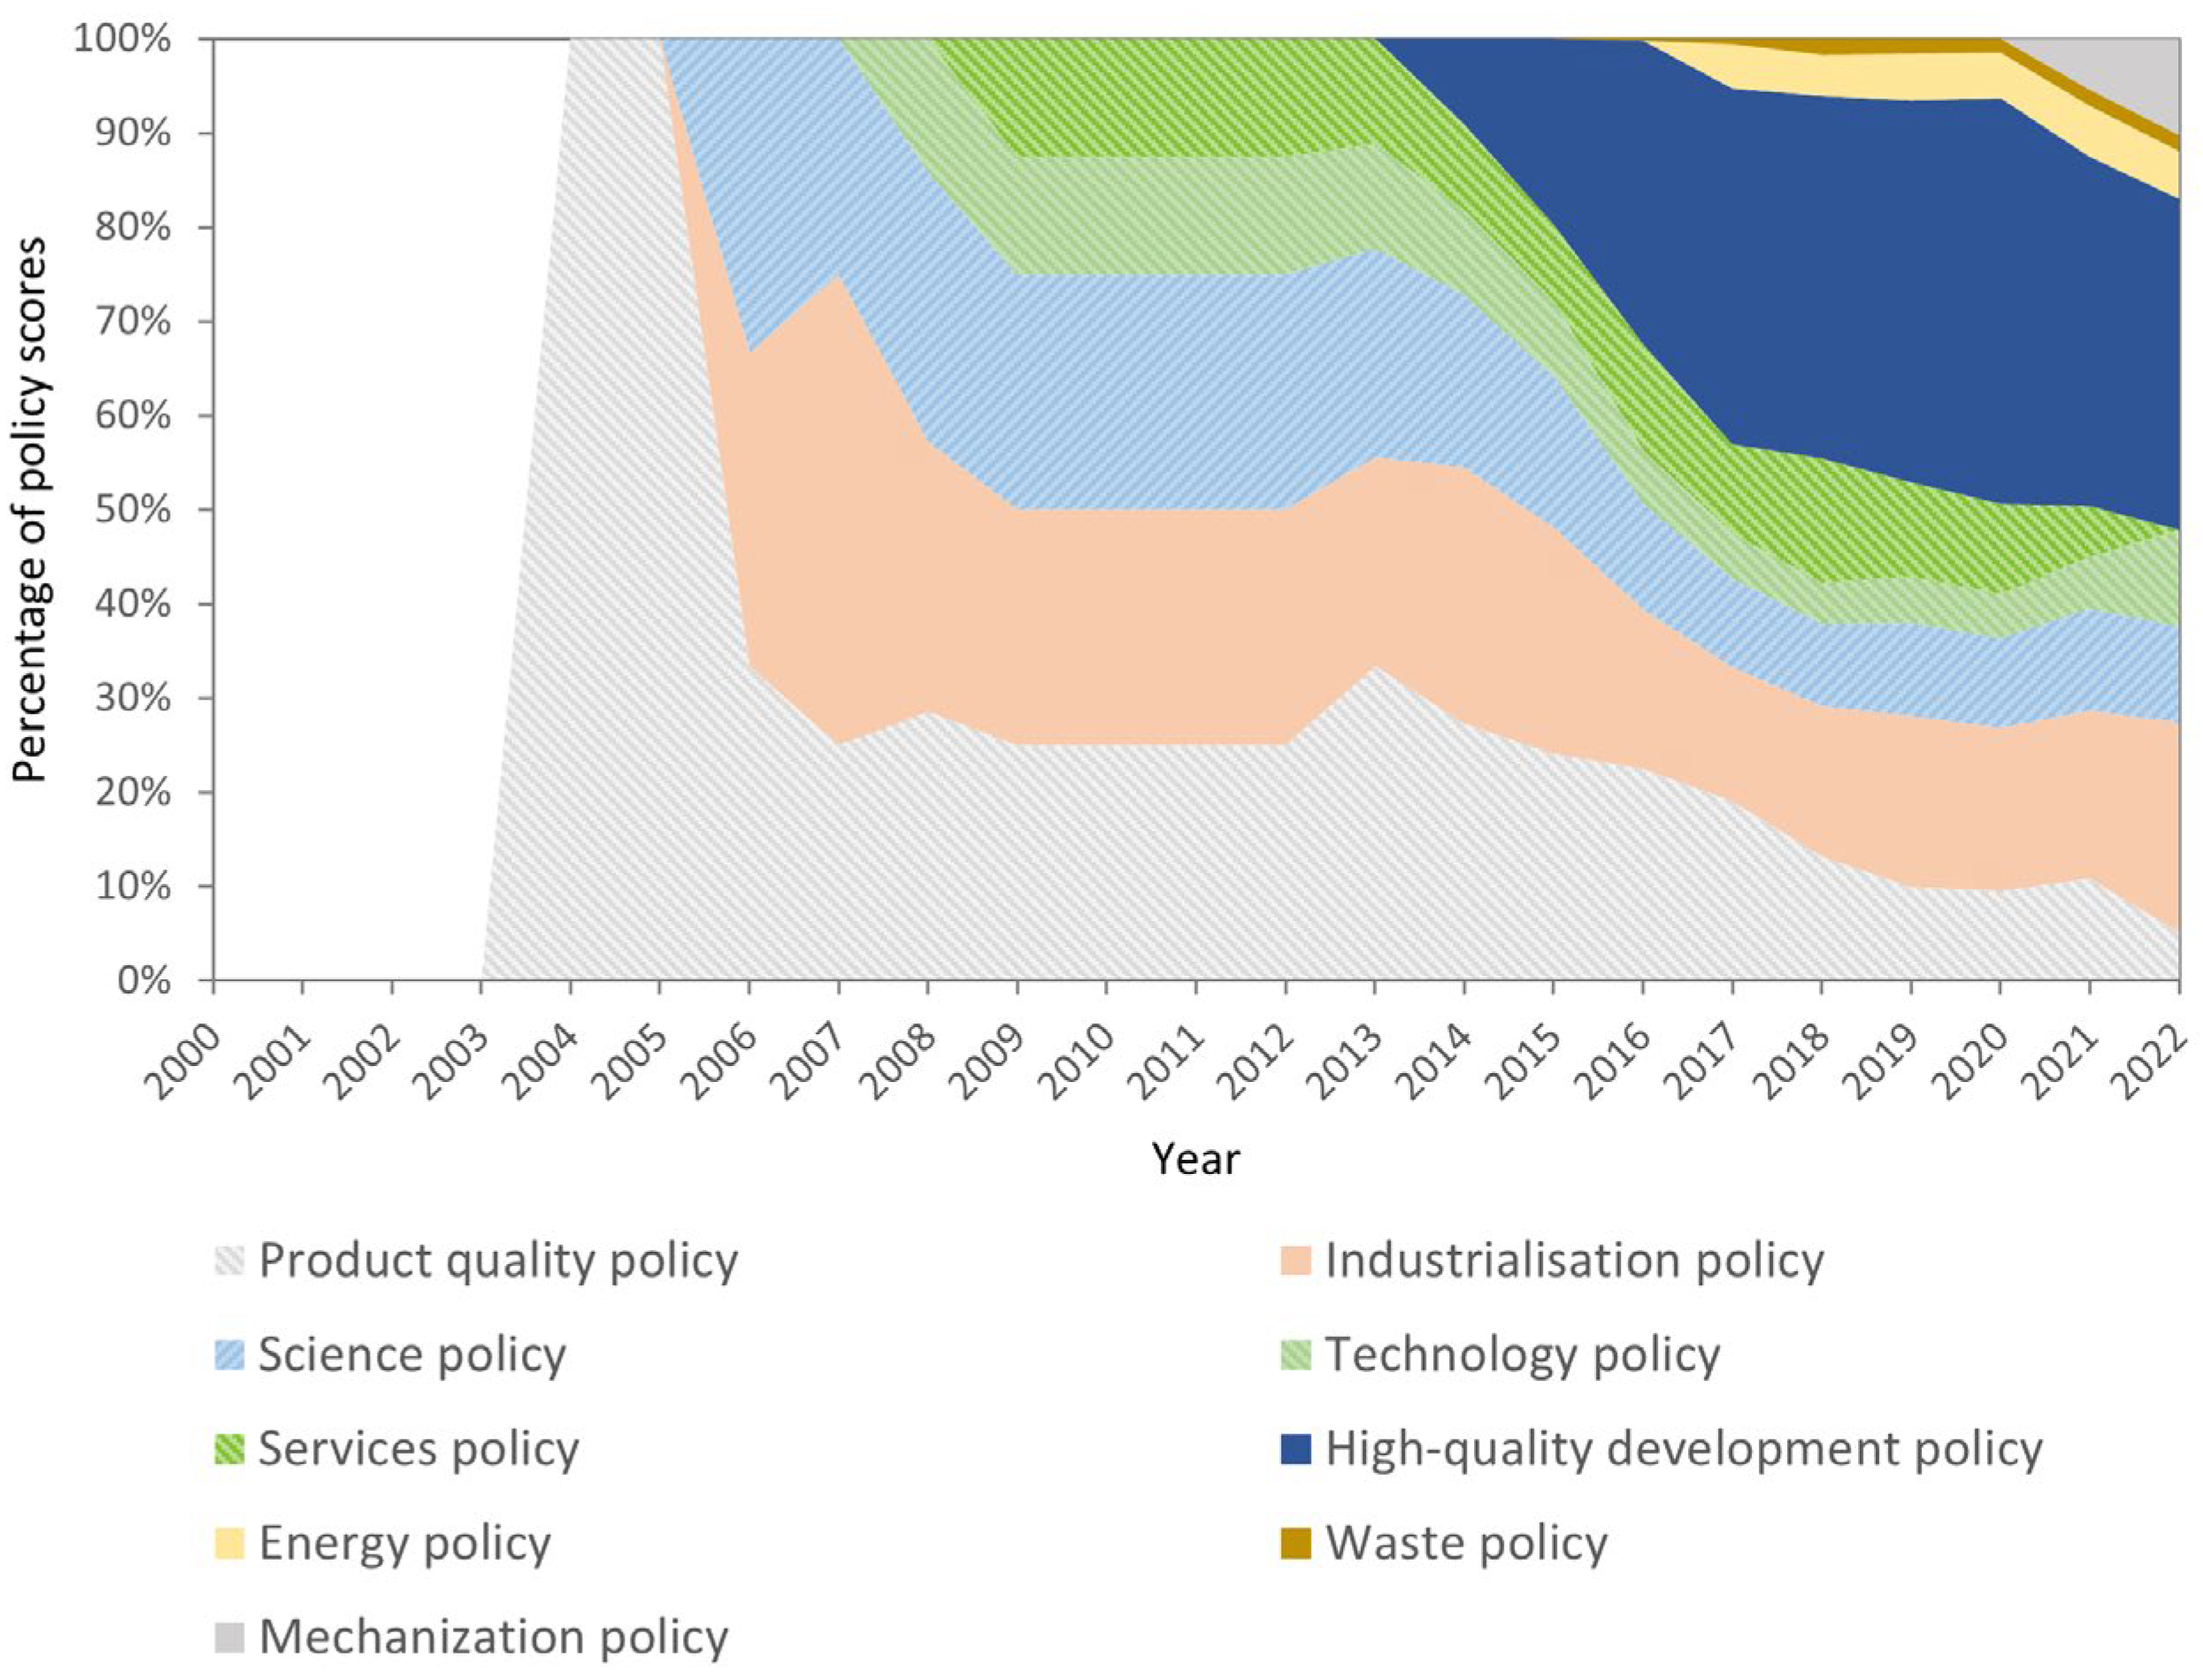
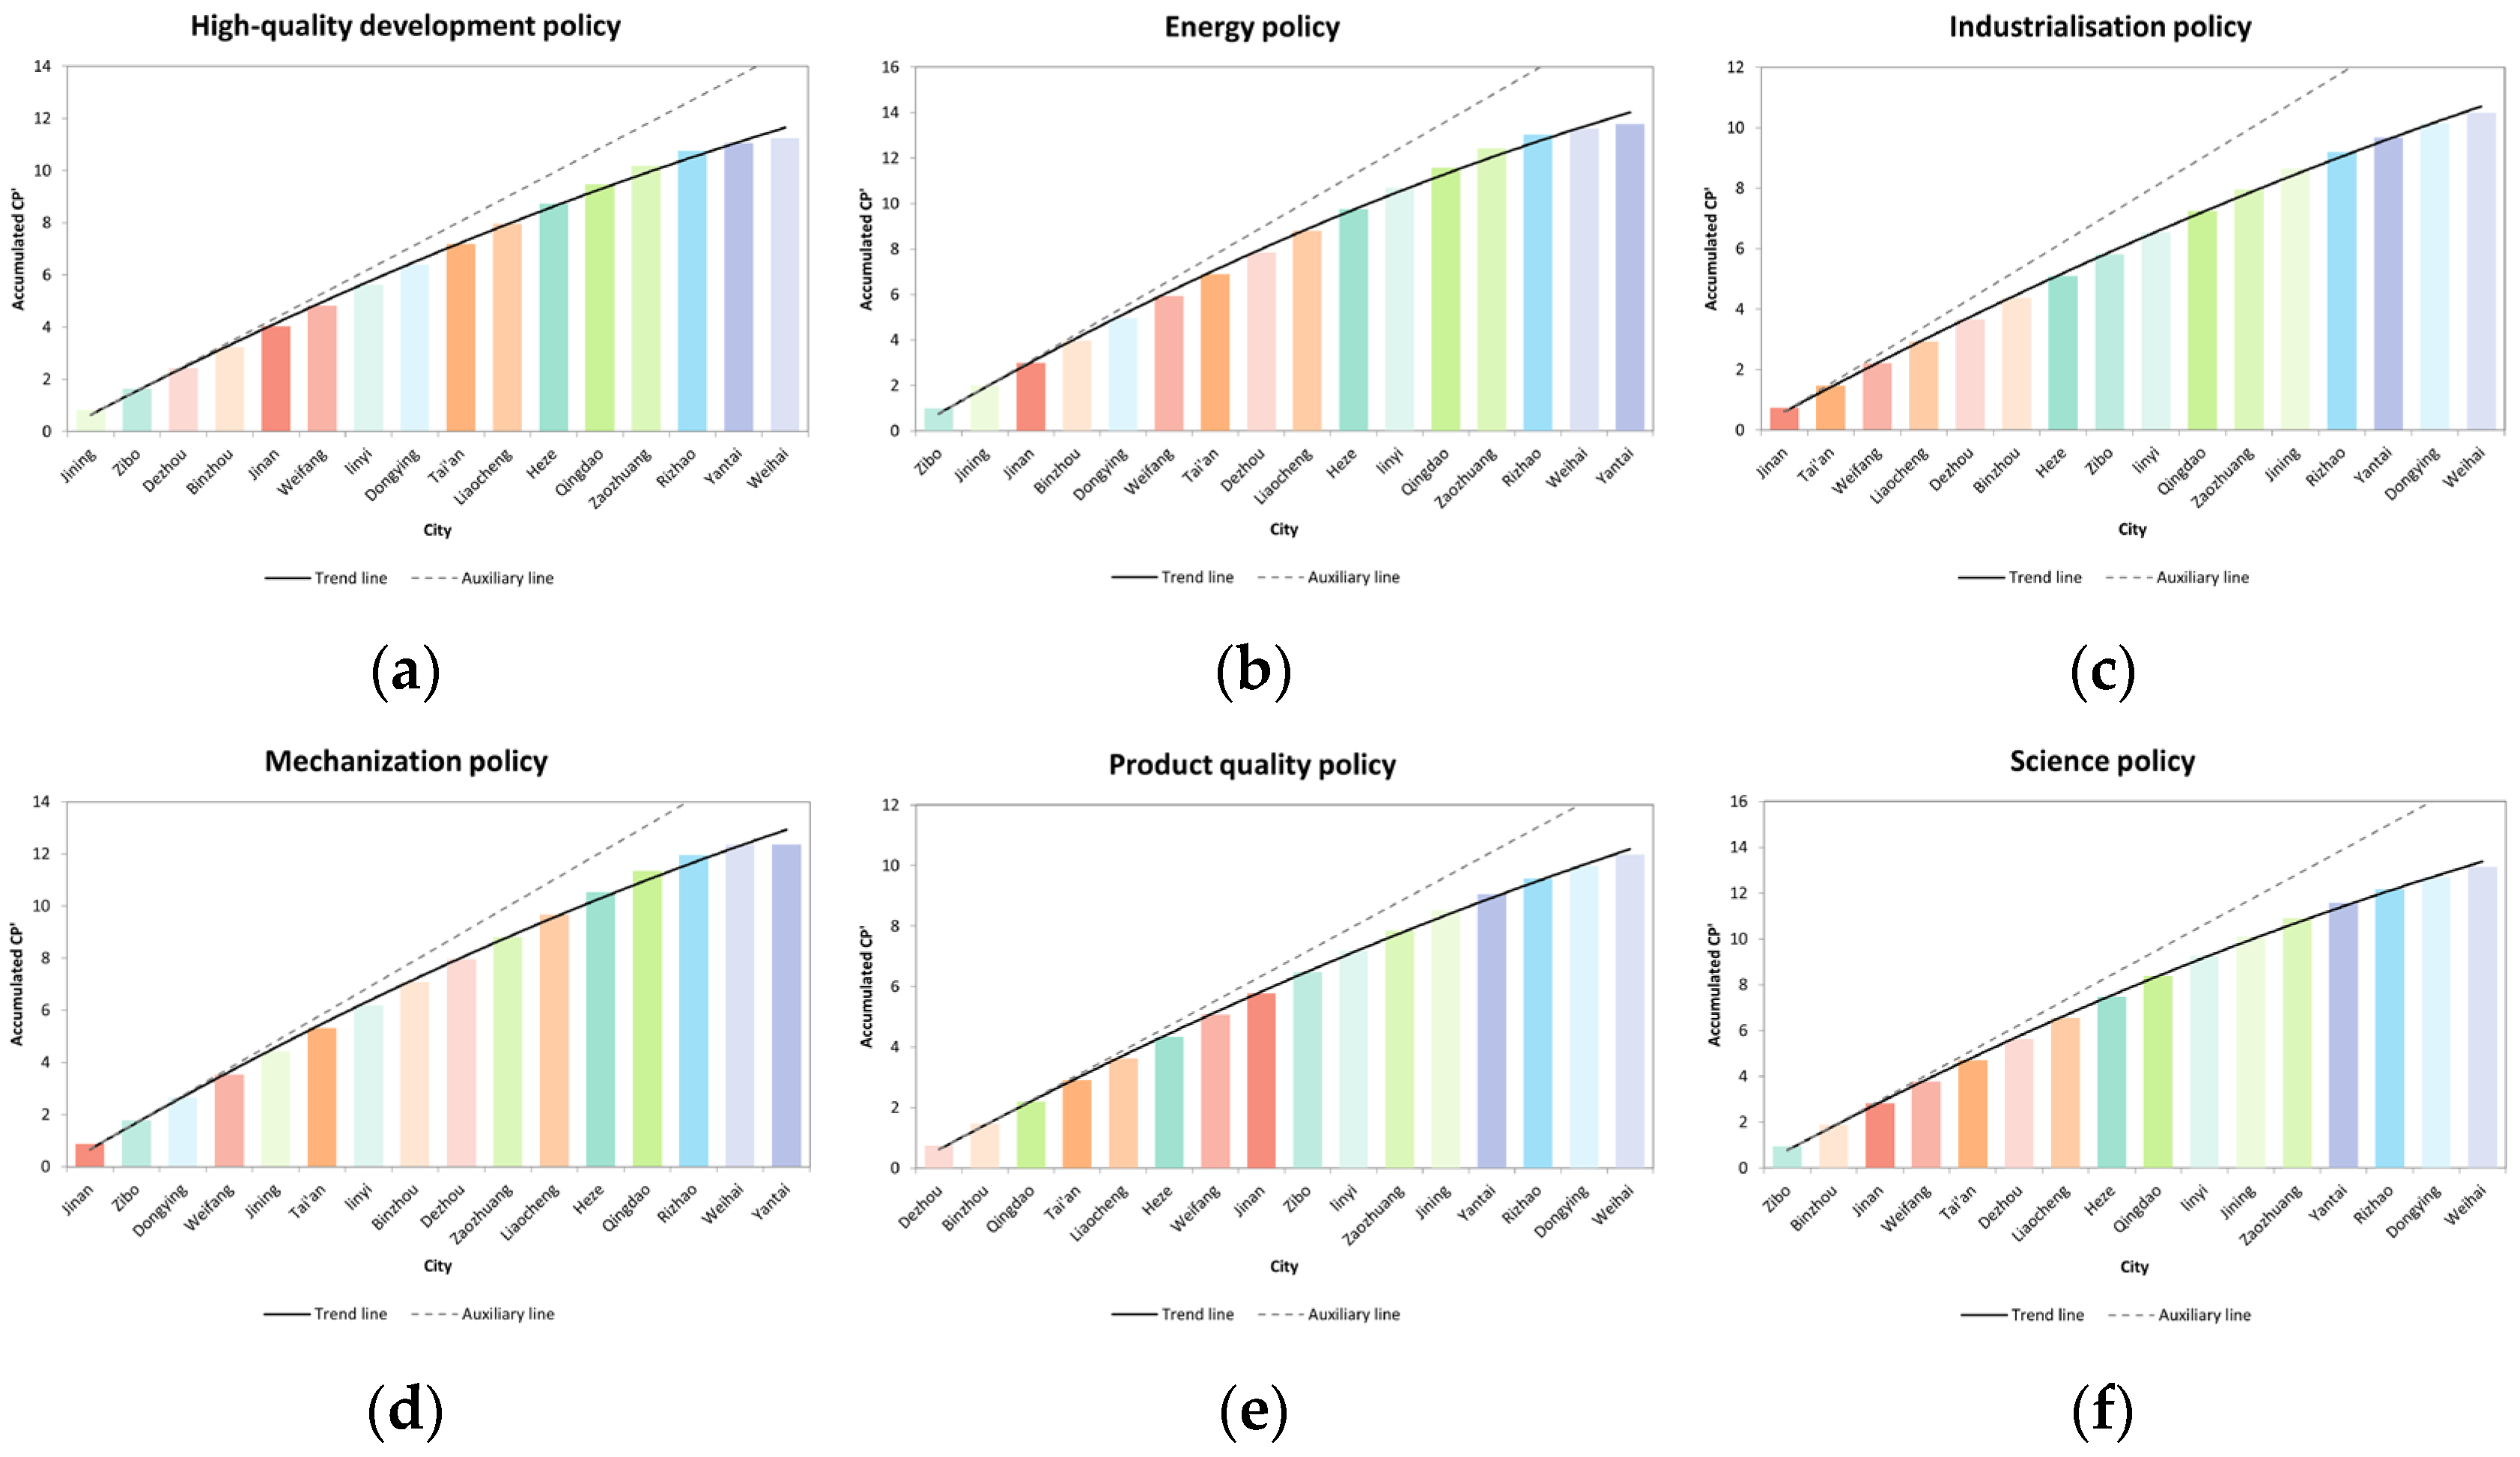
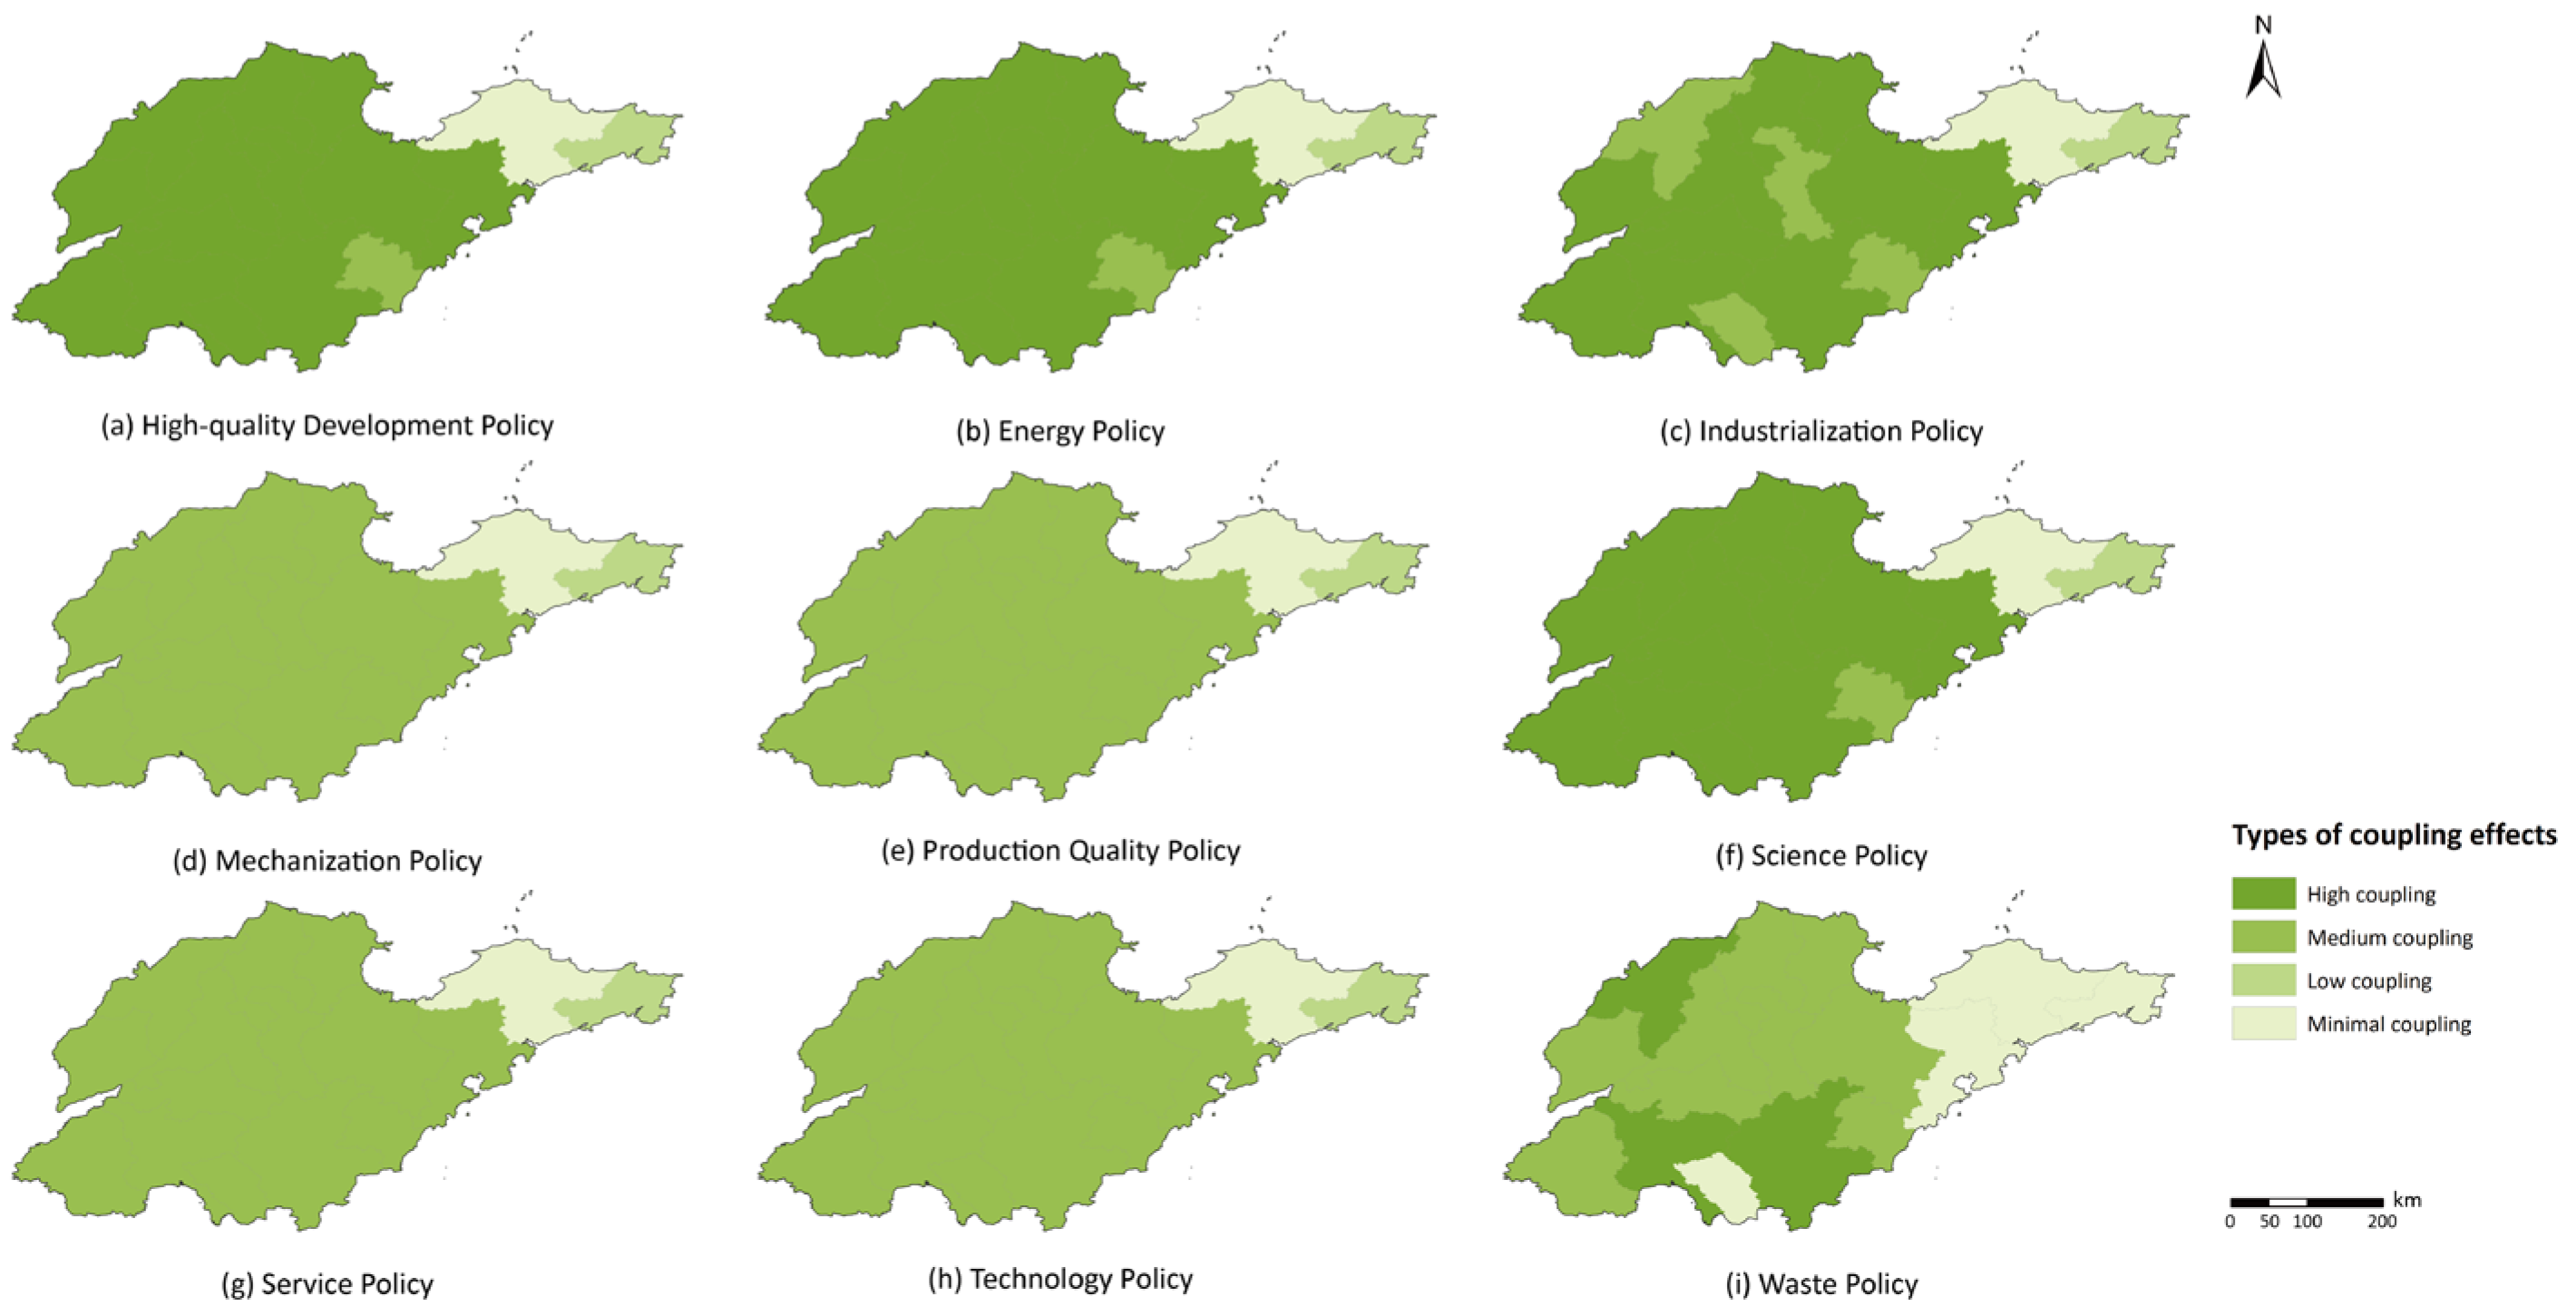
3.3. Policy Influences

The impact of agricultural policies in Shandong Province was evaluated by examining the relationship between agricultural carbon emissions, grain production, and policies from 2000 to 2022. The study found a significant correlation between changes in agricultural carbon emissions and agricultural policy scores, indicating that carbon emissions were regulated by policy interventions. Further analysis divided the study period into two phases according to a binary classification of policy scores. The Mann–Kendall test was employed to assess the time trends and their significance in each phase. The results showed that from 2000 to 2008, only a limited number of policies related to “low-carbon” and “green” development were implemented, with a correlation coefficient of 0.667, indicating a significant upward trend in agricultural carbon emissions. By contrast, during the period of 2009 to 2022, as agriculture rapidly developed, the correlation coefficient was −0.89, reflecting a significant decrease in carbon emissions. These findings suggest that during phases of limited policy implementation, carbon emissions increased, whereas they decreased as policy implementation intensified.
Over time, the relationship between agricultural policies and agricultural development in Shandong Province has strengthened. The average coupling degree of all cities exhibited relatively stable growth before 2007, followed by stagnation between 2007 and 2014 and renewed growth after 2014 (Figure 7d). This trend reflected a significant correlation between agricultural policy scores and development stages. In 2000, cities displayed minimal coupling (Figure 7a), indicating that limited policies influence carbon emissions. By 2006, some cities transitioned to a low coupling degree (Figure 7b), indicating that policies were beginning to impact the decoupling process. After 2006, the coupling degree remained stable, reflecting minimal changes in policies on carbon emissions and agricultural production. In 2014, the introduction of new agricultural policies enhanced the decoupling state. In 2016, most cities achieved a high level of coupling between agricultural carbon emissions, food production, and policy implementation (Figure 7c). However, cities like Yantai, Weihai, and Rizhao remained at minimal and medium levels of decoupling.
Figure 8 shows the average impacts of various policy clusters across agricultural development stages. Among the nine clusters, product quality policies were the first to show a stable coupling with the decoupling state, maintaining this stability since 2008. These policies consistently impacted agricultural development. Industrialization and scientific policies began to reduce carbon emissions and increase production around 2006, stabilizing after 2008. Technological and service policies began to influence green agricultural development between 2008 and 2009, although their impact has fluctuated. After a stabilization period, high-quality development policies began affecting agriculture around 2014. Waste policies and energy policies both appeared later, and mechanization policies, the most recent to be implemented, began showing a stable coupling effect in 2020. Early policies stabilized their impact on reducing carbon emissions and increasing grain output by 2014. Subsequent policy adjustments and new implementations led to a continued and increasing impact, reflected in a rise in coupling after 2014.
The effectiveness of agricultural policy clusters varies across cities (Figure 9). The cumulative average impact of the nine policy clusters shows that waste policies (Figure 9i) exhibit the greatest variability, while industrialization (Figure 9c) and technological policies (Figure 9h) show the least. This suggests that the implementation of industrialization and technology policies has been more consistent across cities, leading to uniform impact. By contrast, waste policies were primarily implemented through pilot programs, showing greater variability. Among cities, Zibo ranks highest in energy (Figure 9b), science (Figure 9f), and technology policies (Figure 9h), likely due to favorable agricultural conditions and investment in agricultural innovation. Jinan, the political and cultural center of Shandong, ranked first in industrialization and mechanization policies, benefiting from abundant resources and talent (Figure 9d). Jining leads in high-quality development (Figure 9a) and service policies (Figure 9g) due to local initiatives promoting green agriculture and product branding. Conversely, Yantai and Weihai consistently rank lower, reflecting limited policy impact on grain production.
By 2021, all policy clusters had reached a relatively stable coupling state, making this year a representative point for analyzing the degree of coupling between agricultural policies and the decoupling process (Figure 10). Policy clusters had a small influence in the northeastern peninsula cities, where high-quality development, energy, and science policies had a greater effect (Figure 10a,b,f). Mechanization, product quality, service, and technology policies also had consistent spatial distributions, with medium levels across central cities (Figure 10d,e,g,h). The spatial distribution of industrialization policies (Figure 10c) and waste policies (Figure 10i) was more complex, with low coupling in northeastern cities, higher coupling in most central cities, and medium levels in cities like Dezhou, Zibo, and Rizhao.

4. Discussion

4.1. Main Findings

To meet the growing demand for food, agricultural production has increasingly relied on higher inputs to boost crop yields. However, this has also led to a rise in agricultural carbon emissions. Understanding the relationship between food production and agricultural carbon emissions, as well as evaluating policy impacts, is essential for future policy formulation. Policy regulation has guided agricultural development toward greater uniformity across the province. Cities that initially lagged in agricultural practices have accelerated their development, while those with more advanced agricultural conditions have experienced slower modernization. This trend has optimized the allocation of policy resources, promoted balanced agricultural development across the province, and enhanced overall efficiency. Around 2010, Yantai, Weihai, Qingdao, and Rizhao shifted from primarily food production to cash crop agriculture. This change led to differences in their agricultural development stages and policy impacts compared with other cities in subsequent analyses.
The Impact of agricultural policies in Shandong Province can be divided into several distinct phases. The first phase (2000–2004) saw limited policy introduction, and agricultural progress was mainly driven by education and knowledge dissemination. The second phase (2005–2006) saw agricultural carbon emissions peak as new policies, such as production-quality policies, scientific policies, and industrialization policies, were introduced. These policies played a significant role in shaping Shandong’s agricultural framework. The third phase (2007–2014) was characterized by stabilized policy influence. During this phase, the expansion of the total sown area contributed to yield increases [60], and agricultural carbon emissions were controlled through policies regulating fertilizer use. Although policies remained the main driving force behind green agricultural development during this period, they needed timely adjustments to better adapt to changing conditions and goals. The fourth phase (2014–2022) saw the implementation of numerous policies that emphasized sustainable development, with energy, mechanization, and waste policies refined to achieve carbon reduction goals while maintaining productivity. Although not all policies directly targeted carbon reduction, they indirectly contributed to agricultural technology improvements, leading to lower emissions.
Among the nine policy clusters, science policies were the most effective, focusing on both agricultural research and the practical application of scientific advancements. Notable examples include Science and Technology to the Countryside, which emphasizes applying scientific advancements and promoting the broader dissemination of agricultural technologies, and Technology Awards, which foster innovation and encourage researchers to produce new outcomes. High-quality development policies, a more recent policy cluster, were introduced to achieve the dual goals of agricultural modernization and intensification as well as ecological sustainability while simultaneously reducing carbon emissions and increasing output. Earlier policies primarily focused on expanding agricultural production and increasing yields, with little emphasis on carbon emission control. This prompted the introduction of high-quality development policies and the incorporation of ecological indicators into other policy clusters to improve overall agricultural standards. Technology and waste policies had a relatively smaller impact. The technology policies in Shandong Province promote advanced agricultural production techniques through regular training sessions aimed at improve productivity [61]. However, these policies largely overlooked agricultural management techniques, focusing more on production technologies. As agricultural production expands and industrialization progresses, there has been a growing need to enhance agricultural management practices. Reducing agricultural carbon emissions will require further advancements in technology supported by government efforts [62]. Waste policy implementation has been relatively limited. Although this cluster includes just one policy, the content related to agricultural waste management were also present in high-quality development, industrialization, mechanization, and energy policies. Most waste management subsidies have been allocated to constructing systems for straw collection, storage, transportation, and utilization, as well as developing a complete industrial chain for straw utilization. However, there are few direct economic incentives for farmers, which may limit the effectiveness of these policies [63]. The government should also focus on raising environmental awareness among farmers, encouraging them to take a more proactive role in agricultural waste management [64,65].
The above discussion suggests that future policymaking should focus more on improving the overall quality of agricultural producers, providing more training opportunities, and fostering awareness of low-carbon, green production practices. Additionally, continuing to strengthen the development of new rural areas will promote a virtuous cycle in agricultural production. Policies with lower impact have shown higher coupling degrees in cities with higher policy scores, while cities with lower scores exhibited weaker coupling degrees, indicating uneven implementation across regions. Strengthening both the formulation and implementation of the mentioned policy clusters would positively impact reducing agricultural carbon emissions and increasing food production.
The uneven implementation may stem from deliberate policy steering during formulation or differences in local conditions affecting policy execution. Challenges such as funding shortages, limited public participation, and regional disparities in implementation capacity further complicate policy promotion. As a result, future policy development should focus on multi-party cooperation, involving government, communities, and industry, to enhance policy effectiveness. This is crucial to maintain the emphasis on high-quality development, energy, and scientific policies in the future. Continuous monitoring to ensure that policy content aligns with the current stage of development and making timely adjustments as necessary will be vital. Moreover, the medium coupling degrees observed in most cities for mechanization, product quality, services, technology, and waste policies indicate the requirement for further adjustment and development to better adapt to the current state of agricultural development and provide more favorable policy conditions for the continued growth of agricultural production.

4.2. Limitations and Prospects

This study has the following limitations. First, the policies considered in this study were all sourced from the Shandong Provincial Department of Agriculture and Rural Affairs’ official website, and thus, the impact of other policies on agricultural development was not analyzed. Certain agricultural policies, while not explicitly designed for carbon emission reduction, have effectively promoted agricultural development, indirectly contributing to a relative decrease in agricultural carbon emissions. As a part of the macroeconomic system, the agricultural sector is influenced by economic policies, which may directly or indirectly affect agricultural production, thereby influencing agricultural output and resource allocation. Furthermore, although this study validated the relationship between agricultural carbon emissions and agricultural policies, future research should explore in greater detail the specific pathways and mechanisms through which policies influence carbon emissions. At the same time, agricultural carbon emissions are shaped by numerous factors. While agricultural policies play a guiding role, they do not directly influence production. Instead, their impact is mediated through advancements in agricultural production techniques, including field management practices, cropping systems, and land-use strategies. Future research should consider a wider array of factors that contribute to agricultural carbon emissions to provide a more comprehensive understanding of the dynamics at play. Concurrently, the development of rural areas and the educational level of farmers, as mentioned earlier, also impact the process of agricultural modernization. Future research should consider a more comprehensive classification and collection of policies to provide effective recommendations for future policymaking. Second, this study used total grain output to measure agricultural production capacity, potentially marginalizing areas that primarily grow cash crops in the production evaluation system. Future research should introduce more indicators to create a more comprehensive and suitable evaluation framework for broader applications. Finally, due to data limitations, this study used a relatively basic carbon emission accounting method when estimating agricultural carbon emissions, highlighting the need for further refinement and optimization of carbon accounting methods in future studies.

5. Conclusions

This study examined the decoupling between agricultural production and carbon emissions in Shandong Province, a major grain-producing region in China. It further explored how agricultural policies have impacted the decoupling trend using a coupling coordination model. Agricultural carbon emissions in Shandong initially increased, peaking around 2008, before gradually declining. Throughout the study period, most cities in the province transitioned from a state of strong negative decoupling to strong decoupling, signifying a shift from high-input, extensive farming to green, low-carbon, modern agriculture. The influence of agricultural policies on decoupling has strengthened over time, characterized by four phases: an initial phase with minimal policy impact, followed by a period dominated by policy influence; a phase of policy impact stagnation; and a final phase of policy refinement and improvement. Future policymaking should prioritize improving the overall quality of agricultural productions while maintaining a strong emphasis on high-quality development, energy, and scientific policies. Additionally, policies related to mechanization, product quality, services, technology, and waste should be further refined and developed to better align with the current state of agricultural development. It is necessary to monitor and ensure that policy directions remain aligned with the evolving development stages, making real-time adjustments as needed.

Author Contributions

Conceptualization, J.Z. (Jianghong Zhu) and J.Z. (Jianjun Zhang); methodology, Y.Z.; software, Y.Z.; validation, K.W. and J.Z. (Jianjun Zhang); formal analysis, Y.Z. and K.W.; investigation, Y.Z.; resources, J.Z. (Jianghong Zhu); data curation, Y.Z.; writing—original draft preparation, Y.Z.; writing—review and editing, J.Z. (Jianghong Zhu), J.Z. (Jianjun Zhang) and K.W.; visualization, Y.Z. and K.W.; supervision, J.Z. (Jianghong Zhu) and J.Z. (Jianjun Zhang); project administration, J.Z. (Jianghong Zhu); funding acquisition, J.Z. (Jianjun Zhang). All authors have read and agreed to the published version of the manuscript.

Funding

This paper was funded by the National Key Research and Development Program of China (2021YFE0117900).

Institutional Review Board Statement

Not applicable.

Data Availability Statement

The data used in this paper are published open-source data available at http://tjj.shandong.gov.cn/ (accessed on 12 July 2024) and http://nync.shandong.gov.cn (accessed on 12 July 2024).

Conflicts of Interest

The authors declare no conflicts of interest.

References

  1. Tubiello, F.N.; Salvatore, M.; Rossi, S.; Ferrara, A.; Fitton, N.; Smith, P. The FAOSTAT database of greenhouse gas emissions from agriculture. Environ. Res. 2013, 8, 015009. [Google Scholar] [CrossRef]
  2. Lal, R.; Kimble, J.M. Conservation tillage for carbon sequestration. Nutr. Cycl. Agroecosyst. 1997, 49, 243–253. [Google Scholar] [CrossRef]
  3. Liu, D.; Zhu, X.; Wang, Y. China’s agricultural green total factor productivity based on carbon emission: An analysis of evolution trend and influencing factors. J. Clean. Prod. 2021, 278, 123692. [Google Scholar] [CrossRef]
  4. Jaiswal, B.; Agrawal, M. Carbon Footprints of Agriculture Sector; Springer: Singapore, 2020; pp. 81–99. [Google Scholar]
  5. Rehman, A.; Alam, M.M.; Alvarado, R.; Işık, C.; Ahmad, F.; Cismas, L.M.; Pupazan, M.C.M. Carbonization and agricultural productivity in Bhutan: Investigating the impact of crops production, fertilizer usage, and employment on CO2 emissions. J. Clean. Prod. 2022, 375, 134178. [Google Scholar] [CrossRef]
  6. Haider, A.; Bashir, A.; ul Husnain, M.I. Impact of agricultural land use and economic growth on nitrous oxide emissions: Evidence from developed and developing countries. Sci. Total Environ. 2020, 741, 140421. [Google Scholar] [CrossRef] [PubMed]
  7. Foley, J.A.; Ramankutty, N.; Brauman, K.A.; Cassidy, E.S.; Gerber, J.S.; Johnston, M.; Mueller, N.D.; O’Connell, C.; Ray, D.K.; West, P.C. Solutions for a cultivated planet. Nature 2011, 478, 337–342. [Google Scholar] [CrossRef]
  8. Fan, L.; Yuan, Y.; Ying, Z.; Lam, S.K.; Liu, L.; Zhang, X.; Liu, H.; Gu, B. Decreasing farm number benefits the mitigation of agricultural non-point source pollution in China. Environ. Sci. Pollut. Res. 2019, 26, 464–472. [Google Scholar] [CrossRef]
  9. Sun, W.; Canadell, J.G.; Yu, L.; Yu, L.; Zhang, W.; Smith, P.; Fischer, T.; Huang, Y. Climate drives global soil carbon sequestration and crop yield changes under conservation agriculture. Glob. Change Biol. 2020, 26, 3325–3335. [Google Scholar] [CrossRef] [PubMed]
  10. Li, J.; Li, S.; Liu, Q.; Ding, J. Agricultural carbon emission efficiency evaluation and influencing factors in Zhejiang province, China. Front. Environ. Sci. 2022, 10, 1005251. [Google Scholar] [CrossRef]
  11. Yasmeen, R.; Tao, R.; Shah, W.U.H.; Padda, I.U.H.; Tang, C. The nexuses between carbon emissions, agriculture production efficiency, research and development, and government effectiveness: Evidence from major agriculture-producing countries. Environ. Sci. Pollut. Res. 2022, 29, 52133–52146. [Google Scholar] [CrossRef]
  12. Appiah, K.; Du, J.; Poku, J. Causal relationship between agricultural production and carbon dioxide emissions in selected emerging economies. Environ. Sci. Pollut. Res. 2018, 25, 24764–24777. [Google Scholar] [CrossRef] [PubMed]
  13. Guo, Z.; Zhang, X. Carbon reduction effect of agricultural green production technology: A new evidence from China. Sci. Total Environ. 2023, 874, 162483. [Google Scholar] [CrossRef] [PubMed]
  14. Fedoroff, N.V.; Cohen, J.E. Plants and population: Is there time? Proc. Natl. Acad. Sci. USA 1999, 96, 5903–5907. [Google Scholar] [CrossRef] [PubMed]
  15. Shan, T.; Xia, Y.; Hu, C.; Zhang, S.; Zhang, J.; Xiao, Y.; Dan, F. Analysis of regional agricultural carbon emission efficiency and influencing factors: Case study of Hubei Province in China. PLoS ONE 2022, 17, e0266172. [Google Scholar] [CrossRef]
  16. Tilman, D.; Balzer, C.; Hill, J.; Befort, B.L. Global food demand and the sustainable intensification of agriculture. Proc. Natl. Acad. Sci. USA 2011, 108, 20260–20264. [Google Scholar] [CrossRef]
  17. Tubiello, F.N.; Salvatore, M.; Cóndor Golec, R.D.; Ferrara, A.; Rossi, S.; Biancalani, R.; Federici, S.; Jacobs, H.; Flammini, A. Agriculture, forestry and other land use emissions by sources and removals by sinks. Environ. Sci. Agric. Food Sci. 2014, 2, 4–89. [Google Scholar]
  18. Raihan, A.; Tuspekova, A. The nexus between economic growth, renewable energy use, agricultural land expansion, and carbon emissions: New insights from Peru. Energy Nexus 2022, 6, 100067. [Google Scholar] [CrossRef]
  19. Zhang, L.; Pang, J.; Chen, X.; Lu, Z. Carbon emissions, energy consumption and economic growth: Evidence from the agricultural sector of China’s main grain-producing areas. Sci. Total Environ. 2019, 665, 1017–1025. [Google Scholar] [CrossRef]
  20. Luo, Y.; Long, X.; Wu, C.; Zhang, J. Decoupling CO2 emissions from economic growth in agricultural sector across 30 Chinese provinces from 1997 to 2014. J. Clean. Prod. 2017, 159, 220–228. [Google Scholar] [CrossRef]
  21. Huang, Q.; Zhang, Y. Decoupling and decomposition analysis of agricultural carbon emissions: Evidence from Heilongjiang province, China. Int. J. Environ. Res. Public Health 2021, 19, 198. [Google Scholar] [CrossRef]
  22. Díaz, M.; Concepción, E.D.; Morales, M.B.; Alonso, J.C.; Azcárate, F.M.; Bartomeus, I.; Bota, G.; Brotons, L.; García, D.; Giralt, D. Environmental objectives of Spanish agriculture: Scientific guidelines for their effective implementation under the Common Agricultural Policy 2023–2030. Ardeola 2021, 68, 445–460. [Google Scholar] [CrossRef]
  23. Nsabiyeze, A.; Ma, R.; Li, J.; Luo, H.; Zhao, Q.; Tomka, J.; Zhang, M. Tackling Climate Change in Agriculture: A Global Evaluation of the Effectiveness of Carbon Emission Reduction Policies. J. Clean. Prod. 2024, 468, 142973. [Google Scholar] [CrossRef]
  24. Lehmann, E.E.; Menter, M. Public cluster policy and performance. J. Clean. Prod. 2018, 43, 558–592. [Google Scholar] [CrossRef]
  25. Cheng, P.; Tang, H.; Lin, F.; Kong, X.; Research, P. Bibliometrics of the nexus between food security and carbon emissions: Hotspots and trends. Environ. Sci. Pollut. Res. 2023, 30, 25981–25998. [Google Scholar] [CrossRef]
  26. Li, J.; Gao, M.; Luo, E.; Wang, J.; Zhang, X. Does rural energy poverty alleviation really reduce agricultural carbon emissions? The case of China. Energy Econ. 2023, 119, 106576. [Google Scholar] [CrossRef]
  27. Haughey, E.; Neogi, S.; Portugal-Pereira, J.; van Diemen, R.; Slade, R. Sustainable intensification and carbon sequestration research in agricultural systems: A systematic review. Environ. Sci. Policy 2023, 143, 14–23. [Google Scholar] [CrossRef]
  28. Accorsi, R.; Cholette, S.; Manzini, R.; Pini, C.; Penazzi, S. The land-network problem: Ecosystem carbon balance in planning sustainable agro-food supply chains. J. Clean. Prod. 2016, 112, 158–171. [Google Scholar] [CrossRef]
  29. Xu, T.; Kang, C.; Zhang, H. China’s efforts towards carbon neutrality: Does energy-saving and emission-reduction policy mitigate carbon emissions? J. Environ. Manag. 2022, 316, 115286. [Google Scholar] [CrossRef]
  30. Pazienza, P.; de Lucia, C. For a new plastics economy in agriculture: Policy reflections on the EU strategy from a local perspective. J. Clean. Prod. 2020, 253, 119844. [Google Scholar] [CrossRef]
  31. Duque-Acevedo, M.; Belmonte-Ureña, L.J.; Cortés-García, F.J.; Camacho-Ferre, F. Agricultural waste: Review of the evolution, approaches and perspectives on alternative uses. Glob. Ecol. Conserv. 2020, 22, e00902. [Google Scholar] [CrossRef]
  32. Rong, J.; Hong, J.; Guo, Q.; Fang, Z.; Chen, S. Path mechanism and spatial spillover effect of green technology innovation on agricultural CO2 emission intensity: A case study in Jiangsu Province, China. Ecol. Indic. 2023, 157, 111147. [Google Scholar] [CrossRef]
  33. Feng, Y.F.; Zhang, Y.; Wu, Z.D.; Ye, Q.L.; Cao, X. Evaluation of Agricultural Eco-Efficiency and Its Spatiotemporal Differentiation in China, Considering Green Water Consumption and Carbon Emissions Based on Undesired Dynamic SBM-DEA. Sustainability 2023, 15, 3361. [Google Scholar] [CrossRef]
  34. Zhu, Y.; Huo, C. The Impact of Agricultural Production Efficiency on Agricultural Carbon Emissions in China. Energies 2022, 15, 4464. [Google Scholar] [CrossRef]
  35. Taleb, M. Modelling environmental energy efficiency in the presence of carbon emissions: Modified oriented efficiency measures under polluting technology of data envelopment analysis. J. Clean. Prod. 2023, 414, 137743. [Google Scholar] [CrossRef]
  36. Li, G.Y.; Hou, C.P.; Zhou, X.J. Carbon Neutrality, International Trade, and Agricultural Carbon Emission Performance in China. Front. Environ. Sci. 2022, 10, 931937. [Google Scholar] [CrossRef]
  37. Cui, H.R.; Zhao, T.; Shi, H. STIRPAT-Based Driving Factor Decomposition Analysis of Agricultural Carbon Emissions in Hebei, China. Pol. J. Environ. Stud. 2018, 27, 1449–1461. [Google Scholar] [CrossRef]
  38. Wang, Q.; Su, M. Drivers of decoupling economic growth from carbon emission–an empirical analysis of 192 countries using decoupling model and decomposition method. Environ. Impact Assess. Rev. 2020, 81, 106356. [Google Scholar] [CrossRef]
  39. Bianco, V.; Cascetta, F.; Nardini, S. Analysis of the carbon emissions trend in European Union. A decomposition and decoupling approach. Sci. Total Environ. 2024, 909, 168528. [Google Scholar] [CrossRef] [PubMed]
  40. Ruffing, K. Indicators to measure decoupling of environmental pressure from economic growth. Metal. Int. 2007, 67, 211. [Google Scholar]
  41. Tapio, P. Towards a theory of decoupling: Degrees of decoupling in the EU and the case of road traffic in Finland between 1970 and 2001. Transp. Policy 2005, 12, 137–151. [Google Scholar] [CrossRef]
  42. Fischer-Kowalski, M.; Swilling, M. Decoupling Natural Resource Use and Environmental Impacts from Economic Growth; United Nations Environment Programme: Nairobi, Kenya, 2011. [Google Scholar]
  43. Hossain, M.; Chen, S. The decoupling study of agricultural energy-driven CO2 emissions from agricultural sector development. Int. J. Environ. Sci. Technol. 2022, 19, 4509–4524. [Google Scholar] [CrossRef]
  44. Liu, X.; Xin, Y. Exploring the characteristics and driving factors of coupling coordination of regional sustainable development: Evidence from China’s 31 provinces. Environ. Sci. Pollut. Res. 2022, 29, 71075–71099. [Google Scholar] [CrossRef] [PubMed]
  45. Zhang, X.; Fan, H.; Hou, H.; Xu, C.; Sun, L.; Li, Q.; Ren, J. Spatiotemporal evolution and multi-scale coupling effects of land-use carbon emissions and ecological environmental quality. Sci. Total Environ. 2024, 922, 171149. [Google Scholar] [CrossRef] [PubMed]
  46. Ni, J.; Zheng, X.; Zheng, Y.; Zhang, Y.; Li, H. Coupling Coordination Development of the Ecological–Economic System in Hangzhou, China. Sustainability 2023, 15, 16570. [Google Scholar] [CrossRef]
  47. Wang, X.; Zhao, H.; Qian, J.; Li, X.; Cao, C.; Feng, Z.; Cui, Y. Sustainable Land Use Diagnosis Based on the Perspective of Coupling Socioeconomy and Ecology in the Xiongan New Area, China. Land 2024, 13, 92. [Google Scholar] [CrossRef]
  48. Han, D.; Yu, D.; Qiu, J. Assessing coupling interactions in a safe and just operating space for regional sustainability. Nat. Commun. 2023, 14, 1369. [Google Scholar] [CrossRef] [PubMed]
  49. SHANDONG STATISTICAL YEARBOOK. Available online: http://tjj.shandong.gov.cn/col/col6279/index.html (accessed on 23 July 2024).
  50. West, T.; Marland, G. Net carbon flux from agricultural ecosystems: Methodology for full carbon cycle analyses. Environ. Pollut. 2002, 116, 439–444. [Google Scholar] [CrossRef]
  51. Wang, B.; Zhang, W. A research of agricultural eco-efficiency measure in China and space-time differences. China Popul. Resour. Environ. 2016, 26, 11–19. [Google Scholar]
  52. Duan, H.; Zhang, Y.; Zhao, J.; Bian, X. Carbon footprint analysis of farmland ecosystem in China. J. Soil Water Conserv. 2011, 25, 203–208. [Google Scholar]
  53. Han, H.; Zhong, Z.; Guo, Y.; Xi, F.; Liu, S.; Research, P. Coupling and decoupling effects of agricultural carbon emissions in China and their driving factors. Environ. Sci. Pollut. Res. 2018, 25, 25280–25293. [Google Scholar] [CrossRef]
  54. Tang, Z. An integrated approach to evaluating the coupling coordination between tourism and the environment. Tour. Manag. 2015, 46, 11–19. [Google Scholar] [CrossRef]
  55. Li, Y.; Li, Y.; Zhou, Y.; Shi, Y.; Zhu, X. Investigation of a coupling model of coordination between urbanization and the environment. J. Environ. Manag. 2012, 98, 127–133. [Google Scholar] [CrossRef] [PubMed]
  56. He, J.; Wang, S.; Liu, Y.; Ma, H.; Liu, Q. Examining the relationship between urbanization and the eco-environment using a coupling analysis: Case study of Shanghai, China. Ecol. Indic. 2017, 77, 185–193. [Google Scholar] [CrossRef]
  57. Kai, Y.; Shuran, L.; Jiancun, G.; Lei, P. Research on the coupling degree measurement model of urban gas pipeline leakage disaster system. Int. J. Disaster Risk Reduct. 2017, 22, 238–245. [Google Scholar] [CrossRef]
  58. Li, E.; Cui, Z. Coupling coordination between China’s regional innovation capability and economic development. Sci. Geogr. Sin. 2018, 38, 1412–1421. [Google Scholar]
  59. Yang, Z.; Wu, Y.; Wang, F.; Chen, A.; Wang, Y. Spatial-temporal differences and influencing factors of coupling coordination between urban quality and technology innovation in the Guangdong-Hong Kong-Macao Greater Bay Area. PLoS ONE 2023, 18, e0289988. [Google Scholar] [CrossRef]
  60. He, H.; Ding, R.; Tian, X. Spatiotemporal characteristics and influencing factors of grain yield at the county level in Shandong Province, China. Nature 2022, 12, 12001. [Google Scholar] [CrossRef]
  61. Deng, F.; Jia, S.; Ye, M.; Li, Z.; Research, P. Coordinated development of high-quality agricultural transformation and technological innovation: A case study of main grain-producing areas, China. Environ. Sci. Pollut. Res. 2022, 29, 35150–35164. [Google Scholar] [CrossRef]
  62. Li, S.; Wang, Z.J.A. The effects of agricultural technology progress on agricultural carbon emission and carbon sink in China. Agriculture 2023, 13, 793. [Google Scholar] [CrossRef]
  63. Sun, D.; Ge, Y.; Zhou, Y. Punishing and rewarding: How do policy measures affect crop straw use by farmers? An empirical analysis of Jiangsu Province of China. Energy Policy 2019, 134, 110882. [Google Scholar] [CrossRef]
  64. He, J.; Zhou, W.; Guo, S.; Deng, X.; Song, J.; Xu, D. Environmental policy and farmers’ active straw return: Administrative guidance or economic reward and punishment. Environ. Dev. Sustain. 2023, 26, 1–24. [Google Scholar] [CrossRef]
  65. Cammarata, M.; Scuderi, A.; Timpanaro, G.; Cascone, G. Factors influencing farmers’ intention to participate in the voluntary carbon market: An extended theory of planned behavior. J. Environ. Manag. 2024, 369, 122367. [Google Scholar] [CrossRef] [PubMed]
Figure 1. Study area.
Agriculture 14 01940 g001
Figure 2. Research framework.
Agriculture 14 01940 g002
Figure 3. Average score proportion of green low-carbon agriculture policies.
Agriculture 14 01940 g003
Figure 4. Defining decoupled states.
Agriculture 14 01940 g004
Figure 5. Agricultural carbon emissions in Shandong Province. In this context, (a,b) denote the average values of agricultural carbon emissions and grain production in Shandong Province, respectively; (cf) represent the spatial distribution of agricultural carbon emissions in Shandong Province for the years 2000, 2007, 2014, and 2022.
Agriculture 14 01940 g005
Figure 6. State of decoupling of agricultural carbon emissions. (ad) represent the spatial distribution in 2001, 2005, 2011, and 2021, respectively.
Agriculture 14 01940 g006
Figure 7. State of agricultural policy coupling. (ac) represent the spatial distribution of agricultural policy coupling in 2000, 2006, and 2016, respectively. (d) represents the average coupling trends of agricultural policies.
Agriculture 14 01940 g007
Figure 8. Trends in the coupling of agricultural policy clusters.
Agriculture 14 01940 g008
Figure 9. Accumulated situation of agricultural policy clusters’ effects in cities. (ai) Represent Nine Policy Clusters: High-quality Development, Energy, Industrialization, Mechanization, Production Quality, Science, Service, Technology, and Waste Policies.
Agriculture 14 01940 g009aAgriculture 14 01940 g009b
Figure 10. Coupling state of agricultural policy clusters. (ai) Represent Nine Policy Clusters: High-quality Development, Energy, Industrialization, Mechanization, Production Quality, Science, Service, Technology, and Waste Policies.
Agriculture 14 01940 g010
Table 1. Green and low-carbon agricultural policies in Shandong Province.
Policy CategoryPolicies
IndustrializationShandong Province Key Agricultural Industrialization Leading Enterprises (2006 to date)
Farmers’ Professional Cooperatives (2007 to date)
Provincial Agricultural Standardization Production Bases (2015 to date);
Agricultural Production Entrustment (2017–2020)
Agricultural Industry Strong Towns (2018 to date)
Provincial Modern Agricultural Industrial Parks (2019 to date)
Modern Agriculture Strong Counties (2021 to date)
Agricultural Green Development Pilot Counties (2021 to date)
Agricultural Full Industry Chain Typical Counties (2022 to date)
WasteCrop Straw Comprehensive Utilization (2008 to date)
ServicesProvincial Agricultural Production Development Funds (2009–2018)
High-Yield Grain Creation Platform Construction (2016–2017)
Agricultural Production Disaster Relief Funds (2018–2020)
Establishment of Local Standards in Agriculture (2018–2020)
High-Quality DevelopmentGreen Grain Increase Model (2014–2016)
Cultivated Land Quality Improvement (2014–2020)
Pesticide Reduction (2015 to date)
Provincial Ecological Cycle Agriculture (2016–2018)
Planting Structure Optimization (2016–2020)
Grain Field Water and Fertilizer Integration (2016 to date)
Fertilizer Reduction and Efficiency Increase (2016 to date)
Agricultural and Rural Pollution Control (2017 to date)
Organic Fertilizer Replacement of Chemical Fertilizer (2017 to date)
Green Cycle High-Quality and Efficient Feature Agriculture (2018)
Green and High-Quality Grain Creation (2019–2020)
Cultivated Land Rotation and Fallow System (2019–2020)
Provincial Agricultural Green Development Pilot Zones (2020)
Green Breeding and Farming Cycle Agriculture Pilot (2021 to date)
High-Standard Farmland Construction (2021 to date)
MechanizationFacility Planting Mechanization (2021)
Subsidies for Agricultural Machinery Purchase and Application (2022 to date)
Agricultural Oil Supply and Protection Activities for Farmers (2022 to date)
TechnologyAgricultural Technology Promotion (2008 to date)
Agricultural Technology Service Action (2022 to date)
ScienceScience and Technology to the Countryside (2006 to date)
Agricultural Science and Technology Awards (2008 to date)
EnergyRural Biogas “Safety Production Month” (2017 to date)
Product QualityPollution-Free Agricultural Product Production Sites (2004–2017)
Agricultural Product Quality Safety Improvement Projects (2008–2016)
“Three Products and One Standard” (2013–2021)
Agricultural Supply-Side Structural Reform (2016–2018)
Intelligent Early Warning and Monitoring of Crop Pests and Diseases (2017 to date)
Table 2. Agricultural carbon emission factors and sources.
Carbon SourcesCarbon Emission CoefficientReference
Fertilizers0.90 kg C/kgWest and Marland [50]
Pesticides4.93 kg C/kgWest and Marland
Agricultural plastic film5.18 kg C/kgWang and Zhang [51]
Irrigation266.48 kg C/haDuan et al. [52]
Fertilizers0.90 kg C/kgWest and Marland
Agricultural machineryAgricultural machinery total power0.18 kg C/kwWest and Marland
Total sown area16.47 kg C/haWest and Marland
Disclaimer/Publisher’s Note: The statements, opinions and data contained in all publications are solely those of the individual author(s) and contributor(s) and not of MDPI and/or the editor(s). MDPI and/or the editor(s) disclaim responsibility for any injury to people or property resulting from any ideas, methods, instructions or products referred to in the content.

