1. Introduction
Quality assessment is a crucial aspect of the meat industry, directly impacting consumer health and the commercial value of food products. Intramuscular fat (IMF) content, as an important indicator of meat quality, significantly affects the texture, flavor, and tenderness of meat [
1]. A low IMF content leads to reduced tenderness, juiciness, flavor, and overall consumer acceptability in meat products. Conversely, while a higher IMF content improves various physicochemical properties, it may negatively impact the animal’s health if it exceeds a certain level [
2]. Overemphasis on lean meat yield and growth rate over the years has led to an overall decline in porcine IMF content, which critically affects pork quality [
3]. The ideal is generally believed to range from 3.0% to 3.5% [
4,
5].
The most accurate method for detecting IMF content is chemical analysis [
6]; however, this method requires the slaughter of pigs, is destructive to the samples, and is excessively time-consuming. Near-infrared spectroscopy [
7,
8] and hyperspectral imaging [
9,
10,
11,
12] have also emerged as techniques for measuring IMF content, but these methods also require the slaughter of pigs when applied to market meat. Detecting and controlling the IMF content during pig rearing can save time, enhance production efficiency, and protect animal welfare. Accordingly, non-destructive methods based on ultrasound technology for IMF content measurement have become a priority.
In early studies, researchers have suggested that intramuscular fat content is significantly correlated with backfat thickness and
longissimus dorsi muscle area [
13,
14]. Some researchers extracted feature parameters from ultrasound images of the eye muscle, such as the gray-level co-occurrence matrix [
15], image histogram [
16], run-length matrix, and wavelet transform [
17], before constructing linear regression models using these parameters along with backfat thickness and eye muscle area. However, traditional linear regression models are limited in regard to complexity and predictive accuracy.
As research advanced and data volumes increased, deep learning methods were gradually introduced into IMF content prediction studies. Compared with linear regression models, deep learning can handle more complex and higher-dimensional data. Chen [
18] used a convolutional neural network(CNN) model to predict backfat thickness and eye muscle area separately, followed by machine learning methods to predict IMF content. Zhao [
19] used deep learning technology for beef marbling grading and developed a mobile application to display the grading results in real time, significantly improving the inspection efficiency of agriculture and livestock products. Liu [
20] proposed a deep learning model named the Prediction of Intramuscular Fat Percentage (PIMFP), which is the first to use a convolutional neural network to directly predict IMF content from ultrasound images. Despite the value of these contributions, these methods still have limitations. For example, Chen’s [
18] method requires separate training of the backfat and eye muscle prediction and machine learning models, and Zhao [
19] focused only on beef grading. Liu’s [
20] approach requires the precise segmentation of regions of interest (ROIs), increasing difficulty and uncertainty during practical operations due to inherently strict image preprocessing accuracy requirements.
Accurately and conveniently predicting IMF content in live pigs remains a significant challenge. To address this, we designed a two-stage multimodal model, the Backfat thickness–Longissimus dorsi area Intramuscular fat Multimodal Network (BL-IMF-MNet) to segment the longissimus dorsi region in ultrasound images and predict the IMF content.
In this study, we used the UNetPlus image segmentation network to segment the longissimus dorsi region in ultrasound images as the ROI, then combined this ROI with backfat thickness and longissimus dorsi area values via a multimodal network for training to predict the IMF content. This approach not only improves the accuracy of IMF content prediction but also reduces reliance on destructive sampling, holding significant application potential and practical value.
2. Materials and Methods
2.1. Sample and Image Acquisition
The experimental data for this study were provided by Professor Jianxun Zhang’s research team at the Chongqing University of Technology [
18]. The dataset comprises 135 sets of vertical ultrasound images of pig
longissimus dorsi muscles, captured using the BMV FarmScan
® L70 veterinary ultrasound device (manufactured by BMV Technology Ltd., Shenzhen, China), equipped with a linear backfat probe, with a detection depth set to 20 cm. The pigs were fasted the day before data collection. Prior to obtaining the ultrasound images, the body weight of each pig was measured. Transverse ultrasound images were collected from the left side of the carcass between the 10th and 11th ribs using the ultrasound device. Experienced personnel annotated the images to calculate the backfat thickness and
longissimus dorsi muscle area. After slaughter, samples of the
longissimus dorsi muscle between the 10th and 11th ribs were collected, and the intramuscular fat content was determined using the Soxhlet extraction method. Ultrasound images from 130 pigs were obtained along with corresponding ear tag numbers, body weight, backfat thickness,
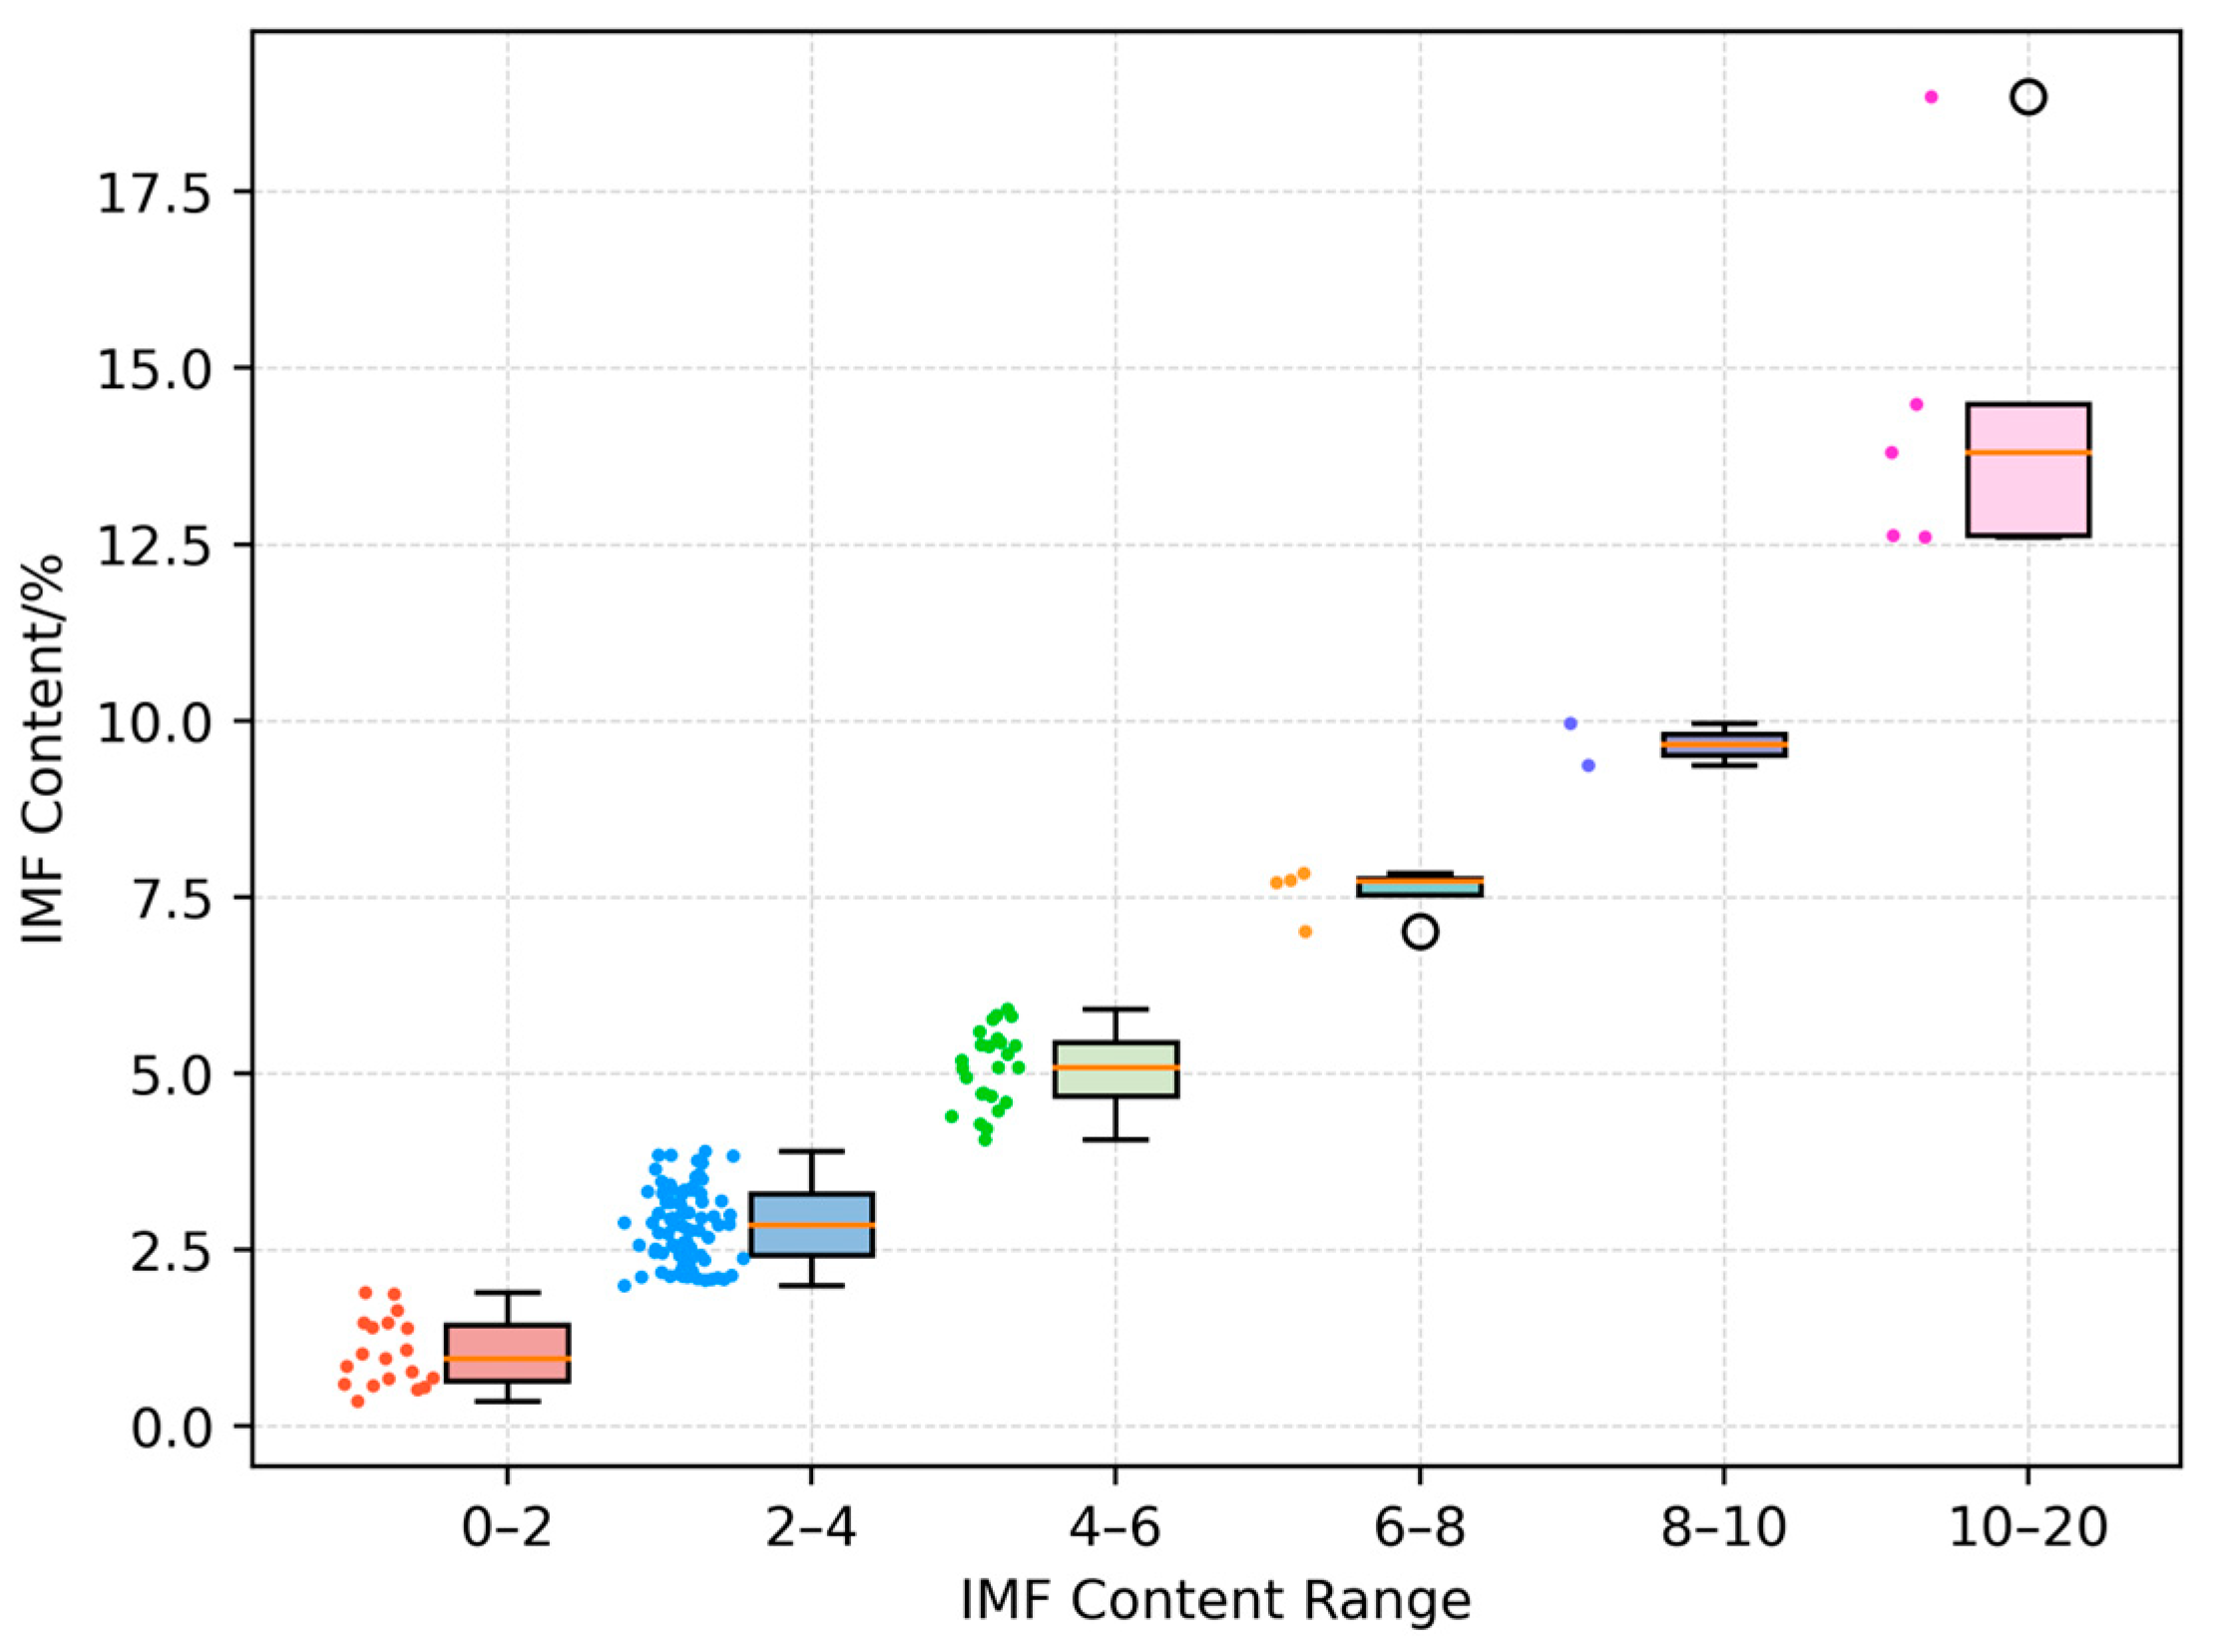
longissimus dorsi muscle area, and IMF content data. Only body weight and IMF data are available for the remaining five pigs. The body weight ranged from 75.8 kg to 127 kg, with an average of 95.59 kg; the backfat thickness ranged from 0.91 cm to 5.48 cm, with an average of 2.78 cm; the
longissimus dorsi muscle area ranged from 11 cm
2 to 53.78 cm
2, with an average of 26.99 cm
2; the IMF content across the entire dataset ranges from 0.36% to 18.85%, with an average of 3.67%. A chart illustrating the specific IMF content range and number of pigs is provided in
Figure 1.
2.2. Overview of the BL-IMF-MNet Framework
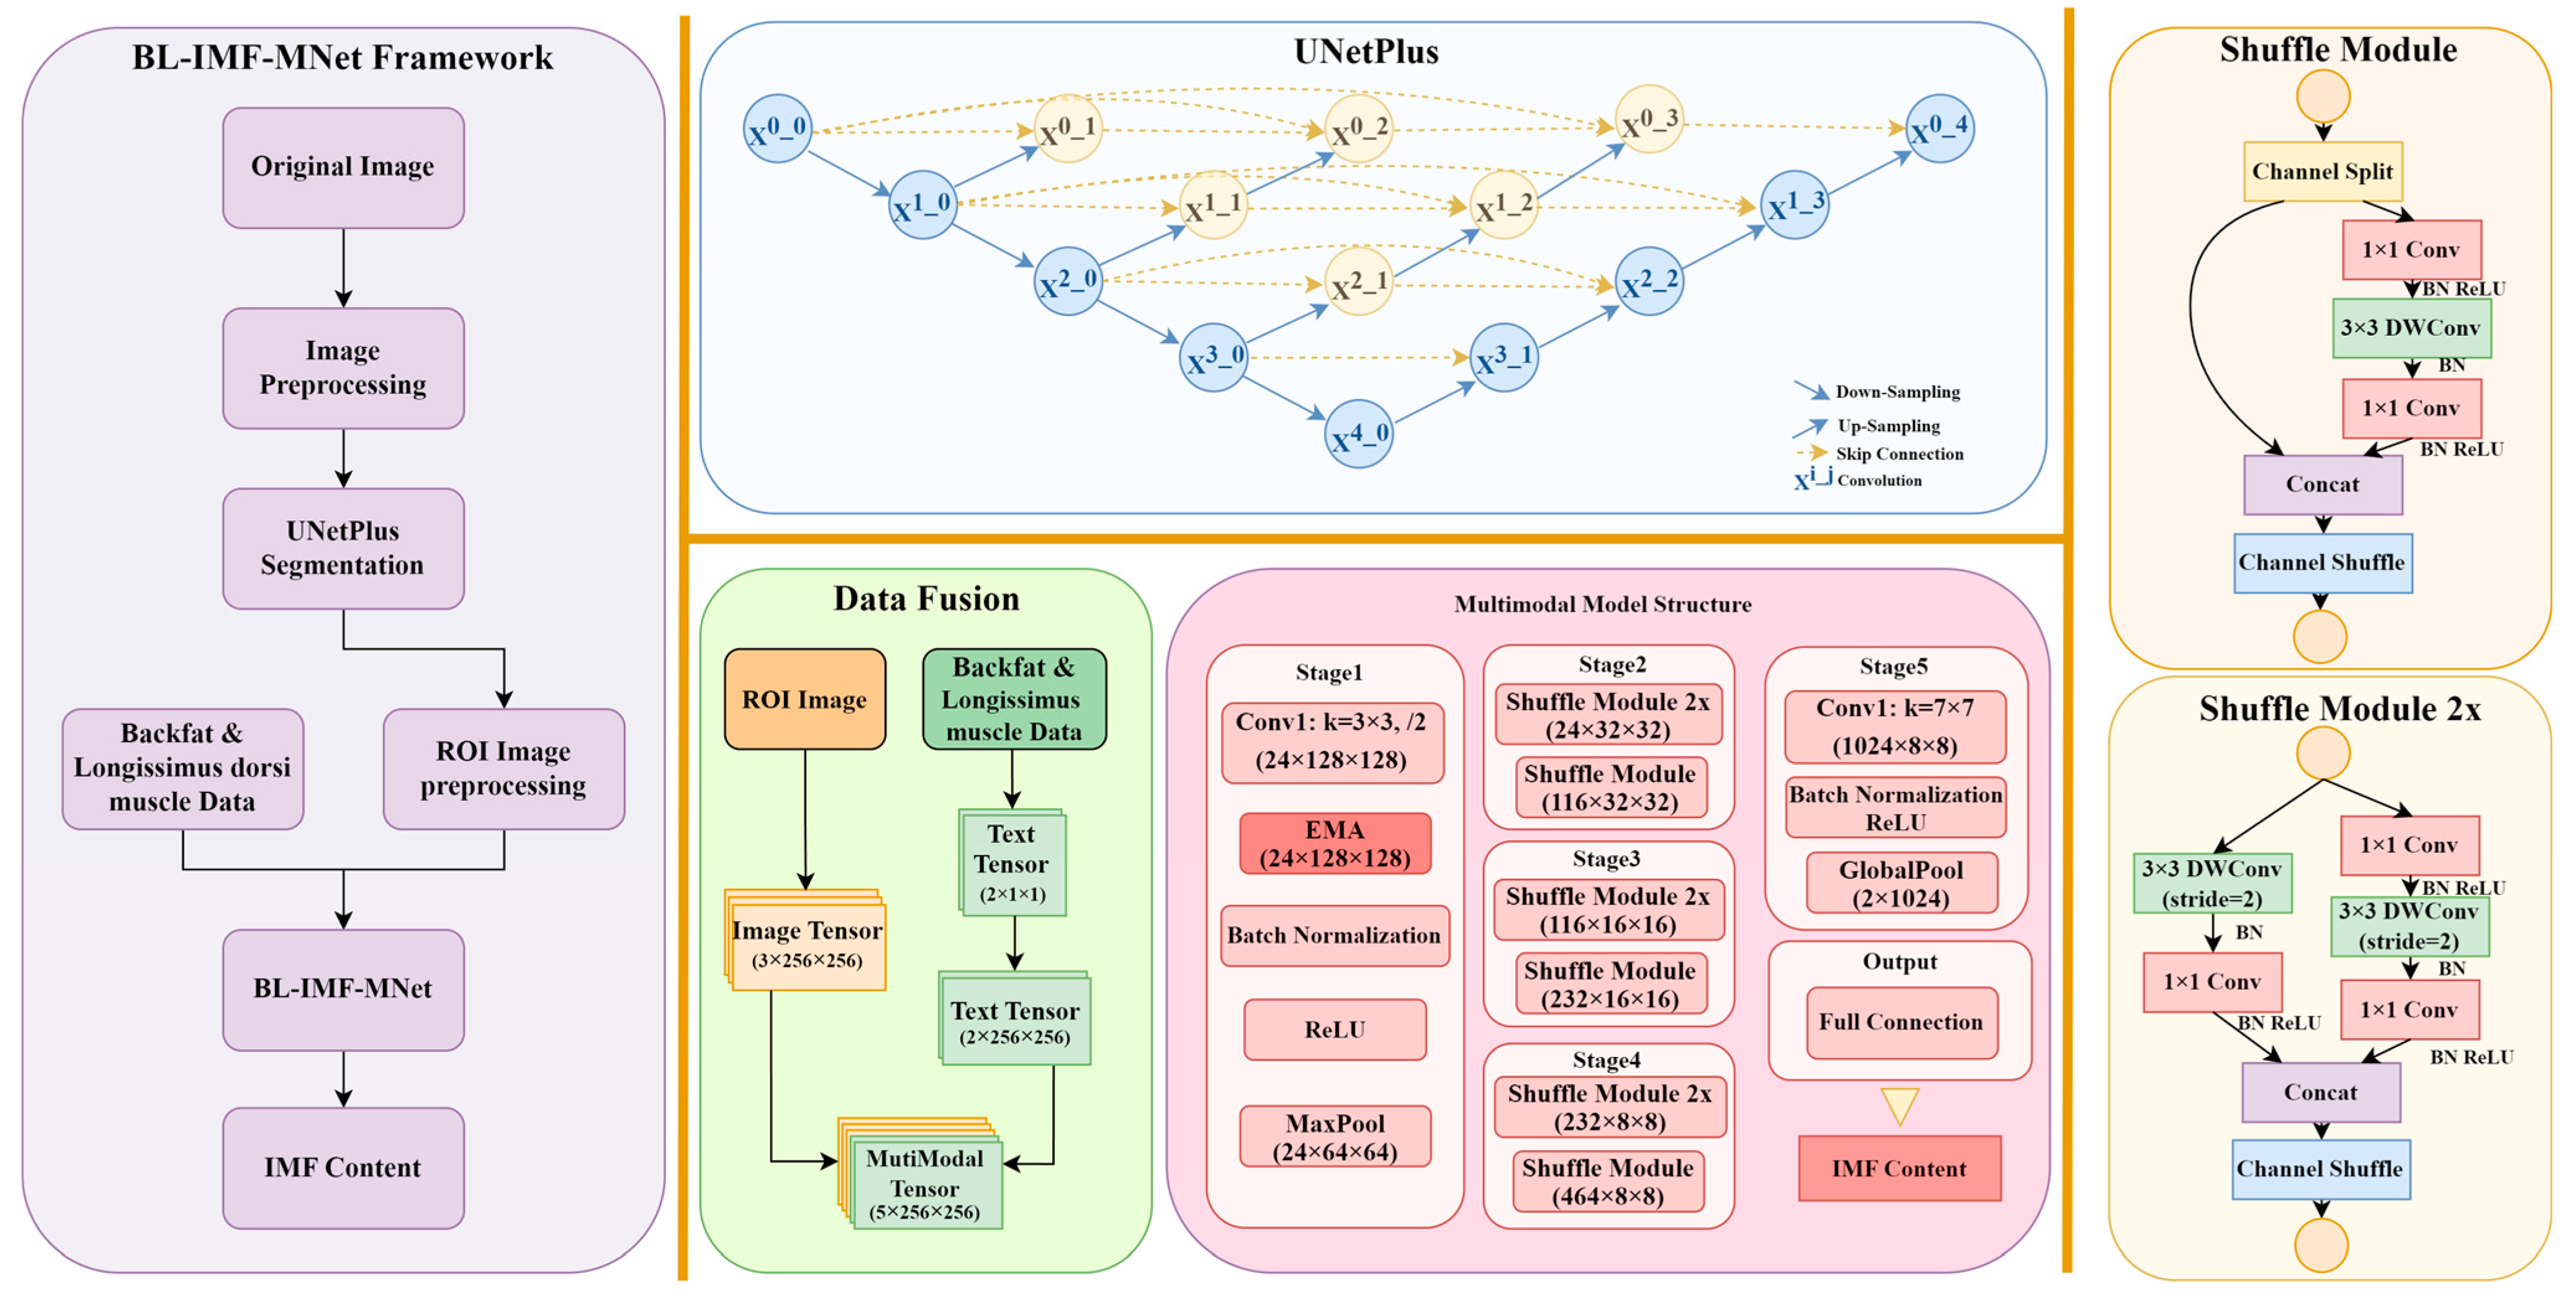
The BL-IMF-MNet consists of five components: image segmentation data preprocessing, UNetPlus image segmentation network, multimodal data preprocessing, multimodal model training, and model inference (
Figure 2). First, the original ultrasound images are preprocessed, labeled, and augmented. The UNetPlus image segmentation network is then used to segment the
longissimus dorsi muscle region as the ROI. To highlight features such as fat tissue, the ROI is adaptively enhanced using contrast-limited adaptive histogram equalization. The data are simultaneously screened and augmented to ensure the effectiveness of the network model. A multimodal dataset is then created and input into the multimodal network for training. Finally, the IMF content value is obtained through model inference.
2.2.1. Image Segmentation Data Preprocessing
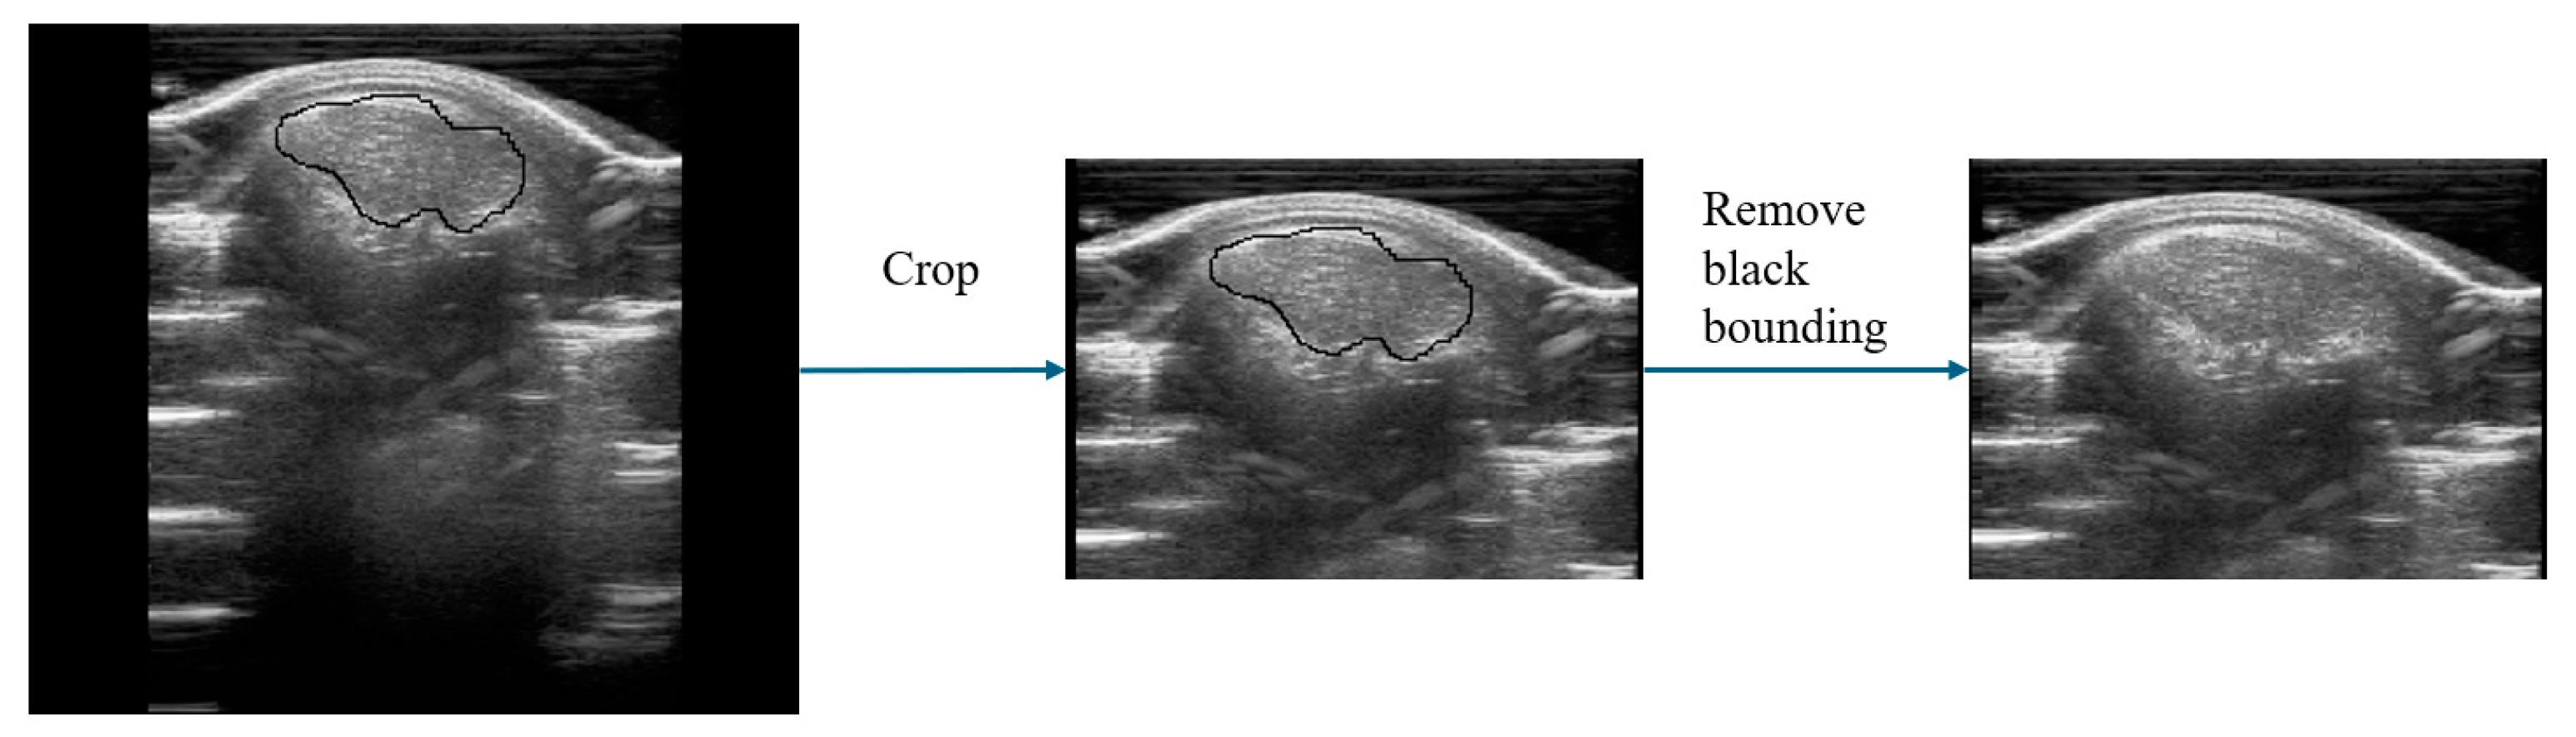
In this experiment, 135 ultrasound images of pigs were obtained as the original data for the UNetPlus image segmentation network. The resolution of these original images was 309 × 254. They were cropped to retain only the upper half due to non-useful areas being present at the bottom of the images, shifting the resolution to 220 × 160. The original images also had black boxes marked by the ultrasound machine, which were removed using the OpenCV library by identifying the black pixels in the images and covering them, averaging the values of the two adjacent pixels horizontally or vertically. Subsequently, the images were annotated using Labelme v3.16.7 under the guidance of pig-farm experts.
Data augmentation techniques including image rotation, horizontal flipping, and random cropping were employed to increase the amount of data for model training and improve their generalization ability. These steps ultimately expanded the original 135 images to 562 images to form the segmentation dataset. The dataset was divided into training, validation, and test sets in an 8:1:1 ratio; the training set contained 449 images, the validation set contained 57 images, and the test set contained 56 images. This process is depicted in
Figure 3.
2.2.2. UNetPlus Image Segmentation Network
UNetPlus [
21] is an enhanced version of the UNet [
22], which is widely used for image segmentation in the medical field. The UNet features a U-shaped, fully symmetric structure comprising an encoder and a decoder. The encoder extracts features by progressively reducing the image size and increasing the number of channels, while the decoder restores the image to its original size through up-sampling and adds skip connections at the corresponding dimensions to help the network capture both low- and high-level feature details.
UNetPlus retains the basic structure of the encoder and decoder but enhances the skip connections by densifying them. This improvement allows the fusion of feature information from different dimensions and reduces the semantic gap between features in the encoder and decoder subnetworks. There is a connection layer between each convolutional layer that merges the output of the previous convolutional layer in the same dense block with the corresponding down-sampled output of the next dense block. These dense skip connections integrate the outputs of each encoder, yielding richer semantic information. Additionally, a deep supervision mechanism enables the model to operate in all or part of the branches, which reduces the size and computational cost of the model with minimal precision loss, thereby determining its pruning and inference speed.
2.2.3. Multimodal Data Preprocessing
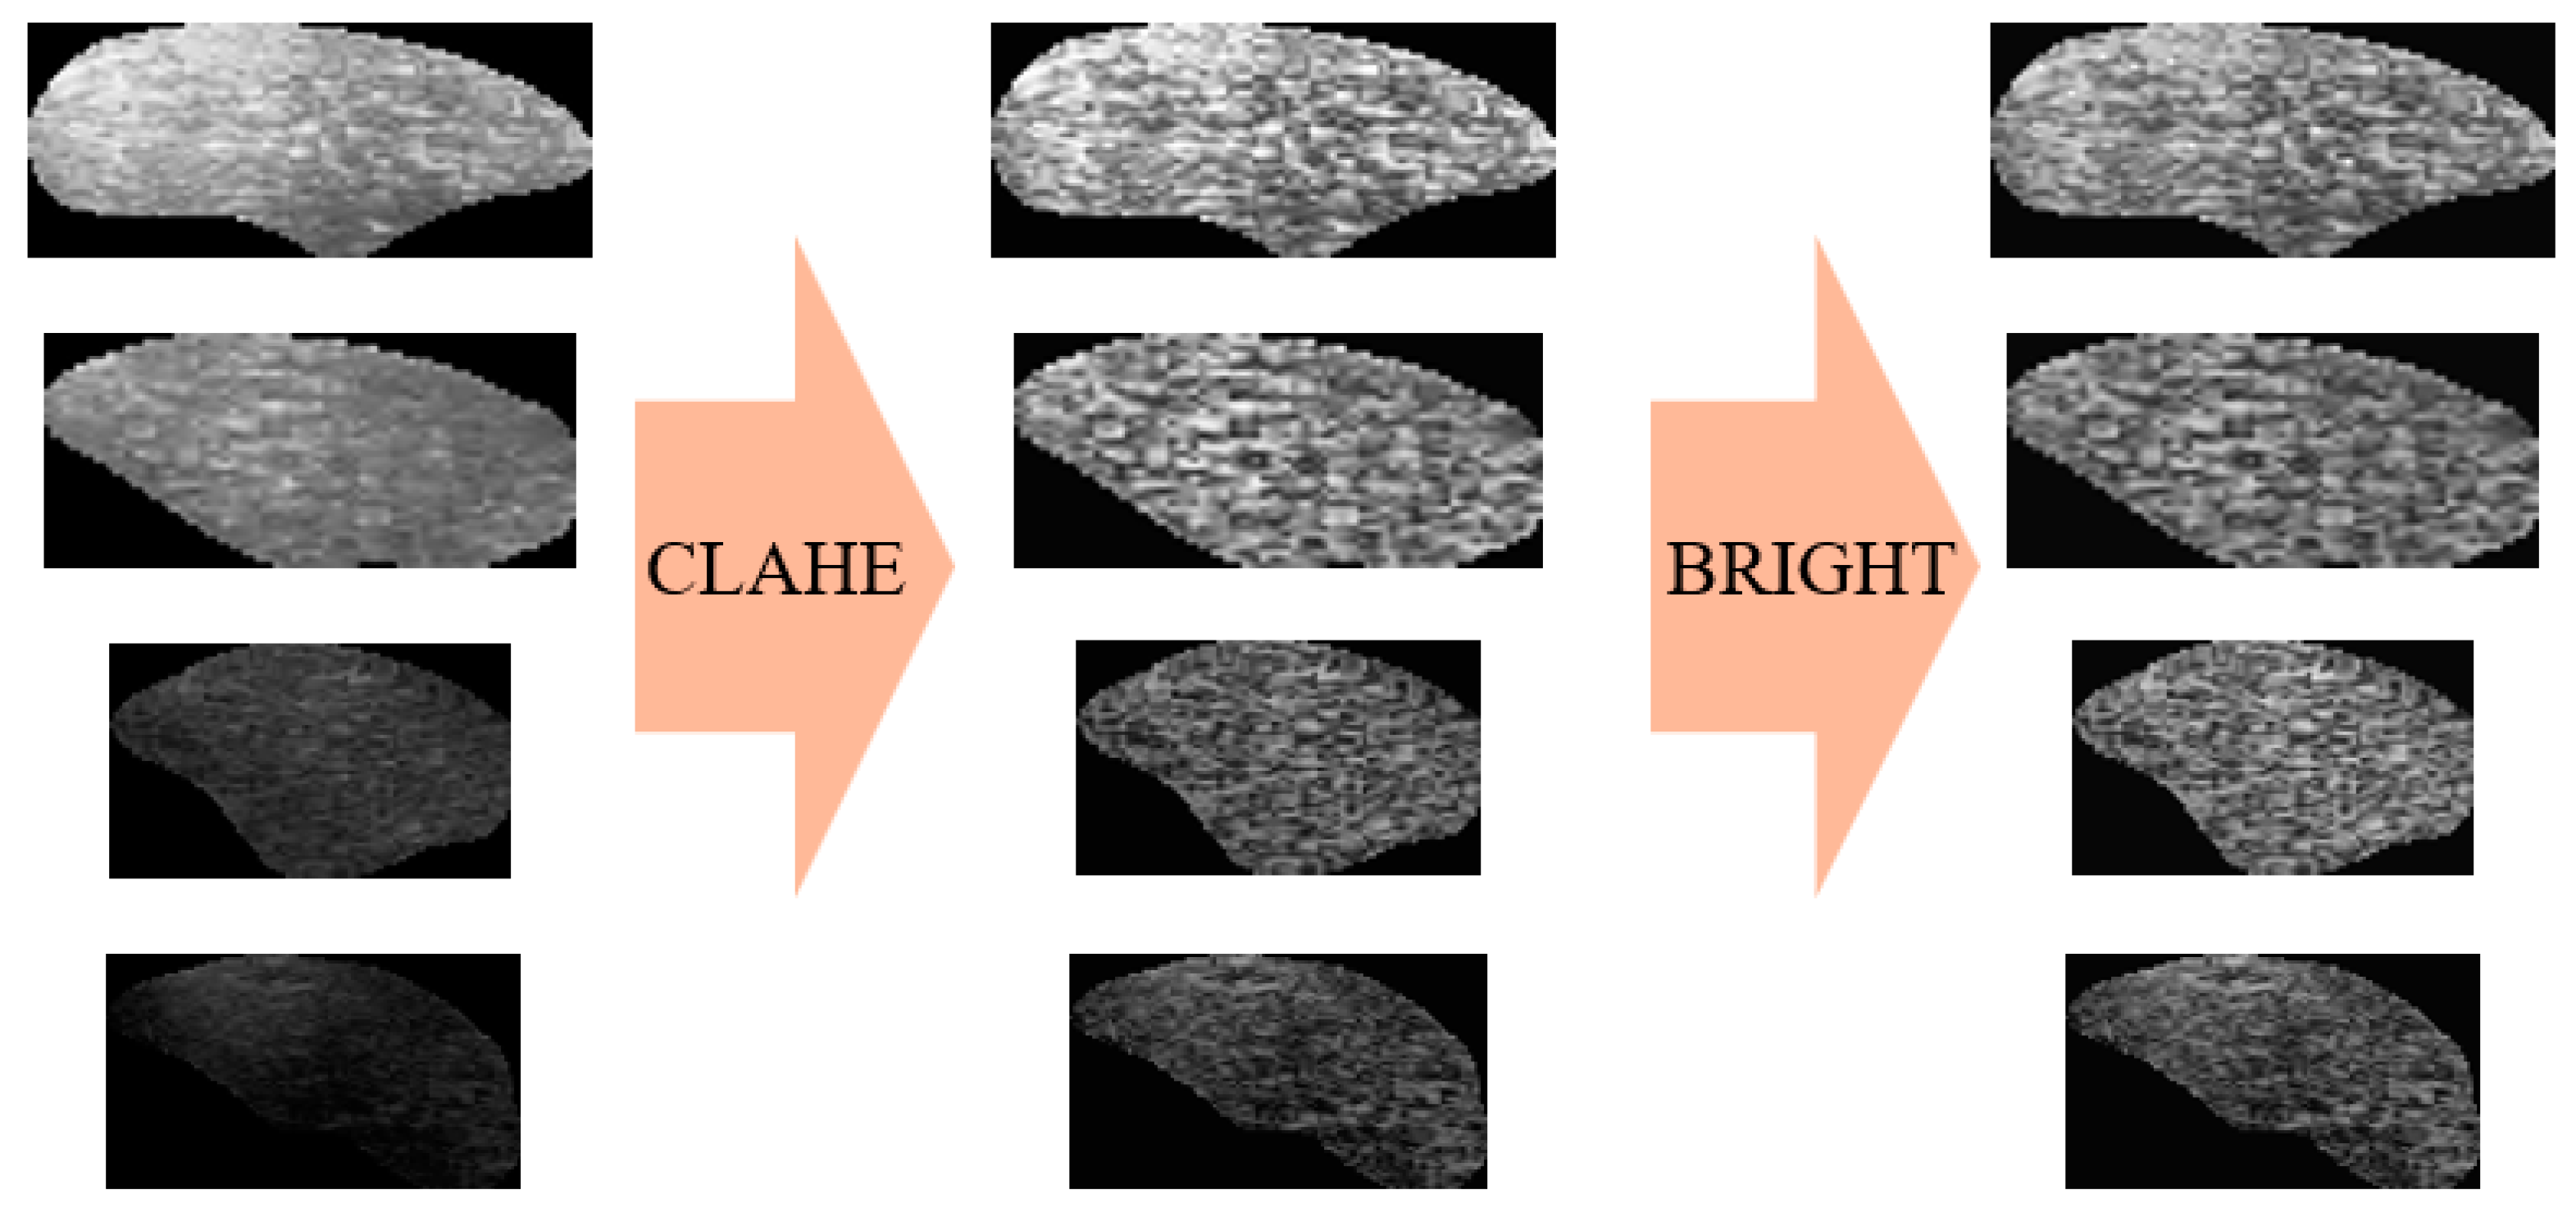
After obtaining the ROI images using the UNetPlus image segmentation model, further processing is required to input them to a multimodal prediction network, as shown in
Figure 4. Image segmentation may result in black borders around the ROI images, so we used OpenCV to identify the ROI boundaries based on pixel points and then crop them.
Subsequently, to highlight features such as adipose tissue and enable better feature extraction by deep learning networks, we employed contrast-limited adaptive histogram equalization (CLAHE) [
23] for adaptive contrast adjustment. This method not only helps to reduce image defects caused by segmentation but also enhances image contrast and makes details more readily visible, thus optimizing the input data for deep learning tasks.
However, the CLAHE method is only applicable to individual images. Because our experimental dataset contains images of varying brightness, we calculated the average brightness of the image pixels and normalized the brightness of all images using this value. This allowed us to mitigate instances where image brightness is excessively high or low, thus preventing significant model training errors caused by image brightness.
The original dataset contains ultrasound images, ear tag numbers, body weight, backfat thickness, loin muscle area, and IMF content for 130 pigs. Preliminary analysis showed that only seven pigs had an IMF content greater than 8%, with IMF contents varying significantly over a range from 12% to 18%. In practice, pigs with a high IMF content are relatively easy to identify. Accordingly, to ensure the effectiveness of the multimodal network’s learning process, we manually removed the data for seven pigs (including one lacking backfat thickness and loin muscle area data), leaving data for 124 pigs.
We also applied data augmentation techniques such as translation, rotation, and flipping to the image data to enhance the learning effect of the multimodal network. Subsequently, we matched the augmented images with the textual data for backfat thickness, loin muscle area, and IMF content using the pigs’ ear tag numbers. To prevent overfitting in this process, we added random noise of 1 × 10⁻⁷ units to the backfat thickness and loin muscle area with the IMF content as the label. This yielded 1552 data entries, which we divided dataset in an 8:1:1 ratio to create a training set of 1241 entries, a validation set containing 155 entries, and a test set containing 156 entries.
2.2.4. Feature Fusion
We designed a feature fusion mechanism for the data loading phase to effectively integrate image and textual information, providing the model with richer and more comprehensive inputs. First, the image data were read, resized to a resolution of 256 × 256, normalized, and converted into a tensor. Next, the textual data were read. In the dataset used for this experiment, the textual data include values for backfat thickness and loin muscle area, so they were converted into a two-channel tensor. We expanded this textual data tensor by adding dimensions to match the size of the image data. Finally, we concatenated the image data tensor and the textual data tensor along the channel dimension to obtain a fused multi-channel data tensor.
2.2.5. Multimodal Network Structure
ShuffleNetV2, proposed by Ma [
24], is a lightweight convolutional neural network that employs depth-wise separable convolutions and channel shuffling operations. This enables more efficient feature extraction while maintaining high computational efficiency and a low parameter count, making it suitable for deployment in resource-constrained environments. ShuffleNetV2 was established to include a Channel Split operation, dividing the input channels into two branches. One branch undergoes three convolutions, while the other remains as an identity mapping component to reduce computational load. Additionally, to avoid the increased memory access cost associated with excessive use of group convolutions, pointwise convolutions are no longer grouped. In the branch fusion process, Concat is used instead of Add, followed by channel shuffling to ensure information exchange between branches without sacrificing model performance (
Figure 2, right panel).
In this experiment, we improved the ShuffleNetV2 network by first modifying the number of input channels in the first layer to five, accommodating the multimodal dataset. Next, we replaced the final layer of the model with a linear layer to suit regression tasks. Lastly, we added an efficient multi-scale attention (EMA) mechanism after the network’s first convolutional layer to enhance the model’s feature extraction capability (
Figure 2, bottom middle panel).
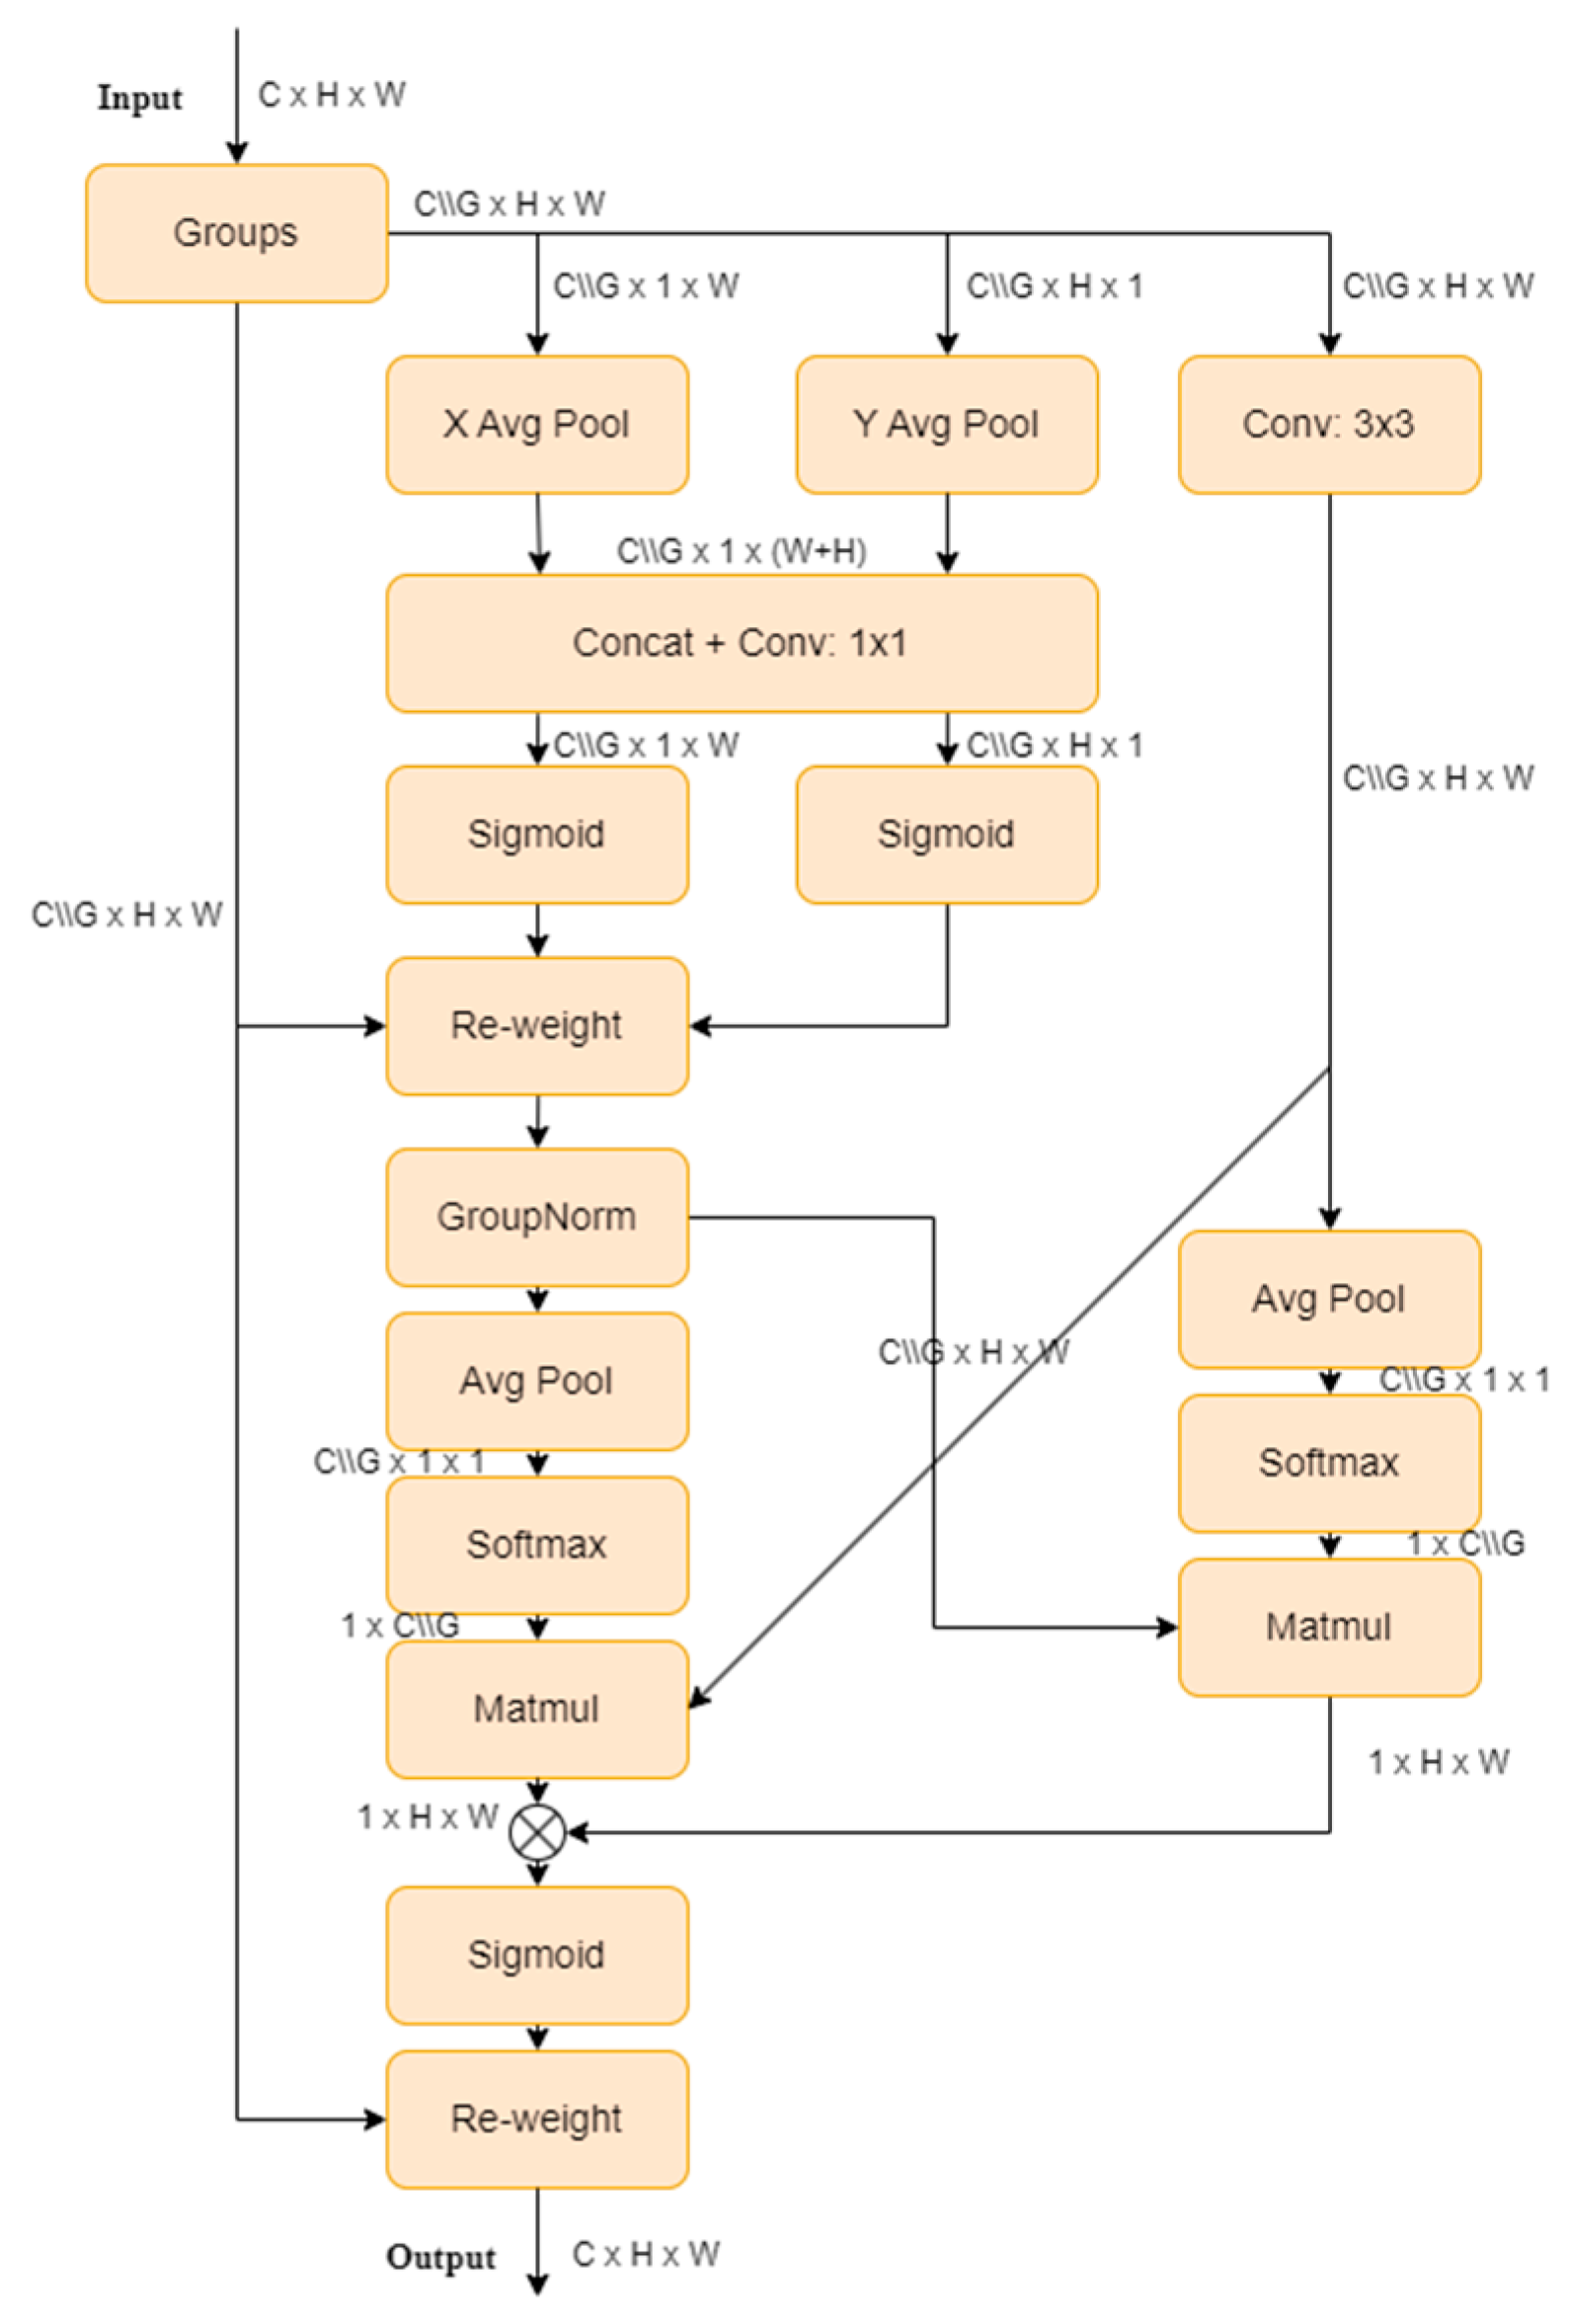
The EMA, proposed by Ouyang [
25], is a novel cross-spatial learning method that designs a multi-scale parallel sub-network to establish short-term and long-term dependencies. It also reshapes a portion of the channel dimensions into batch dimensions to preserve dimensionality through general convolutions, and integrates the output feature maps of the two parallel sub-networks using cross-spatial learning methods. This approach, combining multi-scale parallel sub-networks and attention mechanisms, extracts rich semantic information without making the model burdensome, thereby improving the performance and generalization ability. The EMA structure is illustrated in
Figure 5.
2.3. Environmental Configuration
We conducted experiments on the following hardware and software platforms: two Intel(R) Xeon(R) CPU E5-2690 v4 @2.60 GHz, two NVIDIA RTX A5000 (24 GB VRAM) with NVLink, and 80 GB RAM. The code was written in Python 3.10.11 and Pytorch 2.0.1, with the software environment set to Cuda 12.1. The specific model hyperparameters are described in
Table 1.
2.4. Experiment Setting
In this study, we validated the performance of the UNetPlus image segmentation network and the BL-IMF-MNet. First, we demonstrated the superiority of UNetPlus in ROI segmentation by conducting comparative experiments with the UNet, PSPNet [
26], FCN [
27], and HRNet [
28] image segmentation networks.
Secondly, after obtaining and processing the ROI images, we designed three groups of comparative experiments involving textual data, image data, and multimodal data. Our objective was to verify the feasibility and robustness of the proposed multimodal network over single-modality networks while validating the improvements to the network through ablation experiments.
Our stepwise process can be summarized as follows:
(1) We utilized ROI images to extract 15 parameters from the gray-level co-occurrence matrix (GLCM) [
29,
30], a method widely employed in texture analysis to quantify spatial relationships between pixel intensities. Previous studies have demonstrated the effectiveness of this method by using features extracted from GLCM in regression analyses to validate correlations with intramuscular fat content [
13,
28]. By integrating these texture features with backfat thickness, loin muscle area, and body weight values, we formed a total of 18 parameters. In this study, we aimed to replicate these successful experiments and compare their results with our proposed method to validate the improvements of our approach. Subsequently, we conducted comparative experiments on this feature set using linear regression analysis, as well as KNN [
31], SVR [
32], BP neural networks [
33], 1D convolutional CNN, and 1D convolutional TCN [
34].
(2) We used AlexNet [
35], VGG16 [
36], ResNet [
37], MobileNet [
38], and ShuffleNetV2 as backbone networks for regression analysis to compare the network performance of single image modalities.
(3) We compared the improved multimodal model with other multimodal feature extraction networks, namely AlexNet, VGG16, ResNet, MobileNet, and ShuffleNetV2.
(4) We validated the enhanced performance of the proposed network through ablation experiments.
2.5. Performance Evaluation
We developed an innovative method in this study for predicting IMF content using the entire loin muscle area. We proposed a two-stage model. The first stage uses the UNetPlus image segmentation network to segment the ROI area, and the second stage uses a multimodal regression network for IMF content prediction. We used a series of evaluation metrics to assess model performance, including the mean Intersection over Union (mIoU) [
39], mean Pixel Accuracy (mPA) [
40], and accuracy (ACC) for the image segmentation network, as well as the coefficient of determination (R
2) [
41], mean squared error (MSE), root mean squared error (RMSE) [
42], Spearman’s rank correlation coefficient (
) [
43], and Pearson correlation coefficient (
) [
44] for the IMF content regression network.
The three formulas above represent the evaluation metrics required for the segmentation model;
denotes the true positive count for
th category,
denotes the false positive count for the
th category,
denotes the false negative count for the
th category,
represents the number of categories,
represents the true positive count,
represents the true negative count,
represents the false positive count, and
represents the false negative count.
The above five formulas are the evaluation metrics we used for both unimodal and multimodal scenarios, where represents the observed value, represents the predicted value, represents the mean of the observed values, and represent the observed values of two sets of data, respectively, represents the mean value of the data, represents the sorted difference between the two sets of data, and represents the number of data points.
3. Results
3.1. Segmentation Performance of UNetPlus
The results of our experimental comparison of five segmentation network models are summarized in
Table 2. UNetPlus outperformed the other models in terms of mIoU (94.17), ACC (98.89), and model size (35 MB). PSPNet ranked second in mIoU at 94.13, followed by UNet (93.15), FCN (92.83), and HRNet (92.62). UNetPlus had an average ACC up to 0.162 higher than the other models with a total model size as much as 2.5–143 MB smaller than the others. However, UNetPlus had an mPA that was 0.46 percentage points lower than PSPNet. This is because PSPNet uses a deep decoder and ASPP module, with a deeper decoder than UNetPlus, which captures multi-scale features; this enhances the model’s perceptual and generalization capabilities, thereby improving its performance.
3.2. Comparison of Unimodal Networks
Previous research has demonstrated that linear regression and KNN machine learning methods are effective in predicting IMF content. In this experiment, we compared linear regression, KNN, a BP neural network, and a one-dimensional convolutional network methods, incorporating both text-only and image-only modalities, to validate their effectiveness when using the entire loin muscle area, as shown in
Table 3.
We extracted 15 parameters from the gray-level co-occurrence matrix of the ROI area, combined with backfat thickness, longissimus dorsi muscle area, and body weight as independent variables, plus the IMF content as the dependent variable. The linear regression method was operated in IBM SPSS Statistics 25 with stepwise regression. The final retained parameters were backfat thickness, gray variance, correlation, loin muscle area, large gradient prominence, inertia, gradient entropy, gradient distribution unevenness, gray mean, and gradient mean. Using all retained independent variables as inputs, the R2 value obtained was 0.567.
We further compared KNN and BP neural network models to find that they were less effective than the one-dimensional convolutional neural network, which achieved an R2 value of 0.8367, while those of KNN and BP were 0.6351 and 0.4442, respectively. Our multimodal network model outperformed the others in terms of R2 value and overall prediction effectiveness, marking an 11% improvement over the one-dimensional convolutional neural network.
We compared several commonly used network models in experiments involving convolutional network regression with image-only unimodal data. ShuffleNetV2 performed the best on all metrics, with an R2 value of 0.9189. Next were ResNet18 and MobileNet, with R2 values of 0.8508 and 0.8411, respectively. In contrast, AlexNet and VGG16 performed the worst, including negative R2 values, indicating a poor fit for this task. The Spearman’s and Pearson correlation coefficients of ShuffleNetV2 were 0.9504 and 0.9613, respectively, indicating a high correlation between predictions and actual values. ResNet18 and MobileNet also had high correlation coefficients, both exceeding 0.8950.
3.3. Comparison of Multimodal Networks
To assess the superiority of the proposed BL-IMF-MNet, we compared it with AlexNet, VGG16, ResNet18, ResNet101, MobileNet, and ShuffleNetV2, as shown in
Table 4. Our proposed network achieved the best performance in terms of R
2, MSE, RMSE, Spearman’s and Pearson coefficients, and model size. For example, BL-IMF-MNet had the highest R
2 at 0.950, followed by ShuffleNetV2 (0.927), ResNet18 (0.885), MobileNet (0.871), and ResNet101 (0.804). AlexNet and VGG performed the worst, with negative R
2 values, indicating they are not suitable for this task; other metrics were not calculated.
BL-IMF-MNet also showed excellent performance in MSE and RMSE, at 0.004 and 0.062, respectively. ResNet18 and ResNet101 performed poorly, with respective values of 0.708, 0.501, 0.926, and 0.857. Our network also achieved the best results concerning its Spearman’s and Pearson correlation coefficients of 0.976 and 0.968, respectively, surpassing other models by 0.011–0.074 and 0.013–0.082. ResNet101 exhibited the worst performance, with values of 0.904 and 0.886, while the original ShuffleNetV2 network were second best at 0.965 and 0.955.
Compared with VGG16, the size of our proposed model was reduced by 507.04 MB, followed by AlexNet at a reduction of 212.04 MB, ResNet101 (157.04 MB), ResNet18 (37.74 MB), and MobileNet (3.76 MB). The proposed network’s inclusion of the EMA mechanism module increased the model size increased by only 0.01 MB compared to ShuffleNetV2, reaching 4.96 MB.
3.4. Ablation Experiment
We verified the effectiveness of the proposed multimodal network through ablation experiments that included three different models: E0, which uses the ShuffleNetV2 architecture for training on image unimodal data; E1, which adds two textual data points (backfat thickness and
longissimus dorsi muscle area) to form a multimodal network; and EP, which further introduces the EMA mechanism on top of E1, as shown in
Table 5.
Training on image unimodal data using the ShuffleNetV2 architecture (E0) yields an R2 value of 0.9189, indicating a high degree of fit for the image unimodal data. The Spearman’s and Pearson correlation coefficients were 0.9504 and 0.9613, respectively, indicating a high correlation between the predicted and actual values. Adding backfat thickness and longissimus dorsi muscle area textual data to form a multimodal network (E1) increased the R2 value to 0.9273, indicating that the multimodal network is more effective than the unimodal network. Both the RMSE and MSE decreased, while Spearman’s and Pearson correlation coefficients increased to 0.9551 and 0.9646, respectively, further validating the effectiveness of the multimodal network.
Introducing the EMA mechanism to form the final multimodal network (EP) improved the R2 value to 0.9503, demonstrating substantial performance enhancement. The RMSE decreased to 0.0622, MSE decreased to 0.0039, and Spearman’s and Pearson correlation coefficients reached 0.9683 and 0.9756, respectively, indicating an improvement in predictive performance.
As the three models improved from E0 to EP, the R2 values increased by 3.15% from 0.9189 to 0.9503, indicating that adding textual information and the EMA mechanism enhanced the predictive performance of the model. Specifically, the multimodal network combining image and textual data (E1) outperformed the unimodal network (E0), while the final multimodal network with the EMA mechanism (EP) achieved the best performance. Thus, the proposed multimodal network outperforms traditional unimodal methods on IMF content prediction tasks, particularly after incorporating the attention mechanism. These results validate the effectiveness of multimodal information fusion with the attention mechanism in terms of enhanced prediction accuracy.
4. Discussion
This paper proposes a two-stage deep learning network model, BL-IMF-MNet, for predicting IMF content using images of the longissimus dorsi muscle region and two parameters, backfat thickness and longissimus dorsi muscle area. Notably, we introduce a novel approach based on the use of whole longissimus dorsi muscle region images and a multimodal model for IMF content prediction.
In the first stage, the UNetPlus network is employed to perform image segmentation of the longissimus dorsi muscle region, generating high-precision images of this region. In the second stage, an improved multimodal network is employed for IMF content prediction, leveraging multimodal data encompassing the segmented images from the first stage as well as numerical backfat thickness and longissimus dorsi muscle area data. The use of the UNetPlus network ensures the accuracy and precision of image segmentation; the improved multimodal network utilizes ShuffleNetV2 as the backbone network for feature extraction, benefiting from its efficiency and accuracy. This approach offers advantages compared to other models.
We conducted two preprocessing steps on the dataset used to test the proposed method. Prior to image segmentation, irrelevant regions were removed from the original images, and black pixels annotated by the original ultrasound machine were eliminated. Before generating the multimodal data, we applied CLAHE to enhance the details of the segmented longissimus dorsi muscle region images, thereby optimizing the images for subsequent steps.
Using the UNetPlus image segmentation network, our model achieved an mIoU of 94.17% and mPA of 96.92%, indicating strong segmentation performance. Furthermore, the proposed multimodal regression network, BL-IMF-MNet, reached an R2 value of 0.9503, with Spearman and Pearson correlation coefficients of 0.9683 and 0.9756, respectively, demonstrating its effectiveness in predicting intramuscular fat (IMF) content. These results indicate that our method performs exceptionally well in both segmentation and prediction tasks.
Currently, our team is investigating additional segmentation and calculation methods for backfat thickness and longissimus dorsi muscle area based on ultrasound images. The aim is to replace manual annotation with automatic calculation of backfat thickness and longissimus dorsi muscle area values, providing optimal data for inputting to multimodal networks. We anticipate that this technology will enable rapid, non-destructive, and accurate detection of pig backfat thickness, longissimus dorsi muscle area, and IMF content, thus forming a convenient one-click detection system.
In the future, we will continue to increase the dataset size to further improve the training effectiveness and generalization ability of our model. Additionally, we will continue to refine our algorithms and techniques to contribute to advancements in this field.
5. Conclusions
This paper presents a two-stage multimodal approach for predicting the IMF content in live pigs by segmenting whole longissimus dorsi muscle region images and combining numerical values of backfat thickness and longissimus dorsi muscle area to form multimodal data. The proposed method exhibits advantages over existing methods in terms of the model’s accuracy, predictive performance, and size. However, despite achieving satisfactory results, further research is needed to develop automatic calculation methods for backfat thickness and the longissimus dorsi muscle area for non-destructive, rapid, and one-click prediction of backfat thickness, longissimus dorsi muscle area, and IMF content.
The results of this study may provide important support for advanced animal medical imaging processing and offer valuable insights for future related research endeavors.
Author Contributions
W.L.: Conceptualization, Methodology, Software, Writing—Original Draft; T.L.: Writing—Review and Editing, Project administration, Funding acquisition; J.Z.: Data Curation; F.W.: Resources, Supervision. All authors have read and agreed to the published version of the manuscript.
Funding
This research was funded by the Tianjin Key R&D Plan Science and Technology Support Project [grant number 20YFZCSN00220], the Tianjin Graduate Student Research Innovation Project [grant number 2022SKYZ259] and the Tianjin Municipal Central Guide Local Science and Technology Development Fund [grant number 24ZYCGSN00280].
Institutional Review Board Statement
Not applicable.
Data Availability Statement
The data used in this study are copyrighted and cannot be publicly disclosed.
Acknowledgments
We would like to thank Jianxun Zhang and his team for providing us with the dataset for this study.
Conflicts of Interest
We declare that we have no financial or personal relationships with other people or organizations that could inappropriately influence our work, and there is no professional or other personal interest of any nature or kind in any product, service and/or company that could be construed as influencing the position presented in, or the review of, the manuscript entitled.
References
- Wood, J.D.; Enser, M.; Fisher, A.V.; Nute, G.R.; Richardson, R.I.; Sheard, P.R. Manipulating meat quality and composition. Proc. Nutr. Soc. 1999, 58, 363–370. [Google Scholar] [CrossRef] [PubMed]
- Wang, W.; Bai, T.; Han, Q.; Ning, X.; He, J.; Shi, X.; Hu, J. Study on the Factors Affecting Pork Quality. J. Anim. Sci. Vet. Med. 2018, 37, 44–45. [Google Scholar]
- Lyu, Y.; He, C.; Lan, L. Research Advances on the Relationship Between Intramuscular Fat andMeat Quality and Influence Factor of Intramuscular Fat in Pigs. China Anim. Husb. Velerinary Med. 2020, 47, 554–563. [Google Scholar] [CrossRef]
- Daszkiewicz, T.; Bąk, T.; Denaburski, J. Quality of pork with a different intramuscular fat (IMF) content. Pol. J. Food Nutr. Sci. 2005, 55, 31–36. [Google Scholar]
- Fernandez, X.; Monin, G.; Talmant, A.; Mourot, J.; Lebret, B. Influence of intramuscular fat content on the quality of pig meat —2. Consumer acceptability of m. longissimus lumborum. Meat Sci. 1999, 53, 67–72. [Google Scholar] [CrossRef]
- Hamill, R.M.; McBryan, J.; McGee, C.; Mullen, A.M.; Sweeney, T.; Talbot, A.; Cairns, M.T.; Davey, G.C. Functional analysis of muscle gene expression profiles associated with tenderness and intramuscular fat content in pork. Meat Sci. 2012, 92, 440–450. [Google Scholar] [CrossRef]
- Fan, Y.; Liao, Y.; Cheng, F. Predicting of intramuscular fat content in pork using near infrared spectroscopy and multivariate analysis. Int. J. Food Prop. 2018, 21, 1180–1189. [Google Scholar] [CrossRef]
- Fowler, S.M.; Wheeler, D.; Morris, S.; Mortimer, S.I.; Hopkins, D.L. Partial least squares and machine learning for the prediction of intramuscular fat content of lamb loin. Meat Sci. 2021, 177, 108505. [Google Scholar] [CrossRef]
- Huang, H.; Liu, L.; Ngadi, M.O. Assessment of intramuscular fat content of pork using NIR hyperspectral images of rib end. J. Food Eng. 2017, 193, 29–41. [Google Scholar] [CrossRef]
- Kucha, C.T.; Liu, L.; Ngadi, M.; Gariépy, C. Assessment of Intramuscular Fat Quality in Pork Using Hyperspectral Imaging. Food Eng. Rev. 2020, 13, 16. [Google Scholar] [CrossRef]
- Liu, L.; Ngadi, M. Predicting intramuscular fat content of pork using hyperspectral imaging. J. Food Eng. 2014, 134, 16–23. [Google Scholar] [CrossRef]
- Wu, J.; Peng, Y.; Li, Y.; Wang, W.; Chen, J.; Dhakal, S. Prediction of beef quality attributes using VIS/NIR hyperspectral scattering imaging technique. J. Food Eng. 2012, 109, 267–273. [Google Scholar] [CrossRef]
- Xing, L.; Zhang, H.J.; Wu, H.W.; Lu, X.L. Correlation Analysis of Intramuscular Fat Content and Important Growth Traits in Duroc Boars. Swine Prod. 2021, 03, 50–52. [Google Scholar] [CrossRef]
- Ren, Y.F.; Gao, S.C.; Zhao, X.Y.; Wang, Y.P.; Li, Q.X.; Zhang, C.S.; Wang, J.Y. Correlation Analysis among Carcass Weight, Backfat Thickness and Intramuscular Fat Content in Laiwu Pigs. Shandong Agric. Sci. 2021, 53, 109–115. [Google Scholar] [CrossRef]
- Ma, X.; Cheng, D.; Wang, L.; Liu, X.; Song, X.; Liang, J.; Zhang, L.; Yan, H.; Wang, L.; Chen, L.; et al. Prediction of Intramuscular Fat Percentage in Live Betjing Black Pig UsingReatime Ultrasound Image. Acta Vet. Et Zootech. Sin. 2012, 43, 1511–1518. [Google Scholar]
- Zhang, J.; Zhang, M.; Zeng, Q.; Zhang, H. Prediction of intramuscular fat in live swine using real-time ultrasound. Guangdong Agric. Sci. 2012, 39, 128–131. [Google Scholar] [CrossRef]
- Fabbri, G.; Gianesella, M.; Gallo, L.; Morgante, M.; Contiero, B.; Muraro, M.; Boso, M.; Fiore, E. Application of Ultrasound Images Texture Analysis for the Estimation of Intramuscular Fat Content in the Longissimus Thoracis Muscle of Beef Cattle after Slaughter: A Methodological Study. Animals 2021, 11, 1117. [Google Scholar] [CrossRef]
- Chen, H.; Zhang, J.; Zhu, J.; Zheng, J. B-Ultrasonic Pig Fat Content DetectionBased on Deep Learning. J. Chongqing Univ. Technol. Nat. Sci. 2019, 33, 112–116. [Google Scholar]
- Zhao, X.; Pong, Y.; Li, Y. Mobile phone evaluation system for grading beef marbling based ondeep learning. Trans. Chin. Soc. Agric. Eng. 2020, 36, 250–256. [Google Scholar] [CrossRef]
- Liu, Z.; Du, H.; Lao, F.D.; Shen, Z.C.; Lv, Y.H.; Zhou, L.; Jiang, L.; Liu, J.F. PIMFP: An accurate tool for the prediction of intramuscular fat percentage in live pigs using ultrasound images based on deep learning. Comput. Electron. Agric. 2024, 217, 108552. [Google Scholar] [CrossRef]
- Zhou, Z.; Siddiquee, M.M.R.; Tajbakhsh, N.; Liang, J. UNet++: Redesigning Skip Connections to Exploit Multiscale Features in Image Segmentation. IEEE Trans. Med. Imaging 2019, 39, 1856–1867. [Google Scholar] [CrossRef] [PubMed]
- Ronneberger, O.; Fischer, P.; Brox, T. U-Net: Convolutional Networks for Biomedical Image Segmentation. In Proceedings of the Medical Image Computing and Computer-Assisted Intervention–MICCAI 2015: 18th International Conference, Munich, Germany, 5–9 October 2015; pp. 234–241. [Google Scholar]
- Zuiderveld, K. Contrast Limited Adaptive Histogram Equalization. In Graphics Gems; Heckbert, P.S., Ed.; Elsevier: Amsterdam, The Netherlands, 1994; pp. 474–485. [Google Scholar]
- Ma, N.; Zhang, X.; Zheng, H.-T.; Sun, J. ShuffleNet V2: Practical Guidelines for Efficient CNN Architecture Design. In Proceedings of the European Conference on Computer Vision (ECCV), Munich, Germany, 8–14 September 2018; pp. 116–131. [Google Scholar]
- Ouyang, D.; He, S.; Zhang, G.; Luo, M.; Guo, H.; Zhan, J.; Huang, Z. Efficient Multi-Scale Attention Module with Cross-Spatial Learning. In Proceedings of the ICASSP 2023–2023 IEEE International Conference on Acoustics, Speech and Signal Processing (ICASSP), Rhodes Island, Greece, 4–10 June 2023; pp. 1–5. [Google Scholar]
- Zhao, H.; Shi, J.; Qi, X.; Wang, X.; Jia, J. Pyramid Scene Parsing Network. In Proceedings of the IEEE Conference on Computer Vision and Pattern Recognition, Honolulu, HI, USA, 21–26 July 2017; pp. 2881–2890. [Google Scholar]
- Long, J.; Shelhamer, E.; Darrell, T. Fully convolutional networks for semantic segmentation. In Proceedings of the 2015 IEEE Conference on Computer Vision and Pattern Recognition (CVPR), Boston, MA, USA, 7–12 June 2015; p. 10. [Google Scholar]
- Sun, K.; Xiao, B.; Liu, D.; Wang, J. Deep High-Resolution Representation Learning for Human Pose Estimation. In Proceedings of the IEEE/CVF Conference on Computer Vision and Pattern Recognition, Long Beach, CA, USA, 15–20 June 2019; pp. 5693–5703. [Google Scholar]
- Sebastian, B.; Unnikrishnan, A.; Balakrishnan, K. Gray Level Co-Occurrence Matrices: Generalisation and Some New Features. arxiv 2012, arXiv:1205.4831. [Google Scholar]
- Zhang, X.; Zhang, Y.; Shang, Y.X.; Shi, K.Z.; Zhang, Y.J.; Wang, J.; Chen, Y. Ultrasonic nondestructive examination of intramuscular fat using ultrasonic for live Congjiang pig. Trans. Chin. Soc. Agric. Eng. 2018, 34, 187–191. [Google Scholar]
- Cover, T.; Hart, P. Nearest neighbor pattern classification. IEEE Trans Inf. Theory 1967, 13, 21–27. [Google Scholar] [CrossRef]
- Cortes, C.; Vapnik, V. Support-Vector Networks. Mach. Learn. 1995, 20, 273–297. [Google Scholar] [CrossRef]
- Rumelhart, D.E.; Hinton, G.E.; Williams, R.J. Learning representations by back-propagating errors. Nature 1986, 323, 533–536. [Google Scholar] [CrossRef]
- Bai, S.; Kolter, J.Z.; Koltun, V. An Empirical Evaluation of Generic Convolutional and Recurrent Networks for Sequence Modeling. arxiv 2018, arXiv:1803.01271. [Google Scholar]
- Krizhevsky, A.; Sutskever, I.; Hinton, G.E. ImageNet classification with deep convolutional neural networks. Commun. ACM 2017, 60, 84–90. [Google Scholar] [CrossRef]
- Simonyan, K.; Zisserman, A. Very Deep Convolutional Networks for Large-Scale Image Recognition. arxiv 2014, arXiv:1409.1556. [Google Scholar]
- He, K.; Zhang, X.; Ren, S.; Sun, J. Deep Residual Learning for Image Recognition. In Proceedings of the IEEE Conference on Computer Vision and Pattern Recognition, Boston, MA, USA, 7–12 June 2015; pp. 770–778. [Google Scholar]
- Howard, A.G.; Zhu, M.; Chen, B.; Kalenichenko, D.; Wang, W.; Weyand, T.; Andreetto, M.; Adam, H. MobileNets: Efficient Convolutional Neural Networks for Mobile Vision Applications. arxiv 2017, arXiv:1704.04861. [Google Scholar]
- Everingham, M.; Van Gool, L.; Williams, C.K.I.; Winn, J.; Zisserman, A. The Pascal Visual Object Classes (VOC) Challenge. Int. J. Comput. Vis. 2010, 88, 303–338. [Google Scholar] [CrossRef]
- Ahmed, I.; Zabit, U. Fast estimation of feedback parameters for a self-mixing interferometric displacement sensor. In Proceedings of the 2017 International Conference on Communication, Computing and Digital Systems (C-CODE), Islamabad, Pakistan, 8–9 March 2017; pp. 407–411. [Google Scholar]
- Gelman, A.; Goodrich, B.; Gabry, J.; Vehtari, A. R-squared for Bayesian Regression Models. Am. Stat. 2019, 73, 307–309. [Google Scholar] [CrossRef]
- Hyndman, R.J.; Koehler, A.B. Another look at measures of forecast accuracy. Int. J. Forecast. 2006, 22, 679–688. [Google Scholar] [CrossRef]
- Spearman, C. The Proof and Measurement of Association between Two Things. Am. J. Psychol. 1904, 15, 72. [Google Scholar] [CrossRef]
- Edwards, A.W.F. Galton, Karl Pearson and Modern Statistical Theory. In Sir Francis Galton, FRS; Keynes, M., Ed.; Palgrave Macmillan: London, UK, 1993; pp. 91–107. [Google Scholar]
| Disclaimer/Publisher’s Note: The statements, opinions and data contained in all publications are solely those of the individual author(s) and contributor(s) and not of MDPI and/or the editor(s). MDPI and/or the editor(s) disclaim responsibility for any injury to people or property resulting from any ideas, methods, instructions or products referred to in the content. |
© 2024 by the authors. Licensee MDPI, Basel, Switzerland. This article is an open access article distributed under the terms and conditions of the Creative Commons Attribution (CC BY) license (https://creativecommons.org/licenses/by/4.0/).


