Abstract
High-yielding dairy cows need diets that meet their energy demand and contain sufficient essential nutrients such as n-3 fatty acids (FAs). Conjugated linoleic acid (CLA) is able to relieve the energy metabolism, but common corn silage and concentrate-based diets contain insufficient amounts of essential fatty acids (EFA). Abomasal infusion was used in the current study to supplement cows from 9 weeks antepartum to 9 weeks postpartum with either coconut oil (CTRL, n = 8), EFA (n = 9), or conjugated linoleic acid (CLA, n = 9), or a combination of both (EFA + CLA, n = 10). The study focused on the effects of FAs on peripheral tissues, such as longissimus muscle (MLD) and adipose tissues, which were harvested after slaughter. Fatty acid composition, muscle fiber and fat cell morphology, muscle fiber type transition, and gene expression were analyzed. Supplemented FAs and their metabolites were increased (p < 0.05) in MLD and intermuscular fat (INTF) but not in subcutaneous fat (SCF). The intramuscular fat content and gene expression of ACACA and FASN were increased in CLA-supplemented cows (p < 0.05). Supplementation did not affect the muscle fiber size and fiber type composition. Supplemented CLA had more effects than EFA, improving the energy balance of cows accompanied with increased triglyceride formation and storage.
Keywords:
essential fatty acid; CLA; muscle; adipose tissue; muscle fiber type; lipid metabolism; gene expression; cow 1. Introduction
Regular diets with corn silage and concentrates have been developed to meet the energy demand of high-yielding dairy cows and to improve the growth efficiency of beef cattle. However, the diets cannot provide sufficient amounts of essential fatty acids (EFA), in particular n-3 fatty acids (FAs) [1,2], due to the lack of fresh grass, which is the main source of α-linolenic acid (ALA) [3,4]. Furthermore, ensiling reduces the content of FAs [5], and the silage-based diets are rapidly biohydrogenated in the rumen, and thus lower amounts of EFA are available for intestinal absorption. Essential fatty acids, linoleic acid (LA), and ALA are the main precursors for the formation of conjugated linoleic acid (CLA) [6,7]. Thus, EFA-deficient diets result in less CLA formation in the rumen and less CLA distribution in body tissues and milk. While exact requirements of EFA cannot be determined, a minimum intake of EFA and CLA is necessary to maintain body functions and the requirements of tissues, which may influence the body health and energy metabolism [8].
The derivatives of LA and ALA, generated by elongation and desaturation, possess higher bioactivities and have crucial physiological functions. For example, they bind to cell surface receptors that affect gene expression, maintain membrane integrity, or regulate molecular signals [8]. Arachidonic acid (ARA) and adrenic acid (ADA) derive from LA and belong to n-6 FAs, while eicosapentaenoic acid (EPA), docosapentaenoic acid (DPA), and docosahexaenoic acid (DHA) derive from ALA and belong to n-3 FAs [9]. It is well-established that ARA, as a precursor of prostaglandin-2, is pro-inflammatory, and EPA, as a precursor of prostaglandin-3, plays anti-inflammatory roles [10]. Prostaglandins bind nuclear receptors, such as peroxisome proliferator-activated receptors (PPARs), which are involved in lipid metabolism, adipogenesis, and FAs synthesis [11,12]. Furthermore, EPA and DHA serve as precursors for lipid mediators or are ligands for PPARs [13,14]. Conjugated linoleic acid theoretically comprises 56 isomers, of which cis-9,trans-11 CLA and trans-10,cis-12 CLA are the most abundant and have the highest bioactivities [15]. CLA has vital physiological functions in body energy partitioning, lipid metabolism, hormone secretion, and immune-inflammatory responses [16].
It is an important research field to investigate the effects of diets and nutritional components on cows’ body health, tissue structure, and metabolism during the transition from late pregnancy to early lactation. Fatty acids, as the main component of triglycerides, are esterified and stored in the form of lipids in adipocytes during conditions of nutrient surplus and can be mobilized for energy production during starvation or for phospholipid synthesis for the generation of membranes [17]. Potentially toxic lipids are stored in lipid droplets, helping to prevent lipotoxicity and oxidative stress [17]. Furthermore, FAs, as ligands of transcription factors or signaling molecules, are involved in lipid metabolism and muscle fiber regeneration and growth [18,19]. When FAs are supplemented in cow nutrition, they are transported via the bloodstream to cells and tissues in the body, causing alterations in their FA profiles, which can have far-reaching consequences from the cellular to the systemic level. Studies reported that supplemented trans-10,cis-12 CLA causes milk fat depression and potentially improves the energy balance in early lactating dairy cows [20]. Former studies of our group confirmed that supplementation with EFA and CLA influences the composition of milk and blood, and regulates the body fat mass, metabolism, and energy balance, as well as the antioxidative, immune, and hormone status of lactating dairy cows [21,22,23,24,25]. The effects of supplemented FAs on cow muscle and adipose tissue remain unclear. Thus, this study aimed at investigating the effects of FA supplementation on the muscle and adipose tissue structure, and lipid metabolism in cows during transition. The results provide more insights into the effects of FAs on skeletal muscle and adipose tissue and on the regulation of the lipid metabolism, and may support the decision about FA supplementation in cows during transition.
2. Materials and Methods
2.1. Animals
The animal experiment was described in detail by Vogel et al. [24] and was approved by the relevant Department for Animal Welfare Affairs of the State Mecklenburg—Western Pomerania, Germany (State Office for Agriculture, Food Safety and Fishery; LALLF M-V/TSD/7221.3-1-038/15). Forty pregnant Holstein cows (second lactation, ~18th week of gestation, body weight 662 ± 56 kg) were purchased from a local farm. The cows were kept in a freestall barn at the Research Institute for Farm Animal Biology (FBN), Dummerstorf, Germany and were surgically fitted with rumen cannulas [24]. They were abomasally supplemented twice daily from 63 d antepartum (ap) until slaughter on d 63 postpartum (pp) via the cannula with a total of either 76 g/d of coconut oil (Bio-Kokosöl #665, Kräuterhaus Sanct Bernhard KG, Bad Ditzenbach, Germany; CTRL), or 78 g/d of linseed oil (Derby Leinöl #4026921003087, Derby Spezialfutter GmbH, Münster, Germany) plus 4 g/d of safflower oil (Gefro Distelöl, Gefro Reformversand Frommlet KG, Memmingen, Germany; EFA), or 38 g/d of Lutalin (BASF SE, Ludwigshafen, Germany; CLA), or 120 g/d of the mixture of both (EFA + CLA). Each dose was halved during the dry period. The applied dose of supplements was determined in a former experiment described by Haubold et al. [22]. Cows were fed ad libitum with a corn silage-based total mixed ration and had free access to water and trace-mineralized salt blocks. The feeding conditions and an analysis of the feed composition were described by Vogel et al. [24]. Two cows were excluded from the analyses because of premature calving and a further two cows due to lost samples. Thus, the numbers of cows per group were n = 8 for CTRL, n = 9 for EFA and for CLA, and n = 10 for EFA + CLA.
2.2. Sampling
The cows were slaughtered on d 63 pp in the experimental slaughterhouse of the FBN as described [24] and samples of Musculus longissimus dorsi (MLD, around the 12th rib), intermuscular fat (INTF, at the MLD), and subcutaneous fat (SCF, above the MLD) were taken separately for histology and protein or RNA extraction and immediately frozen in liquid nitrogen. Additional slices of the MLD, about 3 cm thick, were sampled for the determination of nutrient composition and marbling. Muscle and adipose tissue samples for FA composition were stored at −20 °C until further processing.
2.3. Nutrient and Fatty Acid Composition
The fat, protein (net protein—without connective tissue—and total protein), ash, and water content of muscle samples was determined individually after the tissue was ground with near infrared spectroscopy, using an Infratec 1255 Food and Feed Analyzer (Foss, Hamburg, Germany). The fatty acid composition of MLD and adipose tissues was analyzed as described by Dannenberger et al. [26]. Briefly, the muscle and adipose tissue samples were homogenized, and the lipids were extracted using chloroform/methanol (2:1, v/v) and the Ultra Turrax T25 (IKA, Staufen, Germany) at room temperature (RT). The nonadecanoic acid (C19:0) was added as an internal standard. The detailed protocol was described by Kalbe et al. [27]. The FA was treated with 0.5 M sodium methoxide and 14% boron trifluoride in methanol to form fatty acid methyl esters (FAMEs), then the FAMEs were extracted by n-hexane for gas chromatography (GC) analysis. The FA composition of the tissue lipids was analyzed using capillary GC with a CP-Sil 88 CB column (100 m × 0.25 mm; Agilent, Santa Clara, CA, USA) that was installed in a CLARUS 680 gas chromatograph with a flame ionization detector and split injection (PerkinElmer Instruments, Shelton, CT, USA).
2.4. Histological Analysis
Muscle and adipose tissue samples were cut 12 µm and 30 µm thick, respectively, using a cryostat microtome (CM3050 S, Leica, Bensheim, Germany). The sections were stained with hematoxylin/eosin (H/E, hematoxylin: Dako, Glostrup, DK; eosin: Chroma Gesellschaft, Münster, Germany) to measure the muscle fiber characteristics and adipocyte size. Muscle serial sections were reacted for actomyosin Ca2+ adenosine triphosphatase (ATPase) stability after alkaline preincubation (pH 10.4) and then stained with azure II (Chroma-Gesellschaft, Köngen, Germany) for fiber typing as described by Wegner et al. [28]. Images were taken using an Olympus BX43 microscope (Olympus, Hamburg, Germany) equipped using a UC30 color camera, and were analyzed using CellSens image analysis software (CellSens Dimension 3.2, Evident, Hamburg, Germany). The muscle fiber size and number of nuclei per muscle fiber were measured in H/E stained slices and fiber types were determined in ATPase stained sections with a muscle fiber module developed for the CellSens software (Evident). For each individual muscle fiber, information on the size, nuclei number, and fiber type was recorded, and the number of muscle fibers per area unit as well as the percentage of each fiber type were calculated. At least 300 muscle fibers in three independent fields were analyzed per animal. Adipocyte size was measured using CellSens image analysis software using the polygon function of the interactive measurement module. At least 200 cells per animal were measured and size histograms were calculated.
2.5. Immunohistochemistry
Serial sections of MLD samples were used to detect slow and fast myosin heavy chain isoforms with immunohistochemistry. After fixation with 3% Glyoxal (Carl Roth, Karlsruhe, Germany) for 15 min, the slices were washed twice with PBS for 5 min, and were permeabilized using 0.1% Triton X-100 in PBS (PBST) for 10 min. Unspecific binding of the secondary antibodies was blocked with 10% normal goat serum for 15 min at RT. The slices were simultaneously incubated with antibodies against MYH1 (1:100, Abcam, Cambridge, UK) and MYH7 (1:100, Abcam) in PBST for 2 h at RT in a humidified chamber. The slices were washed three times with PBST for 10 min and were incubated with secondary antibodies Alexa Fluor 488 goat anti-rabbit IgG and Alexa Fluor 594 goat anti-mouse IgG (1:500, Thermo Fisher Scientific, Schwerte, Germany) for 45 min at RT in a dark chamber. The slides were washed three times and mounted with Roti Mount Fluor Care with Dapi (Thermo Fisher Scientific, Schwerte, Germany). Immunofluorescence was detected on a Nikon Microphot SA fluorescence microscope (Nikon, Düsseldorf, Germany) equipped using a DP74 camera (Evident, Hamburg, Germany) and CellSens image analysis software (Evident). The area of muscle fibers having slow myosin (MYH7, red fluorescence) or fast myosin (MYH1, green fluorescence) was measured and the number of muscle fibers expressing MYH1 and MYH7 simultaneously was counted as the number of transition or hybrid fibers.
2.6. Marbling of MLD
Marbling traits were assessed as described by Albrecht et al. [29] in formalin-fixed muscle slices, which were stained with Oil Red O (Chroma Gesellschaft, Münster, Germany). Images were taken using a digital camera (Coolpix 8700, Nikon, Düsseldorf, Germany), including a ruler for calibration, and analyzed with the Count and Measure function of CellSens image analysis software (Evident, Hamburg, Germany) using a self-made macro program. The muscle cross-sectional area as well as the number, size, and area percentage of marbling flecks were determined.
2.7. RNA Extraction and RT-qPCR
The total RNA of the MLD was isolated with QIAzol lysis reagent (Qiagen, Hilden, Germany) as described by the manufacturer, after homogenization of the tissue using the Xiril Dispomix (Xiril, Hombrechtikon, Switzerland). The NucleoSpin RNA extraction Kit (Macherey-Nagel, Dueren, Germany) was used to isolate and purify RNA according to the manufacturer’s guidelines. Adipose tissues were homogenized in QIAzol lysis reagent (Qiagen) with the Polytron PT 1200 E (Kinematica, Littau-Luzern, Switzerland). Total RNA was extracted with the RNeasy Lipid Tissue Mini Kit (Qiagen) according to the manufacturer’s instructions and quantified using a NanoDrop ND-1000 spectrophotometer (Peqlab, Erlangen, Germany). The RNA was reverse-transcribed into cDNA using an iScript cDNA synthesis kit (Bio-Rad, Munich, Germany) following the manufacturer’s instructions. The reaction conditions of cDNA synthesis were 25 °C for 5 s, 42 °C for 30 min, and 85 °C for 5 s. Specific primers were designed based on the NCBI website and were produced by Sigma-Aldrich (Deisenhofen, Germany). The details of the applied primers are provided in the Supplementary Table S1. Primers and products were checked with qualitative PCR and 3% agarose gel electrophoresis. The relative gene expression was determined using the Roche LightCycler® 96 (Roche, Basel, Switzerland). The reaction conditions included preincubation at 95 °C for 600 s, amplification for 40 cycles at 95 °C for 10 s, 60 °C for 10 s, 72 °C for 25 s, and melting curve generation at 95 °C for 10 s, 65 °C for 60 s, and 97 °C for 1 s. The relative gene expression was calculated using a model that was described by Hellemans et al. [30] with the expressions of UXT and PPIA as internal controls.
2.8. Protein Extraction and Western Blotting
The samples of MLD were homogenized with CelLytic MT Lysis Reagent and Protease Inhibitor Cocktail (Sigma-Aldrich, Munich, Germany) using the Xiril Dispomix (Xiril). The protein was extracted following the manufacturer’s instructions. The protein concentration was measured using the Nanodrop spectrophotometer (ND-1000, Peqlab, Erlangen, Germany) and was adjusted to 1 mg/mL. Two µg protein per sample was denatured at 95 °C for 5 min and separated on 4–15% Criterion TGX Stain-Free Precast gels (Bio-Rad) with 0.1% SDS (v/v) in 1× Towbin buffer (25 mM Tris, 192 mM Glycine in Aqua dest.) at 175 V for 45 min. The proteins were quantified using a Smart Protein Layers (SPL) Red Kit (NH DyeAGNOSTICS, Halle, Germany) following the manufacturer’s instructions. Proteins were transferred on a polyvinylidene difluoride (PVDF) membrane (Trans-Blot Turbo Midi High MW15 Transfer Kit, Bio-Rad). Primary antibodies (MYH1, MYH2, MYH7) were all purchased from antibodies-online (Aachen, Germany) and were incubated over night at 4 °C at 1:5000 dilution. Secondary antibodies were incubated for 90 min at room temperature (RT) and were TrueBlot Rabbit HRP (1:25,000) and Trueblot Mouse HRP (1:10,000; Rockland Immunochemicals, Limerick, PA, USA). The antibody label was detected using SuperSignal West Femto (Thermo Fisher Scientific, Schwerte, Germany). The fluorescence of the calibrators and total protein, and the chemiluminescence signal of the target proteins were recorded using the Chemocam HR-16 imager system (Intas, Göttingen, Germany) and quantified using LabImage software (LabImage 1D, ver. 4.2.1, Kapelan, Leipzig, Germany). Protein abundance was normalized to the total protein to account for loading variations between lanes.
2.9. Statistical Analysis
Data were analyzed using SAS statistical software (Version 9.4, SAS Inst., Cary, NC, USA). Relationships among traits were calculated using Pearson correlation coefficients using the CORR procedure in SAS. For the detection of significant influences of EFA or CLA supplementation, data were analyzed with ANOVA using the MIXED procedure with the fixed factors EFA and CLA as well as the interaction EFA × CLA. The experiment was performed in five blocks of eight cows. Therefore, it was first tested whether the block effect had a significant influence on the trait. The block effect was finally included as a random factor in the model, because it had no effect on most traits. The Tukey–Kramer-correction was used to control the family-wise error rate (referred to as p). Differences were considered significant if p ≤ 0.05. All data were presented as least squared means (LSM) and standard error (SE).
3. Results
3.1. Fatty Acid Profiles in MLD and Adipose Tissues
The FA composition of MLD, INTF, and SCF was analyzed to elucidate whether supplemented EFA and CLA were enriched in the tissues, changed the FA composition, and caused structural and/or metabolic changes. The CTRL cows, which received coconut oil, had the highest proportion of C12:0 (p < 0.01) in MLD (Figure 1, Table S2). Supplementation with EFA, either alone or in combination with CLA, increased the total n-3 PUFA proportion about 2.5-fold compared to the CTRL and CLA-supplemented cows in MLD (p < 0.001), whereas the total n-6 PUFA content remained unchanged (Table S2). In particular, the ALA proportion was about 3.8-fold higher (p < 0.001) and the EPA proportion was 1.6-fold higher (p = 0.036) in EFA-supplemented relative to non-supplemented cows. Supplementation with CLA, either alone or in combination with EFA, increased the proportion of CLA in muscle tissue about 1.8-fold (Figure 1, p < 0.001). The n-6/n-3 PUFA ratio decreased with EFA supplementation from 5.9 to 2.2 (p < 0.001). A slight increase of total saturated FAs (SFA) was measured in the MLD of CLA-supplemented cows (p = 0.026).
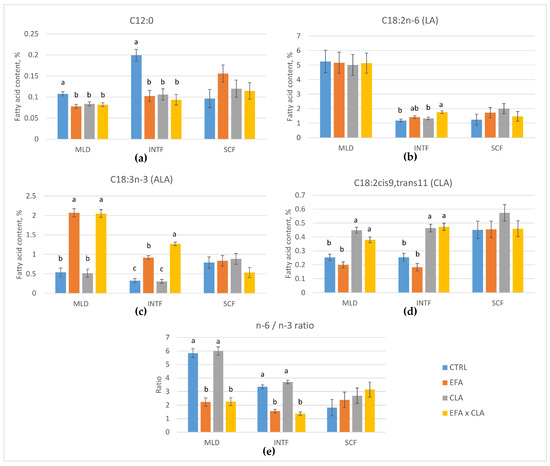
Figure 1.
Fatty acid composition and n-6/n-3 PUFA ratio of muscle tissue (MLD), intermuscular fat (INTF), and subcutaneous fat (SCF) of control cows (CTRL) and cows supplemented with essential fatty acids (EFA) or conjugated linoleic acid (CLA) or a combination of both (EFA + CLA). (a) Lauric acid C12:0; (b) linoleic acid C18:2n-6; (c) α-linolenic acid C18:3n-3; (d) conjugated linoleic acid C18:2cis9,trans11; (e) n-6/n-3 ratio. a–c superscript letters indicate significant differences among groups within a tissue (p < 0.05).
In INTF (Figure 1, Table S3), supplementation with EFA increased the total n-3 PUFA proportion 3.1-fold (p < 0.001) and the total n-6 PUFA proportion about 1.3-fold (p = 0.013) compared to non-supplemented cows. The ALA content was about 3.5-fold higher in EFA-supplemented cows (p < 0.001). EFA-supplemented cows had lower proportions of C12:0 and C14:0 SFA (p < 0.05) than non-supplemented cows, but the total SFA content was similar among groups (p > 0.05). Cows of the CTRL group had the highest proportion of C12:0 among groups (p < 0.001). Supplementation with CLA increased the proportion of CLA in INTF about 2.1-fold (p < 0.001) and reduced the total content of MUFA (p = 0.036). Cows supplemented with EFA and CLA had the highest proportion of n-3 and n-6 PUFA (p < 0.05), followed by EFA and the other two groups. The n-6/n-3 PUFA ratio decreased from 3.5 to 1.5 with EFA supplementation (p < 0.001).
In SCF (Figure 1, Table S4), however, no significant influence of supplementations on FA composition was observed (p > 0.05), except that there was a higher proportion of oleic acid (OA, C18:1cis9) in the EFA + CLA group than in the CLA group (p = 0.018). Overall, the EFA and CLA supplementation altered the FA composition similarly in MLD and INTF, but did not change the FA composition of SCF in the same way.
3.2. Nutrient Composition and Marbling of MLD
An analysis of the nutritional components of the muscle tissue revealed a slight influence of supplementation (Table 1). The proportions of net protein, total protein, ash, and water (Table 1) were all similar among the groups (p > 0.05). However, supplementation with CLA increased the fat content of MLD (Table 1) (p < 0.05) in concordance with the result of FAs analysis (Table S2).

Table 1.
Nutrient analysis of muscle tissue of control cows (CTRL) and cows supplemented with essential fatty acids (EFA) or conjugated linoleic acid (CLA) or a combination of both (EFA + CLA).
The visible intramuscular fat or marbling (Table 2) and the size profile of intramuscular adipocytes (Figure 2) were analyzed in addition to further elucidate the influence of EFA and CLA supplementation on fat deposition in MLD. Marbling traits showed a high individual variation in all groups, and thus no significant effect of supplementation was detected. While the muscle cross-sectional area (CSA) tended to be smaller in CLA-supplemented cows (p = 0.08), the number and mean size of marbling flecks were not different among groups (p > 0.1). Moreover, the total area of marbling flecks and fat area percentage did not differ among groups (p > 0.1), despite its close correlation with the IMF content (r = 0.85, p < 0.001). Considering the apparent number of fat cells in a muscle cross-section (Table 2), there was a trend to fewer fat cells in EFA-supplemented cows (p = 0.059).
Table 2.
Marbling characteristics of MLD of control cows (CTRL) and cows supplemented with essential fatty acids (EFA) or conjugated linoleic acid (CLA) or a combination of both (EFA + CLA).
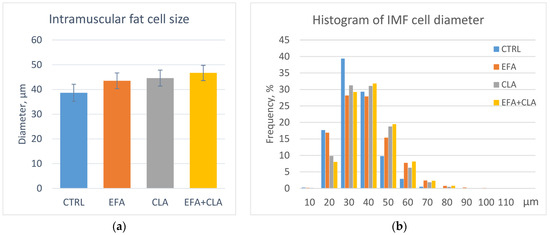
Figure 2.
Intramuscular fat cell size in the MLD of control cows (CTRL) and cows supplemented with essential fatty acids (EFA) or conjugated linoleic acid (CLA) or a combination of both (EFA + CLA). (a) Intramuscular fat cell diameter; (b) histogram of fat cell diameter.
The mean fat cell size within MLD (Figure 2a) was not different among the groups (p > 0.05). However, the histogram indicates more cells with smaller diameter in the CTRL cows (Figure 2b). Correlation analysis showed a weak negative correlation between the fat cell size and n-6 PUFA proportion (r = −0.44, p = 0.008 for LA; r = −0.48, p = 0.004 for Sum n-6 PUFA). The fat cell size was positively correlated with the SFA proportion, such as C14:0 (r = 0.48, p = 0.003) and C16:0 (r = 0.65, p < 0.001), and negatively correlated with C8:0, C20:0, C21:0, C22:0, C24:0, and C26:0 (r = −0.52, −0.68, −0.62, −0.45, −0.40, and −0.65, respectively, p < 0.02). Similar values were observed for correlations between fat area percentage and the same FAs.
3.3. Expression of Fat-Related Genes in MLD
Genes related to adipocyte differentiation, such as DLK1, PPARG, CEBPA, and SREBP1, were similarly expressed in all groups (p > 0.1) (Figure 3). However, the mRNA abundance of ZNF423 tended to be higher in the EFA-supplemented groups than in the non-EFA groups (p = 0.090). Furthermore, the expression of FABP4 tended to be higher in the CLA groups (p = 0.096). Lipolysis and lipogenesis-related genes, such as LPL, DGAT1, ACSS2, DAGLA, and PLIN1, showed no differences in mRNA abundance among the groups (p > 0.1), but ACSL1 gene expression tended to be higher in the CLA groups than in the non-CLA groups (p = 0.088). Moreover, the mRNA abundances of ACACA and FASN were greater in the CLA groups than in the non-CLA groups (p = 0.041 and 0.025, respectively).
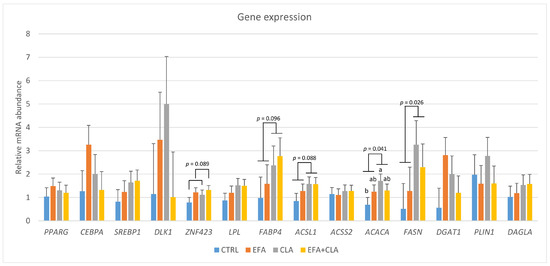
Figure 3.
Gene expression in the MLD of control cows (CTRL) and cows supplemented with essential fatty acids (EFA) or conjugated linoleic acid (CLA) or a combination of both (EFA + CLA). a,b Different letters indicate significant differences among groups (p < 0.05). p-values indicate differences between CLA and no-CLA supplementation.
3.4. Fat Cell Size and Gene Expression in INTF and SCF
Supplementation had no significant influence on the fat cell size of INTF and SCF (Figure 4). Fat cells of both depots had a similar size distributions and mean diameters in all groups (p > 0.1). However, correlation analysis showed a negative correlation between the fat cell size and CLA proportion in SCF (r = −0.36, p = 0.031). Positive or negative correlations were recorded between the fat cell size and proportion of different SFAs in INTF (r = 0.33, 0.38, 0.60 for C14:0, C15:0, and C16:0, respectively, p < 0.05; and r = −0.68, −0.79, −0.76, −0.38, −0.49, −0.37 for C18:0, C20:0, C22:0, C23:0, C24:0, and Sum of SFA, respectively, p < 0.025).
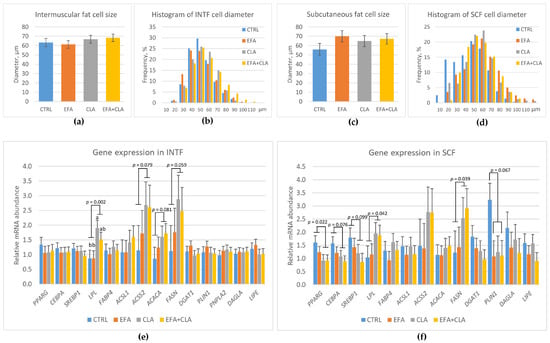
Figure 4.
Fat cell size and gene expression in the adipose tissues of control cows (CTRL) and cows supplemented with essential fatty acids (EFA) or conjugated linoleic acid (CLA) or a combination of both (EFA + CLA). (a) Fat cell diameter in intermuscular fat (INTF); (b) histogram of fat cell diameter in INTF; (c) fat cell diameter in subcutaneous fat (SCF); (d) histogram of fat cell diameter in SCF; (e) gene expression in INTF; (f) gene expression in SCF. a,b Different letters indicate significant differences among groups (p < 0.05). p-values indicate differences between CLA and no-CLA supplementation, except for PLIN1, where the p-value is between EFA and no-EFA supplementation.
Adipocyte differentiation-related genes were not differently expressed among groups in INTF (p > 0.1, Figure 4). However, in SCF, the expression of PPARG was decreased (p = 0.022) and the expression of CEBPA and SREBP1 tended to be lower (p = 0.079 and 0.099, respectively) with CLA supplementation (Figure 4). More LPL mRNA was measured in the INTF of CLA-supplemented cows (p < 0.05) and a trend toward more ACSS2, FASN, and ACACA mRNA (p < 0.1) with CLA supplementation was found (Figure 4). The supplementation with CLA increased LPL and FASN mRNA abundance in SCF (p < 0.05), whereas EFA tended to decrease PLIN1 expression (p = 0.067). The expression of other fat-related genes was not different among groups (p > 0.1).
3.5. Muscle Fiber Structure and Fiber Type Composition in MLD
Histological and immunohistochemical investigations were conducted to detect changes in muscle fiber structure and metabolism caused by FA supplementation. The muscle fiber size (Table 3) was not different among the groups (p > 0.1), but the apparent total muscle fiber number was smaller in CLA-supplemented cows (p = 0.011). There was a trend toward a lower area percentage of type I fibers with EFA supplementation (p = 0.075) (Figure 5). However, other muscle fiber traits were not different among groups and significant correlations were not detected between the FA composition and muscle fiber traits.
Table 3.
Muscle fiber traits of the MLD of control cows (CTRL) and cows supplemented with essential fatty acids (EFA) or conjugated linoleic acid (CLA) or a combination of both (EFA + CLA).
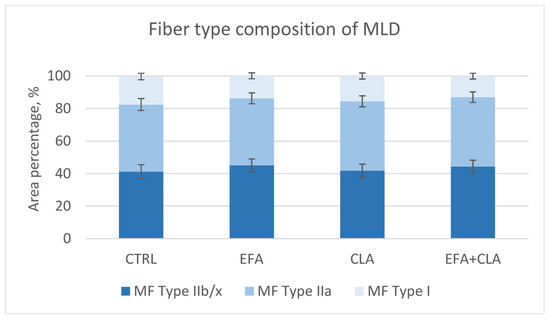
Figure 5.
Muscle fiber type composition in the longissimus muscle (MLD) of control cows (CTRL) and cows supplemented with essential fatty acids (EFA) or conjugated linoleic acid (CLA) or a combination of both (EFA + CLA).
3.6. Protein Abundance of Myosin Isoforms and Gene Expression in the MLD
The immunohistochemical detection of MYH1 and MYH7 was applied in cryosections of MLD to detect fast and slow myosin-expressing fibers and to identify fiber-type transitions indicated by the co-expression of both proteins. The comparison of histochemical staining with IHC staining indicated a high correlation and comparability between Type I or slow muscle fibers with MYH7 immunostaining (r = 0.88, p < 0.001) and intermediate (Type IIa) and fast (Type IIb/x) muscle fibers with MYH1 immunostaining (r = 0.82, p < 0.001; Figure 6a–c). Hybrid muscle fibers were positive for both MYH1 and MYH7. The number of hybrid fibers showed high individual variation and no clear trend toward an influence of supplementation. However, it was correlated with the DHA proportion in MLD (r = 0.55, p < 0.001).
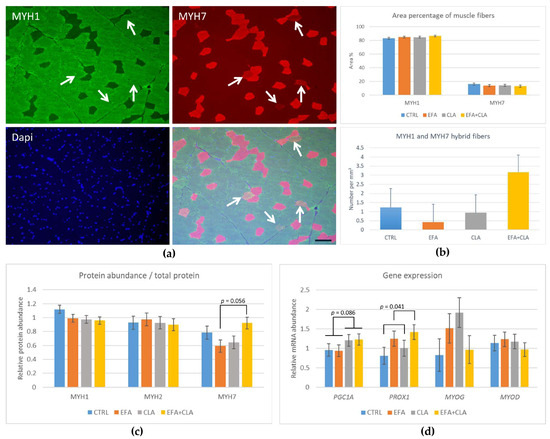
Figure 6.
Protein abundance of myosin isoforms and gene expression in MLD of control cows (CTRL) and cows supplemented with essential fatty acids (EFA) or conjugated linoleic acid (CLA) or a combination of both (EFA + CLA). (a) Immunohistochemical detection of MYH1 (green) and MYH7 (red); nuclei were conterstained with Dapi (blue), and the merged image. Arrows indicate hybrid muscle fibers, positive for MYH1 and MYH7. Scale bar represents 100 µm. (b) Quantification of MYH1 and MYH7 positive area in muscle cross-sections and the number of hybrid fibers. (c) Western blot quantification of MYH1, MYH2, and MYH7 protein abundance. (d) Gene expression of PGC1A, PROX1, MYOG, and MYOD. p-values indicate differences between CLA and no-CLA supplementation and between EFA and no-EFA supplementation.
The protein abundances of MYH1, MYH2, and MYH7 were quantified using Western blotting and revealed no differences among the groups (p > 0.1), except for a trend toward less MYH7 in EFA compared to EFA + CLA cows (Figure 6c and Figure S1).
The genes related to muscle fiber growth were analyzed to detect a possible influence of FA supplementation (Figure 6d). The results showed that the mRNA abundance of PGC1A tended to be higher with CLA supplementation (p = 0.086). The PROX1 gene expression in the EFA groups was higher than in the non-EFA groups (p = 0.041). The myogenesis-related genes MYOD and MYOG were similarly expressed in all groups (p > 0.1).
4. Discussion
Studies in mice and pigs have shown that CLA supplementation alters nutrient partitioning in growing animals and can reduce body fat accretion [31,32]. In early-lactating dairy cows, CLA supplementation reduces the milk fat content and leads to energy re-partitioning, thus improving the cows’ energy balance [33]. Former studies of our group confirmed that supplementation with EFA and CLA influences the composition of milk and circulating FAs in the blood, and regulates the body fat mass, energy balance, and hormone status of lactating dairy cows [22,23,24,25]. The results suggested that in particular, CLA supplementation might be an effective strategy for improving the energy balance, metabolism, and immune function during the transition period. Furthermore, Uken et al. and Dahl et al. [34,35] reported that maternal EFA and CLA supplementation altered the offspring FA composition of blood and tissues. However, clear effects on calves’ muscle and adipose tissue structure at day 5 of life were not observed. The FA amount that reached the tissues was probably too low, or the period of impact was too short. The current study focused on the structure of muscle and associated adipose tissues and on involved regulatory genes to clarify the effects of EFA and CLA supplementation on muscle protein and fat mobilization and accretion processes in high-yielding dairy cows. The results may provide implications for EFA and CLA supplementation in dairy cow production and for investigating the effects of EFA and CLA on lipid metabolism.
In this study, the supplementation reached the MLD and INTF of cows via the blood stream and changed the FA composition mainly as expected from the results of plasma FA composition reported by Gnott et al. [21]. By contrast, comparable changes of FA composition were not observed in SCF, which cannot be explained currently. It can only be speculated that the remodeling of this adipose tissue, associated with incorporation of circulating FAs, has not yet occurred. Differences between adipose tissues in lipolysis, lipogenesis, and remodeling during the transition period in dairy cows are known and the complex regulation of these processes needs further research [36]. Fatty acids are either stored within tissues in lipid droplets or as components of organelle membranes, are secreted with milk fat, or are circulated to function as signaling molecules [37,38]. Tissues possess distinct physiological functions and therefore differ in FA composition [39], but nutritional interventions can change the composition within a certain range [40]. Based on the different contents of LA and ALA in the EFA supplement in our study [22], these cows had a higher proportion of ALA, EPA, and n-3 PUFA in the MLD, but no difference in LA content compared to cows not receiving EFA. In addition, the proportions of ARA and ADA were lower in the EFA-supplemented cows. While ALA, EPA, DPA, and DHA belong to n-3 PUFA, LA, ARA, and ADA belong to n-6 PUFA [13]. Consequently, the n-6/n-3 PUFA ratio was clearly reduced by EFA supplementation. While producing their derivatives, LA and ALA compete for the same enzymes [9], whereby the FA composition may further be altered. It is known that CLA isomers are mainly biosynthesized from LA and ALA in the rumen [41]. However, the supplementation was applied into the abomasum and could not have influenced the de novo synthesis of CLA in the rumen. In concordance, no significant differences in CLA proportions were detected in muscle of the EFA group compared with the control.
The CLA-supplemented cows showed a higher n-6/n-3 PUFA ratio and the lowest proportion of ALA and EPA in the MLD, whereas the combined supplementation of EFA + CLA reduced the n-6/n-3 PUFA ratio to the value of EFA supplementation. Previous studies showed that supplemented CLA reduced the milk fat content and increased the body fat weight and improved the energy balance in the transition period of cows [24]. When milk fat is depressed, more FAs are available to restore fat depots after mobilization during the period of negative energy balance (NEB). This was shown for whole-body fat in CLA-supplemented cows [24], but also for IMF in the current study.
Fatty acids are closely associated with triglycerides formation [42]. Studies showed that concentrations of OA, C14:0, C16:0, and other SFAs are positively associated with triglycerides accumulation, whereas PUFAs inhibit triglycerides accumulation and obesity in humans and livestock [43]. C14:0 and one-molecule acetyl-CoA can be catalyzed into palmitic acid, which is a crucial substrate for triglycerides formation [44]. EPA, derived from ALA metabolites, forms 3-series prostaglandins, acts in an anti-inflammatory function, and inhibits adipogenesis [45]. In concordance with that, we observed positive correlations of IMF contents with C14:0, C16:0, and OA, as well as negative correlations with C22:0, LA, ARA, EPA, ADA, DPA, total PUFA, n-3 PUFA, and n-6 PUFA in our study.
Surplus nutritional energy is mainly stored in adipose tissues, which are composed of adipocytes, and the size and number of adipocytes both reflect energy storage [46]. Lipids from adipocytes can easily be mobilized during times of NEB [47]. We observed an increased IMF content in the MLD of the CLA groups, but without significant changes to the fat cell morphology. However, the histograms of the fat cell diameter show a slight shift towards more fat cells with a greater diameter in the CLA-supplemented groups. In concordance, studies reported that CLA improved IMF content in cattle [48,49]; and in pigs, CLA significantly increased the marbling fleck proportion and IMF content [50].
Adipogenesis and lipid accumulation both are regulated by specific genes, encoding transcription factors, enzymes, and further molecules, which could be influenced by fatty acids [51]. The presented results indicated that CLA re-partitions energy and promotes triglyceride formation and storage. In concordance, CLA supplementation increased the expression of ACACA and FASN in MLD and tended to increase the expression of FABP4 and ACSL1. ACACA and FASN are crucial regulators in lipogenesis pathways and support de novo lipogenesis [52]. FABP4 is involved in the transport of FAs and triglyceride accumulation [53], and ACSL1 catalyzes the conversion of long-chain FAs to their active-form acyl-CoA for both the synthesis of cellular lipids and degradation via beta-oxidation [54]. In muscle-associated INTF, similar changes in gene expression were observed. In the CLA groups, the expression of LPL was increased and the expression of ACSS2, ACACA, and FASN tended to be increased. LPL plays an important role in lipid clearance from the blood stream, lipid utilization, and triglyceride accumulation in muscle and adipose tissue [55]. The study of Zhang et al. indicated that increased LPL expression was involved in enhanced IMF content by CLA supplementation in crossbred cattle [49]. Furthermore, CLA supplementation altered the phosphorylation level of ACSS2 and ACACA protein in dairy cows [56]. Reduced PPARG expression and a trend toward the decreased expression of CEBPA and SREBP1 in SCF of CLA-supplemented cows in our study suggests reduced adipogenesis. PPARG, CEBPA, and SREBP1 initiate adipocyte differentiation and regulate downstream target genes to maintain adipocyte differentiation [57]. Many studies also demonstrated that CLA inhibits adipocyte differentiation through decreased PPARG expression [58]. Adipogenesis genes were more active in the SCF of CTRL cows, which concordantly showed a higher frequency of small, developing adipocytes. By contrast, EFA supplementation had no clear effect on the adipocyte morphology and related gene expression in MLD and adipose tissues.
High-yielding dairy cows may compensate for their energy deficit partly via the mobilization of muscle protein to maintain lactation [47]. Differences in muscle fiber size, as an indicator of muscle protein mobilization, were not observed among the groups of cows in our study. However, the smaller apparent muscle fiber number in the CLA-supplemented cows, the smaller muscle area, and higher IMF content suggest that muscle fibers were degraded and were partly replaced by adipocytes. Muscle fiber hypertrophy and type conversion can be observed throughout the life of animals [28,59]. Adaptations of the muscle fiber metabolism may have occurred and were investigated in the current study. Beside muscle fiber contraction types, including slow, intermediate, and fast fibers, and metabolic types, namely glycolytic or oxidative, fiber types are best characterized by the expression of myosin heavy-chain isoforms [60], e.g., slow oxidative fibers express MYH7 and fast glycolytic fibers express MYH1. So-called hybrid fibers express two or more isoforms and can be indicators for fiber type transition. We observed a high individual variation in the appearance of hybrid fibers, but there were no differences between the groups. Specific genes, which can have FAs as ligands for activation, regulate changes in muscle fibers, such as growth, regeneration, and fiber type conversion [61]. PGC1A is known to play an essential role in metabolic reprogramming in response to nutrients and to coordinate the expression of genes involved in glucose and FAs metabolism [62]. It is mainly expressed in type I muscle fibers and was shown to be involved in muscle fiber type transitions [63]. The trend toward a higher expression in CLA-supplemented cows might be related to an increased availability of FAs and fat deposition in the MLD of these cows. The expression of PROX1 was increased in EFA-supplemented cows in our study. This suggests the activation of satellite cells and muscle fiber regeneration and growth [64], because PROX1 was shown to be expressed in slow muscle fibers and satellite cells and to be involved in the maintenance of slow muscle fibers [65]. The expression of these two genes differed among the groups and indicated an influence of the supplementation on genes related to muscle fiber type determination.
5. Conclusions
The supplementation altered FA profiles in MLD and adipose tissues. CLA has energy re-partitioning functions in the transition period of cows. Collectively, the current study and our former studies suggest that CLA supplementation may be a feeding strategy to improve the energy balance in the transition period and support the tissue regeneration of high-yielding dairy cows. The direct effects of CLA isomers on cells in muscle and adipose tissue as well as feeding strategies to achieve effective FA concentrations in the tissues should be investigated in future studies.
Supplementary Materials
The following supporting information can be downloaded at: https://www.mdpi.com/article/10.3390/agriculture14101720/s1; Table S1: Primers used in qPCR; Table S2: Fatty acid composition in muscle tissue (MLD); Table S3: Fatty acid composition in intermuscular fat (INTF); Table S4: Fatty acid composition in subcutaneous fat (SCF); Figure S1: Representative Western blot images of MYH1, MYH2, and MYH7 with the respective total protein images of MLD.
Author Contributions
Conceptualization, E.A., H.M.H. and S.M.; methodology, E.A., D.D. and W.K.; validation, C.X., E.A., D.D., W.K. and S.M.; formal analysis, C.X., D.D., H.G. and E.A.; investigation, C.X., H.G. and D.D.; resources, D.D., H.M.H., E.A. and S.M.; writing—original draft preparation, C.X.; writing—review and editing, E.A., D.D., W.K., H.G., H.M.H. and S.M.; visualization, C.X. and E.A.; supervision, S.M.; project administration, H.M.H. and S.M.; funding acquisition, H.M.H. All authors have read and agreed to the published version of the manuscript.
Funding
Cheng Xiao and Hao Gu were funded by China Scholarship Council (CSC) grants. The study was partially supported by BASF, Ludwigshafen, Germany.
Institutional Review Board Statement
The study was conducted in accordance with the Declaration of Helsinki, and approved by the animal ethics committee of the state of Mecklenburg—Western Pomerania, Germany (Landesamt für Landwirtschaft, Lebensmittelsicherheit und Fischerei Mecklenburg-Vorpommern; LALLF M-V/TSD/7221.3–1-038/15).
Data Availability Statement
The raw data supporting the conclusions of this article will be made available by the authors upon request.
Acknowledgments
We wish to thank the team of the Tiertechnikum and the team of the slaughterhouse, as well as E. Schwitulla, S. Foß, M. Dahm, and B. Jentz for expert technical assistance.
Conflicts of Interest
The authors declare no conflicts of interest.
References
- Barkema, H.W.; von Keyserlingk, M.A.G.; Kastelic, J.P.; Lam, T.J.G.M.; Luby, C.; Roy, J.P.; LeBlanc, S.J.; Keefe, G.P.; Kelton, D.F. Changes in the dairy industry affecting dairy cattle health and welfare. J. Dairy Sci. 2015, 98, 7426–7445. [Google Scholar] [CrossRef]
- Chilliard, Y.; Ferlay, A.; Doreau, M. Effect of different types of forages, animal fat or marine oils in cow’s diet on milk fat secretion and composition, especially conjugated linoleic acid (CLA) and polyunsaturated fatty acids. Livest. Prod. Sci. 2001, 70, 31–48. [Google Scholar] [CrossRef]
- Kliem, K.E.; Morgan, R.; Humphries, D.J.; Shingfield, K.J.; Givens, D.I. Effect of replacing grass silage with maize silage in the diet on bovine milk fatty acid composition. Animal 2008, 2, 1850–1858. [Google Scholar] [CrossRef]
- Ponnampalam, E.N.; Mann, N.J.; Sinclair, A.J. Effect of feeding systems on omega-3 fatty acids, conjugated linoleic acid and trans fatty acids in Australian beef cuts: Potential impact on human health. Asia Pac. J. Clin. Nutr. 2006, 15, 21–29. [Google Scholar]
- Han, L.Y.; Zhou, H. Effects of ensiling processes and antioxidants on fatty acid concentrations and compositions in corn silages. J. Anim. Sci. Biotechnol. 2013, 4, Artn 48. [Google Scholar] [CrossRef][Green Version]
- Couvreur, S.; Hurtaud, C.; Marnet, P.G.; Faverdin, P.; Peyraud, J.L. Composition of milk fat from cows selected for milk fat globule size and offered either fresh pasture or a corn silage-based diet. J. Dairy Sci. 2007, 90, 392–403. [Google Scholar] [CrossRef]
- Lahlou, M.N.; Kanneganti, R.; Massingill, L.J.; Broderick, G.A.; Park, Y.; Pariza, M.W.; Ferguson, J.D.; Wu, Z. Grazing increases the concentration of CLA in dairy cow milk. Animal 2014, 8, 1191–1200. [Google Scholar] [CrossRef][Green Version]
- Palmquist, D.L. Essential Fatty Acids in Ruminant Diets. In Proceedings of the 21st Annual Ruminant Nutrition Symposium, Gainesville, FL, USA, 2–3 February 2010; pp. 127–141. [Google Scholar]
- Ponnampalam, E.N.; Sinclair, A.J.; Holman, B.W.B. The sources, synthesis and biological actions of Omega-3 and Omega-6 fatty acids in red meat: An overview. Foods 2021, 10, 1358. [Google Scholar] [CrossRef]
- Simopoulos, A.P. Essential fatty acids in health and chronic disease. Am. J. Clin. Nutr. 1999, 70 (Suppl. 3), 560S–569S. [Google Scholar] [CrossRef] [PubMed]
- Schoonjans, K.; Staels, B.; Auwerx, J. The peroxisome proliferator activated receptors (PPARs) and their effects on lipid metabolism and adipocyte differentiation. BBA-Lipids Lipid. Met. 1996, 1302, 93–109. [Google Scholar] [CrossRef] [PubMed]
- Varga, T.; Czimmerer, Z.; Nagy, L. PPARs are a unique set of fatty acid regulated transcription factors controlling both lipid metabolism and inflammation. BBA-Mol. Basis. Dis. 2011, 1812, 1007–1022. [Google Scholar] [CrossRef]
- Calder, P.C. Mechanisms of action of (n-3) fatty acids. J. Nutr. 2012, 142, 592S–599S. [Google Scholar] [CrossRef]
- Hardwick, J.P.; Eckman, K.; Lee, Y.K.; Abdelmegeed, M.A.; Esterle, A.; Chilian, W.M.; Chiang, J.Y.; Song, B.J. Eicosanoids in metabolic syndrome. Adv. Pharmacol. 2013, 66, 157–266. [Google Scholar] [CrossRef]
- Roach, J.A.G.; Mossoba, M.M.; Yurawecz, M.P.; Kramer, J.K.G. Chromatographic separation and identification of conjugated linoleic acid isomers. Anal. Chim. Acta 2002, 465, 207–226. [Google Scholar] [CrossRef]
- Bauman, D.E. Regulation of nutrient partitioning during lactation: Homeostasis and homeorhesis revisited. In Ruminant Physiology: Digestion, Metabolism, Growth And Reproduction; CABI Publishing: Wallingford, UK, 2000; pp. 311–328. [Google Scholar]
- Olzmann, J.A.; Carvalho, P. Dynamics and functions of lipid droplets. Nat. Rev. Mol. Cell Biol. 2019, 20, 137–155. [Google Scholar] [CrossRef]
- Frampton, J.; Murphy, K.G.; Frost, G.; Chambers, E.S. Short-chain fatty acids as potential regulators of skeletal muscle metabolism and function. Nat. Metab. 2020, 2, 840–848. [Google Scholar] [CrossRef]
- Jeromson, S.; Gallagher, I.J.; Galloway, S.D.; Hamilton, D.L. Omega-3 fatty acids and skeletal muscle health. Mar. Drugs 2015, 13, 6977–7004. [Google Scholar] [CrossRef]
- Baumgard, L.H.; Corl, B.A.; Dwyer, D.A.; Saebø, A.; Bauman, D.E. Identification of the conjugated linoleic acid isomer that inhibits milk fat synthesis. Am. J. Physiol. Regul. Integr. Comp. Physiol. 2000, 278, R179–R184. [Google Scholar] [CrossRef]
- Gnott, M.; Vogel, L.; Kröger-Koch, C.; Dannenberger, D.; Tuchscherer, A.; Tröscher, A.; Trevisi, E.; Stefaniak, T.; Bajzert, J.; Starke, A.; et al. Changes in fatty acids in plasma and association with the inflammatory response in dairy cows abomasally infused with essential fatty acids and conjugated linoleic acid during late and early lactation. J. Dairy Sci. 2020, 103, 11889–11910. [Google Scholar] [CrossRef]
- Haubold, S.; Kröger-Koch, C.; Starke, A.; Tuchscherer, A.; Tröscher, A.; Kienberger, H.; Rychlik, M.; Bernabucci, U.; Trevisi, E.; Hammon, H.M. Effects of abomasal infusion of essential fatty acids and conjugated linoleic acid on performance and fatty acid, antioxidative, and inflammatory status in dairy cows. J. Dairy Sci. 2020, 103, 972–991. [Google Scholar] [CrossRef]
- Haubold, S.; Kröger-Koch, C.; Tuchscherer, A.; Kanitz, E.; Weitzel, J.M.; Hoeflich, A.; Starke, A.; Tröscher, A.; Sauerwein, H.; Hammon, H.M. Effects of a combined essential fatty acid and conjugated linoleic acid abomasal infusion on metabolic and endocrine traits, including the somatotropic axis, in dairy cows. J. Dairy Sci. 2020, 103, 12069–12082. [Google Scholar] [CrossRef]
- Vogel, L.; Gnott, M.; Kröger-Koch, C.; Dannenberger, D.; Tuchscherer, A.; Tröscher, A.; Kienberger, H.; Rychlik, M.; Starke, A.; Bachmann, L.; et al. Effects of abomasal infusion of essential fatty acids together with conjugated linoleic acid in late and early lactation on performance, milk and body composition, and plasma metabolites in dairy cows. J. Dairy Sci. 2020, 103, 7431–7450. [Google Scholar] [CrossRef]
- Vogel, L.; Gnott, M.; Kröger-Koch, C.; Görs, S.; Weitzel, J.M.; Kanitz, E.; Hoeflich, A.; Tuchscherer, A.; Tröscher, A.; Gross, J.J.; et al. Glucose metabolism and the somatotropic axis in dairy cows after abomasal infusion of essential fatty acids together with conjugated linoleic acid during late gestation and early lactation. J. Dairy Sci. 2021, 104, 3646–3664. [Google Scholar] [CrossRef]
- Dannenberger, D.; Nuernberg, G.; Nuernberg, K.; Will, K.; Schauer, N.; Schmicke, M. Effects of diets supplemented with n-3 or n-6 PUFA on pig muscle lipid metabolites measured by non-targeted LC-MS lipidomic profiling. J. Food Compos. Anal. 2017, 56, 47–54. [Google Scholar] [CrossRef]
- Kalbe, C.; Priepke, A.; Nürnberg, G.; Dannenberger, D. Effects of long-term microalgae supplementation on muscle microstructure, meat quality and fatty acid composition in growing pigs. J. Anim. Physiol. Anim. Nutr. 2019, 103, 574–582. [Google Scholar] [CrossRef]
- Wegner, J.; Albrecht, E.; Fiedler, I.; Teuscher, F.; Papstein, H.J.; Ender, K. Growth- and breed-related changes of muscle fiber characteristics in cattle. J. Anim. Sci. 2000, 78, 1485–1496. [Google Scholar] [CrossRef]
- Albrecht, E.; Gotoh, T.; Ebara, F.; Xu, J.X.; Viergutz, T.; Nürnberg, G.; Maak, S.; Wegner, J. Cellular conditions for intramuscular fat deposition in Japanese Black and Holstein steers. Meat Sci. 2011, 89, 13–20. [Google Scholar] [CrossRef]
- Hellemans, J.; Mortier, G.; De Paepe, A.; Speleman, F.; Vandesompele, J. qBase relative quantification framework and software for management and automated analysis of real-time quantitative PCR data. Genome Biol. 2007, 8, R19. [Google Scholar] [CrossRef]
- DeLany, J.P.; Blohm, F.; Truett, A.A.; Scimeca, J.A.; West, D.B. Conjugated linoleic acid rapidly reduces body fat content in mice without affecting energy intake. Am. J. Physiol. 1999, 276, R1172–R1179. [Google Scholar] [CrossRef]
- Dugan, M.E.R.; Aalhus, J.L.; Schaefer, A.L.; Kramer, J.K.G. The effect of conjugated linoleic acid on fat to lean repartitioning and feed conversion in pigs. Can. J. Anim. Sci. 1997, 77, 723–725. [Google Scholar] [CrossRef]
- Loor, J.J.; Herbein, J.H. Exogenous conjugated linoleic acid isomers reduce bovine milk fat concentration and yield by inhibiting de novo fatty acid synthesis. J. Nutr. 1998, 128, 2411–2419. [Google Scholar] [CrossRef] [PubMed]
- Dahl, N.; Albrecht, E.; Dannenberger, D.; Uken, K.L.; Hammon, H.M.; Maak, S. Consequences of maternal essential fatty acid and conjugated linoleic acid supplementation on the development of calf muscle and adipose tissue. Animals 2020, 10, Artn 1598. [Google Scholar] [CrossRef]
- Uken, K.L.; Vogel, L.; Gnott, M.; Görs, S.; Schäff, C.T.; Tuchscherer, A.; Hoeflich, A.; Weitzel, J.M.; Kanitz, E.; Tröscher, A.; et al. Effect of maternal supplementation with essential fatty acids and conjugated linoleic acid on metabolic and endocrine development in neonatal calves. J. Dairy Sci. 2021, 104, 7295–7314. [Google Scholar] [CrossRef] [PubMed]
- Bobinski, R.; Bobinska, J. Fatty acids of human milk—A review. Int. J. Vitam Nutr. Res. 2022, 92, 280–291. [Google Scholar] [CrossRef]
- de Carvalho, C.; Caramujo, M.J. The various roles of fatty acids. Molecules 2018, 23, 2583. [Google Scholar] [CrossRef]
- Turk, S.N.; Smith, S.B. Carcass fatty acid mapping. Meat Sci. 2009, 81, 658–663. [Google Scholar] [CrossRef]
- Scollan, N.D.; Choi, N.J.; Kurt, E.; Fisher, A.V.; Enser, M.; Wood, J.D. Manipulating the fatty acid composition of muscle and adipose tissue in beef cattle. Br. J. Nutr. 2001, 85, 115–124. [Google Scholar] [CrossRef]
- Bauman, D.E.; Lock, A.L. Conjugated linoleic acid: Biosynthesis and nutritional significance. Adv. Dairy Chem. 2006, 2, 93–136. [Google Scholar]
- Nudda, A.; Palmquist, D.L.; Battacone, G.; Fancellu, S.; Rassu, S.P.G.; Pulina, G. Relationships between the contents of vaccenic acid, CLA and n-3 fatty acids of goat milk and the muscle of their suckling kids. Livest. Sci. 2008, 118, 195–203. [Google Scholar] [CrossRef]
- Zheng, J.S.; Sharp, S.J.; Imamura, F.; Koulman, A.; Schulze, M.B.; Ye, Z.; Griffin, J.; Guevara, M.; Huerta, J.M.; Kroger, J.; et al. Association between plasma phospholipid saturated fatty acids and metabolic markers of lipid, hepatic, inflammation and glycaemic pathways in eight European countries: A cross-sectional analysis in the EPIC-InterAct study. BMC Med. 2017, 15, 203. [Google Scholar] [CrossRef]
- Alves-Bezerra, M.; Cohen, D.E. Triglyceride metabolism in the liver. Compr. Physiol. 2017, 8, 1–8. [Google Scholar] [CrossRef]
- Nartey, M.N.N.; Shimizu, H.; Sugiyama, H.; Higa, M.; Syeda, P.K.; Nishimura, K.; Jisaka, M.; Yokota, K. Eicosapentaenoic acid induces the inhibition of adipogenesis by reducing the effect of PPARγ activator and mediating PKA activation and increased COX-2 expression in 3T3-L1 cells at the differentiation stage. Life 2023, 13, 1704. [Google Scholar] [CrossRef]
- Rosen, E.D.; Spiegelman, B.M. Adipocytes as regulators of energy balance and glucose homeostasis. Nature 2006, 444, 847–853. [Google Scholar] [CrossRef]
- von Soosten, D.; Meyer, U.; Piechotta, M.; Flachowsky, G.; Dänicke, S. Effect of conjugated linoleic acid supplementation on body composition, body fat mobilization, protein accretion, and energy utilization in early lactation dairy cows. J. Dairy Sci. 2012, 95, 1222–1239. [Google Scholar] [CrossRef] [PubMed]
- Kenéz, Á.; Kulcsár, A.; Kluge, F.; Benbelkacem, I.; Hansen, K.; Locher, L.; Meyer, U.; Rehage, J.; Dänicke, S.; Huber, K. Changes of adipose tissue morphology and composition during late pregnancy and early lactation in dairy cows. PLoS ONE 2015, 10, e0127208. [Google Scholar] [CrossRef]
- Cooke, R.F.; Bohnert, D.W.; Moriel, P.; Hess, B.W.; Mills, R.R. Effects of polyunsaturated fatty acid supplementation on ruminal in situ forage degradability, performance, and physiological responses of feeder cattle. J. Anim. Sci. 2011, 89, 3677–3689. [Google Scholar] [CrossRef]
- Zhang, H.; Dong, X.; Wang, Z.; Zhou, A.; Peng, Q.; Zou, H.; Xue, B.; Wang, L. Dietary conjugated linoleic acids increase intramuscular fat deposition and decrease subcutaneous fat deposition in Yellow Breed × Simmental cattle. Anim. Sci. J. 2016, 87, 517–524. [Google Scholar] [CrossRef]
- Huang, J.X.; Qi, R.L.; Chen, X.L.; You, X.Y.; Liu, X.Q.; Yang, F.Y.; Liu, Z.H. Improvement in the carcass traits and meat quality of growing-finishing Rongchang pigs by conjugated linoleic acid through altered gene expression of muscle fiber types. Genet. Mol. Res. 2014, 13, 7061–7069. [Google Scholar] [CrossRef]
- Farmer, S.R. Transcriptional control of adipocyte formation. Cell Metab. 2006, 4, 263–273. [Google Scholar] [CrossRef]
- Mu, T.; Hu, H.; Ma, Y.; Feng, X.; Zhang, J.; Gu, Y. Regulation of key genes for milk fat synthesis in ruminants. Front. Nutr. 2021, 8, 765147. [Google Scholar] [CrossRef]
- Yan, W.; Zhou, H.; Hu, J.; Luo, Y.; Hickford, J.G.H. Variation in the FABP4 gene affects carcass and growth traits in sheep. Meat Sci. 2018, 145, 334–339. [Google Scholar] [CrossRef]
- Yang, X.; Zhang, X.; Yang, Z.; Zhang, Q.; Hao, W.; Pang, Y.; Zhang, D.; Liu, D. Transcriptional regulation associated with subcutaneous adipogenesis in porcine ACSL1 gene. Biomolecules 2023, 13, 1057. [Google Scholar] [CrossRef]
- Zhang, L.; Lookene, A.; Wu, G.; Olivecrona, G. Calcium triggers folding of lipoprotein lipase into active dimers. J. Biol. Chem. 2005, 280, 42580–42591. [Google Scholar] [CrossRef]
- Daddam, J.R.; Hammon, H.M.; Tröscher, A.; Vogel, L.; Gnott, M.; Kra, G.; Levin, Y.; Sauerwein, H.; Zachut, M. Phosphoproteomic analysis of subcutaneous and omental adipose tissue reveals increased lipid turnover in dairy cows supplemented with conjugated linoleic acid. Int. J. Mol. Sci. 2021, 22, 3227. [Google Scholar] [CrossRef]
- Rosen, E.D.; Hsu, C.H.; Wang, X.; Sakai, S.; Freeman, M.W.; Gonzalez, F.J.; Spiegelman, B.M. C/EBPalpha induces adipogenesis through PPARgamma: A unified pathway. Genes Dev. 2002, 16, 22–26. [Google Scholar] [CrossRef]
- Yamasaki, M.; Yanagita, T. Adipocyte response to conjugated linoleic acid. Obes. Res. Clin. Pract. 2013, 7, e235–e242. [Google Scholar] [CrossRef]
- Pette, D.; Staron, R.S. Mammalian skeletal muscle fiber type transitions. Int. Rev. Cytol. 1997, 170, 143–223. [Google Scholar] [CrossRef]
- Pette, D.; Staron, R.S. Myosin isoforms, muscle fiber types, and transitions. Microsc. Res. Tech. 2000, 50, 500–509. [Google Scholar] [CrossRef]
- Schiaffino, S. Fibre types in skeletal muscle: A personal account. Acta Physiol. 2010, 199, 451–463. [Google Scholar] [CrossRef]
- Ramachandran, K.; Senagolage, M.D.; Sommars, M.A.; Futtner, C.R.; Omura, Y.; Allred, A.L.; Barish, G.D. Dynamic enhancers control skeletal muscle identity and reprogramming. PLoS Biol. 2019, 17, e3000467. [Google Scholar] [CrossRef]
- Huang, B.; Jiao, Y.; Zhu, Y.; Ning, Z.; Ye, Z.; Li, Q.X.; Hu, C.; Wang, C. Mdfi promotes C2C12 cell differentiation and positively modulates fast-to-slow-twitch muscle fiber transformation. Front. Cell Dev. Biol. 2021, 9, 605875. [Google Scholar] [CrossRef] [PubMed]
- Dumont, N.A.; Bentzinger, C.F.; Sincennes, M.C.; Rudnicki, M.A. Satellite cells and skeletal muscle regeneration. Compr. Physiol. 2015, 5, 1027–1059. [Google Scholar] [CrossRef]
- Kivelä, R.; Salmela, I.; Nguyen, Y.H.; Petrova, T.V.; Koistinen, H.A.; Wiener, Z.; Alitalo, K. The transcription factor Prox1 is essential for satellite cell differentiation and muscle fibre-type regulation. Nat. Commun. 2016, 7, 13124. [Google Scholar] [CrossRef]
Disclaimer/Publisher’s Note: The statements, opinions and data contained in all publications are solely those of the individual author(s) and contributor(s) and not of MDPI and/or the editor(s). MDPI and/or the editor(s) disclaim responsibility for any injury to people or property resulting from any ideas, methods, instructions or products referred to in the content. |
© 2024 by the authors. Licensee MDPI, Basel, Switzerland. This article is an open access article distributed under the terms and conditions of the Creative Commons Attribution (CC BY) license (https://creativecommons.org/licenses/by/4.0/).