A Platform for GHG Emissions Management in Mixed Farms

 ,
,
Abstract
:1. Introduction

| Category | Gas | Problem Description | Mitigation Strategies | Ref. |
|---|---|---|---|---|
| Enteric fermentation | CH4 | In the process of digestion of a ruminant—enteric fermentation—methane is released in its stomach, which is either burped or excreted from the body through flatulence. Currently, multiple directions are being developed to overcome the CH4 emissions caused by enteric fermentation. In [6], the authors gathered and systematized the leading mitigation strategies. | Dietary manipulations, breeding management, and rumen modification. | [2,9] |
| Rice cultivation | CH4 | Rice fields are covered with water; in these conditions, there is a lack of oxygen in the soil. The lack of oxygen, in turn, leads to the activity of methanogens (bacteria) that feed on carbon and produce methane. In this way, methane is synthesized by bacteria found in the roots of rice. Bacteria use acetate and other carbon-containing molecules as raw materials for the synthesis of methane. There are many factors catalyzing methane emissions from rice fields (type of soil, rice, fertilizer, water management, etc.) and particularly high temperatures. Thus, we can observe a closed loop: rice fields emit methane that increases the temperature of the planet, which increases emissions of methane from rice fields. | New varieties of rice with a lower carbohydrate content. | [19] |
| Synthetic fertilizers | CH4 N2O | Synthetic fertilizers are currently irreplaceable in extensive cropping systems organized to fulfill a growing demand in society; compared to organic fertilizers, they significantly accelerate the cultivation of plants. However, the manufacture of synthetic nitrogen fertilizers is a significant source of GHG, while synthetic nitrogen fertilizers themselves are acknowledged as the most significant cause of direct N2O emissions from agricultural soils. Currently, there is no relevant substitute for synthetic fertilizers; however, researchers are seeking new possibilities; e.g., the authors of [12] proved that despite the partial replacement of synthetic fertilizer with manure having promising effects (e.g., a significant reduction in N2O), it increases CH4 emissions by 2–3 times, especially in paddy rice fields. | Replacement/partial substitution of synthetic fertilizers with other types of nitrogen fertilizers; low-carbon fertilizers; and N management techniques. | [20,21] |
| Manure management | CH4 N2O | Animal slurry and manure contain inorganic nitrogen, carbon, and water; they provide the main substrates required for the microbial production of N2O and CH4. The difference between solid manure and slurry is depicted in Figure 3. In general, methane emissions are higher when manure is stored and handled in liquid form. | Production of biogas from manure for heating (anaerobic digestion), cooling of the slurry, dietary manipulation, and composting. | [22] |
| Crop residues | CH4 N2O | Under certain conditions, the organic mass of plant residues undergoes decomposition under the influence of the vital activity of microorganisms, resulting in the formation of carbon dioxide and methane. The authors of [16] determined that leaving crop residues on the soil surface generates fewer methane emissions than their incorporation into the soil. Another way to dispose of crop residues—burning—causes the immediate release of significant amounts of GHGs. | Production of biogas from crop residues for heating. | [23,24] |
| Biomass burning | ||||
| Degraded organic soils | N2O CO2 | Soil and land degradation is a combination of natural and anthropogenic processes that lead to changes in soil functions, quantitative and qualitative deterioration of their composition and properties, and a decrease in the natural and economic significance of lands. | Land reclamation. | [25] |
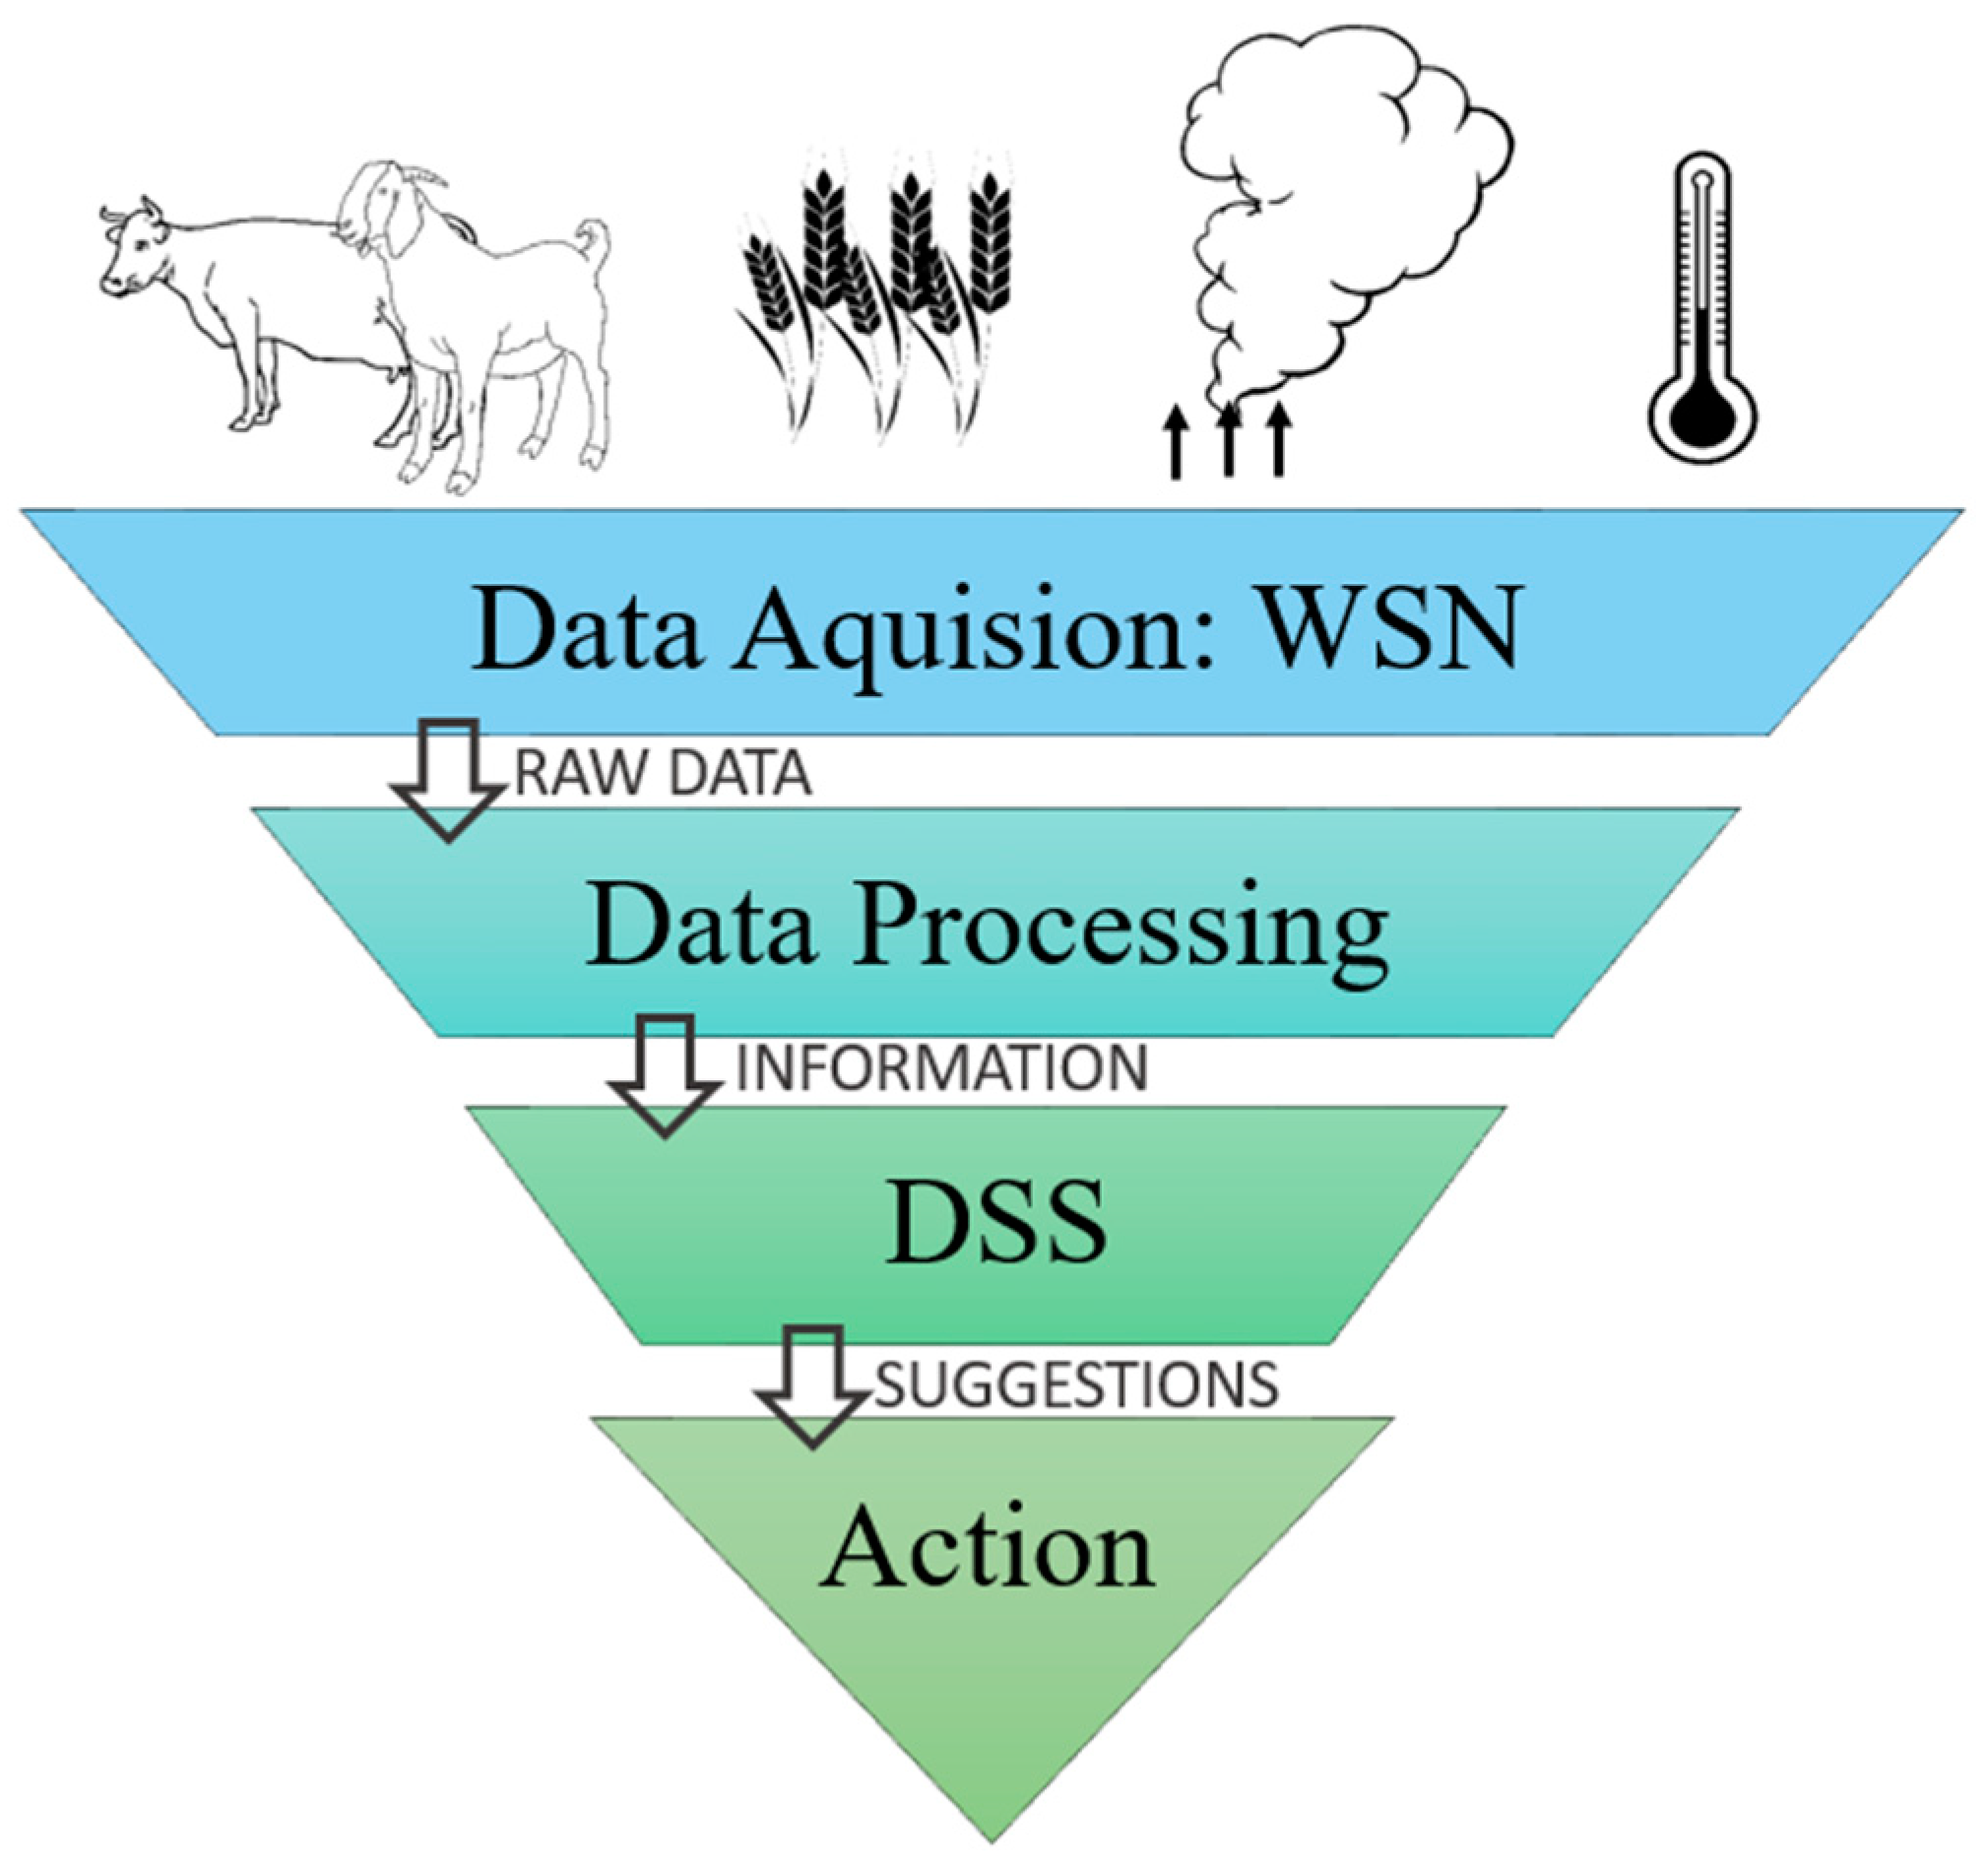
1.1. Methodological Foundations
1.2. Importance of GHG Calculators in the Broader Context of Life Cycle Assessment Methodologies
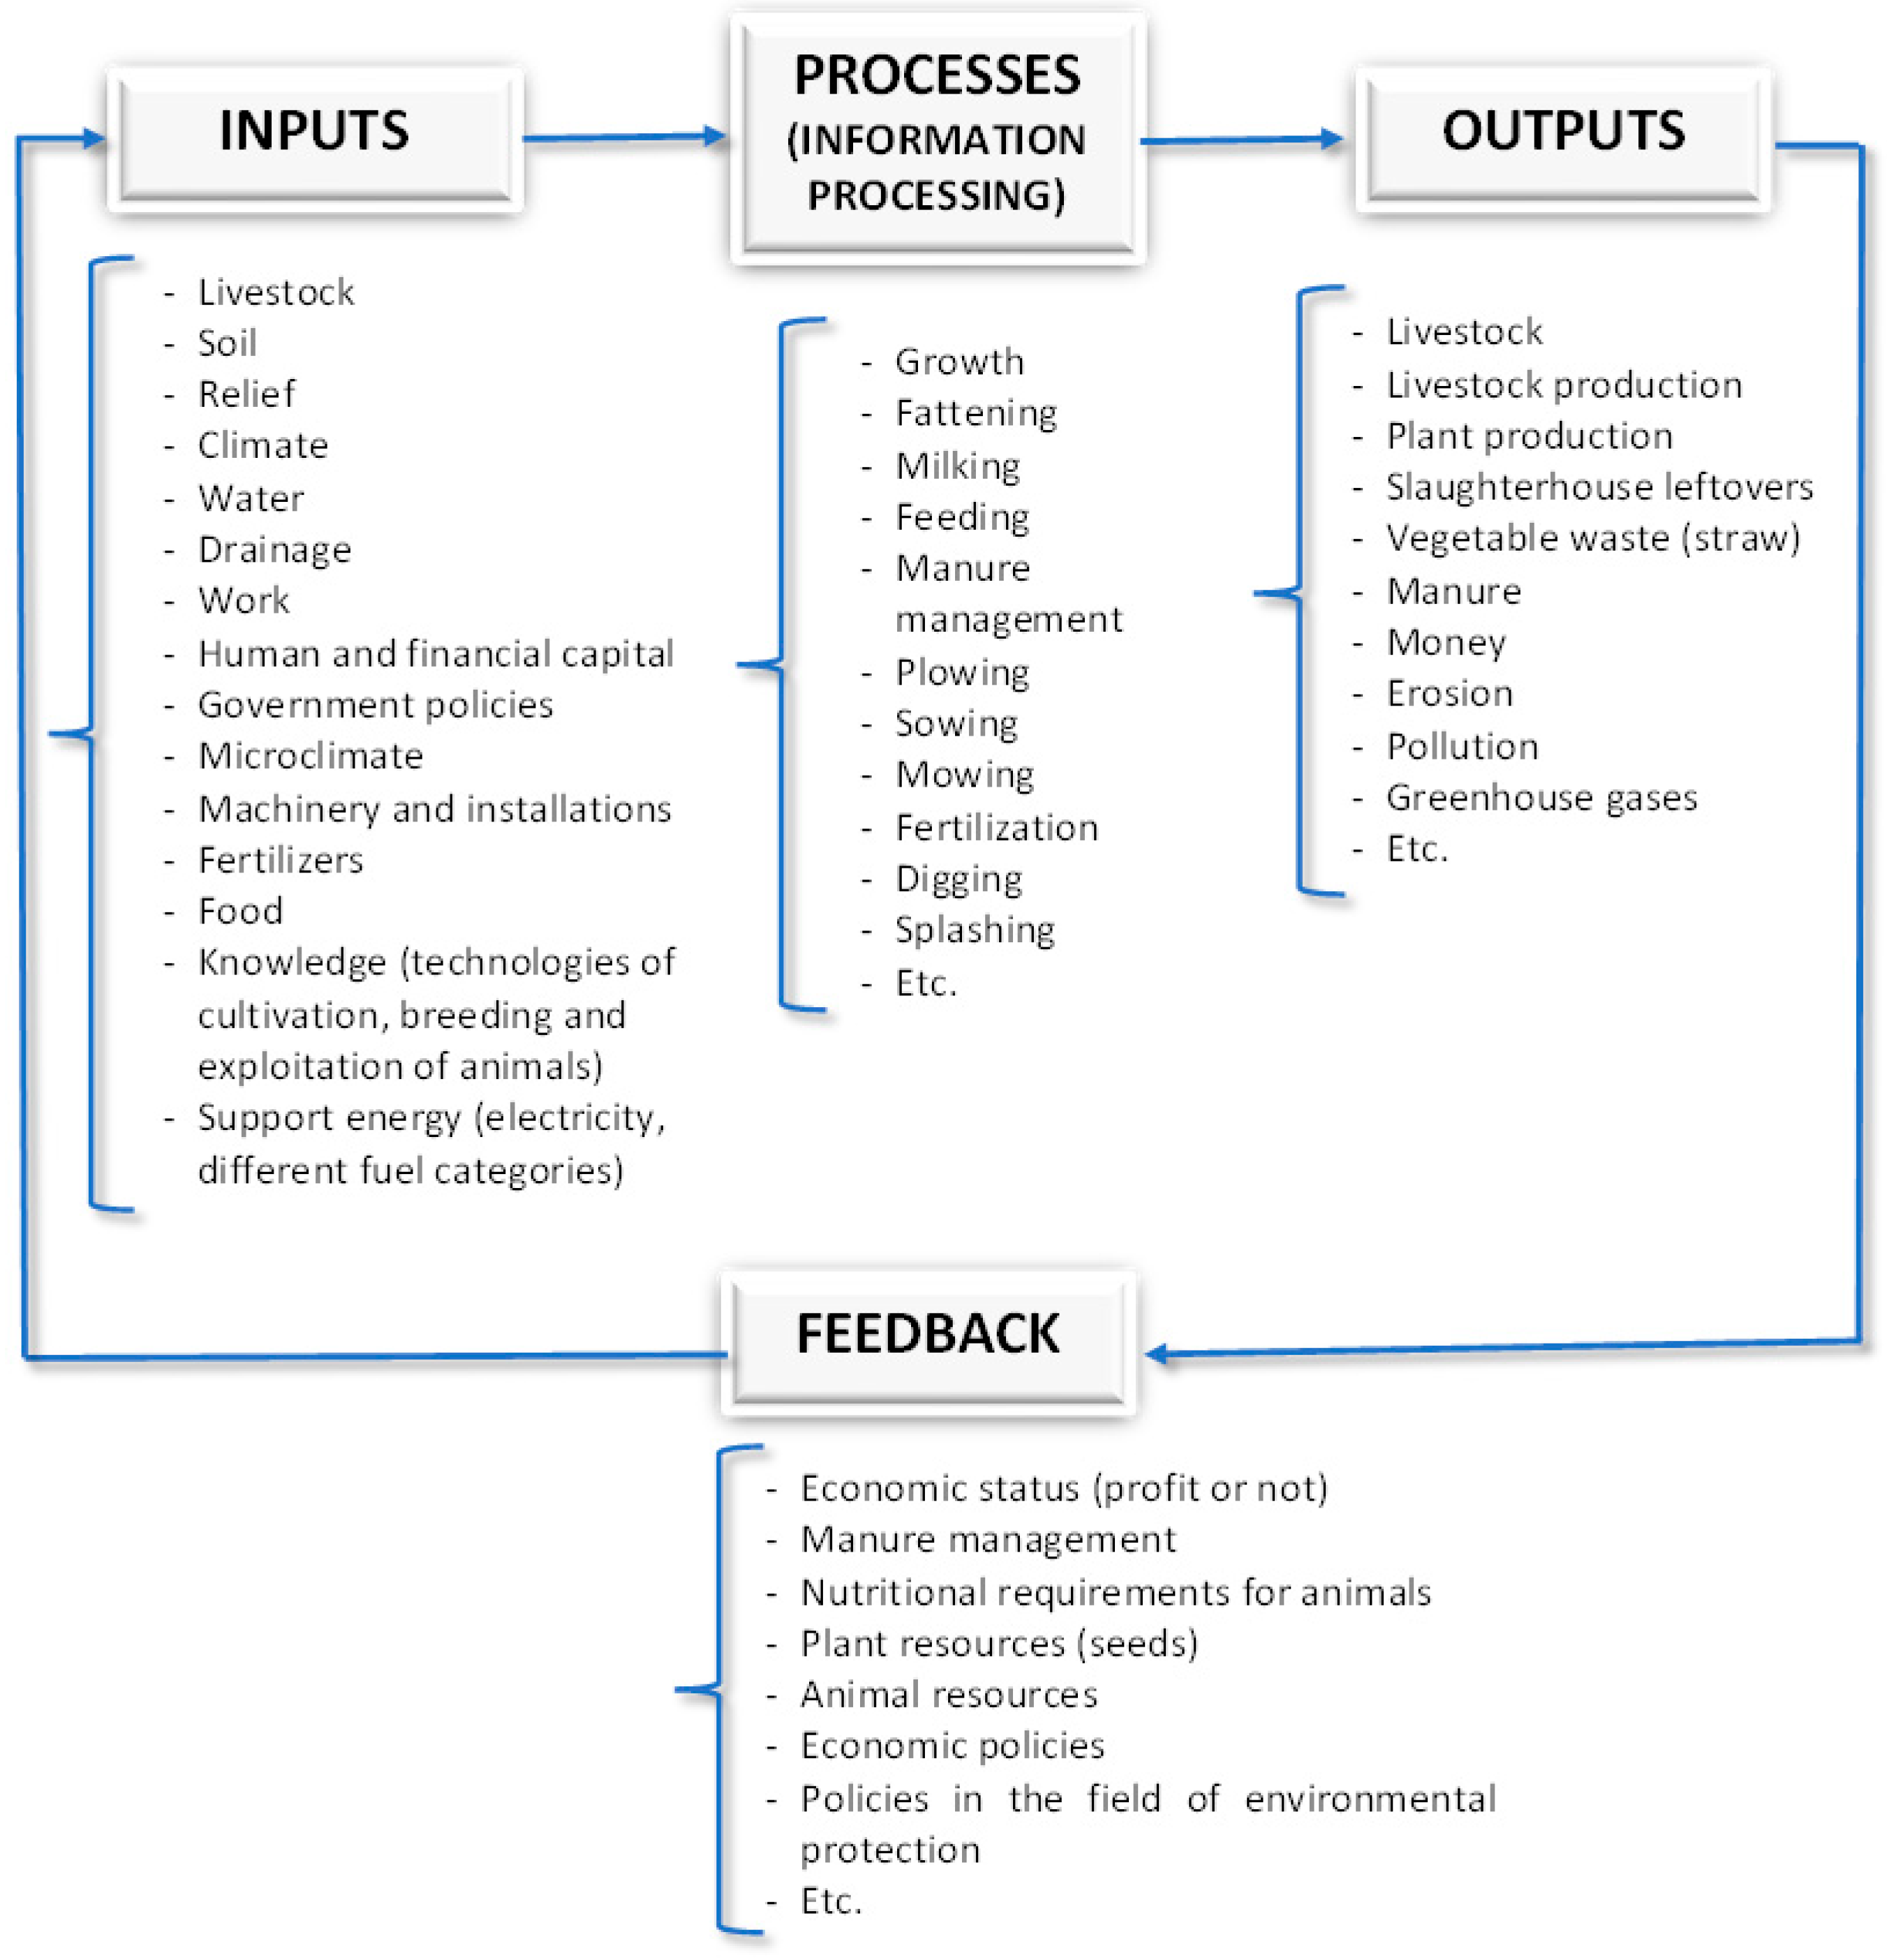
1.3. Inputs
1.4. Outputs
1.5. General Stakeholder Requirements
1.6. Challenges, Limitations, Future Directions, and Improvements
2. Materials and Methods
2.1. Platform Rationale and Target Audience
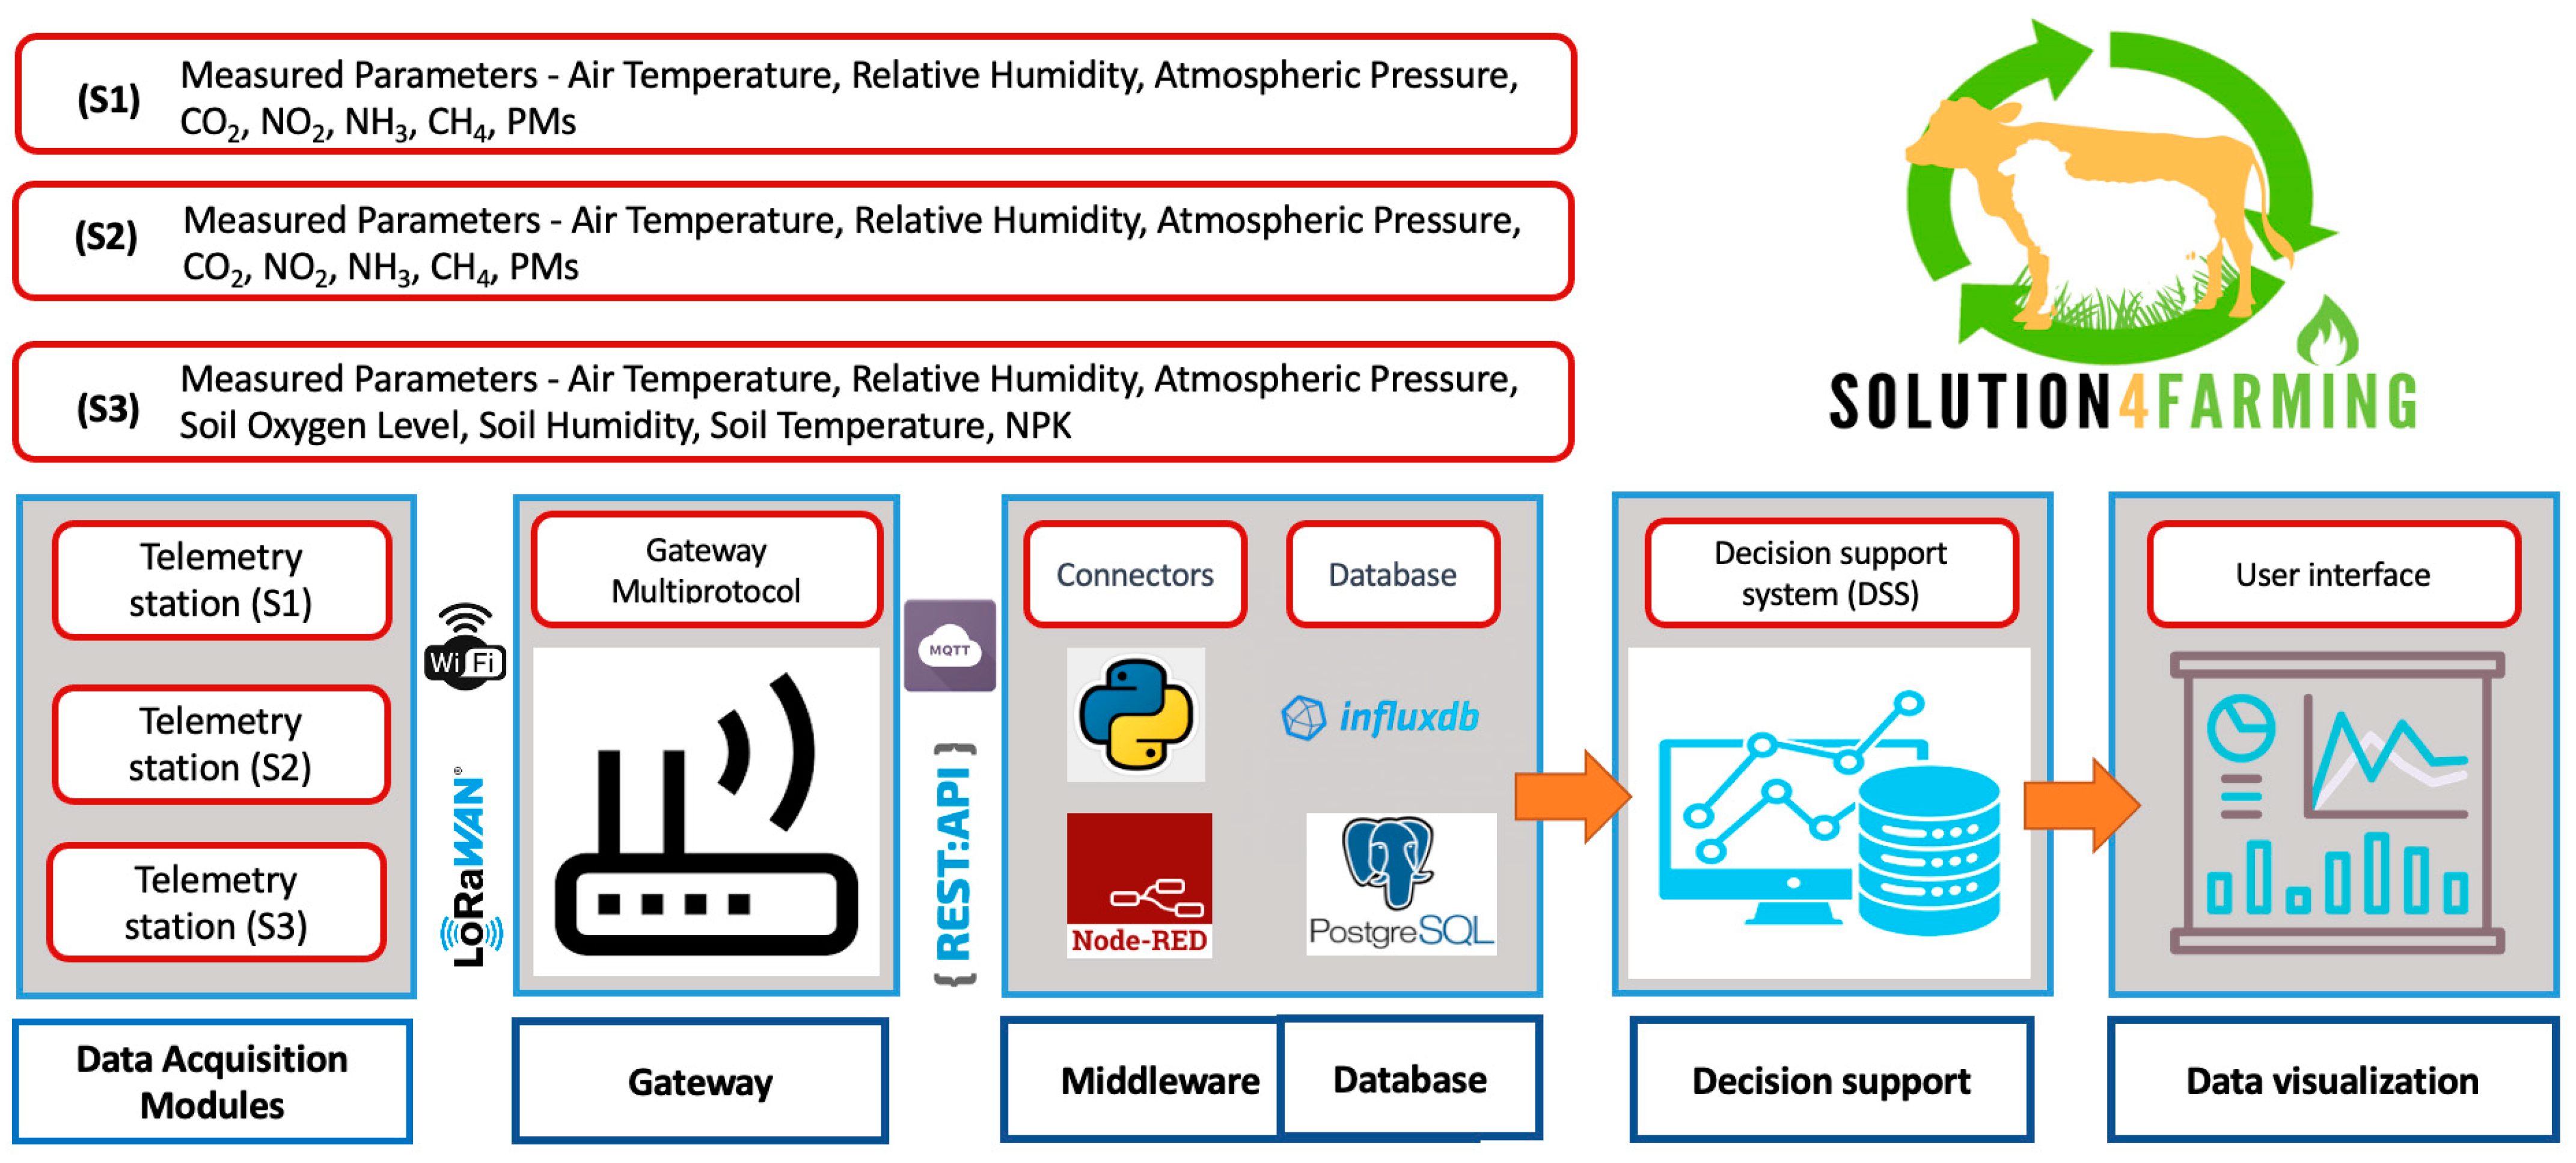
2.2. Preliminary Architecture
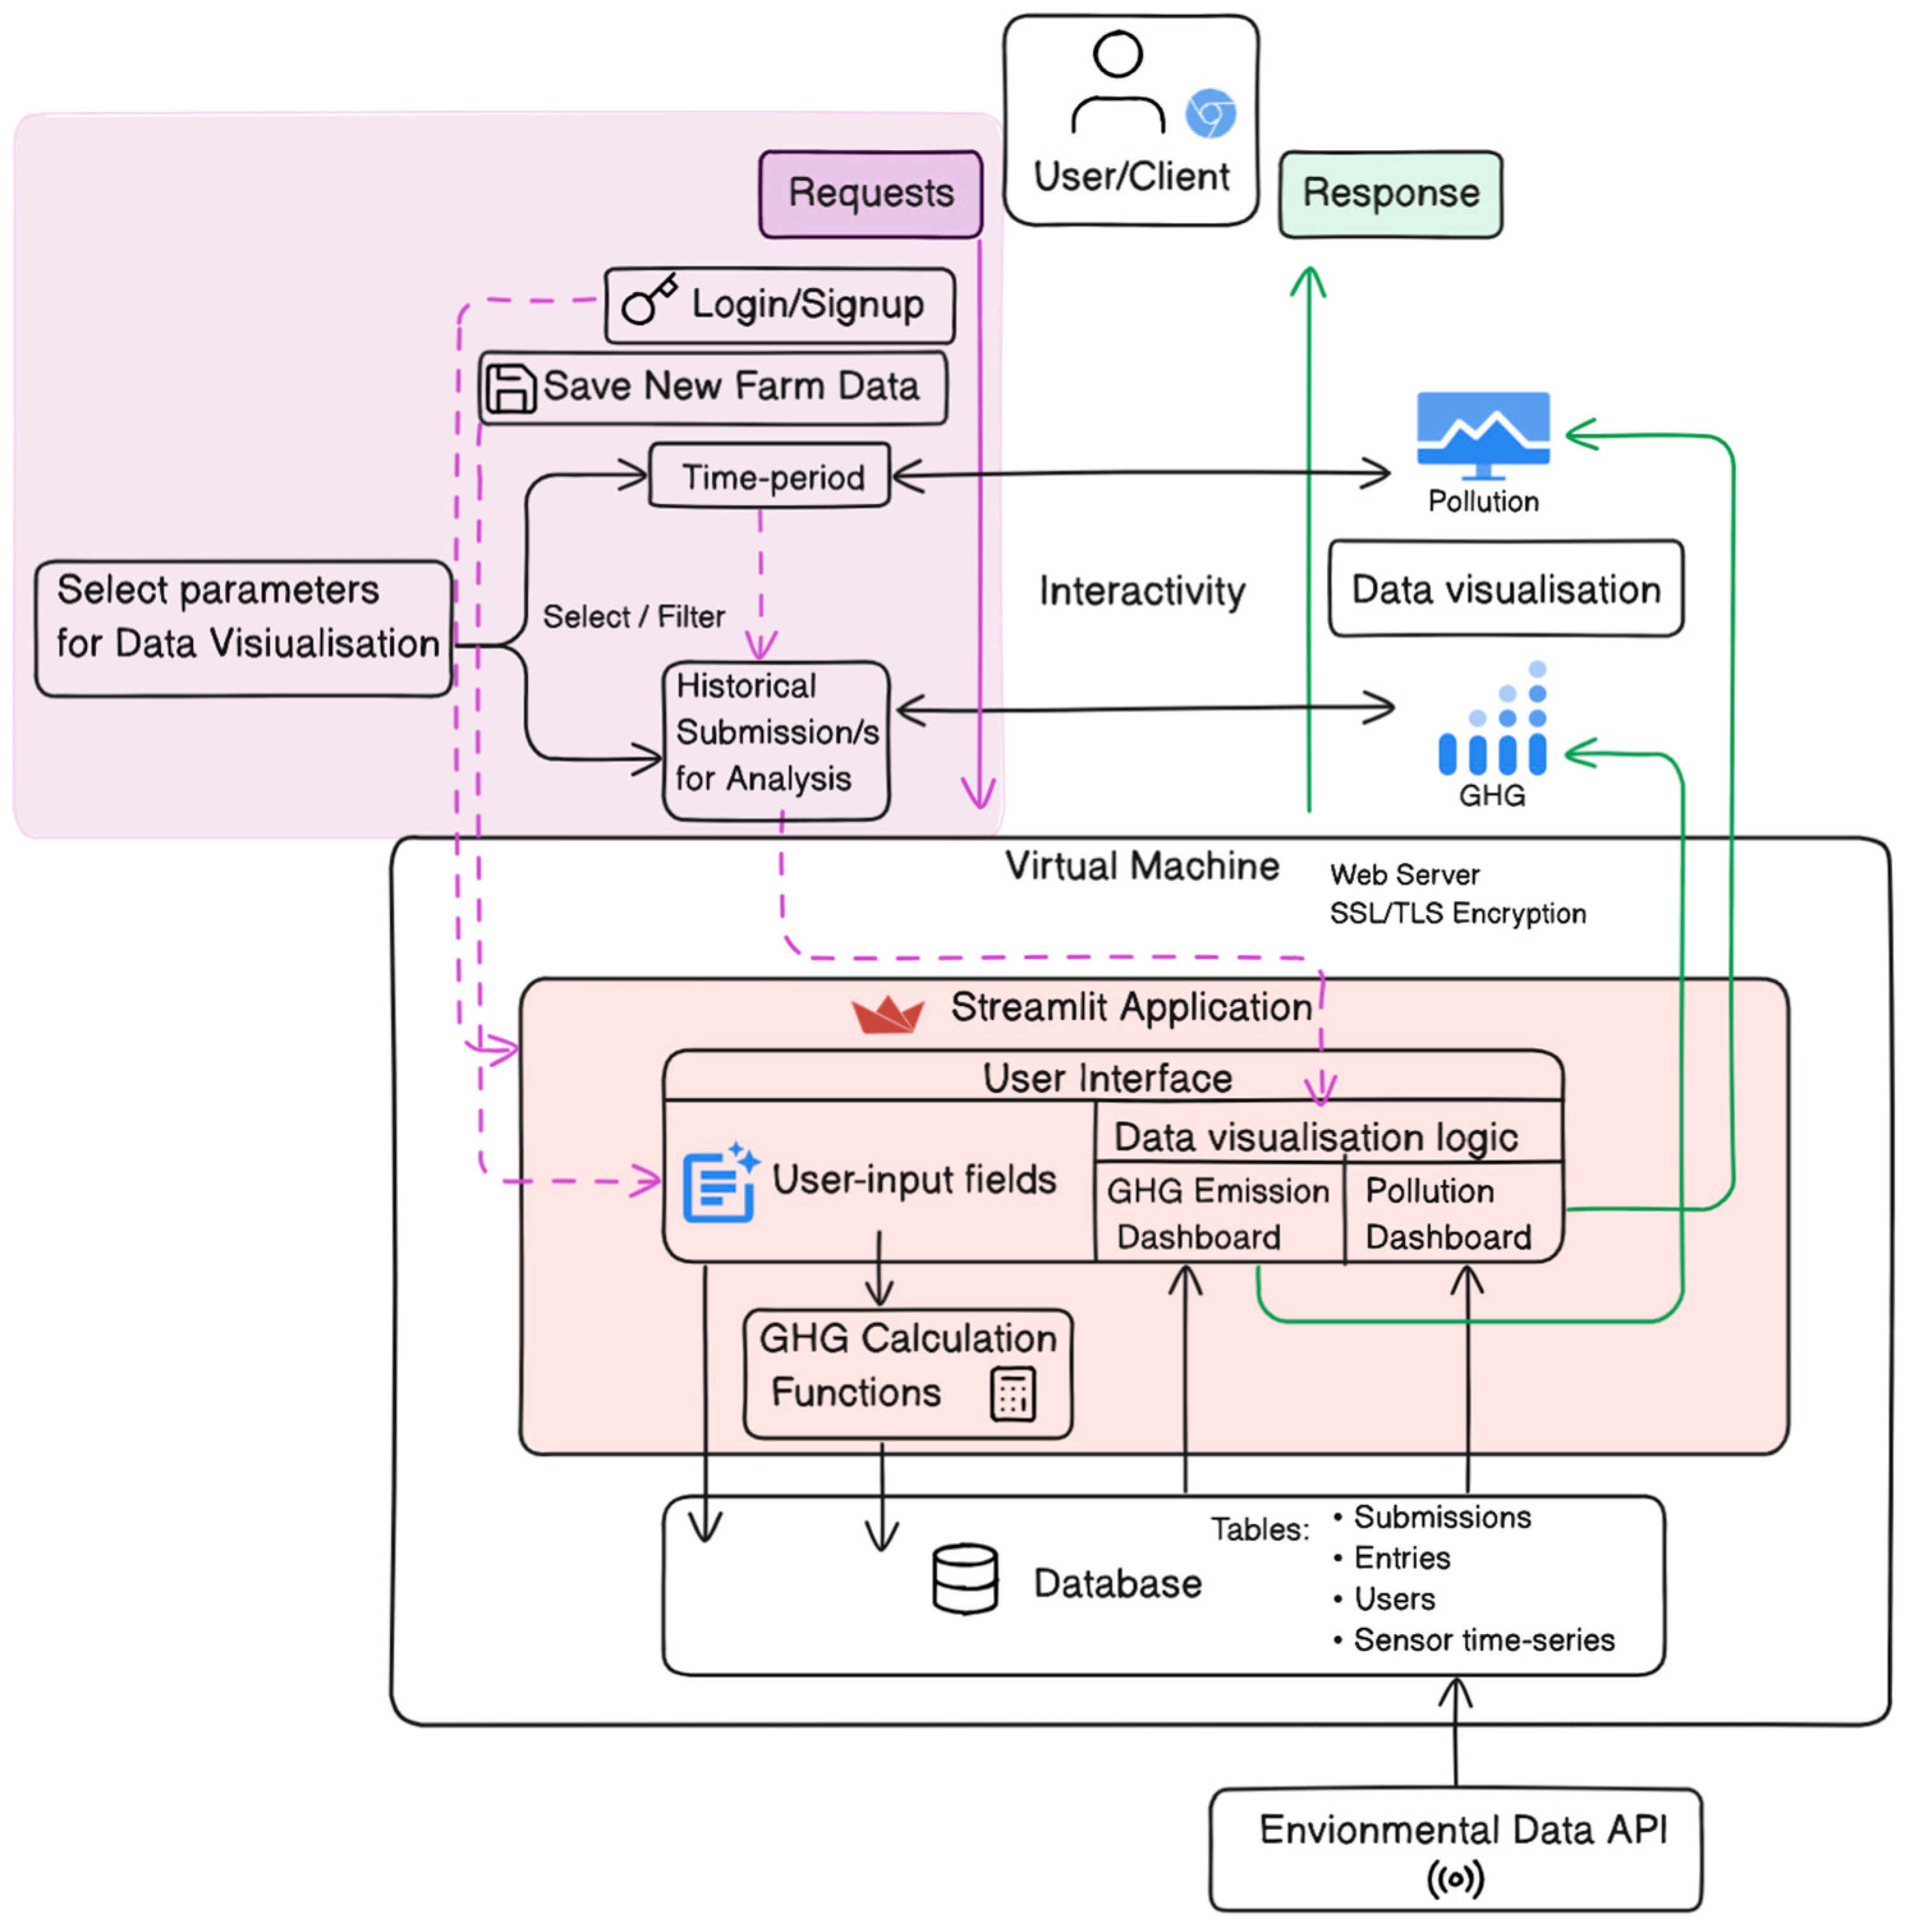
2.3. GHG Emissions Data Flow—From User Input to Output
2.4. Air Pollutants
2.5. Waste and Water Environmental Indicators
3. Results
3.1. User Flow and Application Logic
3.2. Prerequisite Software Components for the Solution4Farming Web App
3.2.1. Application Web Framework
3.2.2. Deployment and Security
3.3. User Management
3.4. Saving New Farm Data
3.4.1. User Input Form
3.4.2. Session State Management
3.4.3. Final Submission
3.5. Greenhouse Gas Calculation Functions
3.6. Database Architecture
3.6.1. Tables
- Users: this table is dedicated to storing user-related information, primarily their login credentials and other relevant data;
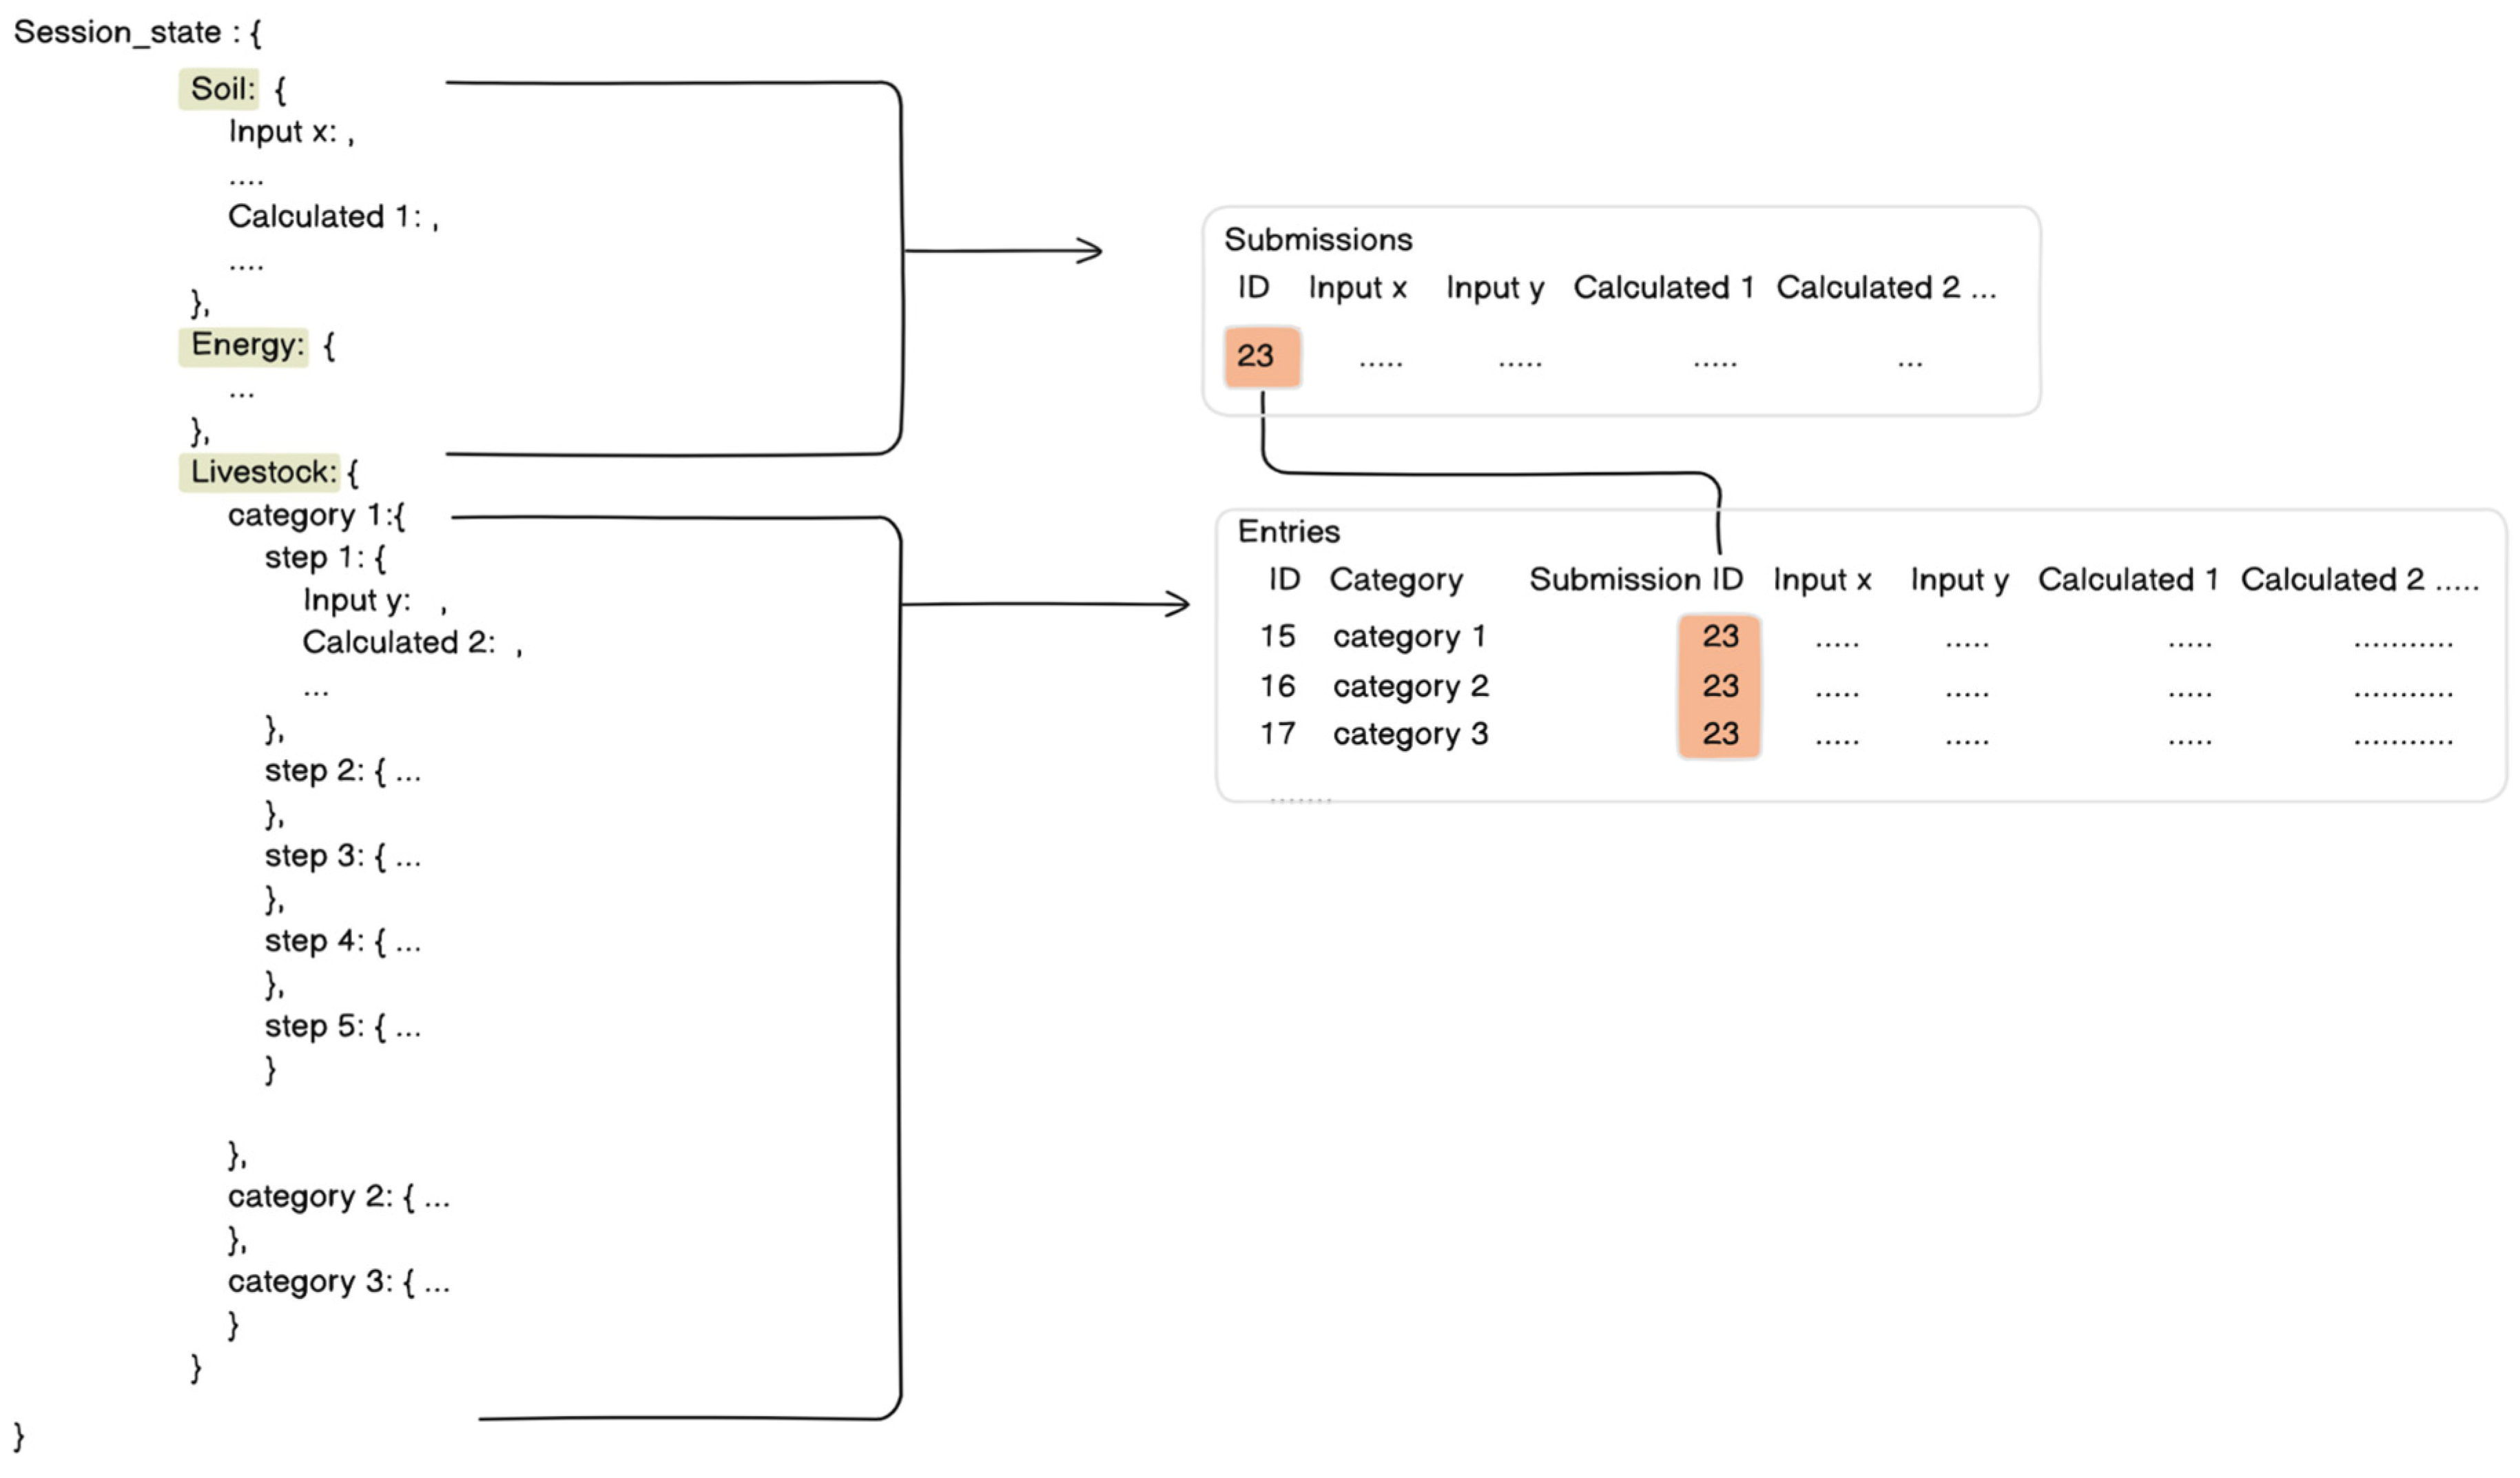
- Submissions: Each submission captures a snapshot of user input at a specific time and date. It stores raw data and calculates emissions for soil and energy; it also holds references to the corresponding livestock emissions data entries in the entries table;
- Entries: acts as a repository for livestock related data, capturing raw user inputs, intermediary calculations, and final GHG emissions values for each livestock category;
- Sensors: contains the readings for the sensors at the specified intervals (timestamp column) for the individual users (user column).
3.6.2. Relational Structure
3.7. Data Processing and Visualization
3.7.1. Data Retrieval
3.7.2. Data Transformation and Comprehensive Emission Profiling
3.7.3. Plotly Visualization
- I.
- GHG Emissions Dashboard
- (a)
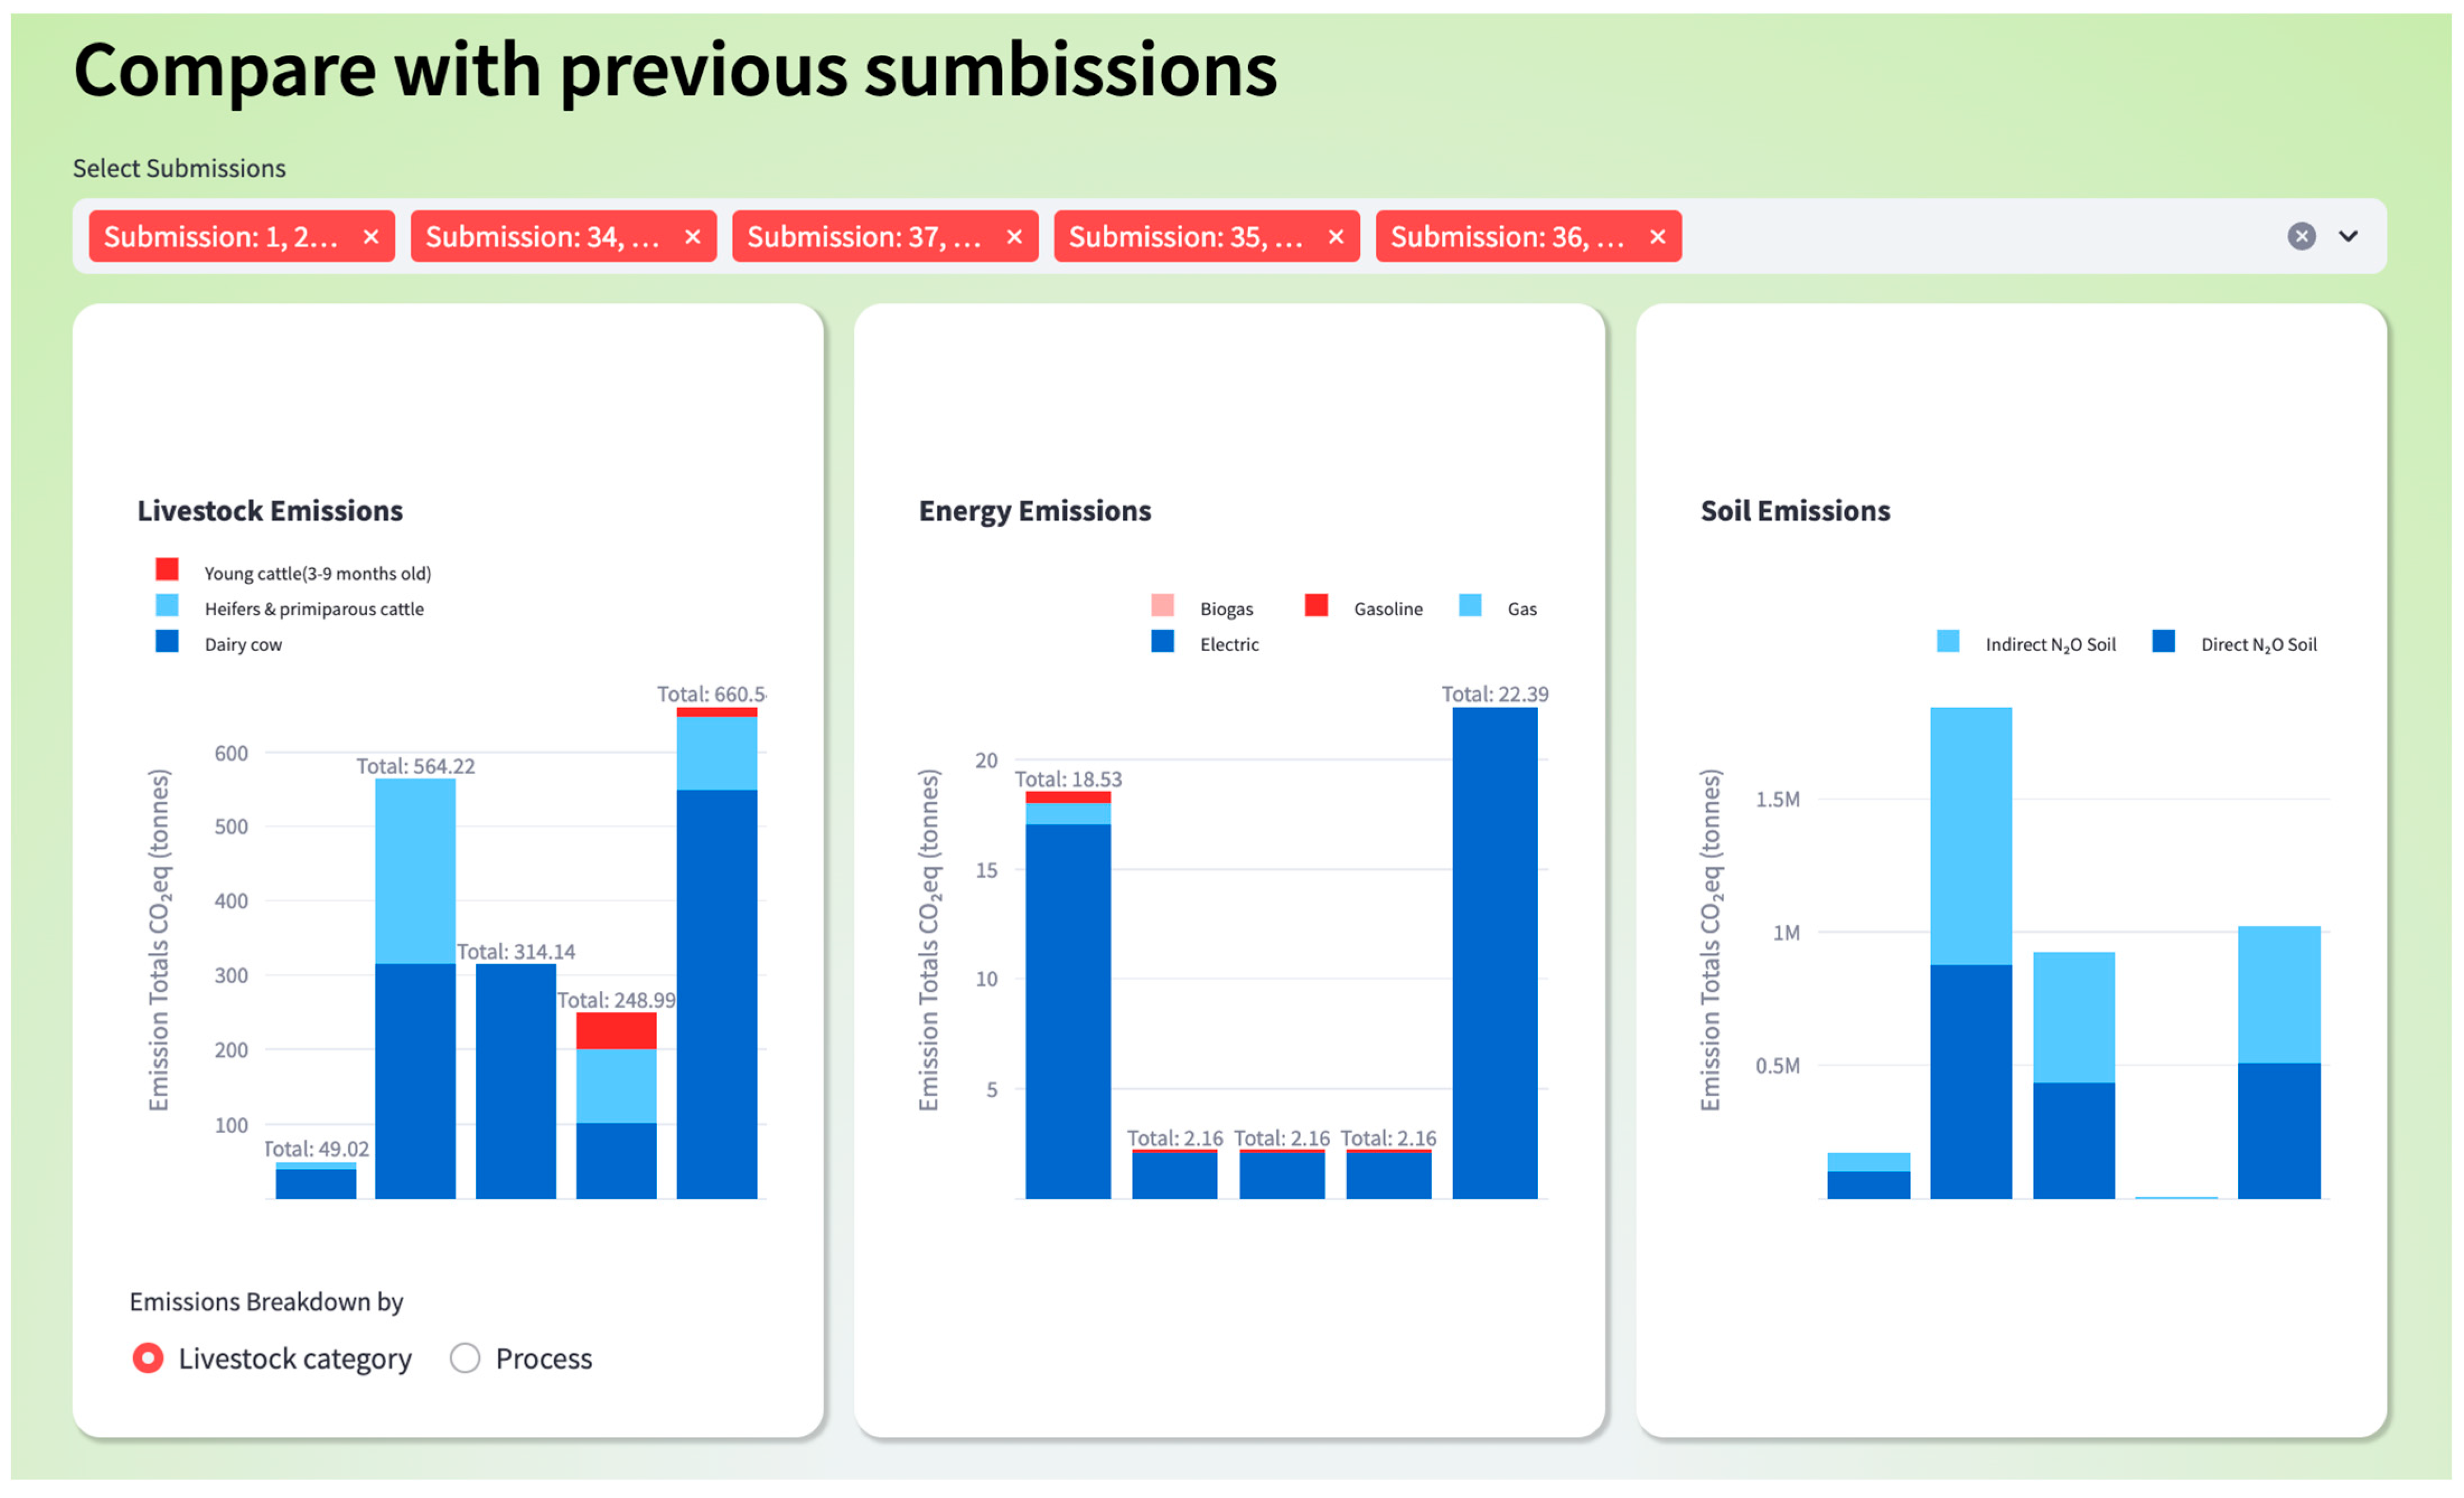
- Comparison with own historical data (Figure 8): the first visualization aids in comparing emissions over time, essentially comparing past submissions in between them, each one representing a parallel bar. These bars appear chronological and are each composed of colored “stacks” representing the individual aggregated sources. The user can select which historical submissions to show (multiple selections). This essentially shows the evolution of farm emissions;
- (b)
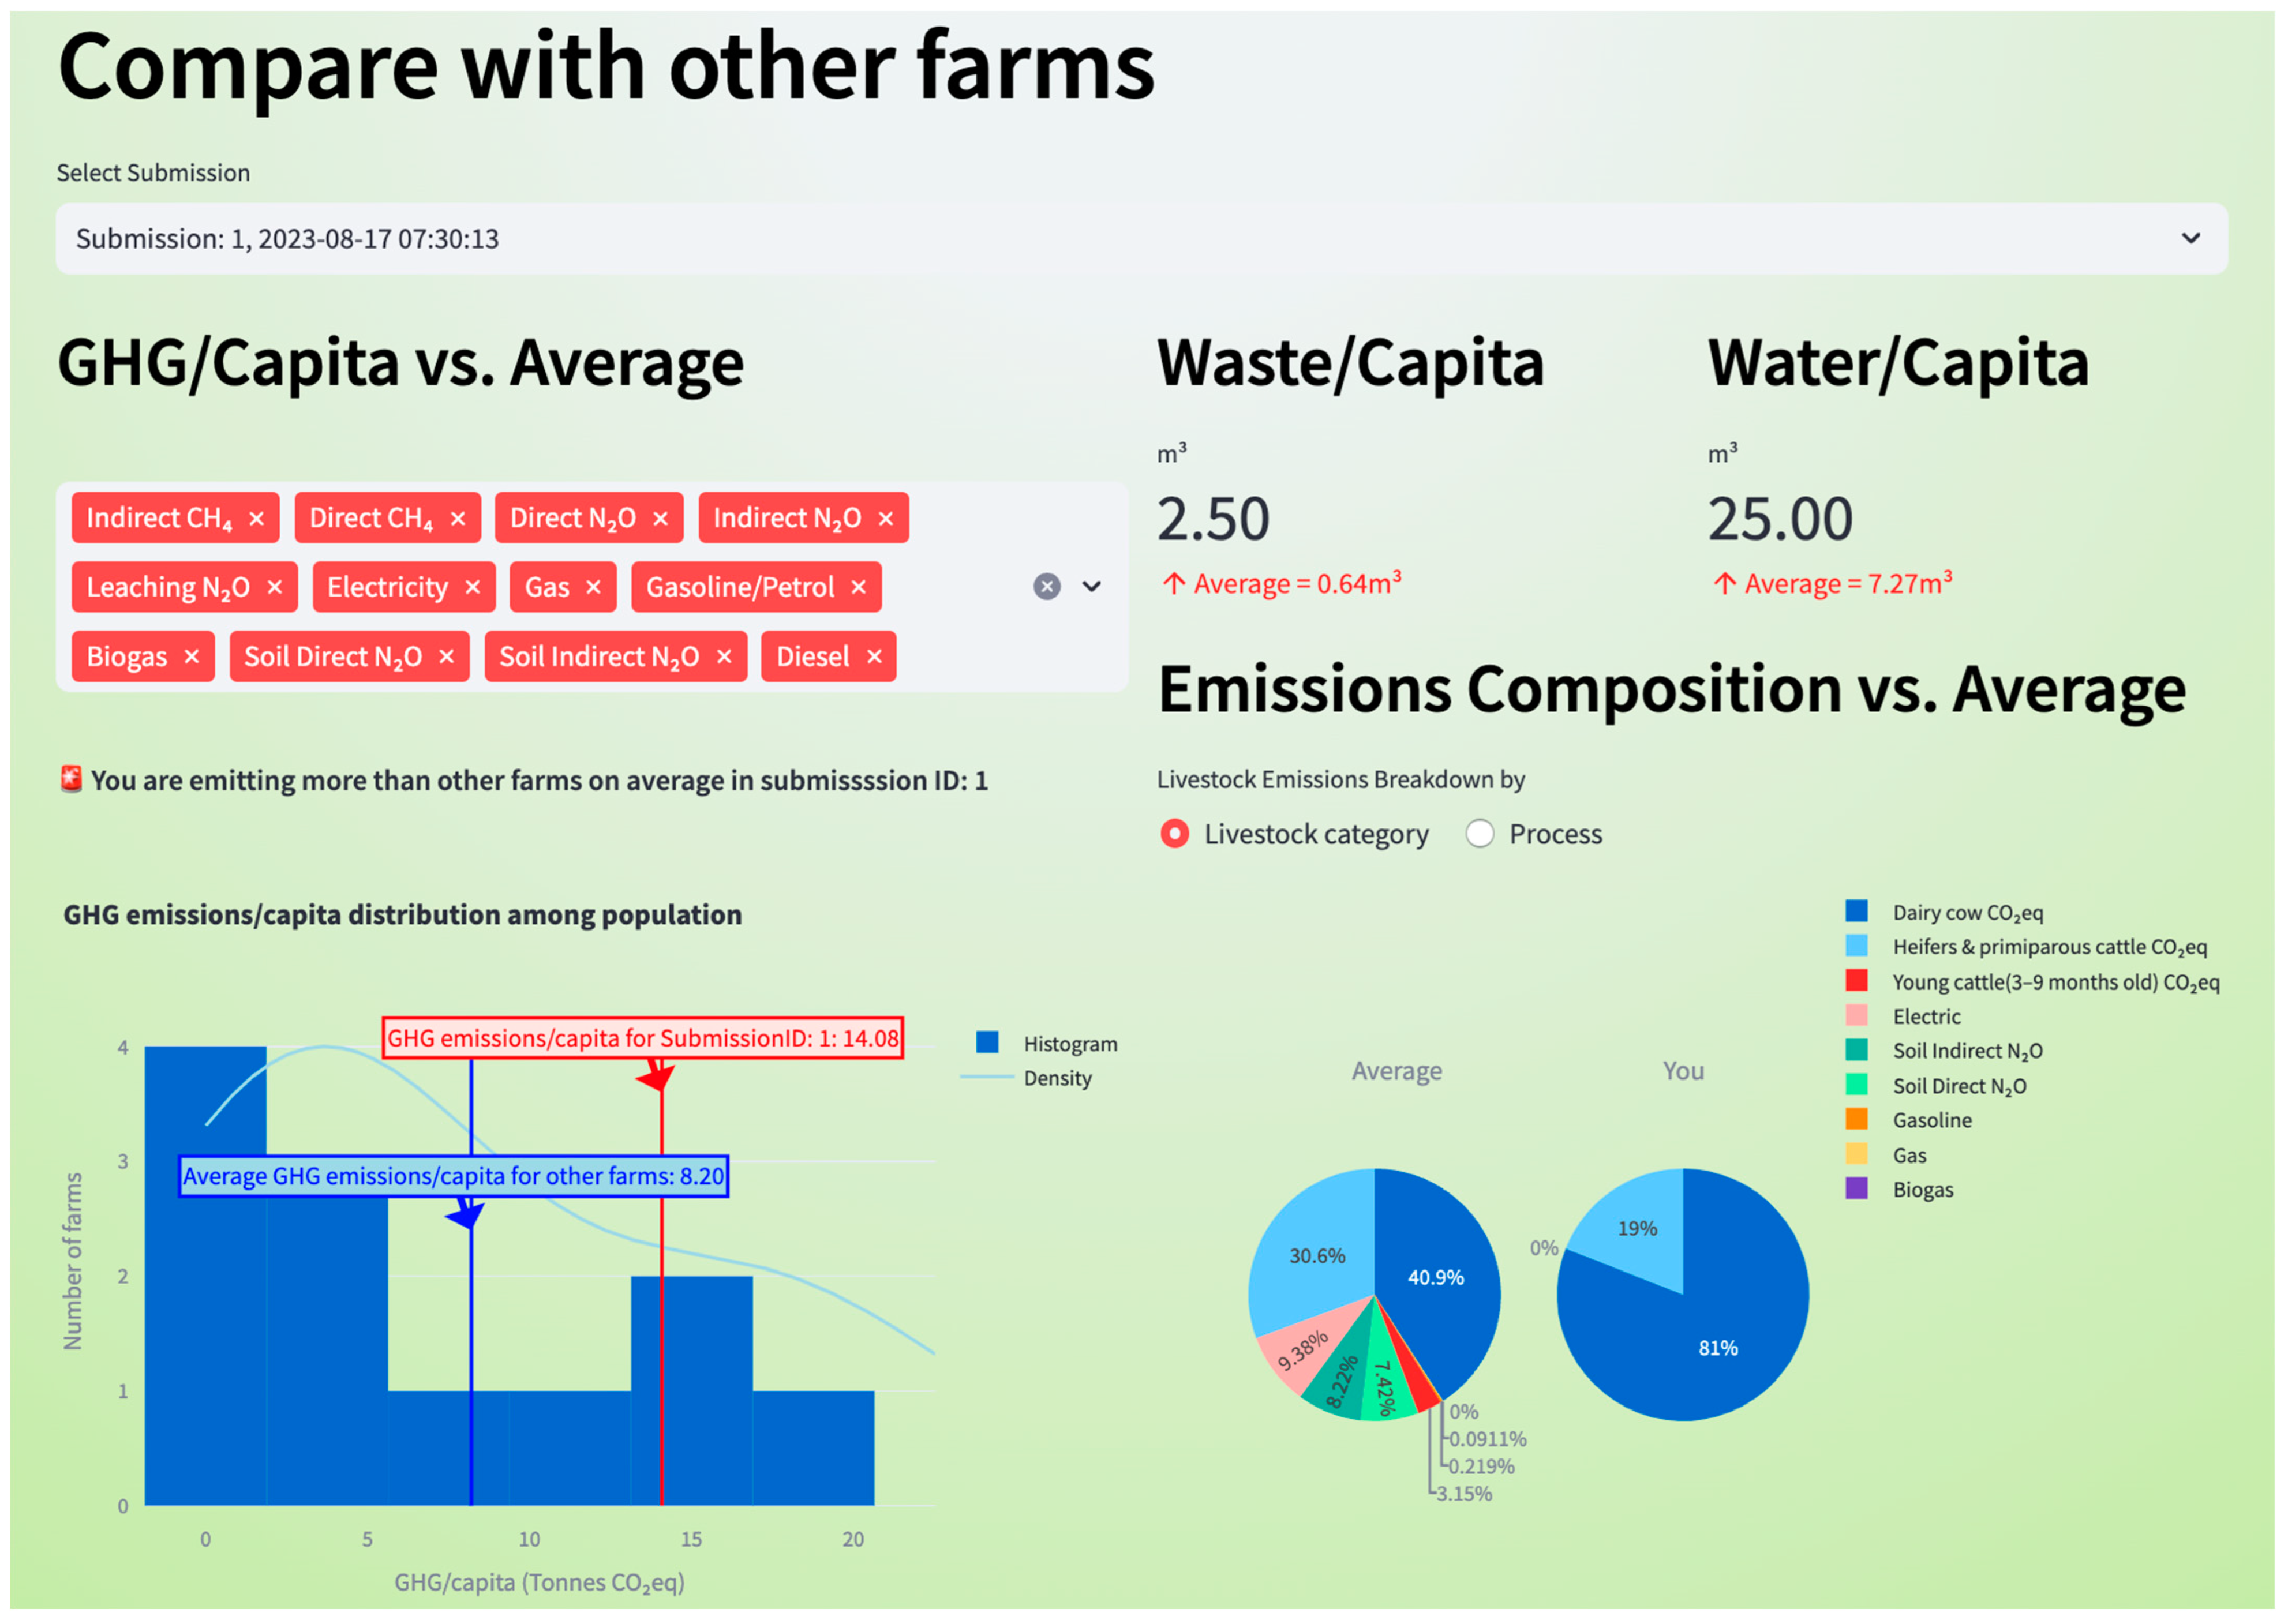
- Comparison with the average values of other farms (Figure 9): the second part of the GHG Dashboard aids in the positioning of the selected individual farm submission among the average in terms of GHG performance and is formed by two visualizations and two metrics:
- User’s position on the GHG/Capita distribution: The first visualization is performed using the GHG/Capita of livestock species metric, which is an indirect indicator of how much a farm emits, scaled by its production capacity. The user can select one individual submission and view its placement in comparison with the average to see whether he emits more or less than the average. This visualization is performed by depicting a histogram of the distribution of the “GHG/capita” metric across the farm population. The average value (mean) is provided by a vertical blue line, and the value of the individual farm is provided by either a green or red vertical line, depending on whether it is higher or lower than average. This visualization’s interactivity is provided by the ability of the user to select or deselect various emission sources to see which sectors are the highest contributors;
- Composition comparison with average: The composition of emissions shows the proportions of the individual emission contributors and is represented by two side by side pie charts for both the average farm population and selected individual submissions, respectively. This graph is also interactive, so the user can include or exclude the distinct emission sources;
- Waste and water metrics: the average waste production and water consumption values are also figured next to the selected individual submission values for comparison (Waste/Capita and Water/Capita).
- II.
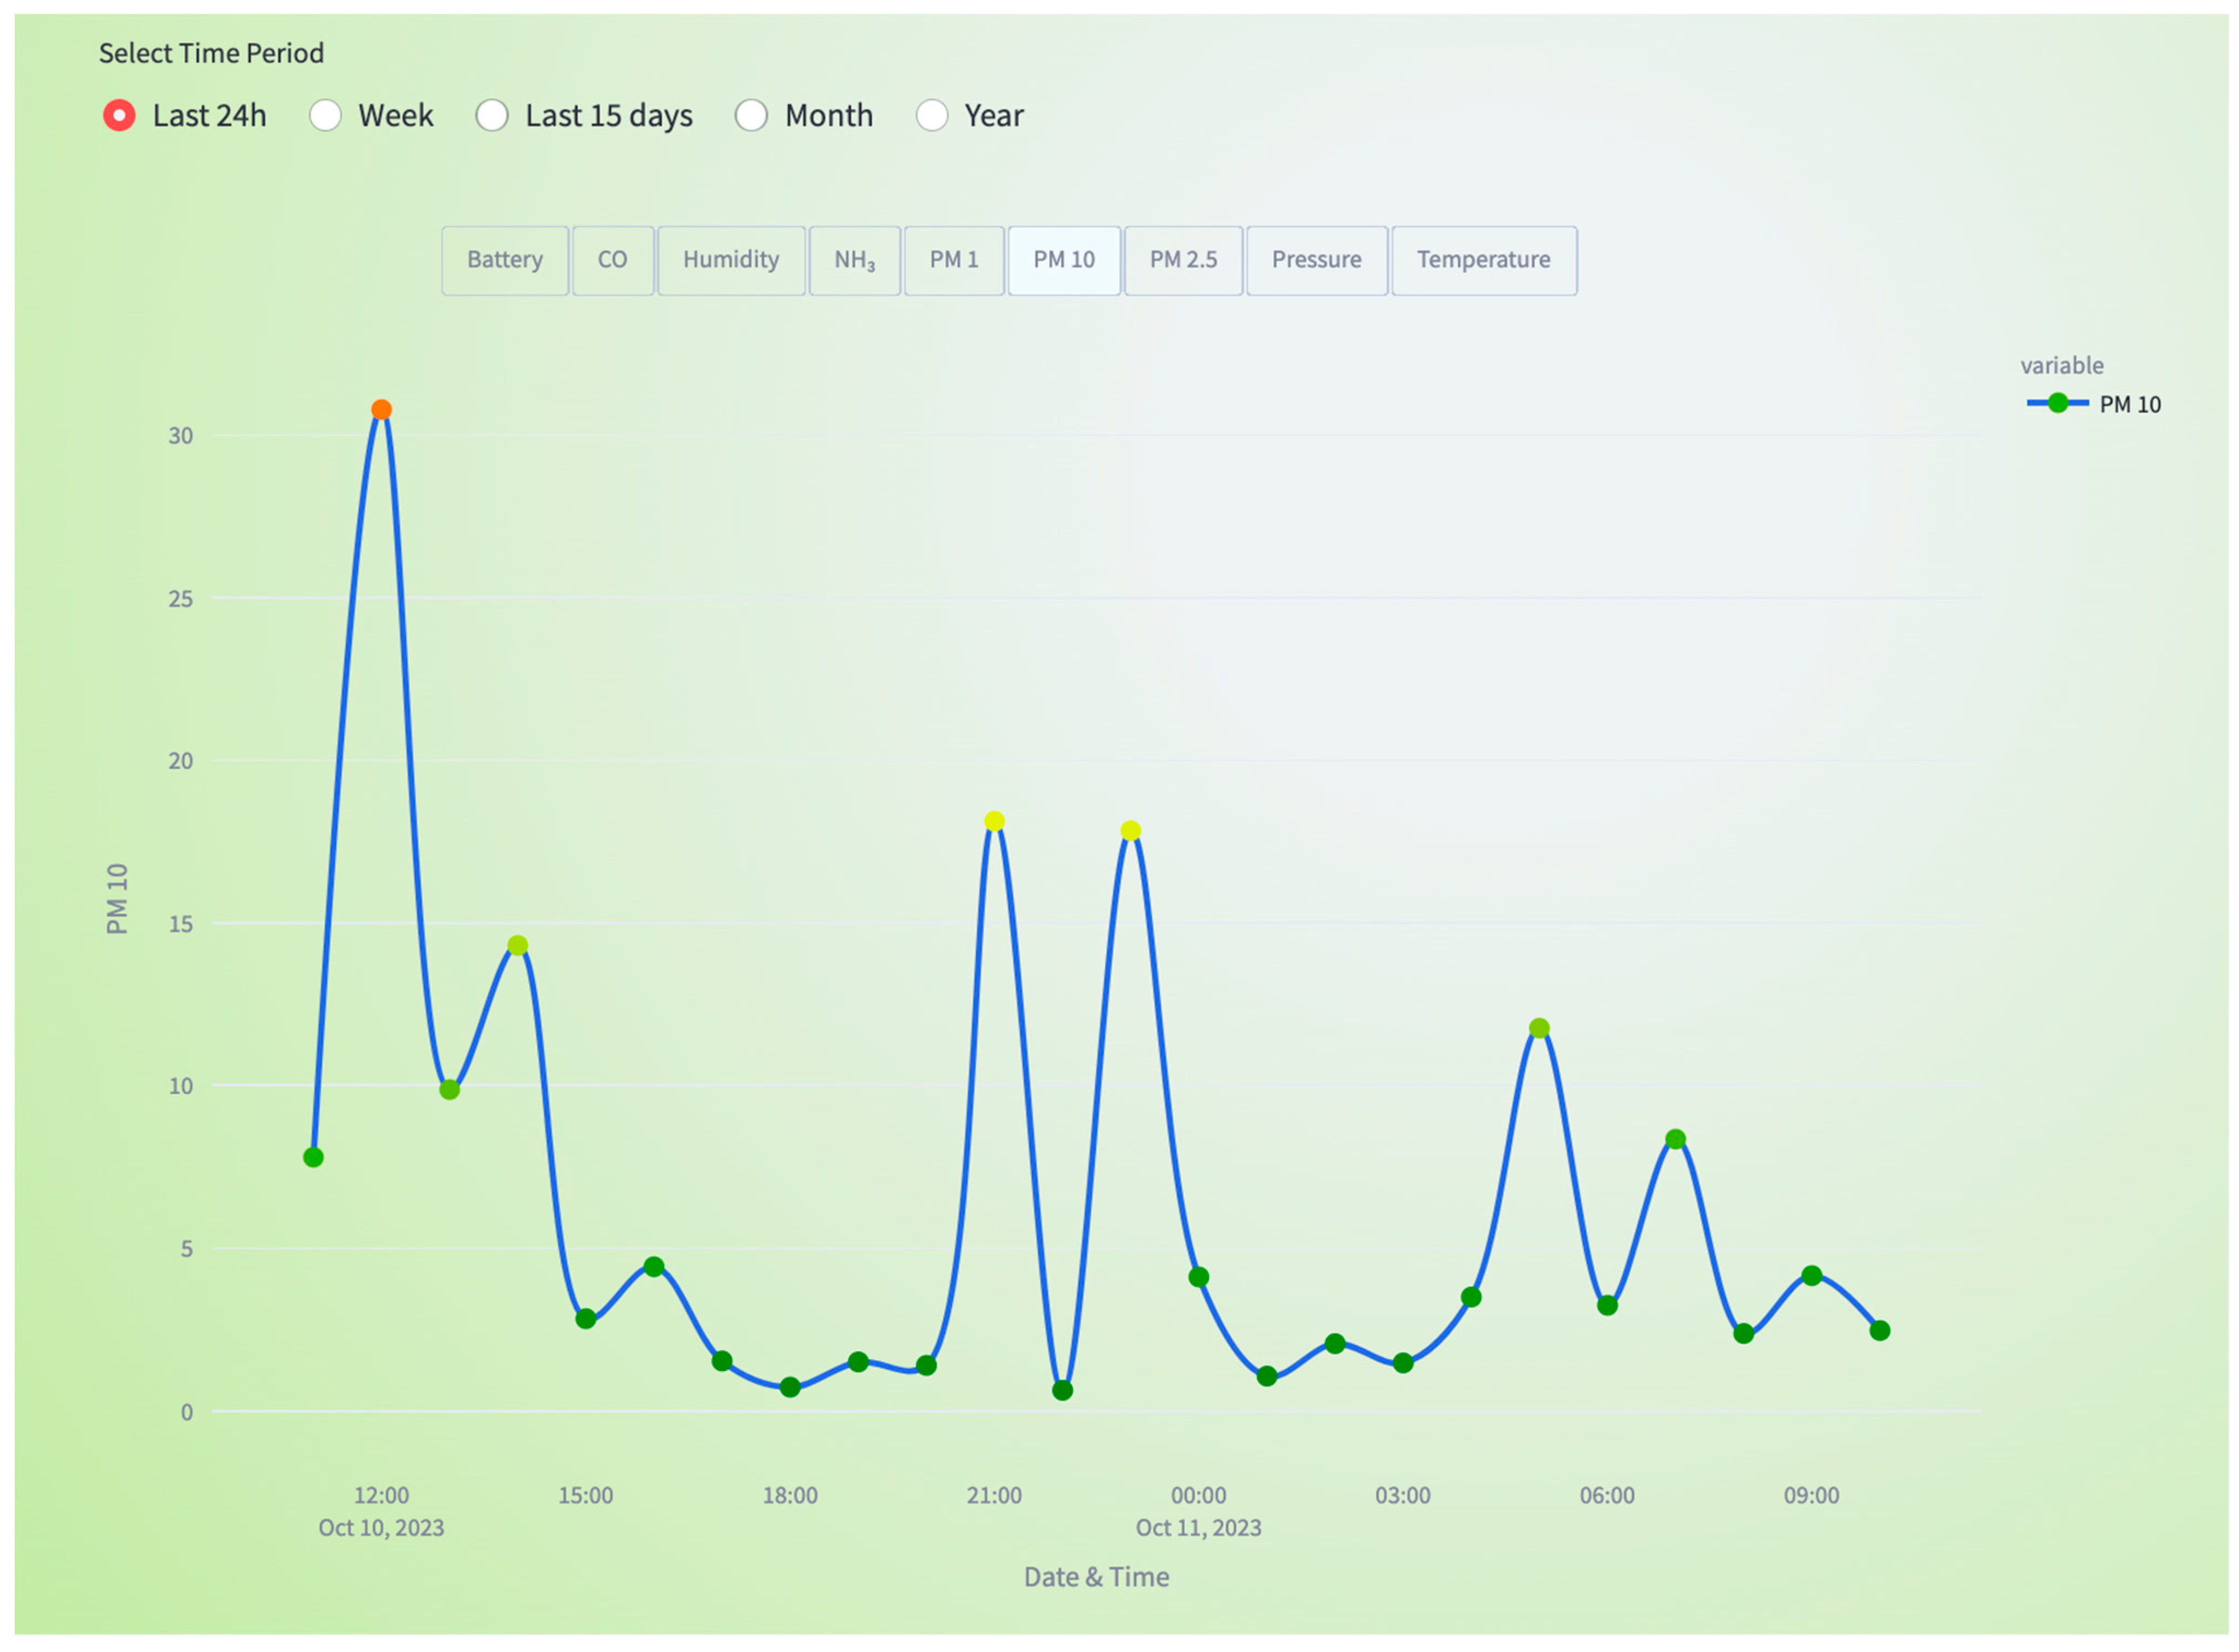
- Air Pollutant Dashboard
4. Discussion
Related Works
Supplementary Materials
Author Contributions
Funding
Data Availability Statement
Conflicts of Interest
Abbreviations
| AAP | Annual Average Population |
| AES | Advanced Encryption Standard |
| AFOLU | Agriculture, Forestry, and Other Land Use |
| AIoT | Agricultural Internet of Things |
| API | Application Programming Interface |
| CH4 | Methane |
| CO2 | Carbon dioxide |
| CO2eq | Carbon dioxide equivalents |
| DE | Digestible Energy |
| DSS | Decision Support System |
| EEA | European Environment Agency |
| EF | Emission Factor |
| GE | Gross Energy |
| GHG | Greenhouse Gases |
| HTTPS | Hypertext Transfer Protocol Secure |
| IIoT | Internet of Industrial Things |
| IoHT | Internet of Health Things |
| IPCC | Intergovernmental Panel on Climate Change |
| ISPA | International Society of Precision Agriculture |
| MCF | Methane Conversion Factor |
| MIoT | Military Internet of Things |
| N₂O | Nitrous oxide |
| Nex | Annual excretion of N (nitrogen) per livestock category |
| NH3 | Ammonia |
| PA | Precision Agriculture |
| PLF | Precision Livestock Farming |
| SQL | Structured Query Language |
| SSL | Secure Sockets Layer |
| UE | Urinary Energy |
| UNCTAD | United Nations Conference on Technology and Development |
| VM | Virtual Machine |
| VS | Volatile Solids |
References
- Kiehl, J.T.; Kevin, E. Trenberth. Earth’s annual global mean energy budget. Bull. Am. Meteorol. Soc. 1997, 78, 197–208. [Google Scholar] [CrossRef]
- Total Anthropogenic GHG Emissions (GtCO2-eq yr –1) 1990–2019. Climate Change 2022: Mitigation of Climate Change. Contribution of Working Group III to the Sixth Assessment Report of the Intergovernmental Panel on Climate Change; Chapter 2. Cambridge University Press: Cambridge, UK; New York, NY, USA; Available online: https://www.ipcc.ch/report/ar6/wg3/figures/chapter-2 (accessed on 27 November 2023).
- Lamb, W.F.; Wiedmann, T.; Pongratz, J.; Andrew, R.; Crippa, M.; Olivier, J.G.J.; Wiedenhofer, D.; Mattioli, G.; Al Khourdajie, A.; House, J.; et al. A review of trends and drivers of greenhouse gas emissions by sector from 1990 to 2018. Environ. Res. Lett. 2021, 16, 073005. [Google Scholar] [CrossRef]
- IPCC. 2023: Climate Change 2023: Synthesis Report. Contribution of Working Groups I, II and III to the Sixth Assessment Report of the Intergovernmental Panel on Climate Change; Core Writing Team, Lee, H., Romero, J., Eds.; IPCC: Geneva, Switzerland; p. 184. [CrossRef]
- Global Monitoring Laboratory. Trends in Atmospheric Methane. Available online: https://gml.noaa.gov/ccgg/trends_ch4/ (accessed on 26 October 2022).
- Climate and Clean Air Coalition. Global Methane Assessment (Full Report). Available online: https://www.ccacoalition.org/en/resources/global-methane-assessment-full-report (accessed on 26 October 2022).
- Wang, W.; Ren, J.; Li, X.; Li, H.; Li, D.; Li, H.; Song, Y. Enrichment experiment of ventilation air methane (0.5%) by the mechanical tower. Sci. Rep. 2020, 10, 7276. [Google Scholar] [CrossRef] [PubMed]
- Tian, H.Q.; Xu, R.T.; Canadell, J.G.; Thompson, R.L.; Winiwarter, W.; Suntharalingam, P.; Davidson, E.A.; Ciais, P.; Jackson, R.B.; Janssens-Maenhout, G.; et al. A comprehensive quantification of global nitrous oxide sources and sinks. Nature 2020, 586, 248–256. [Google Scholar] [CrossRef] [PubMed]
- Kumari, S.; Fagodiya, R.K.; Hiloidhari, M.; Dahiya, R.P.; Kumar, A. Methane production and estimation from livestock husbandry: A mechanistic understanding and emerging mitigation options. Sci. Total. Environ. 2020, 709, 136135. [Google Scholar] [CrossRef] [PubMed]
- Svertoka, E.; Bălănescu, M.; Suciu, G.; Pasat, A.; Drosu, A. Decision Support Algorithm Based on the Concentrations of Air Pollutants Visualization. Sensors 2020, 20, 5931. [Google Scholar] [CrossRef]
- Dourado, C.M.J.M.; Da Silva, S.P.P.; Da Nobrega, R.V.M.; Filho, P.P.R.; Muhammad, K.; De Albuquerque, V.H.C. An Open IoHT-Based Deep Learning Framework for Online Medical Image Recognition. IEEE J. Sel. Areas Commun. 2020, 39, 541–548. [Google Scholar] [CrossRef]
- Mamdouh, M.; Awad, A.I.; Khalaf, A.A.; Hamed, H.F. Authentication and Identity Management of IoHT Devices: Achievements, Challenges, and Future Directions. Comput. Secur. 2021, 111, 102491. [Google Scholar] [CrossRef]
- Svertoka, E.; Saafi, S.; Rusu-Casandra, A.; Burget, R.; Marghescu, I.; Hosek, J.; Ometov, A. Wearables for Industrial Work Safety: A Survey. Sensors 2021, 21, 3844. [Google Scholar] [CrossRef]
- Boyes, H.; Hallaq, B.; Cunningham, J.; Watson, T. The industrial internet of things (IIoT): An analysis framework. Comput. Ind. 2018, 101, 1–12. [Google Scholar] [CrossRef]
- Yushi, L.; Fei, J.; Hui, Y. Study on application modes of military Internet of Things (MIOT). In Proceedings of the 2012 IEEE International Conference on Computer Science and Automation Engineering (CSAE), Zhangjiajie, China, 25–27 May 2012; pp. 630–634. [Google Scholar]
- Castrignanò, A.; Buttafuoco, G.; Khosla, R.; Mouazen, A.M.; Moshou, D.; Naud, O. Agricultural Internet of Things and Decision Support for Precision Smart Farming; Elsevier BV: Amsterdam, The Netherlands, 2020; ISBN 9780128183731. [Google Scholar]
- Precision Ag Definition. International Society of Precision Agriculture. Available online: https://ispag.org/about/definition (accessed on 26 October 2022).
- Niloofar, P.; Lazarova-Molnar, S.; Francis, D.P.; Vulpe, A.; Suciu, G.; Balanescu, M. Modeling and Simulation for Decision Support in Precision Livestock Farming. In Proceedings of the 2020 Winter Simulation Conference (WSC), Orlando, FL, USA, 14–18 December 2020; pp. 2601–2612. [Google Scholar]
- Sass, R.L.; Fisher, F.M., Jr. Methane emissions from rice paddies: A process study summary. Nutr. Cycl. Agroecosyst. 1997, 49, 119–127. [Google Scholar] [CrossRef]
- Zhang, X.; Fang, Q.; Zhang, T.; Ma, W.; Velthof, G.L.; Hou, Y.; Oenema, O.; Zhang, F. Benefits and trade-offs of replacing synthetic fertilizers by animal manures in crop production in China: A meta-analysis. Glob. Chang. Biol. 2020, 26, 888–900. [Google Scholar] [CrossRef] [PubMed]
- Chai, R.; Ye, X.; Ma, C.; Wang, Q.; Tu, R.; Zhang, L.; Gao, H. Greenhouse gas emissions from synthetic nitrogen manufacture and fertilization for main upland crops in China. Carbon Balance Manag. 2019, 14, 20. [Google Scholar] [CrossRef] [PubMed]
- Bergström, L.; Kirchmann, H.; Aronsson, H.; Torstensson, G.; Mattsson, L. Use Efficiency and Leaching of Nutrients in Organic and Conventional Cropping Systems in Sweden. In Organic Crop Production—Ambitions and Limitations; Kirchmann, H., Bergström, L., Eds.; Springer: Amsterdam, The Netherlands, 2008; pp. 143–159. [Google Scholar] [CrossRef]
- Vu, Q.D.; de Neergaard, A.; Tran, T.D.; Hoang, Q.Q.; Ly, P.; Tran, T.M.; Jensen, L.S. Manure, biogas digestate and crop residue management affects methane gas emissions from rice paddy fields on Vietnamese smallholder livestock farms. Nutr. Cycl. Agroecosystems 2015, 103, 329–346. [Google Scholar] [CrossRef]
- Zschornack, T.; Bayer, C.; Zanatta, J.A.; Vieira, F.C.B.; Anghinoni, I. Mitigation of methane and nitrous oxide emissions from flood-irrigated rice by no incorporation of winter crop residues into the soil. Rev. Bras. Ciência Solo 2011, 35, 623–634. [Google Scholar] [CrossRef]
- Zia-ur-Rehman, M.; Murtaza, G.; Qayyum, M.F.; Saifullah; Rizwan, M.; Ali, S.; Akmal, F.; Khalid, H. Degraded soils: Origin, types and management. In Soil Science: Agricultural and Environmental Prospectives; Springer: Berlin/Heidelberg, Germany, 2016; pp. 23–65. [Google Scholar]
- Food and Agriculture Organization of United Nations. Monitoring and Assessment of Greenhouse Gas Emissions and Mitigation Potential in Agriculture: The New GHG Emissions Dat$abase in FAOSTAT. Available online: https://www.fao.org/fileadmin/templates/ess/documents/afcas23/Presentations/AFCAS_7d_GHG.pdf (accessed on 26 October 2022).
- Diosdado, J.A.V.; Barker, Z.E.; Hodges, H.R.; Amory, J.R.; Croft, D.P.; Bell, N.J.; Codling, E.A. Classification of behaviour in housed dairy cows using an accelerometer-based activity monitoring system. Anim. Biotelem. 2015, 3, 15. [Google Scholar] [CrossRef]
- Campos, D.P.; Abatti, P.J.; Bertotti, F.L.; Hill, J.A.G.; da Silveira, A.L.F. Surface electromyography segmentation and feature extraction for ingestive behavior recognition in ruminants. Comput. Electron. Agric. 2018, 153, 325–333. [Google Scholar] [CrossRef]
- Pegorini, V.; Karam, L.Z.; Pitta, C.S.R.; Cardoso, R.; Da Silva, J.C.C.; Kalinowski, H.J.; Ribeiro, R.; Bertotti, F.L.; Assmann, T.S. In Vivo Pattern Classification of Ingestive Behavior in Ruminants Using FBG Sensors and Machine Learning. Sensors 2015, 15, 28456–28471. [Google Scholar] [CrossRef]
- Suciu, G.; Bălănescu, M.; Pasat, A. Design of a Decision Support System for Improving Air Quality Assessment. In Proceedings of the 2018 Air and Water Components of the Environment Conference, Coruña, Spain, 22–24 May 2018; pp. 221–227. [Google Scholar]
- Pollution Alert. Air Pollution in Poland: Real-Time Air Quality Index and Smog Alert. Available online: https://www.pollution-alert.com/en/poland/pollution (accessed on 26 October 2022).
- Finish Meteorological Institute. Air Quality Index. Available online: https://en.ilmatieteenlaitos.fi/air-quality-index (accessed on 26 October 2022).
- Balanescu, M.; Badicu, A.; Suciu, G.; Poenaru, C.; Pasat, A.; Vulpe, A.; Vochin, M. Decision Support Platform for Intelligent and Sustainable Farming. In Proceedings of the 26th International Symposium for Design and Technology in Electronic Packaging (SIITME), Pitesti, Romania, 21–24 October 2020; pp. 89–93. [Google Scholar]
- Agrecalc the Farm Carbon Calculator. Agrecalc. Available online: https://www.agrecalc.com/ (accessed on 26 October 2022).
- Serebrennikov, D.; Thorne, F.; Kallas, Z.; McCarthy, S.N. Factors Influencing Adoption of Sustainable Farming Practices in Europe: A Systemic Review of Empirical Literature. Sustainability 2020, 12, 9719. [Google Scholar] [CrossRef]
- Zaman, M.; Heng, L.; Müller, C. Climate-Smart Agriculture Practices for Mitigating Greenhouse Gas Emissions. In Measuring Emission of Agricultural Greenhouse Gases and Developing Mitigation Options using Nuclear and Related Techniques; Springer: Berlin/Heidelberg, Germany, 2021; pp. 303–328. [Google Scholar]
- Alexandropoulos, E.; Anestis, V.; Dragoni, F.; Hansen, A.; Cummins, S.; O’Brien, D.; Amon, B.; Bartzanas, T. Decision Support Systems Based on Gaseous Emissions and Their Impact on the Sustainability Assessment at the Livestock Farm Level: An Evaluation from the User’s Side. Sustainability 2023, 15, 13041. [Google Scholar] [CrossRef]
- Thumba, D.A.; Lazarova-Molnar, S.; Niloofar, P. Data-driven Decision Support Tools for Reducing GHG Emissions from Livestock Production Systems: Overview and Challenges. In Proceedings of the 7th International Conference on Internet of Things: Systems, Management and Security (IOTSMS), Paris, France, 14–16 December 2020; pp. 1–8. [Google Scholar]
- Zawartka, P.; Burchart-Korol, D.; Blaut, A. Model of Carbon Footprint Assessment for the Life Cycle of the System of Wastewater Collection, Transport and Treatment. Sci. Rep. 2020, 10, 5799. [Google Scholar] [CrossRef] [PubMed]
- De Olde, E.M.; Oudshoorn, F.W.; Sørensen, C.A.; Bokkers, E.A.; de Boer, I.J. Assessing sustainability at farm-level: Lessons learned from a comparison of tools in practice. Ecol. Indic. 2016, 66, 391–404. [Google Scholar] [CrossRef]
- Lundström, C.; Lindblom, J. Considering farmers' situated knowledge of using agricultural decision support systems (AgriDSS) to Foster farming practices: The case of CropSAT. Agric. Syst. 2018, 159, 9–20. [Google Scholar] [CrossRef]
- Reiter, D.; Meyer, W.; Parrott, L. Stakeholder engagement with environmental decision support systems: The perspective of end users. Can. Geogr. 2019, 63, 631–642. [Google Scholar] [CrossRef]
- Rose, D.C.; Sutherland, W.J.; Parker, C.; Lobley, M.; Winter, M.; Morris, C.; Twining, S.; Ffoulkes, C.; Amano, T.; Dicks, L.V. Decision support tools for agriculture: Towards effective design and delivery. Agric. Syst. 2016, 149, 165–174. [Google Scholar] [CrossRef]
- Richards, M.; Metzel, R.; Chirinda, N.; Ly, P.; Nyamadzawo, G.; Vu, Q.D.; de Neergaard, A.; Oelofse, M.; Wollenberg, E.; Keller, E.; et al. Limits of agricultural greenhouse gas calculators to predict soil N2O and CH4 fluxes in tropical agriculture. Sci. Rep. 2016, 6, 26279. [Google Scholar] [CrossRef]
- Kolasa-Więcek, A. Neural Modeling of Greenhouse Gas Emission from Agricultural Sector in European Union Member Countries. Water Air Soil Pollut. 2018, 229, 205. [Google Scholar] [CrossRef]
- Hempel, S.; Adolphs, J.; Landwehr, N.; Janke, D.; Amon, T. How the Selection of Training Data and Modeling Approach Affects the Estimation of Ammonia Emissions from a Naturally Ventilated Dairy Barn—Classical Statistics versus Machine Learning. Sustainability 2020, 12, 1030. [Google Scholar] [CrossRef]
- Eggleston, S.; Buendia, L.; Miwa, K. 2006 IPCC Guidelines for National Greenhouse Gas Inventories: Intergovernmental Panel on Climate Change. Hayama-machi (Kanagawa-ken): The Institute for Global Environmental Strategies; IPCC: Geneva, Switzerland, 2006. [Google Scholar]
- Wolff, J. How Is Technology Changing the World, and How Should the World Change Technology? Glob. Perspect. 2021, 2, 27353. [Google Scholar] [CrossRef]
- Bhagat, P.R.; Naz, F.; Magda, R. Artificial intelligence solutions enabling sustainable agriculture: A bibliometric analysis. PLoS ONE 2022, 17, e0268989. [Google Scholar] [CrossRef]
- United Nations Conference on Technology and Development. Technology and Innovation Report. Available online: https://unctad.org/system/files/official-document/tir2020_en.pdf (accessed on 20 October 2023).
- Del Prado, A.; Crosson, P.; Olesen, J.; Rotz, C. Whole-farm models to quantify greenhouse gas emissions and their potential use for linking climate change mitigation and adaptation in temperate grassland ruminant-based farming systems. Animal 2013, 7, 373–385. [Google Scholar] [CrossRef] [PubMed]
- Wang, Y.; Saikawa, E.; Avramov, A.; Hill, N.S. Agricultural Greenhouse Gas Fluxes Under Different Cover Crop Systems. Front. Clim. 2022, 3, 742320. [Google Scholar] [CrossRef]
- Feng, J.; Li, F.; Zhou, X.; Xu, C.; Ji, L.; Chen, Z.; Fang, F. Impact of agronomy practices on the effects of reduced tillage systems on CH4 and N2O emissions from agricultural fields: A global meta-analysis. PLoS ONE 2018, 13, e0196703. [Google Scholar] [CrossRef] [PubMed]
- Schwarz, D.; Harrison, M.T.; Katsoulas, N. Editorial: Greenhouse Gas Emissions Mitigation From Agricultural and Horticultural Systems. Front. Sustain. Food Syst. 2022, 6, 842848. [Google Scholar] [CrossRef]
- Cambra-López, M.; Aarnink, A.J.A.; Zhao, Y.; Calvet, S.; Torres, A.G. Airborne particulate matter from livestock production systems: A review of an air pollution problem. Environ. Pollut. 2010, 158, 1–17. [Google Scholar] [CrossRef]

| № | Metric | Sensor Type/Measurement Technique | Group C—Crop, L—Livestock, and E—Environment | Ref. | |
|---|---|---|---|---|---|
| 1 | Size of the animal | L | |||
| 2 | Temperature of the animal | L | |||
| 3 | Sounds | L | |||
| 4 | Movements (patterns, anomalies) | Accelerometers, pedometers | L | [27] | |
| 5 | Food intake/quality of food | Registration for EMG data on masticatory muscles | L | [28] | |
| 6 | Portion size | L | |||
| 7 | Chewing patterns | Fiber Bragg grating sensors (FBG) | L | [29] | |
| 8 | Soil moisture | C | |||
| 9 | Fertilizer intake | C | |||
| 10 | Temperature | Temperature/humidity sensors | E | ||
| 11 | Humidity | Temperature/humidity sensors | E | ||
| 12 | Air Quality Index (AQI) | CH4 | Gas sensors | E | [10] |
| N2O | |||||
| CO2 | |||||
| CO | |||||
| NH3 | |||||
| PM 1 | |||||
| PM 2.5 | |||||
| PM 10 | |||||
| 13 | Light | Ambient light sensors | E | ||
| 14 | Rainfall | E | |||
| 15 | Wind speed | E |
| Country | Set of Pollutant Gases for Index Calculation | ||||||
|---|---|---|---|---|---|---|---|
| SO2 | NO2 | O3 | CO | PM 10 | PM 2.5 | BC | |
| Poland [31] | ● | ● | ● | ● | ● | ● | ● |
| Romania [30] | ● | ● | ● | ● | ● | ||
| Spain | ● | ● | ● | ● | ● | ● | |
| Finland [32] | ● | ● | ● | ● | ● | ● | |
| Challenge | Description | Ref. |
|---|---|---|
| Large amount of data | An increase in the amount of data for analysis because of population growth, which entailed higher supply and demand for both livestock and agriculture products. | [33] |
| Heterogeneity of data | An increase in the number and types of parameters to be tracked: livestock, agricultural, environmental, economic-related metrics, etc. | [33] |
| Separation of emission footprints of different products in mixed farms | The ability to reliably segregate footprints for mixed enterprises is crucial since eco-friendly production goals are focused on a separated emission source’s impact rather than a farm-level footprint. | [34] |
| Environmental pollution by anthropogenic methane (CH4) | In the process of digestion of a ruminant (enteric fermentation), methane is released in its stomach, which is either burped or excreted from the body through flatulence. | [2] |
| Resistance to adoption innovations | [35] |
Disclaimer/Publisher’s Note: The statements, opinions and data contained in all publications are solely those of the individual author(s) and contributor(s) and not of MDPI and/or the editor(s). MDPI and/or the editor(s) disclaim responsibility for any injury to people or property resulting from any ideas, methods, instructions or products referred to in the content. |
© 2023 by the authors. Licensee MDPI, Basel, Switzerland. This article is an open access article distributed under the terms and conditions of the Creative Commons Attribution (CC BY) license (https://creativecommons.org/licenses/by/4.0/).
Share and Cite
Popa, D.C.; Laurent, Y.; Popa, R.A.; Pasat, A.; Bălănescu, M.; Svertoka, E.; Pogurschi, E.N.; Vidu, L.; Marin, M.P. A Platform for GHG Emissions Management in Mixed Farms. Agriculture 2024, 14, 78. https://doi.org/10.3390/agriculture14010078
Popa DC, Laurent Y, Popa RA, Pasat A, Bălănescu M, Svertoka E, Pogurschi EN, Vidu L, Marin MP. A Platform for GHG Emissions Management in Mixed Farms. Agriculture. 2024; 14(1):78. https://doi.org/10.3390/agriculture14010078
Chicago/Turabian StylePopa, Dana Cătălina, Yolanda Laurent, Răzvan Alexandru Popa, Adrian Pasat, Mihaela Bălănescu, Ekaterina Svertoka, Elena Narcisa Pogurschi, Livia Vidu, and Monica Paula Marin. 2024. "A Platform for GHG Emissions Management in Mixed Farms" Agriculture 14, no. 1: 78. https://doi.org/10.3390/agriculture14010078
APA StylePopa, D. C., Laurent, Y., Popa, R. A., Pasat, A., Bălănescu, M., Svertoka, E., Pogurschi, E. N., Vidu, L., & Marin, M. P. (2024). A Platform for GHG Emissions Management in Mixed Farms. Agriculture, 14(1), 78. https://doi.org/10.3390/agriculture14010078