Article

Region and Crop Type Influenced Fungal Diversity and Community Structure in Agricultural Areas in Qinghai Province

1
Key Laboratory of Medicinal Plant and Animal Resources of the Qinghai–Tibetan Plateau in Qinghai Province, Xining 810008, China
2
Academy of Plateau Science and Sustainability, Xining 810008, China
3
School of Life Science, Qinghai Normal University, Xining 810008, China
*
Author to whom correspondence should be addressed.
Agriculture 2024, 14(1), 6; https://doi.org/10.3390/agriculture14010006
Submission received: 28 September 2023 / Revised: 12 December 2023 / Accepted: 14 December 2023 / Published: 20 December 2023
(This article belongs to the Section Agricultural Soils)

Abstract

:
The differences in soil fungal communities in four agricultural areas growing wheat (Triticum aestivum), rapeseed (Brassica napus), and barley (Hordeum vulgare) in the Qinghai Province, namely the Dulan (DL), Gonghe (GH), Huzhu (HZ), and Datong (DT) counties, were investigated using high-throughput sequencing. The region showed highly significant effects on soil pH, organic matter, ammonium nitrogen, nitrate nitrogen, total phosphate, effective phosphate, total sulfur, and effective sulfur (p < 0.01). The crop type resulted in highly significant (p < 0.01) variations in total phosphate and effective phosphate. Principal coordinates analysis and nonmetric multidimensional scaling revealed significant differences in soil fungal diversity and fungal community composition in the soils of three crops or four regions (p < 0.05). Although the soils of the four regions or three crops had similar dominant phyla, classes, and genera, these taxa differed in terms of their relative abundance. Four, 12, 15, and 16 biomarkers with significant linear discriminant analysis effect sizes were identified in the HZ, DL, GH, and DT groups, respectively. A total of 36, 12, and eight significant biomarkers were observed in the wheat, rapeseed, and barley soils, respectively. In addition, altitude and soil physicochemical properties had significant relationships with fungal diversity and community composition (p < 0.05, p < 0.01).

1. Introduction

Soil microbes are critical components of soil function mediation and participate in various ecosystem processes, including organic material decomposition, nutrient cycling, and humus formation in agricultural ecosystems [1,2]. The diversity and composition of soil microbial communities are considered sensitive indicators of soil quality because they can respond to soil environmental changes and sustain soil health [3,4,5]. Soil fungi, as the key component of soil microorganisms, not only promote organic matter decomposition and nutrient transformation, they are also closely connected to crop growth, health, and disease [6,7,8,9,10].
Agricultural soils are special ecosystems given that they are characterized by intensive practices. Fungal community composition and abundance in agricultural soils can be influenced by soil profiles, geography, and various management conditions [11,12,13,14,15,16,17,18,19,20]. A limited number of studies have reported that the biogeographical distribution of soil fungal communities varies with agricultural ecosystems. Evidence shows considerable changes in the structure of soil fungal communities in paddy fields in three regions (Hailun, Changshu, and Yingtan) and that the effect of geography on these changes is more pronounced than that of environmental variables [12]. Additionally, although geography drives the variation in fungal communities in the black soil zone in the three provinces of Heilongjiang, Jilin, and Liaoning, soil parameters are more important than geography in determining the distribution of fungal communities [21]. These findings indicate that the biogeographical changes in fungal communities are fundamentally different.
Previous studies have demonstrated that crop types and genetically modified crops influence changes in fungal communities under the same environmental conditions [22,23]. Four tea varieties were found to modify soil fungal β-diversity and community composition greatly [24]. One study discovered significant differences in the soil fungal richness and Chao1 indices but not in fungal community structures in the soils of three different maize cultivars [25]. Plant types alter fungal community composition by changing the profiles of secreted metabolites and their interaction with organisms [25]. Liu et al. [21] investigated fungal communities in the black soil zone and reported a similar result. They noted that fungal community composition is most strongly affected by soil carbon content followed by soil pH; however, the effect of crop type on soil fungal community distribution on large spatial scales has not been thoroughly investigated.
In the Qinghai Province, the main crops in agricultural areas are wheat (Triticum aestivum,Ta), rapeseed (Brassica napus, Bn), and barley (Hordeum vulgare, Hv). Only a few previous studies have investigated fungal community distribution in rapeseed, barley, and wheat soils on a large geographical scale. In this study, we sampled three crop soils from four counties in the Qinghai Province. The specific goals of this study were to (1) reveal the distribution patterns of fungal communities in different crop soil types from four regions spanning a relatively large geography, by using Illumina (MiSeq) sequencing targeting the fungal internal transcribed spacer (ITS) region and (2) identify the factors that are important for shaping fungal community distribution in three crop soil types across four regions.

2. Materials and Methods

2.1. Field Sampling of Soils from Multiple Locations and Physicochemical Analysis

A total of 40 agricultural soil samples were collected from four different regions of the Qinghai Province, namely the Dulan (DL, nine soils), Datong (DT, four soils), Gonghe (GH, 12 soils), and Huzhu (HZ, 15 soils) counties (Table S1), located at longitude 98°03′40.64″–102°06′08.23″ E and latitude 36°02′18.36″–37°04′10.24″ N at an elevation of 2694–3264 m in Northwestern China. Soils under three typical land uses, such as wheat, rapeseed, and barley cultivation, in the same village were sampled during the stages of crop flowering and fruiting in July 2022. A field sample investigation revealed that the soils under different land use types in the same village had similar textures and that barley was planted narrowly in DT county; therefore, the amount of sample taken from each site differed.
Five individual soil cores were randomly collected from a crop field using a drill (10 cm in diameter) at a soil depth of 5–20 cm and pooled into one sample to minimize variation. Soil samples were transported to the laboratory on ice and divided into three parts. A part of the soil was stored at −80 °C before DNA extraction. A subsample of fresh bulk soil was used to measure the soil water content by using gravimetry, before and after being dried for 24 h at 105 °C. Another bulk soil subsample was air-dried and sieved for the analysis of chemical properties, including pH, organic matter, ammonium nitrogen, nitrate nitrogen, total phosphate, effective phosphate, total sulfur, and effective sulfur. Soil pH was measured by adding 10 mL of distilled water to 4 g of soil. The pH was recorded by using a digital pH meter (pH-220, Supo Instruments Co., Ltd., Suzhou, China). Soil organic matter was measured in accordance with the potassium dichromate oxidation–heating method described by Bao [26]. Soil ammonium nitrogen was extracted using KCl (Yongda Chemical Reagent Co., Ltd., Tianjin, China) and determined via indophenol blue colorimetry. Nitrate nitrogen was determined using the 2-phenolsulfonic acid method. Soil total phosphate was determined through phosphomolybdate blue photometry. Effective phosphate was extracted with NaHCO3 (Xilong Scientific Co., Ltd., Shantou, China) and determined via molybdenum–antimony antispectrophotometry. Soil total sulfur was determined using the burning iodine method. Effective sulfur was extracted with phosphate (Yonghua Chemical Reagent Co., Ltd., Suzhou, China) and measured using barium sulfate turbidimetry.

2.2. Microbial DNA Extraction and Illumina High-Throughput Sequencing

Microbial DNA was extracted from the soil samples using a HiPure Soil DNA Kit (GENEWIZ, Inc., South Plainfield, NJ, USA) in accordance with the manufacturer’s instructions. Soil DNA purity and concentration were determined using a Qubit® dsDNA HS Assay Kit. Sequencing libraries were constructed using a MetaVX Library Preparation Kit (GENEWIZ, Inc., South Plainfield, NJ, USA). The ITS gene from fungi was amplified with the primers 5′-GTGAATCATCGARTC-3′ and 5′-TCCTCCGCTTATTGAT-3′. The protocol for ITS gene amplification was 94 °C for 3 min followed by 24 cycles of 94 °C for 5 s, 57 °C for 90 s, 72 °C for 10 s, and 72 °C for 5 min. TPCR mixtures (25 μL) contained 2.5 μL of TransStart buffer, 2 μL of dNTP, 1 μL of each primer, 0.5 μL of TransStart Taq DNA polymerase, and 20 ng of template DNA. Indexed adapters were added to the ends of the amplicons by limited-cycle PCR. Finally, libraries were purified using magnetic beads.
The concentration was detected using a microplate reader (Infinite 200 Pro, Tecan, Grödig, Austria), and fragment size was detected using 1.5% agarose gel electrophoresis. Next-generation sequencing was conducted using the Illumina Miseq/Novaseq Platform (Illumina, San Diego, CA, USA) at Genewiz, Inc. (SouthPlainfield, NJ, USA). Automated cluster generation and 250/300 paired-end sequencing with dual reads were performed according to the manufacturer’s instructions.

2.3. Data Processing and Statistical Analysis

The raw sequences were further demultiplexed and filtered for quality using the Quantitative Insights into Microbial Ecology software (QIIME, version 1.9.1). FASTQ files were used for subsequent alignment. The joined sequences were subjected to quality screening, and low-quality sequencing reads with quality scores less than 20 and lengths shorter than 200 bp were filtered out. Next, the sequencing dataset was used for taxonomic assignment, and unique sequences were aligned to the UNITE ITS database (https://unite.ut.ee/, accessed on 27 September 2023) at a 70% identity threshold. Operational taxonomic units (OTUs) were clustered at 97% nucleotide sequence similarity by Vsearch (version 1.9.6). The Bayes algorithm classifier, provided by the Ribosomal Database Program (version 2.2), was used to analyze the representative OTU sequences. The community composition of each sample was analyzed at different taxonomic levels.
The Shannon, Simpson, Chao1, Ace, and Goods coverage indices of the fungal communities in each sample were calculated using QIIME on the basis of the OTU analysis results. In addition, the relative abundances of dominant taxa, such as phyla, class, and genera, were estimated by dividing the number of reads allocated to a particular taxon by the total obtained sequences (%). R software (version, 3.3.1) was used to draw Venn diagrams and determine the relative abundance of dominant taxa. Fungal β-diversity was analyzed using principal coordinates analysis (PCoA) and nonmetric multidimensional scaling (NDMS) in R software, on the basis of the Bray–Curtis dissimilarity matrix. Analyses of similarity (ANOSIM) tests were conducted to assess the roles of region and crop type in structuring fungal communities. Linear discriminant analysis effect size (LEfSe, version 1.0) was applied to identify biomarker taxa, explaining differences between different groups with linear discriminant analysis = 2. A univariate analysis of variance was conducted to identify between-subject effects in accordance with the general linear model with an unequal number of samples. Spearman correlation coefficients were utilized to test the effect of soil properties on fungal taxa and community diversity, and determined using SPSS 16.0 software.

3. Results

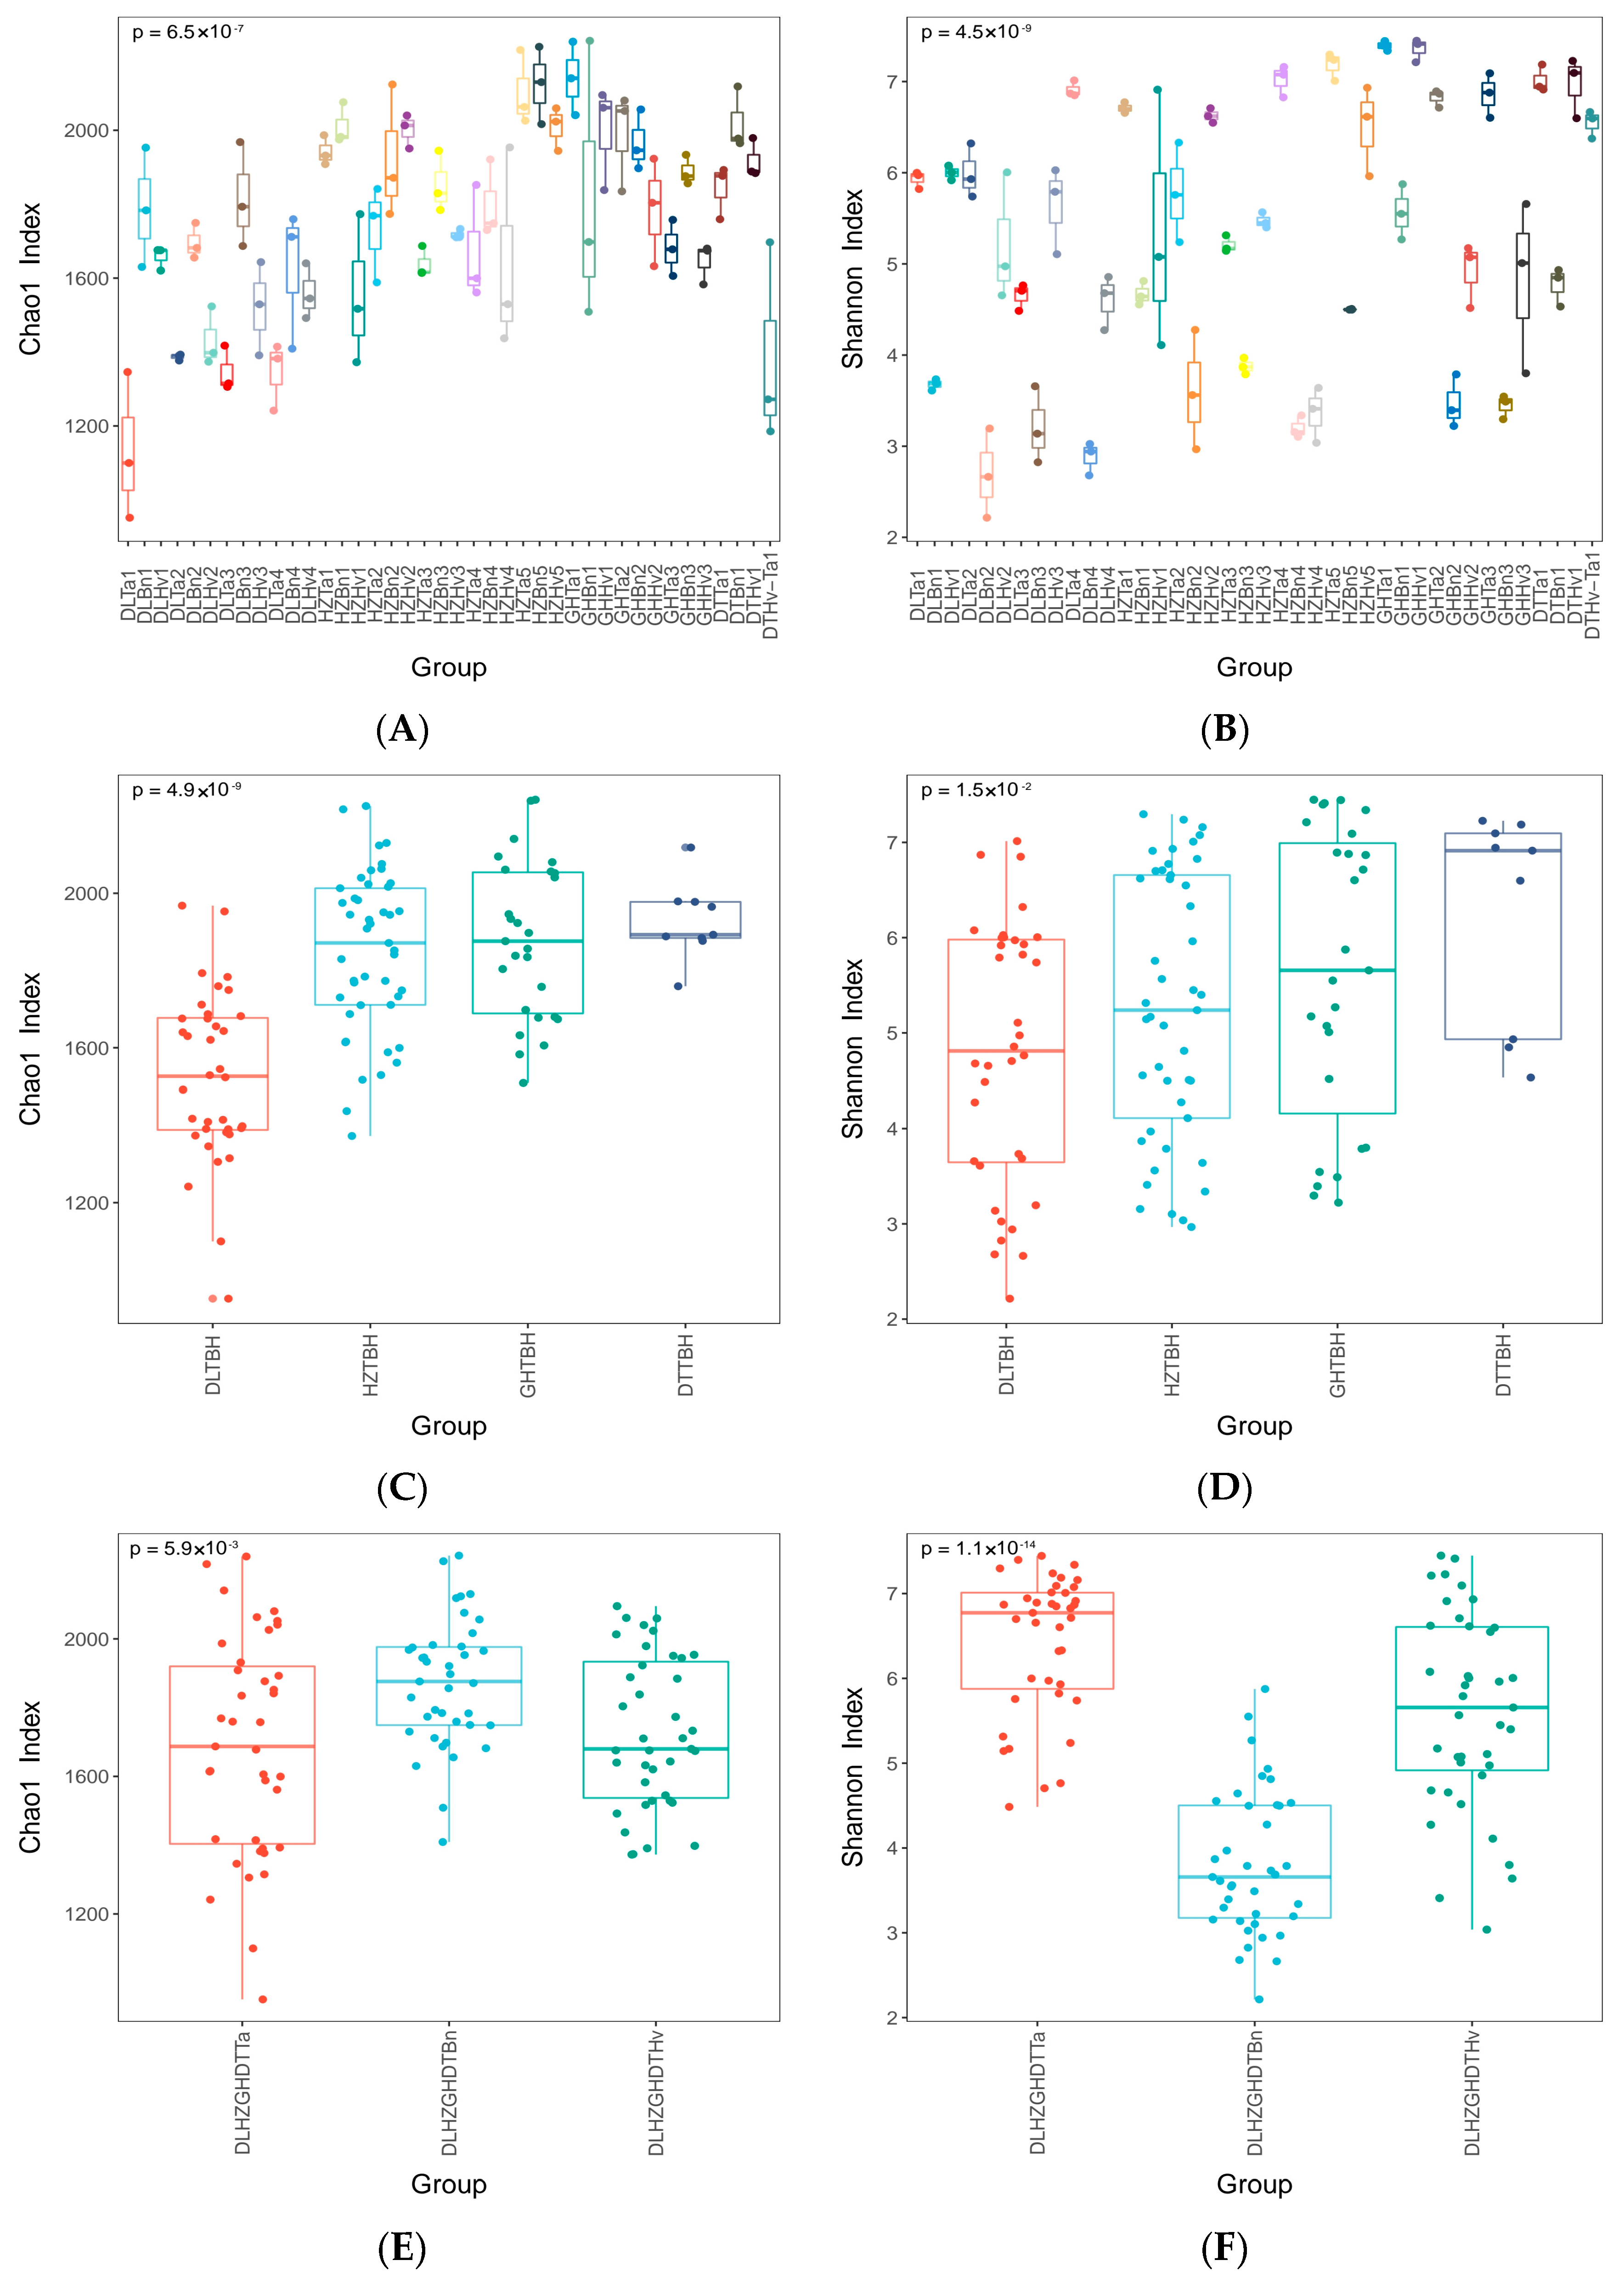
3.1. Regions and Crop Types Influenced the α-Diversity of Fungi

The Goods coverage index, which reflects the captured diversity, exceeded 99% for all samples (Tables S2–S5). The Chao1 and Ace indices ranged from 1132.45 ± 199.23 to 2140.50 ± 99.19 and from 1109.86 ± 169.92 to 2077.70 ± 120.41, respectively (Figure 1A,B; Tables S2–S5). The Simpson and Shannon diversity indices ranged from 0.509 ± 0.079 to 0.967 ± 0.008 and from 2.69 ± 0.49 to 6.91 ± 0.09, respectively. The Chao1 and Ace indices were high in GHTa1 but low in DLTa1. The Simpson and Shannon diversity indices were high in DLTa4 but low in DLBn2.
Region and crop type had highly significant (p < 0.001, p < 0.01; Table 1) effects on the Ace, Chao1, Shannon, Simpson, and Goods coverage indices of fungi. In addition, region and crop type had some interactive effects on the Ace, Chao1, Simpson, and Goods coverage indices (p < 0.05; Table 1). Fungal Chao1 and Ace diversities were significantly higher in HZ, GH, and DT soils than in DL soil (p < 0.05; Figure 1C,D). GH and DT soil samples had higher Shannon diversity indices than DL soil samples. Barley soil samples had higher Chao1 and Ace indices than wheat and rapeseed soil samples. Fungal Shannon and Simpson indices significantly decreased in the order of wheat soil > barley soil > rapeseed soil (p < 0.05; Figure 1E,F).

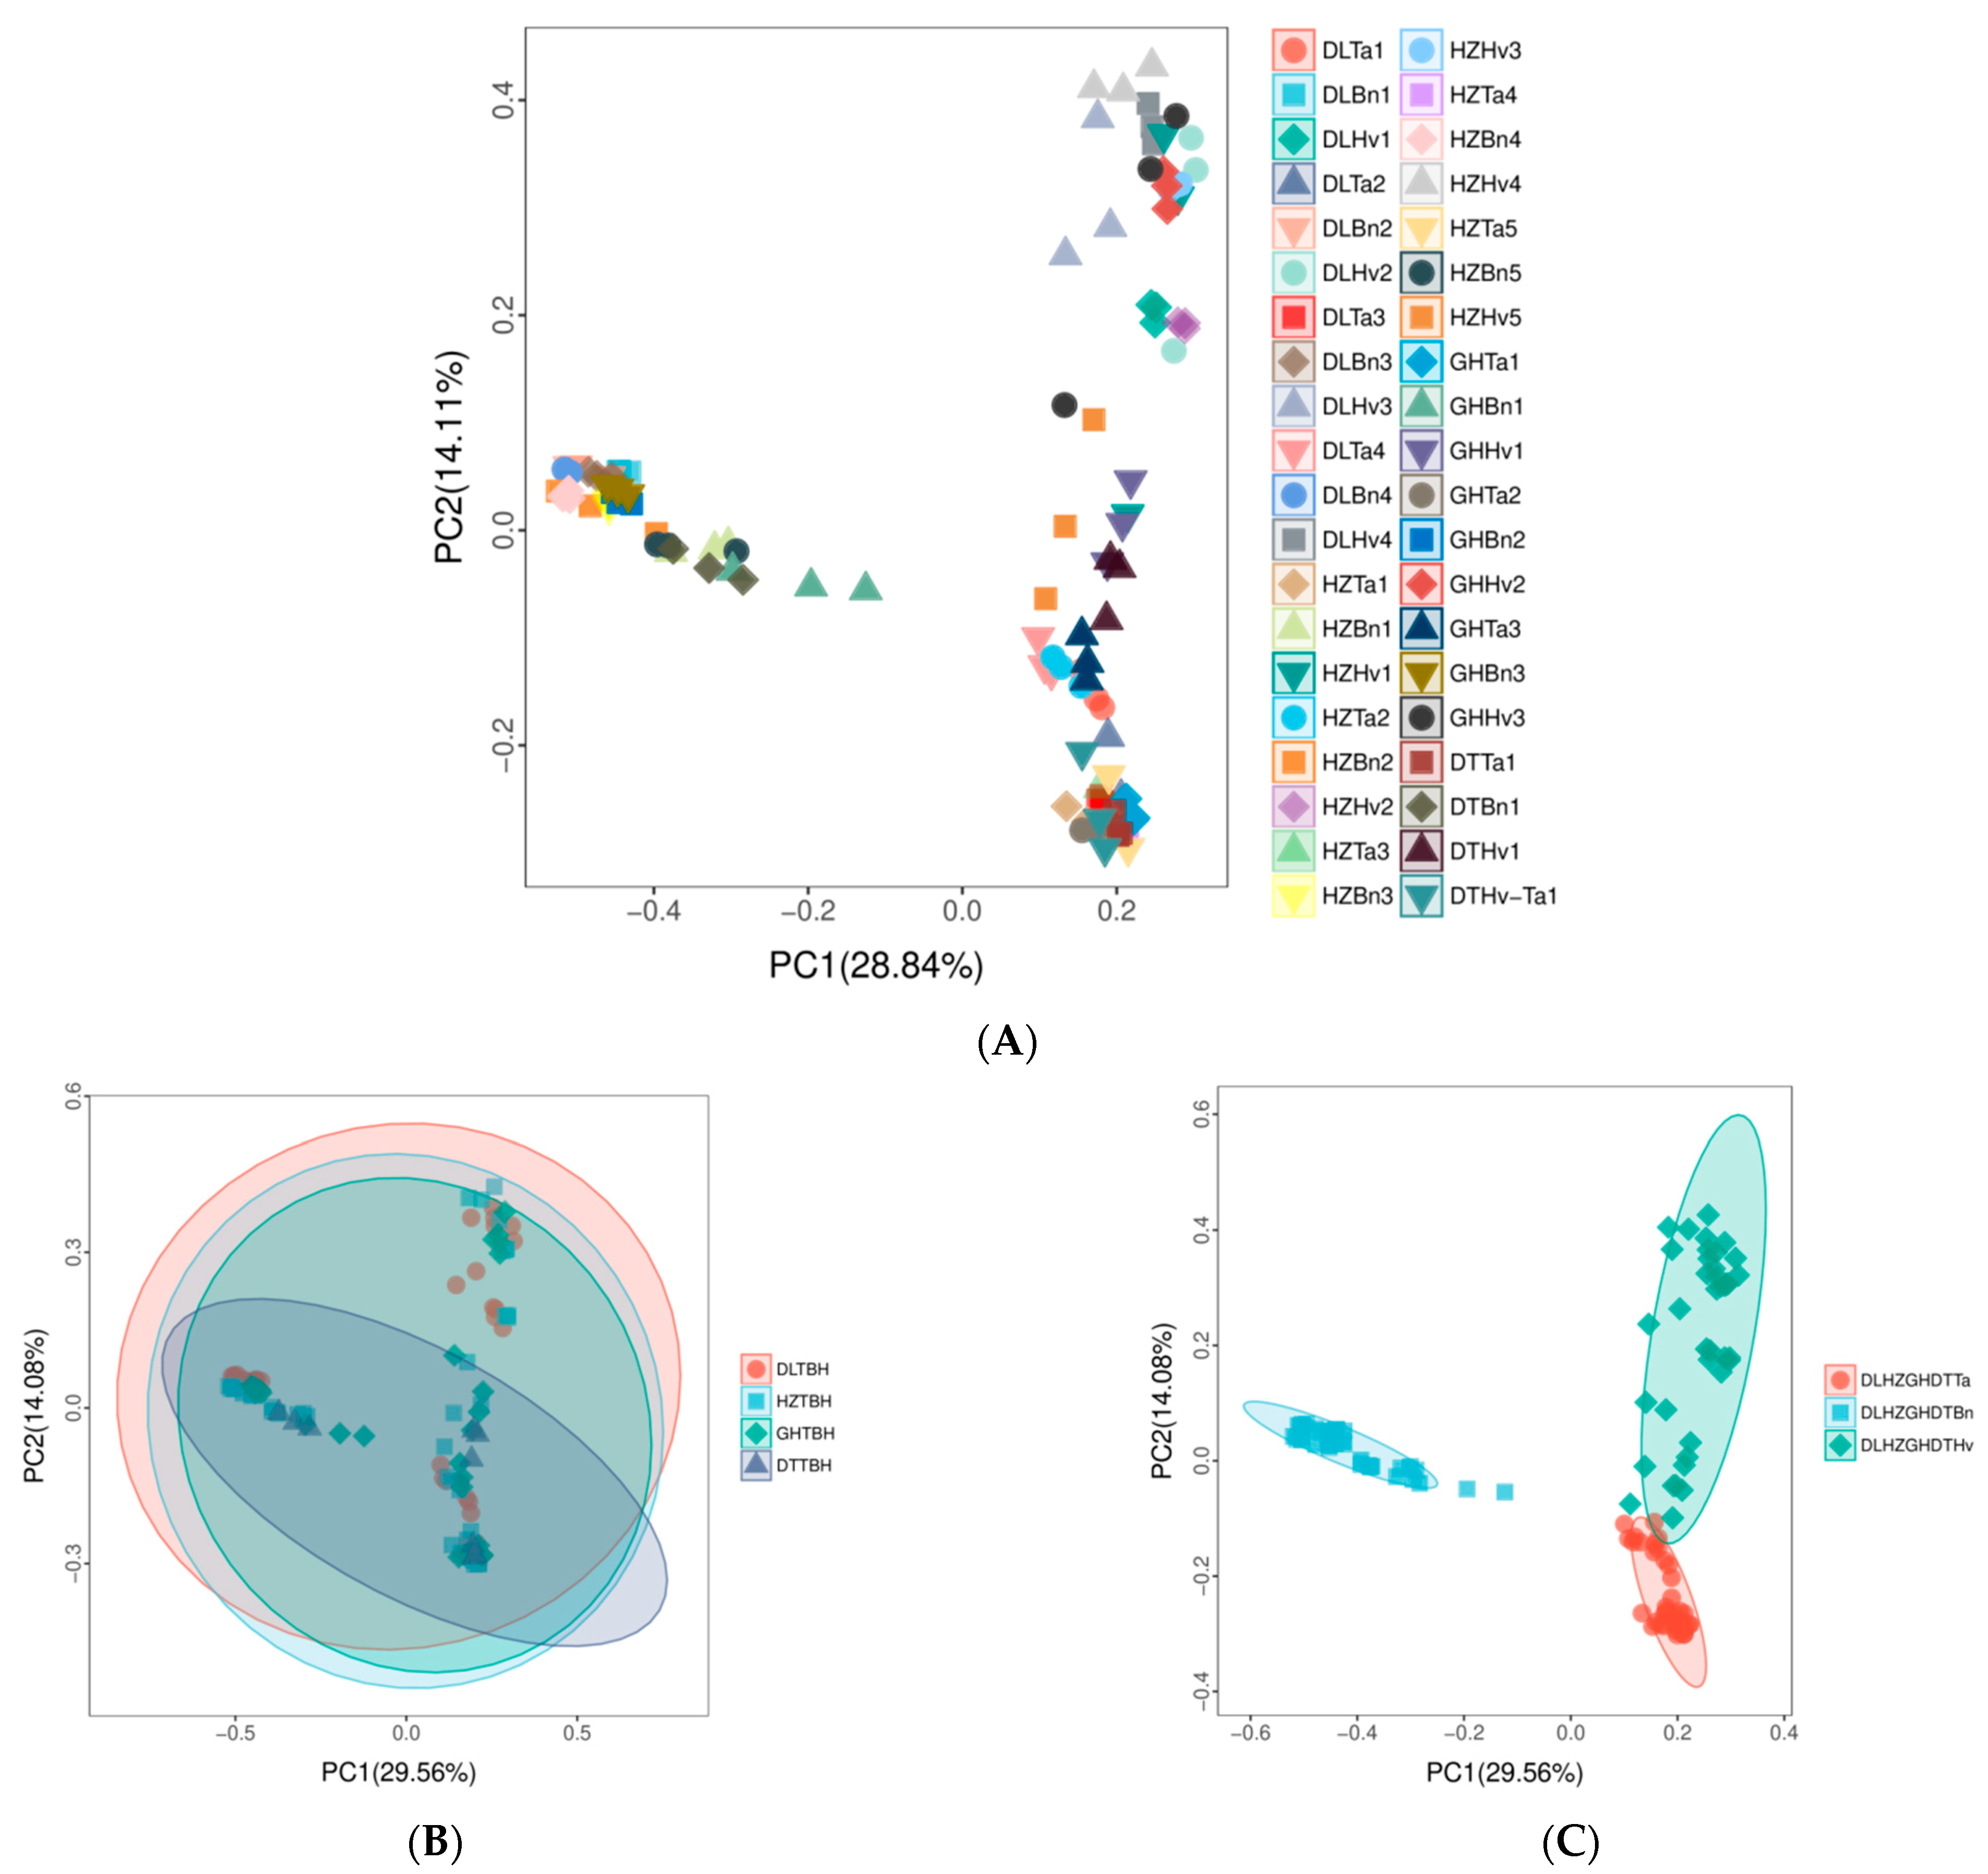
3.2. Regions and Crop Types Influenced the β-Diversity of Fungal Communities
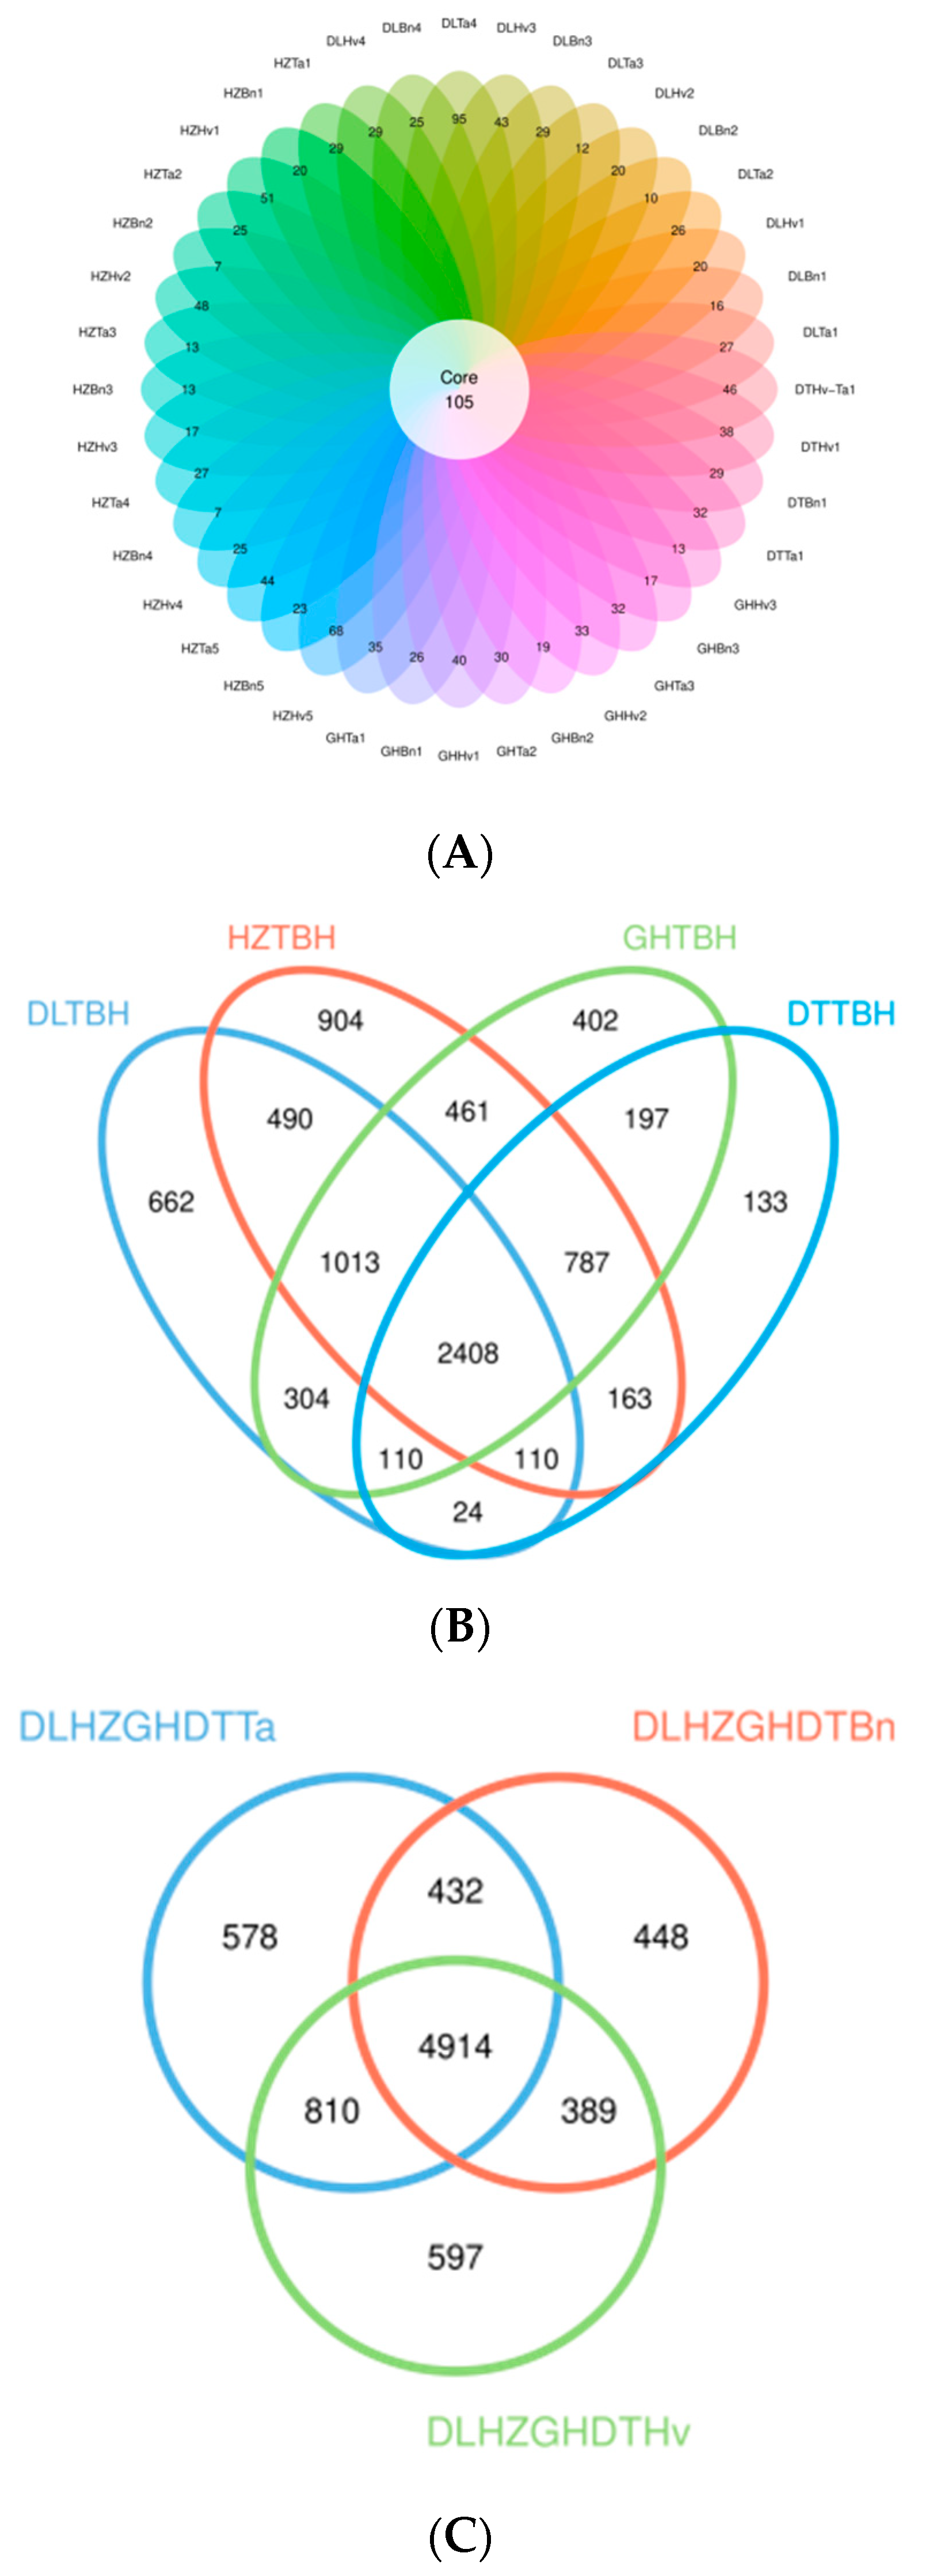
A PCoA based on Bray–Curtis dissimilarity revealed differences in the fungal communities extracted from the soil samples (Figure 2A). It indicated that the four regions greatly overlapped (Figure 2B) and that the wheat and barley soils slightly overlapped; however, rapeseed soil clearly separated from wheat and barley soils (Figure 2C).
NMDS was conducted to illustrate the variance of the fungal communities in the samples (Figure 3). When stress was less than 0.2, NMDS accurately reflected the differentiation of 40 soil samples (Figure 3A). Regional comparisons revealed distinct fungal communities in the HZ, DL, GH, and DT regions (Figure 3B, ANOSIM; R = 0.189, p = 0.001). NMDS ordination plotting showed an extremely significant separation within all three crop groups (Figure 3C; R = 0.878, p = 0.001).

3.3. OTUs of Fungi

A total of 10,457,868 OTUs were obtained from all samples. The number of different phylogenetic OTUs ranged from 80,196 to 92,087 per sample. The average number of OTUs was 87,148.9 and was highest in HZBn1. A total of 105 OTUs were common to all 40 soil groups (Figure 4A).
A total of 6336, 5682, 5121, and 3932 OTUs were obtained from the HZ, GH, DL, and DT soils, respectively (Figure 4B). A total of 2408 OTUs were common to all four regions. A total of 662, 904, 402, and 133 OTUs were unique to DL, HZ, GH, and DT soils, respectively.
A total of 6734, 6183, and 6710 OTUs were detected in wheat, rapeseed, and barley soils, respectively (Figure 4C). A total of 4914 OTUs were common to the three crop types, and 578, 448, and 597 OTUs were exclusive to wheat, rapeseed, and barley soil samples, respectively.

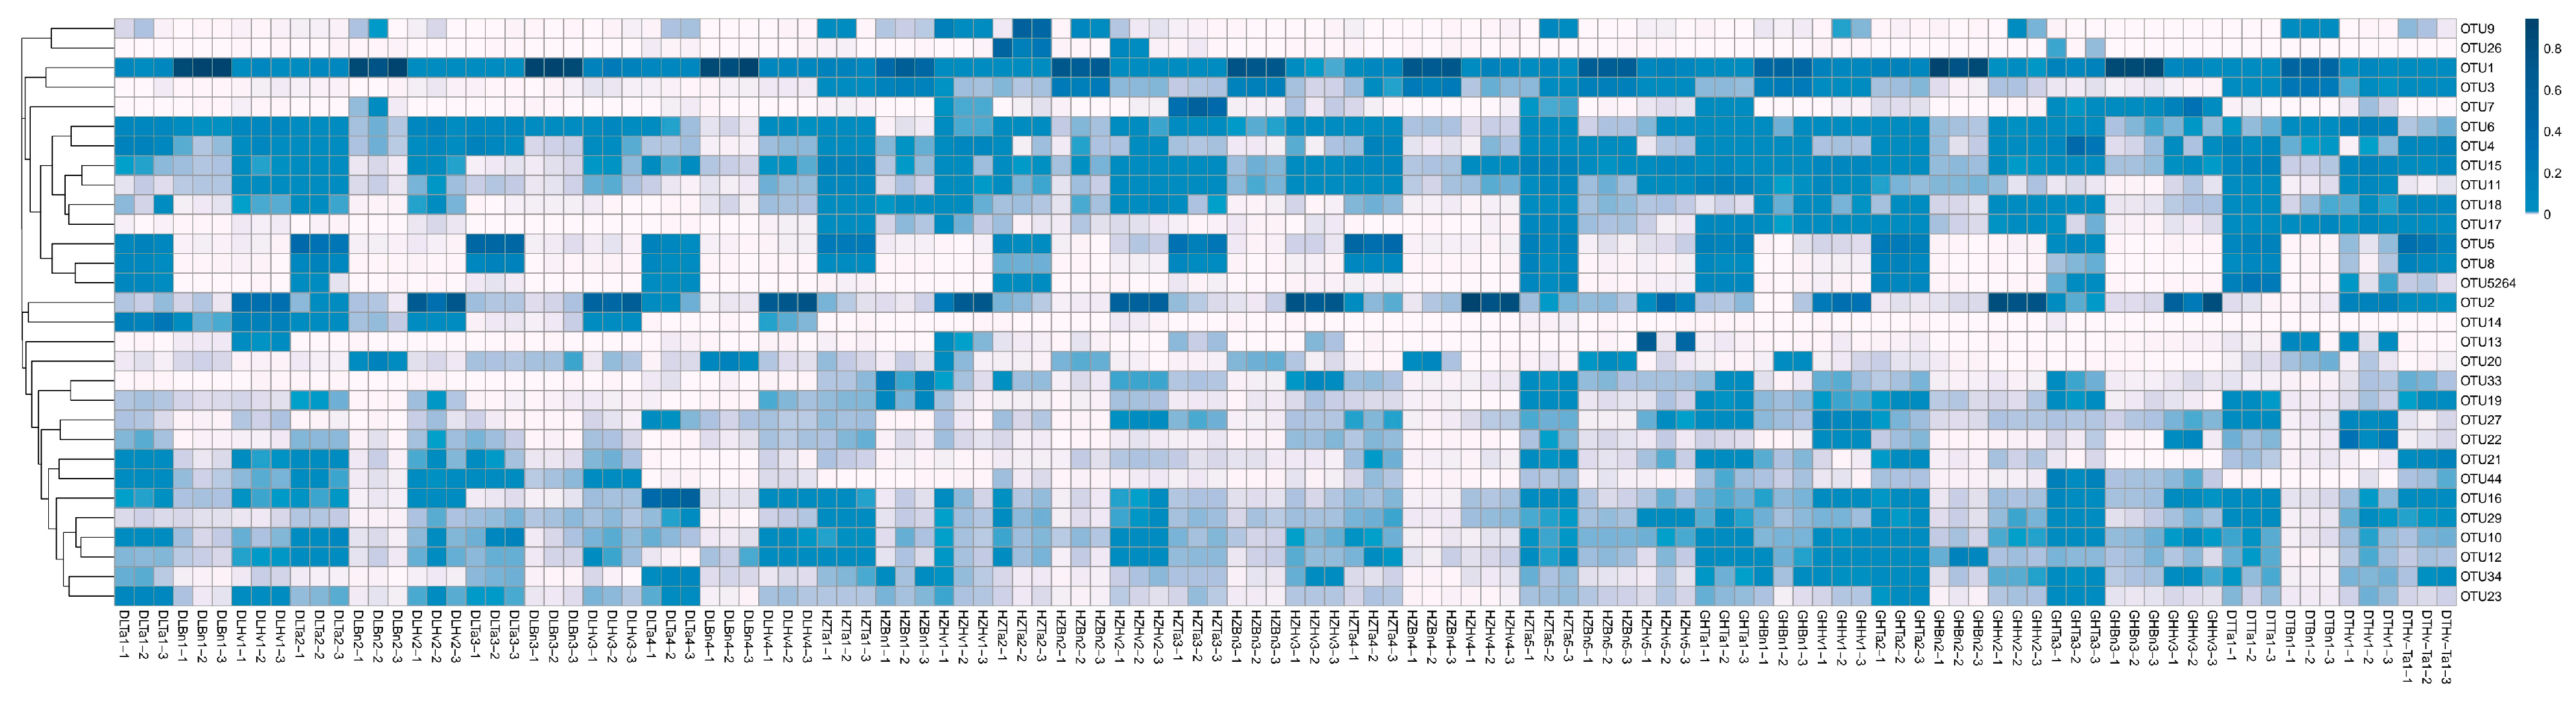
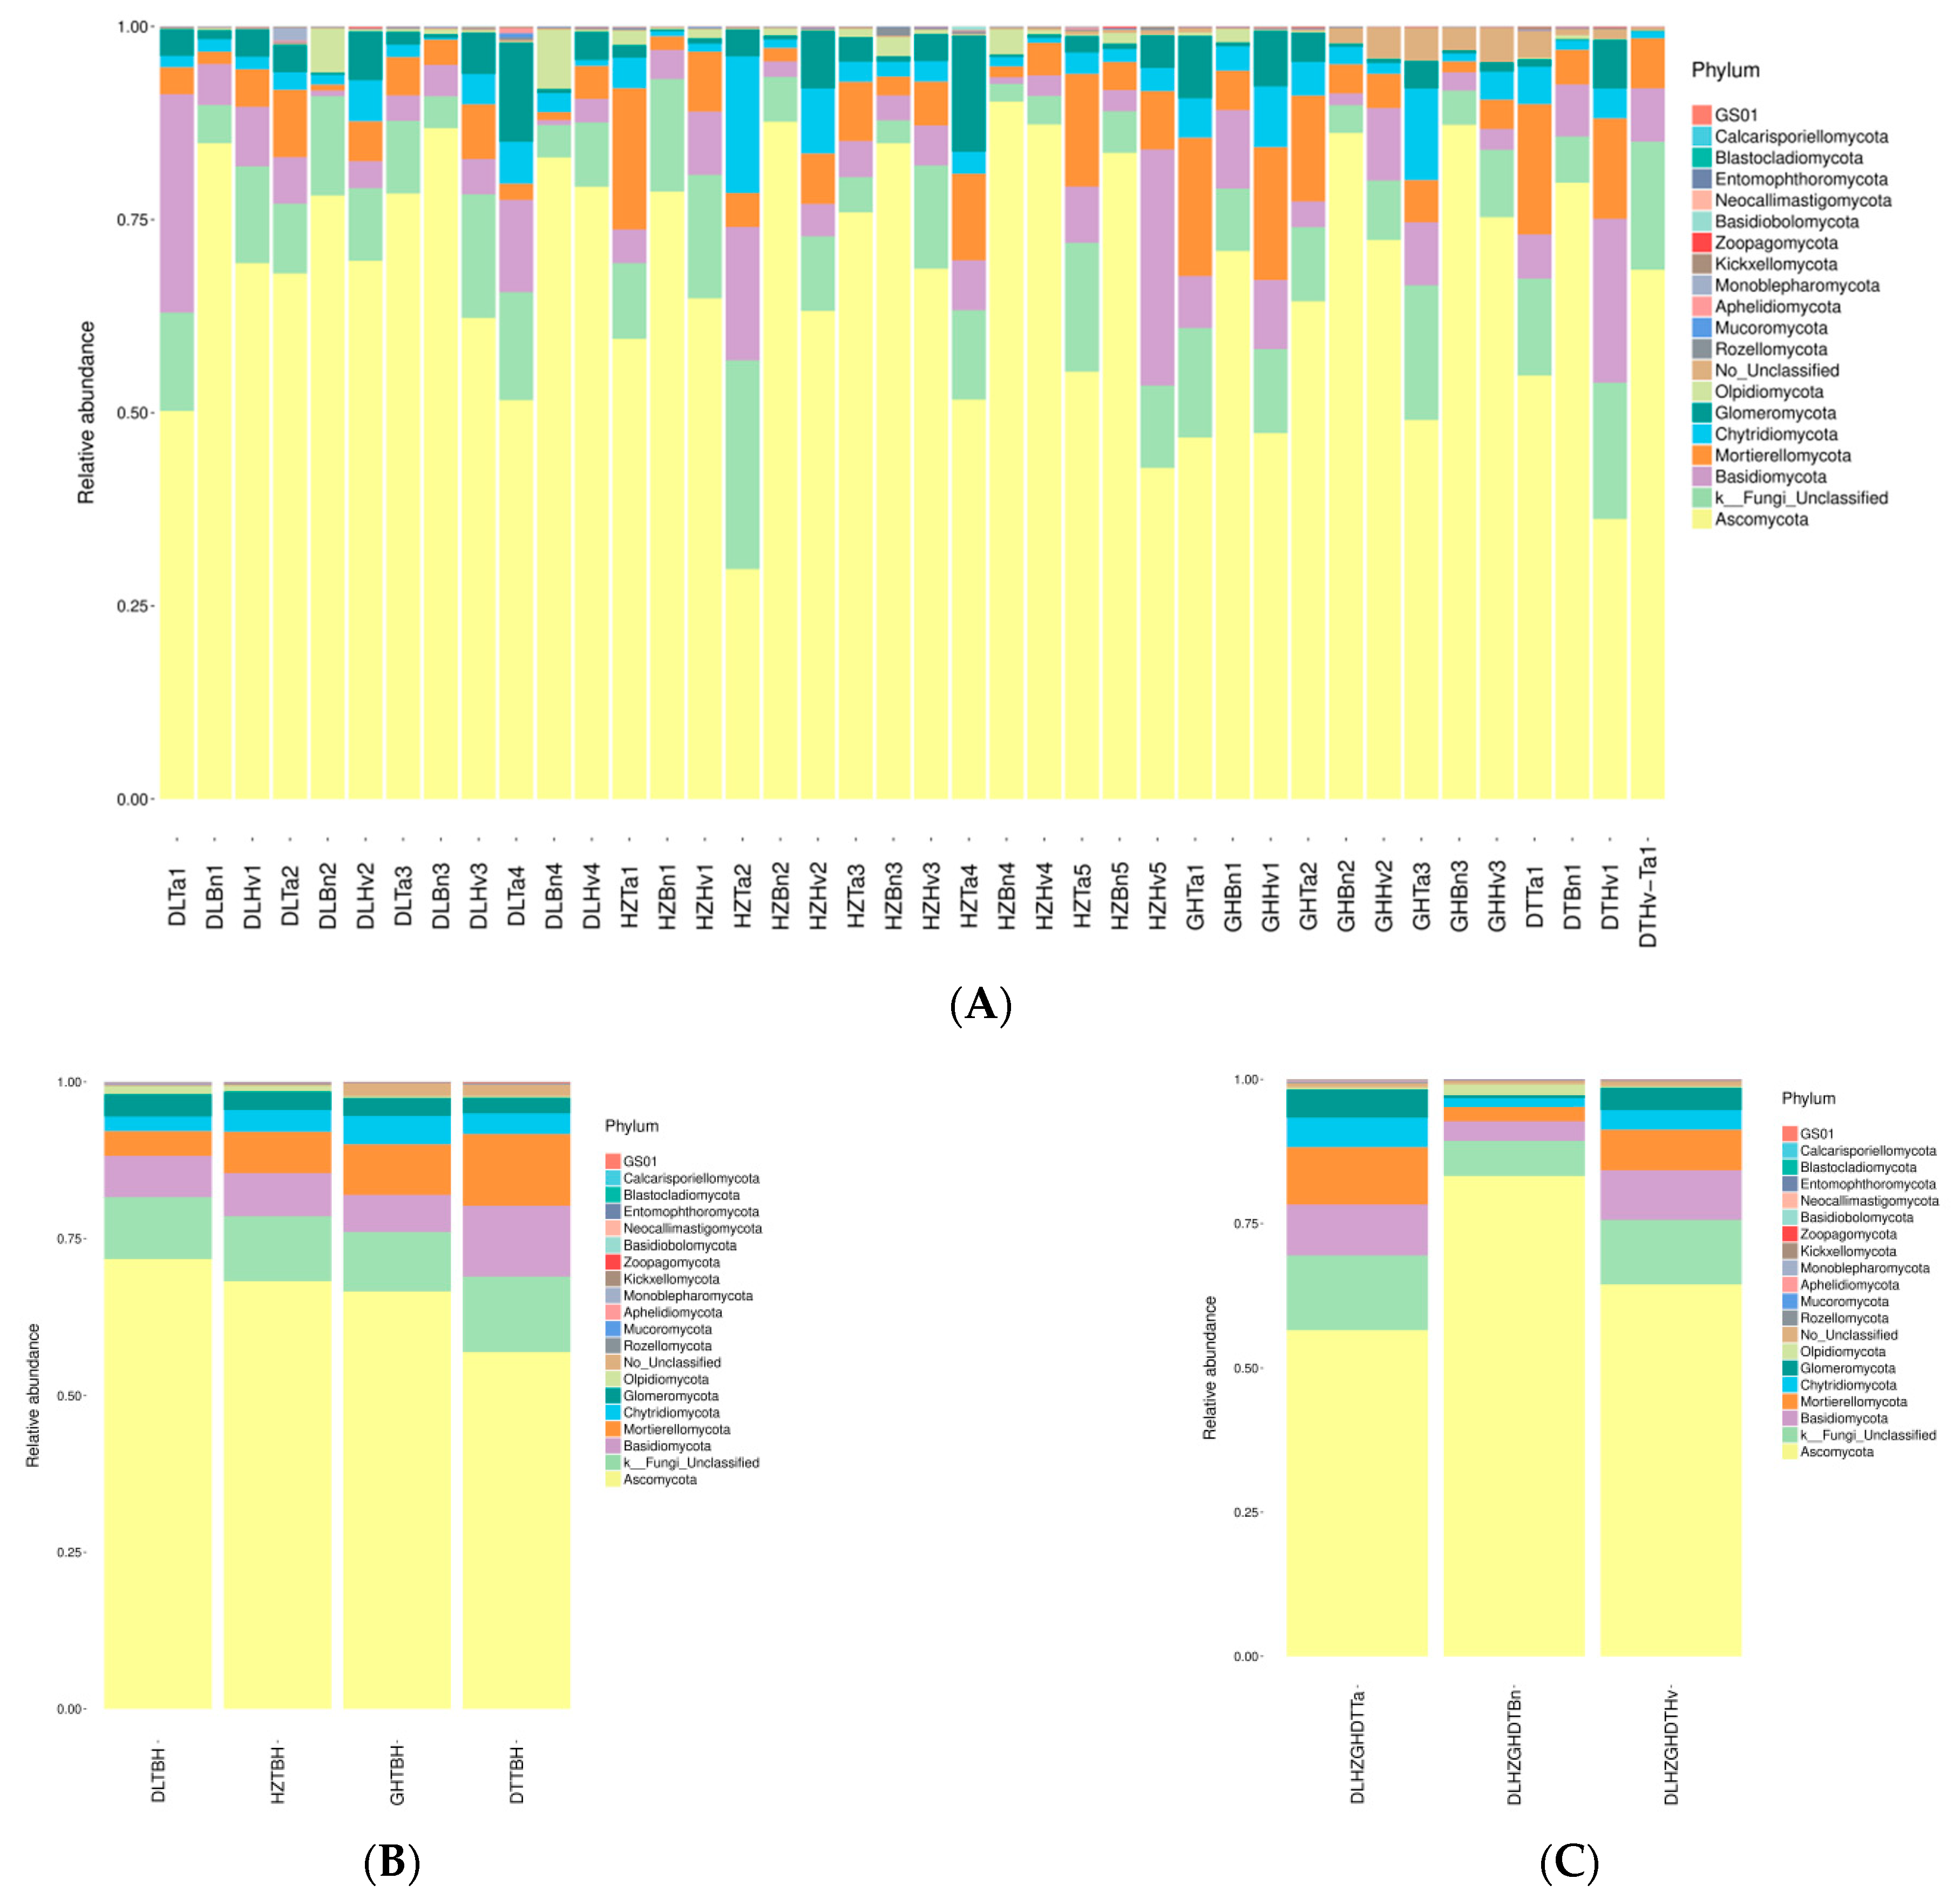
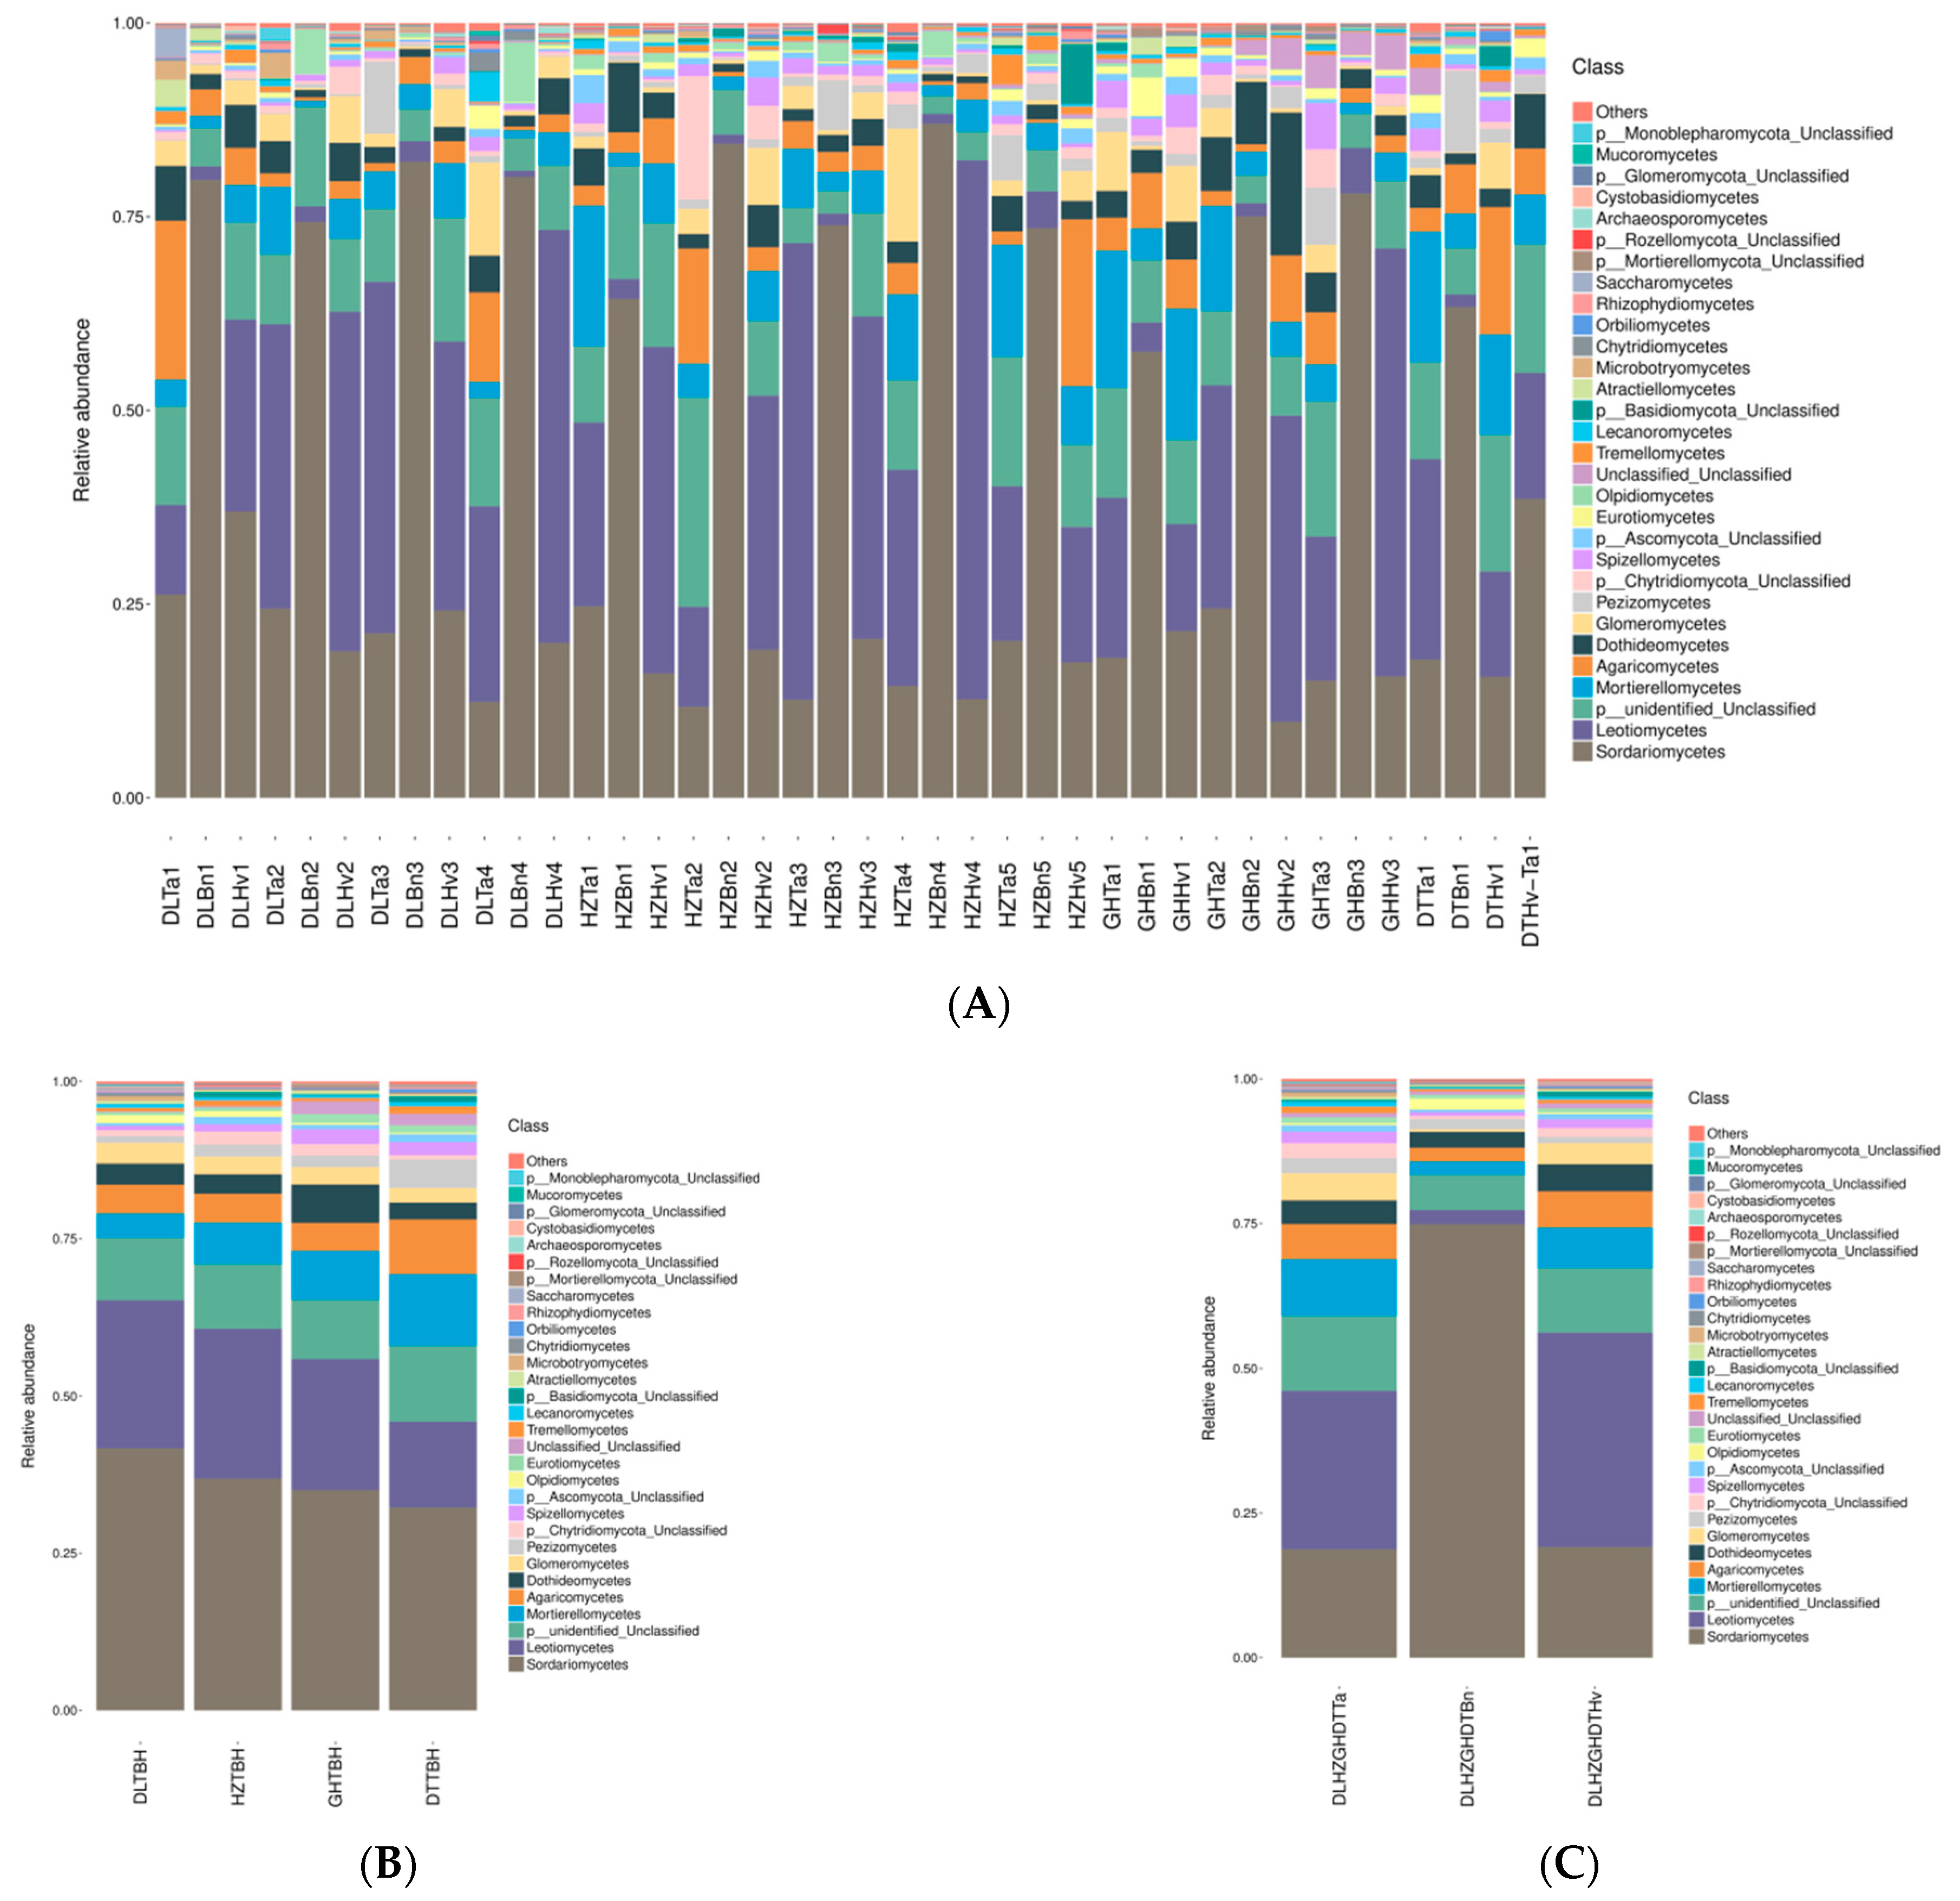
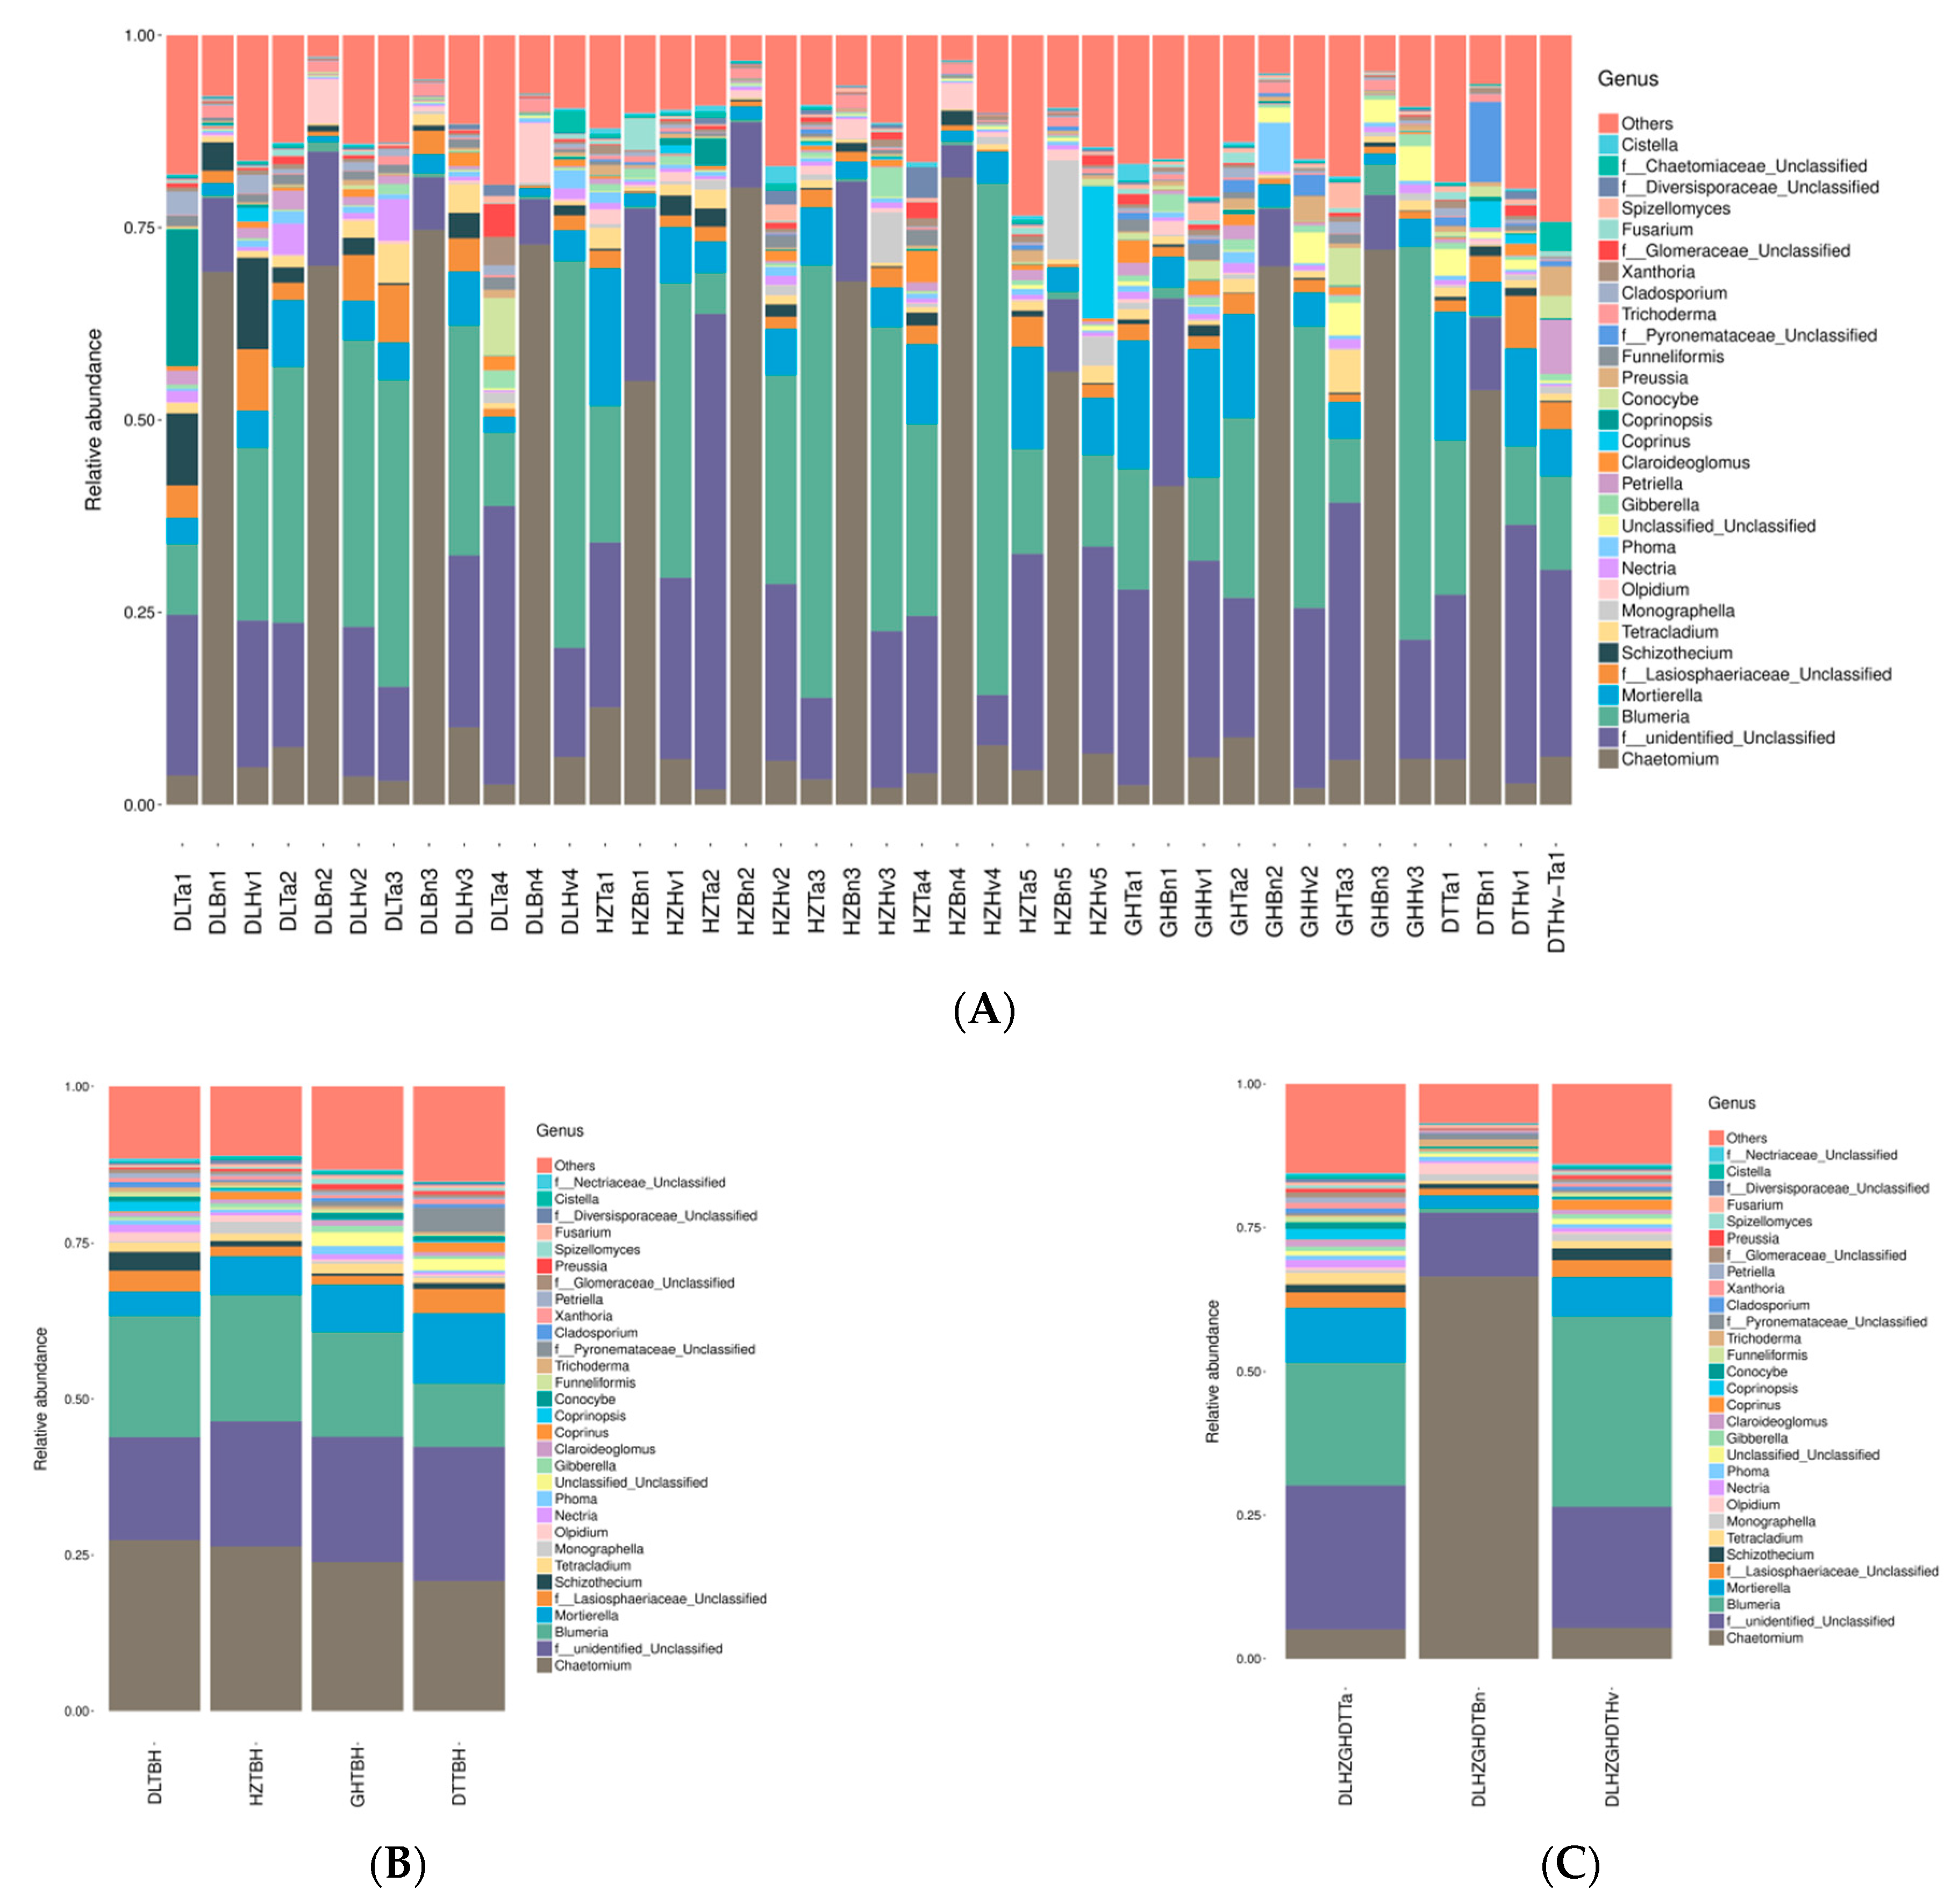
3.4. Regions and Crop Types Influenced Fungal Community Compositions

Figure 5 shows a distinct heatmap of the 30 selected OTUs that dominated in all samples. OTU01 was primarily distributed in DLBn3 and DLBn4 soils. OTU02 dominated in HZHv4, DLBn1, and DLHv1 soils. Among the soil samples, DTHv1 or DTTa1 soils had the highest numbers of OTU3 or OTU7, respectively. OTU5 was primarily distributed in HZTa3 soil, and OTU13 was primarily present in DLBn4 soil. In addition, among the fungi, OTU341 was the most enriched in GHTa2 and GHBn2.
The fungal community composition in 40 soil samples, four regions, and three crops was compared at the phylum, class, and genus levels. The relative abundance of fungal phyla in the 40 soil samples, four regions, and three crops varied (Figure 6). A total of 20 fungal phyla were detected. Among the phyla, Ascomycota was overwhelmingly dominant, with relative abundance ranging from 36.25% (DTHv1) to 90.27% (HZBn4), followed by unclassified phyla (2.3–27.03%) and Basidiomycota (0.62–30.56%) (Figure 6B). Ascomycota and Basidiomycota were the top two phyla that accounted for 71.81% and 9.80% of the fungi in DL soil, 68.28% and 10.27% of the fungi in HZ soil, 66.63% and 9.40% of the fungi in GH soil, and 56.95% and 12.06% of the fungi in DT soil, respectively. Comparing the three crop soils revealed that rapeseed soil supported greater proportions of Ascomycota than other phyla, whereas wheat and barley soils were more enriched in Basidiomycota, Mortierellomycota, and Chytridiomycota than the other phyla (Figure 6C).
A total of 64 fungal taxa were found at the class level. Sordariomycetes, Leotiomycetes, unclassified class, and Agaricomycetes predominated, with the relative abundances of 20.25–86.97%, 18.56–69.53%, 17.65–55.21%, and 21.54%, in 19, 16, four, and one soil sample, respectively (Figure 7A). Sordariomycetes, Leotiomycetes, and unclassified class were the three major classes in the four regions. Sordariomycetes (32.27–41.71%), followed by Leotiomycetes (13.68–23.87%) and unclassified class (9.40–12.06%) (Figure 7B), dominated in the samples. The three most abundant classes in rapeseed, wheat, and barley soils varied. In rapeseed soil, members of Sordariomycetes (74.86%) dominated, with members of unclassified class (6.10%) and Dothideomycetes (2.74%) also abundant (Figure 7C). Wheat and barley soils had similar fungal communities. Leotiomycetes (27.38%–37.08%), Sordariomycetes (18.74–19.12%), and unclassified class (11.12–12.97%) were the top three classes in wheat and barley soils.
A total of 663 fungal genera were found. Chaetomium was the top genus in all rapeseed soils and had relative abundances that ranged from 41.32% (GHBn1) to 81.34% (HZBn4) (Figure 8A). Blumeria (22.45–66.32%) and unclassified genus (20.85–61.66%) were the dominant genera in 15 and 11 soil fungal communities, respectively. The most prevalent genera in the DL, HZ, and GH regions were Chaetomium (23.82–27.34%), unclassified genus (16.44–20.00%), and Blumeria (16.84–20.23%) (Figure 8B). In DT soil, the predominant genera were unclassified fungi (21.45%), Chaetomium (20.78%), Mortierella (11.23%), and Blumeria (10.16%). Crop type influenced the structure of the fungal communities at the genus (Figure 8C). Chaetomium and unclassified genus dominated in rapeseed soil, with relative abundances of 66.42% and 10.98%, respectively. By contrast, in wheat and barley soils, the dominant fungi were Blumeria and unclassified genus, with relative abundances of 21.31–33.19% and 20.99–25.04%, respectively.

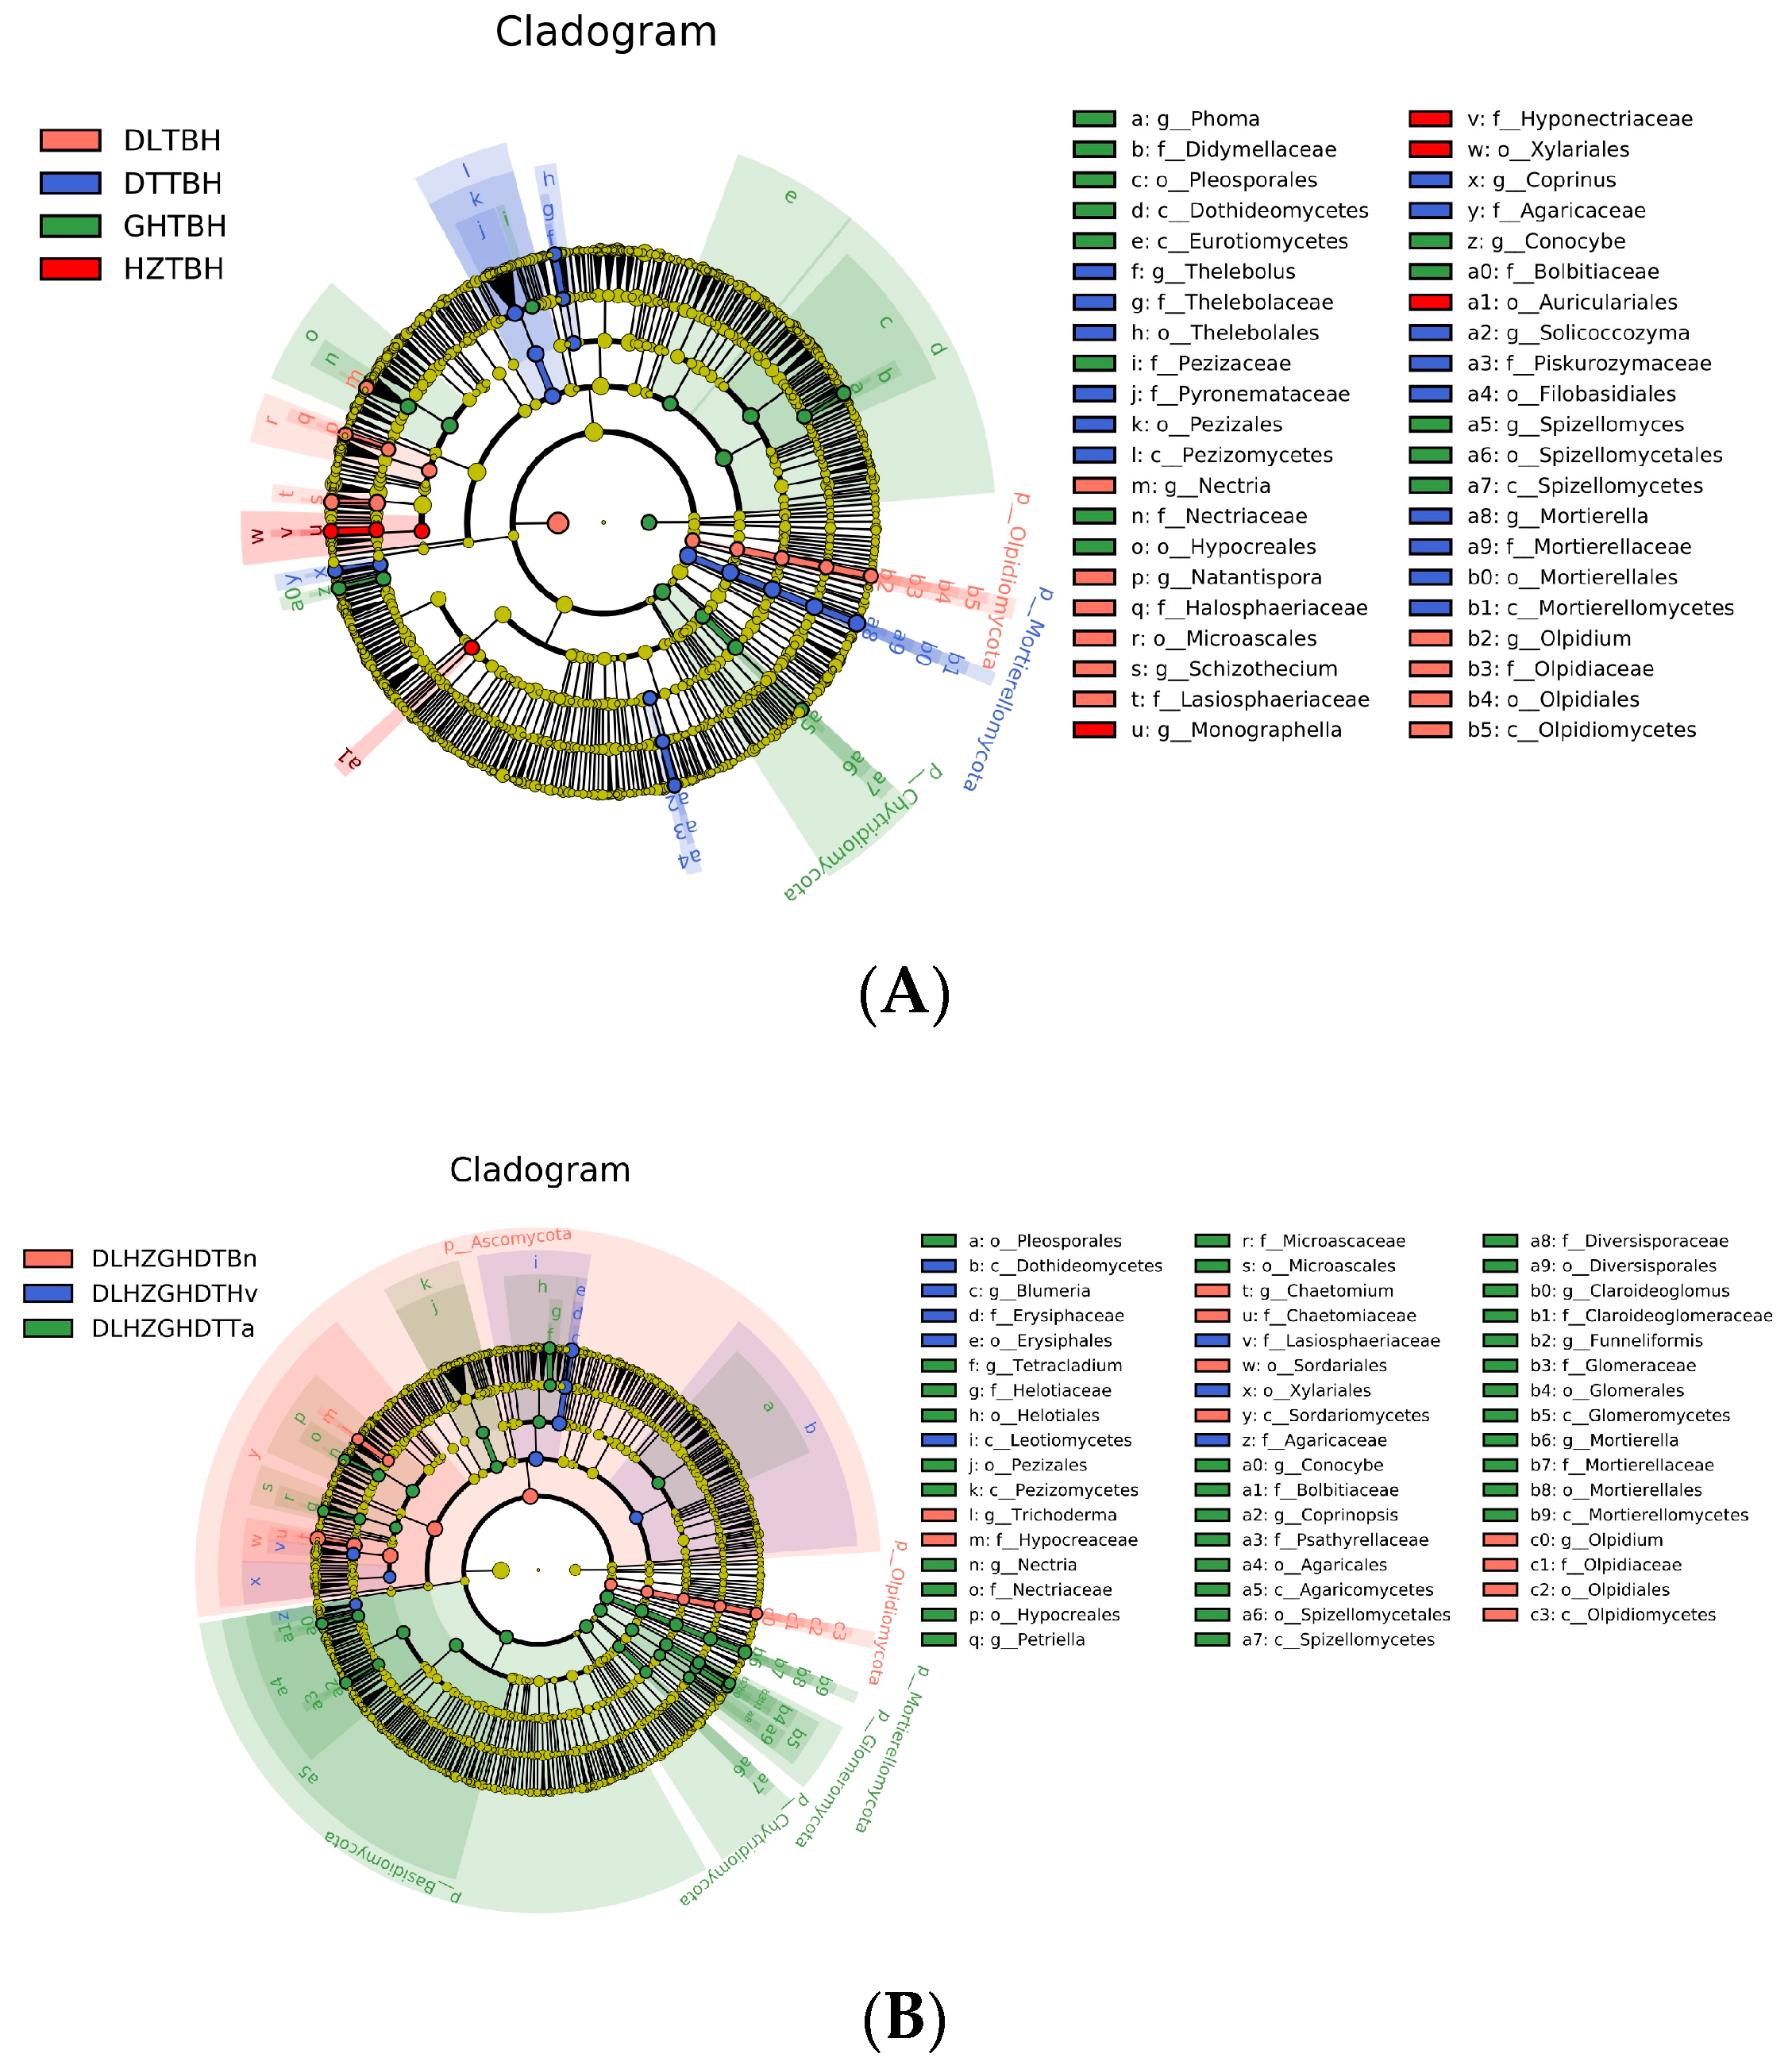
3.5. Regions and Crop Types Influenced Biomarker Taxa

An LEfSe analysis was performed to identify the fungal communities exhibiting significantly different abundances (Figure 9A). Figure 9A shows that four, 12, 16, and 15 significant biomarkers were identified in the HZ, DL, DT, and GH soils, respectively. The HZ region was enriched with fungal lineages at different taxonomic levels, such as the orders Xylariales and Auriculariales, family Hyponectriaceae, and genus Monographella. One phylum (Chytridiomycota), three classes (Dothideomycota, Spizellomycetes, and Eurotiomycetes), three orders (Pleosporales, Hypocreales, and Spizellomycetales), four families (Nectriaceae, Didymellaceae, Bolbitiaceae, and Pezizaceae), and three genera (Phoma, Conocybe, and Spizellomyces) were enriched in the GH region. One phylum (Mortierellomycota), two classes (Mortierellomycetes and Pezizomycetes), four orders (Mortierellales, Pezizales, Thelebolales, and Filobasidiales), five families (Mortierellaceae, Pyronemataceae, Agaricaceae, Thelebolaceae, and Piskurozymaceae), and four genera (Mortierella, Coprinus, Thelebolus, and Solicoccozyma) had high relative abundances in the DT region. The relative abundances of one phylum (Olpidiomycota), one class (Olpidiomycetes), two orders (Microascales and Olpidiales), three families (Lasiosphaeriaceae, Olpidiaceae, and Halosphaeriaceae), and four genera (Schizotheclum, Olpidium, Nectria, and Natantispora) were high in the DL region.
The relative abundances of fungal taxa showed the greatest differences between crop types (Figure 9B). The relative abundances of four phyla (Mortierellomycota, Basidiomycota, Glomeromycota, and Chytridiomycota), five classes (Mortierellomycetes, Agaricomycetes, Glomeromycetes, Spizellomycetes, and Pezizomycetes), 10 orders (Mortierellales, Glomerales, Agaricales, Helotiales, Hypocreales, Spizellomycetales, Pezizales, Microascales, Diversisporales, and Pleosporales), nine families (Mortierellaceae, Nectriaceae, Glomeraceae, Psathyrellaceae, Helotiaceae, Claroideoglomeraceae, Bolbitiaceae, Microascaceae, and Diversisporaceae), and eight genera (Mortierella, Coprinopsis, Tetracladium, Conocybe, Claroiddeoglomus, Nectria, Funneliformis, and Petriella) were high in wheat soil. Two classes (Leotiomycetes and Dothideomycetes), two orders (Erysiphales and Xylariales), three families (Erysiphaceae, Lasiosphaeriaceae, and Agaricaceae), and one genus (Blumeria) had high relative abundances in barley soil. Two phyla (Ascomycota and Olpidiomycota), one class (Sordariomycetes), two orders (Sordariales and Olpidiales), three families (Chaetomiaceae, Olpidiomyceae, and Hypocreaceae), and three genera (Chaetomium, Olpidium, and Trichoderma) were enriched in rapeseed soil. The LEfSe biomarkers of the other groups are shown in Supplementary Materials: Figures S3 and S4.

3.6. Regions and Crop Types Influenced Soil Properties and Fungal Genera

The region had significant (p < 0.05, Table 1) effects on soil physicochemical properties, such as pH, organic matter, ammonium nitrogen, nitrate nitrogen, total phosphate, effective phosphate, total sulfur, and effective sulfur, and on some fungal genera, including Mortierella, unclassified Lasiosphaeriaceae, Schizothecium, Monographella, Olpidium, and Nectria. The crop type significantly affected the fungal genera Mortierella, unclassified genus, Blumeria, Mortierella, unclassified Lasiosphaeriaceae, Tetracladium, Olpidium, and Nectria, total phosphate, and effective phosphate. In addition, region and crop type had interactive effects on soil pH, total phosphate, effective phosphate, total sulfur, effective sulfur, Mortierella, unclassified Lasiosphaeriaceae, Olpidium, and Nectria (p < 0.05; Table 1).

3.7. Relationships among Selected Fungal Genera, Measured Diversity Indices, and Soil Properties

The fungal genera Mortierella, unclassified genus, unclassified Lasiosphaeriaceae, and Tetracladium showed significantly positive correlations with the Shannon or Simpson index (p < 0.05, p < 0.01) (Table 2), whereas Chaetomium and Olpidium showed significantly negative correlations with the Shannon and Simpson indices. Blumeria, Schizothecium, and Nectria were negatively correlated with the Ace and Chao1 indices (p < 0.05, p < 0.01), whereas Chaetomium was positively correlated with the Ace index (p < 0.05). In addition, Nectria showed significantly positive correlations with altitude (p < 0.05) but a negative relationship with soil water content (p < 0.05). Unclassified Lasiosphaeriaceae showed a positive correlation with ammonium nitrogen (p < 0.05) but a negative relationship with nitrate nitrogen and total phosphate (p < 0.05). Moreover, the genus Monographella was positively correlated with water content, total sulfur, and nitrate nitrogen (p < 0.05), and Chaetomium was positively correlated with soil water content (p < 0.05). Furthermore, the fungal Ace and Chao1 indices showed negative correlations with altitude but positive correlations with water content, organic matter, and total phosphate (Table 3).

4. Discussion

4.1. Variation in Soil Fungal Diversity among Regions and Crop Types

The fungal community plays a crucial role in agricultural ecosystems and can affect crop and soil properties. In this study, we confirmed that soil fungal diversity varied greatly among the tested soils. The region had significant effects on the Chao1, Fisher’s α, and Pielou’s evenness indices, and the Chao1 and Fisher’s α-diversity indices followed the order of Yingtan > Changshu > Hailun [12]. Similarly, an investigation on paddy soils from 10 regions suggested that fungal inverse Simpson, Shannon, and β-diversity indices presented significant variation, and that a significant correlation existed between community dissimilarity and geographic distance [27]. Liu et al. [21] showed that the phylogenetic diversity and phylotype richness of fungal communities decreased with the increase in latitude. We found that fungal Ace and Chao1 indices strongly decreased with increasing altitude. We speculate that the regional diversity gradient of fungi in agricultural soils resulted from soil physicochemical properties, such as pH, water content, organic matter, temperature, and texture [28].
Numerous studies have reported that soil fungal diversity varies between crop types [14,25,29,30]. The results of this study revealed the difference in fungal diversity between three crop soils. The diversity of fungal communities was greater in wheat fields than in orchards [14]; however, fungal richness and diversity in bulk soil samples from fava bean and wheat cropping systems did not differ [30]. The contrasting effects of crop type on fungal diversity observed here and in other studies are related to differences in plant root exudates, plant growth stages, and soil type, given that these factors influence fungal diversity [31].
Soil fungal diversity varied with soil conditions. Previous research confirmed that pH has significant positive correlations with fungal Shannon and Chao1 indices in the bulk soil of different tea varieties [24]. In 10 rice cultivation regions in China, fungal α-diversity had positive relationships with soil nitrate nitrogen and total nitrogen concentration but negative correlations with soil pH and sulfate concentration [27]. Soil fungal diversity throughout the black soil zone was primarily determined by soil total carbon content rather than soil pH, and the diversity of soil fungal communities tended to be low in soils with high total carbon contents [21]. Our finding was consistent with the results of Rousk et al. [32], who observed that the diversity of fungi in Hoosfield acid strip soil was weakly related to soil pH. In addition, fungal Ace and Chao1 indices showed positive correlations with water content and organic matter but had no significant correlations with nitrate nitrogen and total sulfur. The incongruence between the findings of this study and those of others might be due to the remarkable difference in soil properties. The soils in our study had a pH unit difference of only 1.4 but greatly different soil organic matter and water content.

4.2. Variations in Fungal Community Compositions among Regions and Crop Types

Despite their geographic isolation and climate, the agricultural areas in the Qinghai Province had diverse soil fungal communities. Indeed, the relative abundances of numerous dominant soil fungi were found to differ significantly between regions and crop types. Granzow et al. [30] reported that fungal communities in bulk soil samples from wheat and fava bean monocultures differed; however, soil fungal community structure was less affected by peanut variety than by other factors [33].
The sequences that we obtained in the four regions or three crop soils were mostly assigned to Ascomycota and Basidiomycota, with abundances of 36.25–90.27% and 0.62–30.56%, respectively. These findings were in agreement with previous results for soil fungi in farmland soil [30,34]. The relative percentages of the dominant fungal phyla, classes, orders, and genera differed throughout the black soil zone under maize, soybean, or wheat cultivation in three provinces, with values of 12.38–47.55% and 2.91–59.97% for Ascomycota and Basidiomycota, respectively [21]. Moreover, Ascomycota, Mortierellomycota, and Basidiomycota were the predominant fungi in wheat and orchard soils [14], with Basidiomycota having a higher relative abundance in fruit orchards than in wheat fields. In our results, rapeseed soil had greater proportions of Ascomycota than other phyla, whereas wheat and barley soils were dominated by Basidiomycota, Mortierellomycota, and Chytridiomycota. Members of Basidiomycota are well known for their ability to degrade biopolymers, such as lignin [35], and Chytridiomycota is likely to appear in wheat fields due to recovery from high temperature and drying conditions [14].
The dominant fungal classes detected in the four regions were Sordariomycetes (32.27–41.71%), Leotiomycetes (13.68–23.87%), and unclassified class (9.40–12.06%). Liu et al. [21] demonstrated that among the classes in the black soil zone of northeast China, the most abundant were Tremellomycetes, Dothideomycetes, Agaricomycetes, Eurotiomycetes, Leotiomycetes, Sordariomycetes, and Chytridiomycetes (relative abundance >1%). The fungal genera Guehomyces and Mortierella were detected at high levels throughout the black soil zone and had mean relative abundances of 15.56% and 13.61%, respectively [21]. We discovered that Chaetomium (23.82–27.34%) and Blumeria (16.84–20.23%) were the most prevalent genera in the DL, HZ, and GH regions, and the abundance of Mortierella was greatest in DT soils. The close relatives of the family Chaetomiaceae, and the genus Chaetomium were characteristic of rapeseed soils. Moreover, the abundances of Trichoderma and Olpidium were high in rapeseed soils. Mortierella, Coprinopsis, Tetracladium, Conocybe, Claroiddeoglomus, Nectria, Funneliformis, and Petriella were abundant in wheat soil, and Blumeria and Coprinus were the abundant fungal genera in barley soil. The members of the family Chaetomiaceae, which includes the genus Chaetomium, have considerable cellulose decomposition ability [35]. The members of Mortierella provide benefits to crop growth and health, by degrading hemicellulose and chitin while producing a range of antibiotic compounds against several plant pathogens [36,37,38]. Previous studies have identified the effectiveness of Mortierella in the utilization of phosphate in various soil types [39]. This characteristic might be the reason for the high proportion of Mortierella that promoted the crop phosphorus uptake observed in phosphorus- and potassium-treated soil [40]. By contrast, Mortierella abundance considerably decreased under nitrogen fertilization [34]; thus, these fungi possibly played functional roles in the decomposition of organic matter and in soils. Blumeria is a well-known foliar disease of wheat and barley and tends to be prevalent in China [41,42]. Trichoderma species exhibit strong control effects on pathogens via the production of enzymes and secondary metabolites and promote plant growth and soil fertility [43,44]. Furthermore, differential indicator taxa were present in the four region soils or three crop types.
We found that the highly abundant fungal Tetracladium species had positive relationships with altitude. This finding differed from the results of the biogeographical distribution of fungal taxa in other studies. For example, Rousk et al. [32] reported that the distributions of three fungal groups (Helotiales, Hypocreales, and Mitosporic basidiomycetes) were strongly related to soil pH. Soil characteristics were more important than the historical factor of geographic distance in shaping fungal communities in the black soil zone of northeast China [21]. Moreover, some positive or negative relationships were observed between soil total carbon and the abundance of the most abundant fungal taxa at different levels. pH was the main factor shaping the fungal community structure in wheat fields and fruit orchards, and the parameters of water content, total organic carbon, and total nitrogen had considerable effects on community structure [14]. In this study, the abundance of the selected fungal genera had positive or negative relationships with water content, ammonium nitrogen, nitrate nitrogen, total phosphate, and total sulfur but not with soil pH, organic matter, effective phosphate, and effective sulfur, suggesting that the abundance of fungi in the tested soils was predominantly determined by soil nitrogen content.

5. Conclusions

Fungal diversity and community composition in soils from four different regions and three crop types differed. An LEfSe analysis revealed significant biomarkers in the four regions or three crop types. Fungal community composition had significant relationships with fungal diversity, and altitude and soil physicochemical properties greatly affected fungal diversity and community composition. Our findings provide basic data on the distribution and composition of fungal biogeography in agricultural ecosystems in plateau regions.

Supplementary Materials

The following supporting information can be downloaded at https://www.mdpi.com/article/10.3390/agriculture14010006/s1, Table S1: Geographical information of soil samples; Table S2: Alpha diversity indices of the ITS gene in the DL region; Table S3: Alpha diversity indices of the ITS gene in the GH region; Table S4: Alpha diversity indices of the ITS gene in the HZ region; Table S5: alpha diversity indices of the ITS gene in the DT region; Figure S1: NMDS ordination pattern of the fungal community composition in each region; Figure S2: NMDS ordination pattern of the fungal community composition in each crop soil; Figure S3: Histograms of the linear discriminant analysis (LDA) scores presenting the phylogenetic distribution of fungal taxa in each region based on LEfSe analysis; Figure S4: Histograms of the linear discriminant analysis (LDA) scores presenting the phylogenetic distribution of fungal taxa in each crop group based on LEfSe analysis.

Author Contributions

Conceptualization, L.Z.; methodology, F.Q.; software, H.X.; validation, X.M. and W.S.; formal analysis, L.W.; data curation, Y.L. and Y.M.; writing—original draft preparation, L.Z. and H.X. All authors have read and agreed to the published version of the manuscript.

Funding

This research was funded by the National Natural Science Foundation of China (grant number 32260345), the Science and Technology Program of Qinghai Province (grant number 2022-ZJ-740), and the College Students’ Innovation and Entrepreneurship Training Program (grant number qhnucxcy2023063).

Institutional Review Board Statement

Not applicable.

Data Availability Statement

The data presented in this study are available within the article.

Acknowledgments

We would like to thank Suzhou Azenta Biotech Co., Ltd. for the technical support in high-throughput sequencing.

Conflicts of Interest

The authors declare no conflicts of interest.

References

  1. Bardgett, R.D.; van der Putten, W.H. Belowground biodiversity and ecosystem functioning. Nature 2014, 515, 505–511. [Google Scholar] [CrossRef] [PubMed]
  2. van der Heijden, M.G.A.; Wagg, C. Soil microbial diversity and agro-ecosystem functioning. Plant Soil 2013, 363, 1–5. [Google Scholar] [CrossRef]
  3. Avidano, L.; Gamalero, E.; Cossa, G.P.; Carraro, E. Characterization of soil health in an Italian polluted site by using microorganisms as bioindicators. Appl. Soil Ecol. 2005, 30, 21–33. [Google Scholar] [CrossRef]
  4. Vukicevich, E.; Lowery, T.; Bowen, P.; Úrbez-Torres, J.R.; Hart, M. Cover crops to increase soil microbial diversity and mitigate decline in perennial agriculture. A review. Agron. Sustain. Dev. 2016, 36, 48. [Google Scholar] [CrossRef]
  5. Maguire, V.G.; Bordenave, C.D.; Nieva, A.S.; Llames, M.E.; Colavolpe, M.B.; Gárriz, A.; Ruiz, O.A. Soil bacterial and fungal community structure of a rice monoculture and rice-pasture rotation systems. Appl. Soil Ecol. 2020, 151, 103535. [Google Scholar] [CrossRef]
  6. Aguilar-Trigueros, C.A.; Hempel, S.; Powell, J.R.; Anderson, I.C.; Antonovics, J.; Bergmann, J.; Cavagnaro, T.R.; Chen, B.; Hart, M.M.; Klironomos, J.; et al. Branching out, towards a trait-based understanding of fungal ecology. Fungal Biol. Rev. 2015, 29, 34–41. [Google Scholar] [CrossRef]
  7. Ehrmann, J.; Ritz, K. Plant: Soil interactions in temperate multi-cropping production systems. Plant Soil 2014, 376, 1–29. [Google Scholar] [CrossRef]
  8. Finlay, B.J. Global dispersal of free-living microbial eukaryote species. Science 2002, 296, 1061–1063. [Google Scholar] [CrossRef]
  9. Fontaine, S.; Henault, C.; Aamor, A.; Bdioui, N.; Bloor, J.M.G.; Maire, V.; Mary, B.; Revaillot, S.; Maron, P.A. Fungi mediate long term sequestration of carbon and nitrogen in soil through their priming effect. Soil Biol. Biochem. 2011, 43, 86–96. [Google Scholar] [CrossRef]
  10. Tautges, N.E.; Sullivan, T.S.; Reardon, C.L.; Burke, I.C. Soil microbial diversity and activity linked to crop yield and quality in a dryland organic wheat production system. Appl. Soil Ecol. 2016, 108, 258–268. [Google Scholar] [CrossRef]
  11. Liu, C.; Ding, N.; Fu, Q.; Brookes, P.C.; Xu, J.; Guo, B.; Lin, Y.; Li, H.; Li, N. The influence of soil properties on the size and structure of bacterial and fungal communities along a paddy soil chronosequence. Eur. J. Soil Biol. 2016, 76, 9–18. [Google Scholar] [CrossRef]
  12. Li, X.; Wang, H.H.; Li, X.; Li, X.Y.; Zhang, H.W. Distribution characteristics of fungal communities with depth in paddy fields of three soil types in China. J. Microb. 2020, 58, 279–287. [Google Scholar] [CrossRef] [PubMed]
  13. Moll, J.; Hoppe, B.; König, S.; Wubet, T.; Buscot, F.; Krüger, D. Spatial distribution of fungal communities in an arable soil. PLoS ONE 2016, 11, e0148130. [Google Scholar] [CrossRef] [PubMed]
  14. Cui, X.Y.; He, H.; Zhu, F.X.; Liu, X.B.; Ma, Y.; Xie, W.M.; Meng, H.; Zhang, L.M. Community structure and co-occurrence network analysis of bacteria and fungi in wheat fields vs fruit orchards. Arch. Microbiol. 2022, 204, 453. [Google Scholar] [CrossRef] [PubMed]
  15. Beauregard, M.S.; Hamel, C.; Atul-Nayyar St-Arnaud, M. Long-term phosphorus fertilization impacts soil fungal and bacterial diversity but not AM fungal community in Alfalfa. Microb. Ecol. 2010, 59, 379–389. [Google Scholar] [CrossRef] [PubMed]
  16. Ullah, S.; Ai, C.; Ding, W.; Jiang, R.; Zhao, S.; Zhang, J.; Zhou, W.; Hou, Y.; He, P. The response of soil fungal diversity and community composition to long-term fertilization. Appl. Soil Ecol. 2019, 140, 35–41. [Google Scholar] [CrossRef]
  17. Schmidt, R.; Mitchell, J.; Scow, K. Cover cropping and notill increase diversity and symbiotroph: Saprotroph ratios of soil fungal communities. Soil Biol. Biochem. 2019, 129, 99–109. [Google Scholar] [CrossRef]
  18. Wang, J.C.; Rhodes, G.; Huang, Q.W.; Shen, Q.R. Plant growth stages and fertilization regimes drive soil fungal community compositions in a wheat-rice rotation system. Biol. Fertil. Soils 2018, 54, 731–742. [Google Scholar] [CrossRef]
  19. Jiang, Y.; Liang, Y.; Li, C.; Wang, F.; Sui, Y.; Suvannange, N.; Zhou, J.; Sun, B. Crop rotations alter bacterial and fungal diversity in paddy soils across East Asia. Soil Biol. Biochem. 2016, 95, 250–261. [Google Scholar] [CrossRef]
  20. Yuan, C.L.; Zhang, L.M.; Wang, J.T.; Teng, W.K.; Hu, H.W.; Shen, J.P.; He, J.Z. Limited effects of depth (0–80 cm) on communities of archaea, bacteria and fungi in paddy soil profiles. Eur. J. Soil Sci. 2020, 71, 955–966. [Google Scholar] [CrossRef]
  21. Liu, J.J.; Sui, Y.Y.; Yu, Z.H.; Shi, Y.; Chu, H.Y.; Jin, J.; Liu, X.B.; Wang, G.H. Soil carbon content drives the biogeographical distribution of fungal communities in the black soil zone of northeast China. Soil Biol. Biochem. 2015, 83, 29–39. [Google Scholar] [CrossRef]
  22. Hannula, S.E.; de Boer, W.; van Veen, J.A. In situ dynamics of soil fungal communities under different genotypes of potato, including a genetically modified cultivar. Soil Biol. Biochem. 2010, 42, 2211–2223. [Google Scholar] [CrossRef]
  23. Lee, S.H.; Kim, C.G.; Kang, H. Temporal dynamics of bacterial and fungal communities in a genetically modified (GM) Rice Ecosystem. Microb. Ecol. 2011, 61, 646–659. [Google Scholar] [CrossRef] [PubMed]
  24. Du, L.; Zheng, Z.C.; Li, T.X.; Wang, Y.D.; Huang, H.G.; Yu, H.Y.; Ye, D.H.; Liu, T.; Yao, T.Y.; Zhang, X.Z. Variations of fungal communities within the soils of different tea varieties (Camellia sinensis L.) following long-term plantation. Plant Soil 2022, 477, 665–677. [Google Scholar] [CrossRef]
  25. Kong, X.; Han, Z.F.; Tai, X.; Jin, D.C.; Ai, S.; Zheng, X.X.; Bai, Z.H. Maize (Zea mays L. Sp.) varieties significantly influence bacterial and fungal community in bulk soil, rhizosphere soil and phyllosphere. FEMS Microbiol. Ecol. 2020, 96, fiaa020. [Google Scholar] [CrossRef]
  26. Bao, S.D. Soil and Agricultural Chemistry Analysis; China Agriculture Press: Beijing, China, 2000. (In Chinese) [Google Scholar]
  27. Yuan, C.L.; Zhang, L.M.; Hu, H.W.; Wang, J.T.; Shen, J.P.; He, J.Z. The biogeography of fungal communities in paddy soils is mainly driven by geographic distance. J. Soil Sediment. 2018, 18, 1795–1805. [Google Scholar] [CrossRef]
  28. Lauber, C.L.; Strickland, M.S.; Bradford, M.A.; Fierer, N. The influence of soil properties on the structure of bacterial and fungal communities across land-use types. Soil Biol. Biochem. 2008, 40, 2407–2415. [Google Scholar] [CrossRef]
  29. Huang, X.P.; Mo, C.H.; Yu, J.; Zhao, H.M.; Meng, C.; Li, Y.W.; Li, H.; Cai, Q.Y.; Wong, M.H. Variations in microbial community and ciprofloxacin removal in rhizospheric soils between two cultivars of Brassica parachinensis L. Sci. Total Environ. 2017, 603–604, 66–76. [Google Scholar] [CrossRef]
  30. Granzow, S.; Kaiser, K.; Wemheuer, B.; Pfeiffer, B.; Daniel, R.; Vidal, S.; Wemheuer, F. The effects of cropping regimes on fungal and bacterial communities of wheat and faba bean in a greenhouse pot experiment differ between plant species and compartment. Front. Microbiol. 2017, 8, 902. [Google Scholar] [CrossRef]
  31. Zhang, J.; Zhang, B.; Liu, Y.; Guo, Y.; Shi, P.; Wei, G. Distinct large-scale biogeographic patterns of fungal communities in bulk soil and soybean rhizosphere in China. Sci. Total Environ. 2018, 644, 791–800. [Google Scholar] [CrossRef]
  32. Rousk, J.; Bååth, E.; Brookes, P.C.; Lauber, C.L.; Lozupone, C.; Caporaso, J.G.; Knight, R.; Fierer, N. Soil bacterial and fungal communities across a pH gradient in an arable soil. ISME J. 2010, 4, 1340–1351. [Google Scholar] [CrossRef] [PubMed]
  33. Chen, M.N.; Zhang, J.C.; Liu, H.; Wang, M.; Pan, L.J.; Chen, N.; Wang, T.; Jing, Y.; Chi, X.Y.; Du, B.H. Long-term continuously monocropped peanut significantly disturbed the balance of soil fungal communities. J. Microbiol. 2020, 58, 563–573. [Google Scholar] [CrossRef] [PubMed]
  34. Hu, X.J.; Gu, H.D.; Liu, J.J.; Zhou, B.K.; Wei, D.; Chen, X.L.; Wang, G.H. High variation of fungal communities and associated potential plant pathogens induced by long-term addition of N fertilizers rather than P, K fertilizers: A case study in a Mollisol field. Soil Ecol. Lett. 2022, 4, 348–361. [Google Scholar] [CrossRef]
  35. Kuramae, E.; Hillekens, R.; de Hollander, M.; van der Heijden, M.; van den Berg, M.; van Straalen, N.; Kowalchuk, G. Structural and functional variation in soil fungal communities associated with litter bags containing maize leaf. FEMS Microbiol. Ecol. 2013, 84, 519–531. [Google Scholar] [CrossRef] [PubMed]
  36. Tagawa, M.; Tamaki, H.; Manome, A.; Koyama, O.; Kamagata, Y. Isolation and characterization of antagonistic fungi against potato scab pathogens from potato field soils. FEMS Microb. Lett. 2010, 305, 136–142. [Google Scholar] [CrossRef] [PubMed]
  37. Xiong, W.; Li, R.; Ren, Y.; Liu, C.; Zhao, Q.; Wu, H.; Jousset, A.; Shen, Q. Distinct roles for soil fungal and bacterial communities associated with the suppression of vanilla Fusarium wilt disease. Soil Biol. Biochem. 2017, 107, 198–207. [Google Scholar] [CrossRef]
  38. Johnson, J.M.; Ludwig, A.; Furch, A.; Mithöfer, A.; Scholz, S.S.; Reichelt, M.; Oelmüller, R. The beneficial root-colonizing fungus Mortierella hyalina promotes the aerial growth of Arabidopsis and activates calcium-dependent responses which restrict Alternaria brassicae-induced disease development in roots. Mol. Plant Microbe Interact. 2019, 32, 351–363. [Google Scholar] [CrossRef] [PubMed]
  39. Osorio Vega, N.W.; Habte, M.; León Peláez, J.D. Effectiveness of a rock phosphate solubilizing fungus to increase soil solution phosphate impaired by the soil phosphate sorption capacity. Rev. Fac. Nac. Agron. 2015, 68, 7627–7636. [Google Scholar] [CrossRef]
  40. Tamayo-Velez, A.; Osorio, N.W. Co-inoculation with an arbuscular mycorrhizal fungus and a phosphate-solubilizing fungus promotes the plant growth and phosphate uptake of avocado plantlets in a nursery. Botany 2017, 95, 539–545. [Google Scholar] [CrossRef]
  41. Aranyi, N.R.; Varga, I.; Poczai, P.; Cernák, I.; Vida, G.; Molnár-Láng, M.; Hoffmann, B. What types of powdery mildew can infect wheat-barley introgression lines? Eur. J. Plant Pathol. 2014, 139, 19–25. [Google Scholar] [CrossRef]
  42. Zhao, J.L.; Xu, C.; Xu, J.P.; Huang, L.S.; Zhang, D.Y.; Liang, D. Forecasting the wheat powdery mildew (Blumeria graminis f. Sp. tritici) using a remote sensing-based decision-tree classification at a provincial scale. Australas. Plant Pathol. 2018, 47, 53–61. [Google Scholar]
  43. Wu, Q.; Sun, R.Y.; Ni, M.; Yu, J.; Li, Y.Q.; Yu, C.J.; Dou, K.; Ren, J.H.; Chen, J. Identification of a novel fungus, Trichoderma asperellum GDFS1009, and comprehensive evaluation of its biocontrol efficacy. PLoS ONE 2017, 12, e0179957. [Google Scholar] [CrossRef] [PubMed]
  44. Zhai, T.T.; Wang, Y.F.; Liu, C.L.; Zhao, M.; Chang, Y.; Zhang, R.S. Trichoderma asperellum ACCC30536 inoculation improves soil nutrition and leaf artemisinin production in Artemisia annua. Acta Physiol. Plant. 2019, 41, 46. [Google Scholar] [CrossRef]
Figure 1. Fungal Chao1 and Shannon diversity indices of 40 different soils (A,B), four regions (C,D), and three crop types (E,F). The boxplots present medians and each sample. DLTa, DLBn, and DLHv respectively represent wheat, rapeeed, and barley soils in DL county. HZTa, HZBn, and HZHv respectively represent wheat, rapeeed, and barley soils in HZ county. GHTa, GHBn, and GHHv respectively represent wheat, rapeeed, and barley soils in GH county. DTTa, DLBn, DTHv, and DTTa-Hv respectively represent wheat, rapeeed, barley, and wheat/barley soils in DT county. 1, 2, 3, 4 or 5 represent the number of sample. DLTBH: DL region soils; HZTBH: HZ region soils; GHTBH: GH region soils; DTTBH: DT region soils; DLHZGHDTTa: wheat soils; DLHZGHDTBn: rapeseed soils; and DLHZGHDTHv: barley soils.
Agriculture 14 00006 g001
Figure 2. PCoA plots of fungal community structures in 40 different soil samples (A), four regions (B), and three crop types (C). Each point represents a sample. Samples from the same group are marked in the same color.
Agriculture 14 00006 g002
Figure 3. NMDS ordination patterns of fungal community compositions in 40 soil samples (A), four regions (B), and three crop types (C). Each point represents a sample, and the distance between points represents the degree of difference. Samples from the same group are marked in the same color.
Agriculture 14 00006 g003
Figure 4. Venn diagram showing shared and unique fungal OTUs. (A) Among 40 different soils. (B) Among four regions. DLTBH, HZTBH, GHTBH, and DTTBH represent the DL, HZ, GH, and DT soils, respectively. (C) Among three crop soils. DLHZZGHDTTa, DLHZZGHDTBn, and DLHZZGHDTHv represent wheat soil, rapeseed soil, and barley soil, respectively.
Agriculture 14 00006 g004
Figure 5. Heatmap of the 30 highly abundant OTUs characterizing community differences in each sample. Each row represents a different OTU, and the abscissa is the name of a different sample repetition.
Agriculture 14 00006 g005
Figure 6. Relative abundances of the top 20 phyla in 40 soil samples (A), four regions (B), and three crop types (C). The abscissa is the name of the soil sample. The ordinate is the relative abundance of the different phyla. In the legend, each colored box corresponds to the phylum name on the right.
Agriculture 14 00006 g006
Figure 7. Relative abundances of fungal classes in 40 soil samples (A), four regions (B), and three crops (C). The abscissa is the name of the soil sample. The ordinate is the relative abundance of different class. In the legend, each colored box corresponds to a class name on the right. “Others” refers to taxa other than the 30 classes with the highest relative abundances.
Agriculture 14 00006 g007
Figure 8. Heatmap of fungal community composition analyzed at the top 30 genus levels in 40 soil samples (A), four locations (B), and three crops (C). The abscissa is the name of the soil sample. The ordinate is the relative abundance of different genera. In the legend, each colored box corresponds to a genus name on the right. “Others” represents taxa other than the 30 genera with the highest relative abundances.
Agriculture 14 00006 g008
Figure 9. Cladogram presenting the phylogenetic distribution of fungal taxa in four regions (A) and three crop types (B) based on LEfSe analysis. DLTBH: DL region soils; HZTBH: HZ region soils; GHTBH: GH region soils; DTTBH: DT region soils; DLHZGHDTTa: wheat soils; DLHZGHDTBn: rapeseed soils; DLHZGHDTHv: barley soils.
Agriculture 14 00006 g009
Table 1. Results of the univariate analysis on the effects of region and crop type on fungal α-diversity indices, genera, and soil physicochemical properties.
Fungal Genera or Soil Physicochemical PropertiesRegionCropRegion × Crop
FpFpFp
Ace31.7950.00010.2700.0003.3250.005
Chao131.1370.0006.8590.0023.7340.002
Shannon8.9840.00061.9720.0000.8810.512
Simpson6.7910.00049.2900.0004.1940.001
Goods coverage11.9170.00022.6130.0002.7130.017
pH25.5430.0001.6580.1966.1470.000
Organic matter58.7210.0002.5090.0863.4820.004
Ammonium nitrogen8.4140.0001.8130.1681.3350.248
Nitrate nitrogen16.8500.0001.4950.2293.6140.003
Total phosphate31.0920.0007.7820.0014.5130.000
Effective phosphate5.3490.0028.1270.0015.4790.000
Total sulfur50.4970.0001.8310.16526.4520.000
Effective sulfur16.7680.0003.0640.0517.1260.000
Chaetomium2.4820.065536.6880.0002.1070.058
Unclassified genus1.2780.28616.3190.0001.1620.332
Blumeria1.6590.18031.4540.0001.2650.280
Mortierella14.6440.00043.1000.0002.8520.013
Unclassified Lasiosphaeriaceae19.9260.00016.7800.0007.5890.000
Schizothecium8.8610.0001.2170.3001.5160.180
Tetracladium2.1560.09812.0520.0001.3480.243
Monographella3.1650.0280.2170.8060.6170.716
Olpidium2.7730.0456.9560.0012.8130.014
Nectria4.3010.0076.7340.0023.9160.001
Table 2. Correlation among selected fungal genera, measured diversity indices, and soil physicochemical properties.
α-Diversity Indices and Soil PropertiesChaetomiumUnclassified GenusBlumeriaMortierellaUnclassified LasiosphaeriaceaeSchizotheciumTetracladiumMonographellaOlpidiumNectria
Ace0.329 *−0.044−0.424 **0.281−0.287−0.374*−0.2840.237−0.035−0.417 **
Chao10.303−0.027−0.411 **0.313−0.292−0.388*−0.2810.261−0.026−0.412 **
Shannon−0.780 **0.667 **0.1430.770 **0.317 *0.1140.333 *0.011−0.510 **0.156
Simpson−0.787 **0.655 **0.1880.658 **0.398 *0.1710.383 *0.047−0.502 **0.272
Altitude0.028−0.0730.059−0.2930.1440.1500.280−0.0790.0320.367 *
pH−0.1320.088−0.0020.1440.0420.046−0.011−0.0010.0100.049
Water content0.345 *−0.208−0.273−0.063−0.153−0.136−0.448 **0.458 *0.184−0.410 *
Organic matter0.119−0.040−0.0870.063−0.206−0.208−0.1620.2920.042−0.203
Ammonium nitrogen0.119−0.061−0.144−0.1200.326 *−0.0360.398 *0.120−0.0380.301
Nitrate nitrogen−0.0690.1670.015−0.166−0.321 *−0.0960.1690.339 *0.063−0.201
Total phosphate0.144−0.077−0.0840.113−0.319 *−0.281−0.0800.142−0.099−0.128
Effective phosphate−0.042−0.058−0.0370.1540.179−0.030−0.0150.060−0.1140.076
Total sulfur0.087−0.094−0.091−0.127−0.078−0.109−0.1520.387 *0.014−0.087
Effective sulfur0.011−0.019−0.016−0.039−0.153−0.163−0.0440.2010.118−0.250
*—correlation is significant at the 0.05 level, **—correlation is significant at the 0.01 level.
Table 3. Correlation analysis between fungal diversity and soil physicochemical properties.
Soil Physicochemical PropertiesAceChao1ShannonSimpson
Altitude–0.342 *–0.351 *–0.204–0.200
pH–0.114–0.1020.2000.104
Water content0.420 **0.438 **–0.174–0.208
Organic matter0.429 **0.426 **0.0080.085
Ammonium nitrogen–0.074–0.088–0.137–0.092
Nitrate nitrogen–0.028–0.0110.0800.080
Total phosphate0.527 **0.501 **–0.0350.030
Effective phosphate0.1710.1390.0990.174
Total sulfur0.1330.139–0.050–0.004
Effective sulfur0.2490.264–0.006–0.029
*—correlation is significant at the 0.05 level, **—correlation is significant at the 0.01 level.
Disclaimer/Publisher’s Note: The statements, opinions and data contained in all publications are solely those of the individual author(s) and contributor(s) and not of MDPI and/or the editor(s). MDPI and/or the editor(s) disclaim responsibility for any injury to people or property resulting from any ideas, methods, instructions or products referred to in the content.

