Article

The Impact of Agricultural Insurance on Planting Structure Adjustment—An Empirical Study from Inner Mongolia Autonomous Region, China

College of Economics and Management, Inner Mongolia Agricultural University, Hohhot 010018, China
*
Author to whom correspondence should be addressed.
Agriculture 2024, 14(1), 41; https://doi.org/10.3390/agriculture14010041
Submission received: 6 December 2023 / Revised: 21 December 2023 / Accepted: 22 December 2023 / Published: 25 December 2023

Abstract

:
Agricultural insurance is a risk management tool developed to guarantee regional production and national food security. Based on survey data from 629 households in the Inner Mongolia autonomous region, China, this paper examines the impact of agricultural insurance on farmers’ planting structure. The results show that: (1) Farmers’ participation in agricultural insurance significantly affects their planting structure, especially lowering the level of specialization in production; insured households are about 3–6% lower than the non-insured, and there is a complementary effect between insurance participation and diversified planting. (2) For different types of farmers, participating in insurance has different effects on their agricultural production structure. Farmers purchasing insurance with low or medium levels in proportion to agricultural income significantly reduce the degree of production specialization. The effect of participation in insurance on large-scale farmers’ adjustment of planting structure is more obvious. For pure grain farmers, participation in insurance will reduce planting specialization by about 3–4%. (3) Participation in agricultural insurance will encourage farmers to plant grain crops, but the effect is small. Therefore, we need to expand the coverage areas, increase insurance types, and improve coverage levels; the products should be more targeted and differentiated, strengthening farmers’ participation in complete cost insurance and income insurance.

1. Introduction

The planting structure of farm crops is a matter of national food security and the effective supply of important agricultural products; Chinese No. 1 central documents in recent years have been highly concerned about it. They stressed the need to deepen the agricultural structure adjustment in 2021. Since 2000, China’s crop planting structure has undergone significant changes, with the crop grain-to-economic ratio gradually decreasing from 2000 to 2003, from 69.39:30.61 to 65.22:34.78, increasing from 2004 to 2016 from 66.17:33.83 to 71.42:28.58, and gradually decreasing from 2017 to 2020 from 70.94:29.06 to 69.72:30.28. The continuous adjustment of China’s crop planting structure has been accompanied by a new round of policy-oriented agricultural insurance pilots since 2004, especially the leapfrog development of agricultural insurance since 2007. From 2007 to 2021, China’s agricultural insurance premium income increased from CNY 5.18 billion to CNY 96.518 billion, an increase of nearly 18 times, and the risk protection provided increased from CNY 112.6 billion to CNY 4.78 trillion; the financial premium subsidies expanded from 5 varieties in 2007 to 16 major agricultural products and more than 60 local advantageous agricultural products, basically covering the major agricultural products that are related to the people’s livelihood and food security. In terms of coverage level, the insurance coverage level of the planting industry increased from 3.84% in 2008 to 12% in 2018, with a compound annual growth rate of 10.92% [1]. As shown in Figure 1, the sown area of grain crops also showed a basic increasing trend, from 69.13% in 2008 to 71.42% in 2016. From the coverage level of major agricultural products, the effect of agricultural insurance expanding the pilot areas and improving the coverage level is beginning to show, and the insurance coverage level of grain crops was 29.42% in 2018, as shown in Figure 2, including 36.7% for wheat, 25.94% for corn, 27.64% for rice, 20.35% for soybean, 47.06% for cotton, 14.59% for oil crops, and 19.98% for sugar crops. Therefore, from a macro perspective, agricultural insurance seems to manage revenue risk in agriculture for Chinese farmers, but from a micro perspective, does agricultural insurance encourage farmers to adjust their planting structure? Further, has the planting behavior of farmers become a grain production or non-grain production trend due to the difference in insurance coverage levels between grain crops and economic crops?
At present, when discussing the adjustment of farmers’ planting structure, scholars have mainly emphasized the influence of changes in various factors, such as markets, resource endowments, policy environments, and so on, but have not been able to study the role of agricultural insurance on planting structure from the perspective of risk coverage based on household survey data, which is the entry point of our paper. This study combines theoretical analysis with empirical testing. From the theoretical level, it analyzes the microscopic mechanisms of agricultural insurance participation on crop planting structure adjustment. Empirical analysis is based on a field survey of 629 farmers in the Inner Mongolia autonomous region, China. It also measures the actual effect of agricultural insurance participation on planting structure adjustment and farmers’ behavior, taking into account different household income types, farmland sizes, and farmers’ grain types. The findings of this study can be used to identify the effect of agricultural insurance participation on planting structure adjustments of farmers in northern China, especially in the major grain-producing areas. This study provides a reference for decision-making through agricultural insurance policy optimization to help promote China’s agricultural supply-side structural reform, guide the reasonable regional layout of agricultural production, and ensure national food security.

2. Literature Review

Since the end of last century and the beginning of this century, agricultural insurance has been widely implemented as one of the tools of agricultural risk management. The impact of agricultural insurance on the crop planting structure of farmers has become a research hotspot in the theoretical and practical circles of agricultural insurance in the US and Europe. In recent years, along with the gradual piloting of agricultural weather index insurance around the world, some scholars, by using randomized intervention experiments, have studied the causal relationship between index insurance and farmers’ planting structure.
Scholars agree that insurance will reduce the risk of planting crops and encourage farmers to change their planting structure. Specifically, agricultural insurance will encourage farmers to reduce areas with lower insurance coverage of crops and increase areas with higher insurance coverage, which will lead to changes in the agricultural production structure and even household income structure. Turvey (1992) found that before government subsidies for crop insurance premiums, the proportion of acreage planted in corn and soybeans was 6% and 60%, respectively, and after financial subsidies, it was 60% for corn and 40% for soybeans; therefore, premium subsidization encouraged the production of high-risk crops [3]. Young, Vandeveer, and Schnepf (2001) studied how insurance affects farm production in seven regions and eight major field crops in the US. Total planted acreage to major field crops would be about 0.4% higher with government-subsidized crop insurance than in the absence of any insurance program, or about 960,000 acres, with wheat and corn accounting for about 75% of the additional acreage [4]. Barnett et al. (2002), using cotton production in the Mississippi River region of the US as an example, found that a 1% increase in expected returns is associated with a 0.036% increase in cotton acreage [5]. Goodwin, Vandeveer, and Deal (2004) found that crop insurance significantly affects farmers’ crop acreage allocation, but the effect is small and varies by crop and region; for example, a 30% reduction in insurance premiums would result in a 1% increase in acreage for barley in the northern Great Plains and a 0.28% to 0.49% increase in corn in the heartland [6]. Seo et al. (2005) found that these federal risk management programs increased optimal cotton acreage by 94% to 144% and decreased sorghum acres by up to 50% [7]. Zhang et al. (2006) found that only 2.3% of farmers increased their grain area after participating in rice insurance in China (Shanghai) due to the low level of coverage [8]. O’Donoghue, Roberts, and Key (2009) found that Federal Crop Insurance significantly affects farmers’ diversification [9] and that it leads to more specialization, although to a lesser extent [10]. Mobarak and Rosenzweig (2012), using India as an example, found that in an experimental setting, rice farmers who were offered the index insurance product were more likely to subsequently plant a portfolio of rice varieties [11]. Capitanio et al. (2014) used a wheat and tomato farm in Puglia, Italy, as an example, and the results showed that under the current crop insurance programs, tomato production was expected to expand, whereas the opposite was true for wheat production. However, as farmer risk aversion increased, the optimal tomato acreage decreased, and optimal wheat acreage increased [12]. In terms of theoretical analysis, Zong and Zhou (2014) point out that agricultural insurance affects farmers’ production behavior through the level of income substitution and the degree of insurance compensation within the same production behavior and between different production behaviors and that the current level of agricultural insurance income compensation satisfies the income risk diversification expectations of most farmers, thus having a solidifying effect on farmers’ production behavior of major crops [13]. Elabed and Carter (2015) randomly distributed the possibility of being insured and feeling insured to a group of cotton cooperatives in Mali by giving them access to a microinsurance contract and found that offering insurance resulted in a 15% increase in the area in cotton [14]. Cai (2016), through a natural experiment, studied the impact of tobacco insurance on farmers’ production in Jiangxi Province, China, and found that households tend to increase tobacco production by approximately 16% once they are insured [15]. Xu and Sun (2016) concluded that the current agricultural insurance in China has a role in encouraging farmers to expand their sown area to increase agricultural income, and the change in area is significant. However, the lack of coverage leads to the participation in insurance and has little effect on enhancing farmers’ willingness to grow grain crops [16]. Liu et al. (2016) found that agricultural insurance can solidify farmers’ production behavior and planting structure to a certain extent and trigger a shift in planting structure from low to high insurance items; especially, the adjustment trend of soybean and corn is significant [17]. Claassen et al. (2017) concluded that crop income insurance increased the acreage of cropland devoted to continuous corn and continuous soybeans by 4.07% and 3.29%, whereas less land was planted with continuous wheat, which decreased by 14.4% [18]. Deryugina and Konar (2017) found that farmer participation in insurance led to an expansion in the acreage of the more water-consuming cotton crop, with a 1% increase in insured crop acreage leading to a 0.624% increase in cotton acreage, or 95,602 acres [19]. Fu and Liang (2017) show that agricultural insurance significantly enhances farmers’ tendency to specialize and weakens diversification, and this effect is obviously characterized by lag and regional heterogeneity [20]. Yu, Smith, and Sumner (2018) argued that crop insurance premium subsidies affect patterns of crop acreage for two reasons. First, the direct profit effect. By holding insurance coverage constant, premium subsidies directly increase expected profit, which encourages more acreage of insured crops. Second, the indirect coverage effect. Premium subsidies encourage farms to increase crop insurance coverage. With more insurance coverage, farms obtain more subsidies, and farm revenue becomes less variable as indemnities offset revenue shortfalls, so the acreage of insured crops likely increases. A 10% increase in the premium subsidy causes a 0.43% increase in the acreage of a crop in a county [21]. Zhang et al. (2019) point out that different agricultural insurance premium subsidy standards can be provided for grain crops and economic crops, so as to guide farmers to adjust their crop structure [22]. Fang et al. (2019) found that the pilot of “Insurance + Futures” can effectively improve farmers’ motivation to grow grain [23]. Based on the microdata of 10,270 households in the Third China Agricultural Census, Ren and Yang (2020) found that, after participating in insurance, farmers with an operating area of fewer than 10 acres mostly chose to adjust the area, while those with 10–50 acres chose to adjust the structure. Farmers show “adventurous” production decisions for economic crops and relatively “conservative” decisions for grain crops; agricultural insurance participation will make small farmers’ planting structure tend to be “non-grain production” and promote the specialization of economic crops [24]. In addition, some scholars have analyzed climate change as an influencing factor and found that farmers will adjust their planting behavior in response to climate change. Cole, Giné, and Vickery (2013) found that the provision of rainfall insurance induces farmers to shift production towards higher-return but higher-risk cash crops by 15%, particularly among more educated farmers [25]. Karlan et al. (2014) found that participation in rainfall index insurance in Ghana led to expanding the sown area of farm crops; insured farmers shifted the mix of their crops to highly rainfall-sensitive maize and increased the share of their land planted with maize by 9 percentage points [26]. Hill et al. (2019) conducted a randomized controlled trial in Bangladesh and found that during the aman rice growing season (monsoon season, June to mid-November each year), farmers’ participation in index insurance increased by 20% in the total rice area under cultivation [27]. Que et al. (2022) used Mann–Kendall and Sen slope tests to find how rice farmers adapt production to climate change. Three adaptation strategies are frequently employed in the Nong Cong district: adjusting the seasonal calendar to alter transplanting and harvesting timing, increasing fertilizer and pesticide application, and changing to fast-growing varieties [28]. Therefore, in the future climate change scenario, farmers’ planting specialization behavior would be affected by changes in meteorological patterns.
Based on the above incomplete literature review, scholars are more concerned about how agricultural insurance participation affects planting structure and generally believe that agricultural insurance will induce farmers to adjust their crop planting structure, especially to expand the planting area of insurable or high subsidy rate crops, i.e., farmers tend to specialize their agricultural production. The research methods mostly combine theoretical analysis and empirical tests, and most of the research subjects chose the US because it has more than 80 years of agricultural insurance history and has abundant micro farm or plot and county-level time series or panel data, which can allow academics and industry to conduct in-depth and detailed research. Although Chinese scholars’ research has theoretical analysis and empirical tests, they mostly use macro-provincial time series or panel data, and there are few analyses based on micro-household surveys in China.
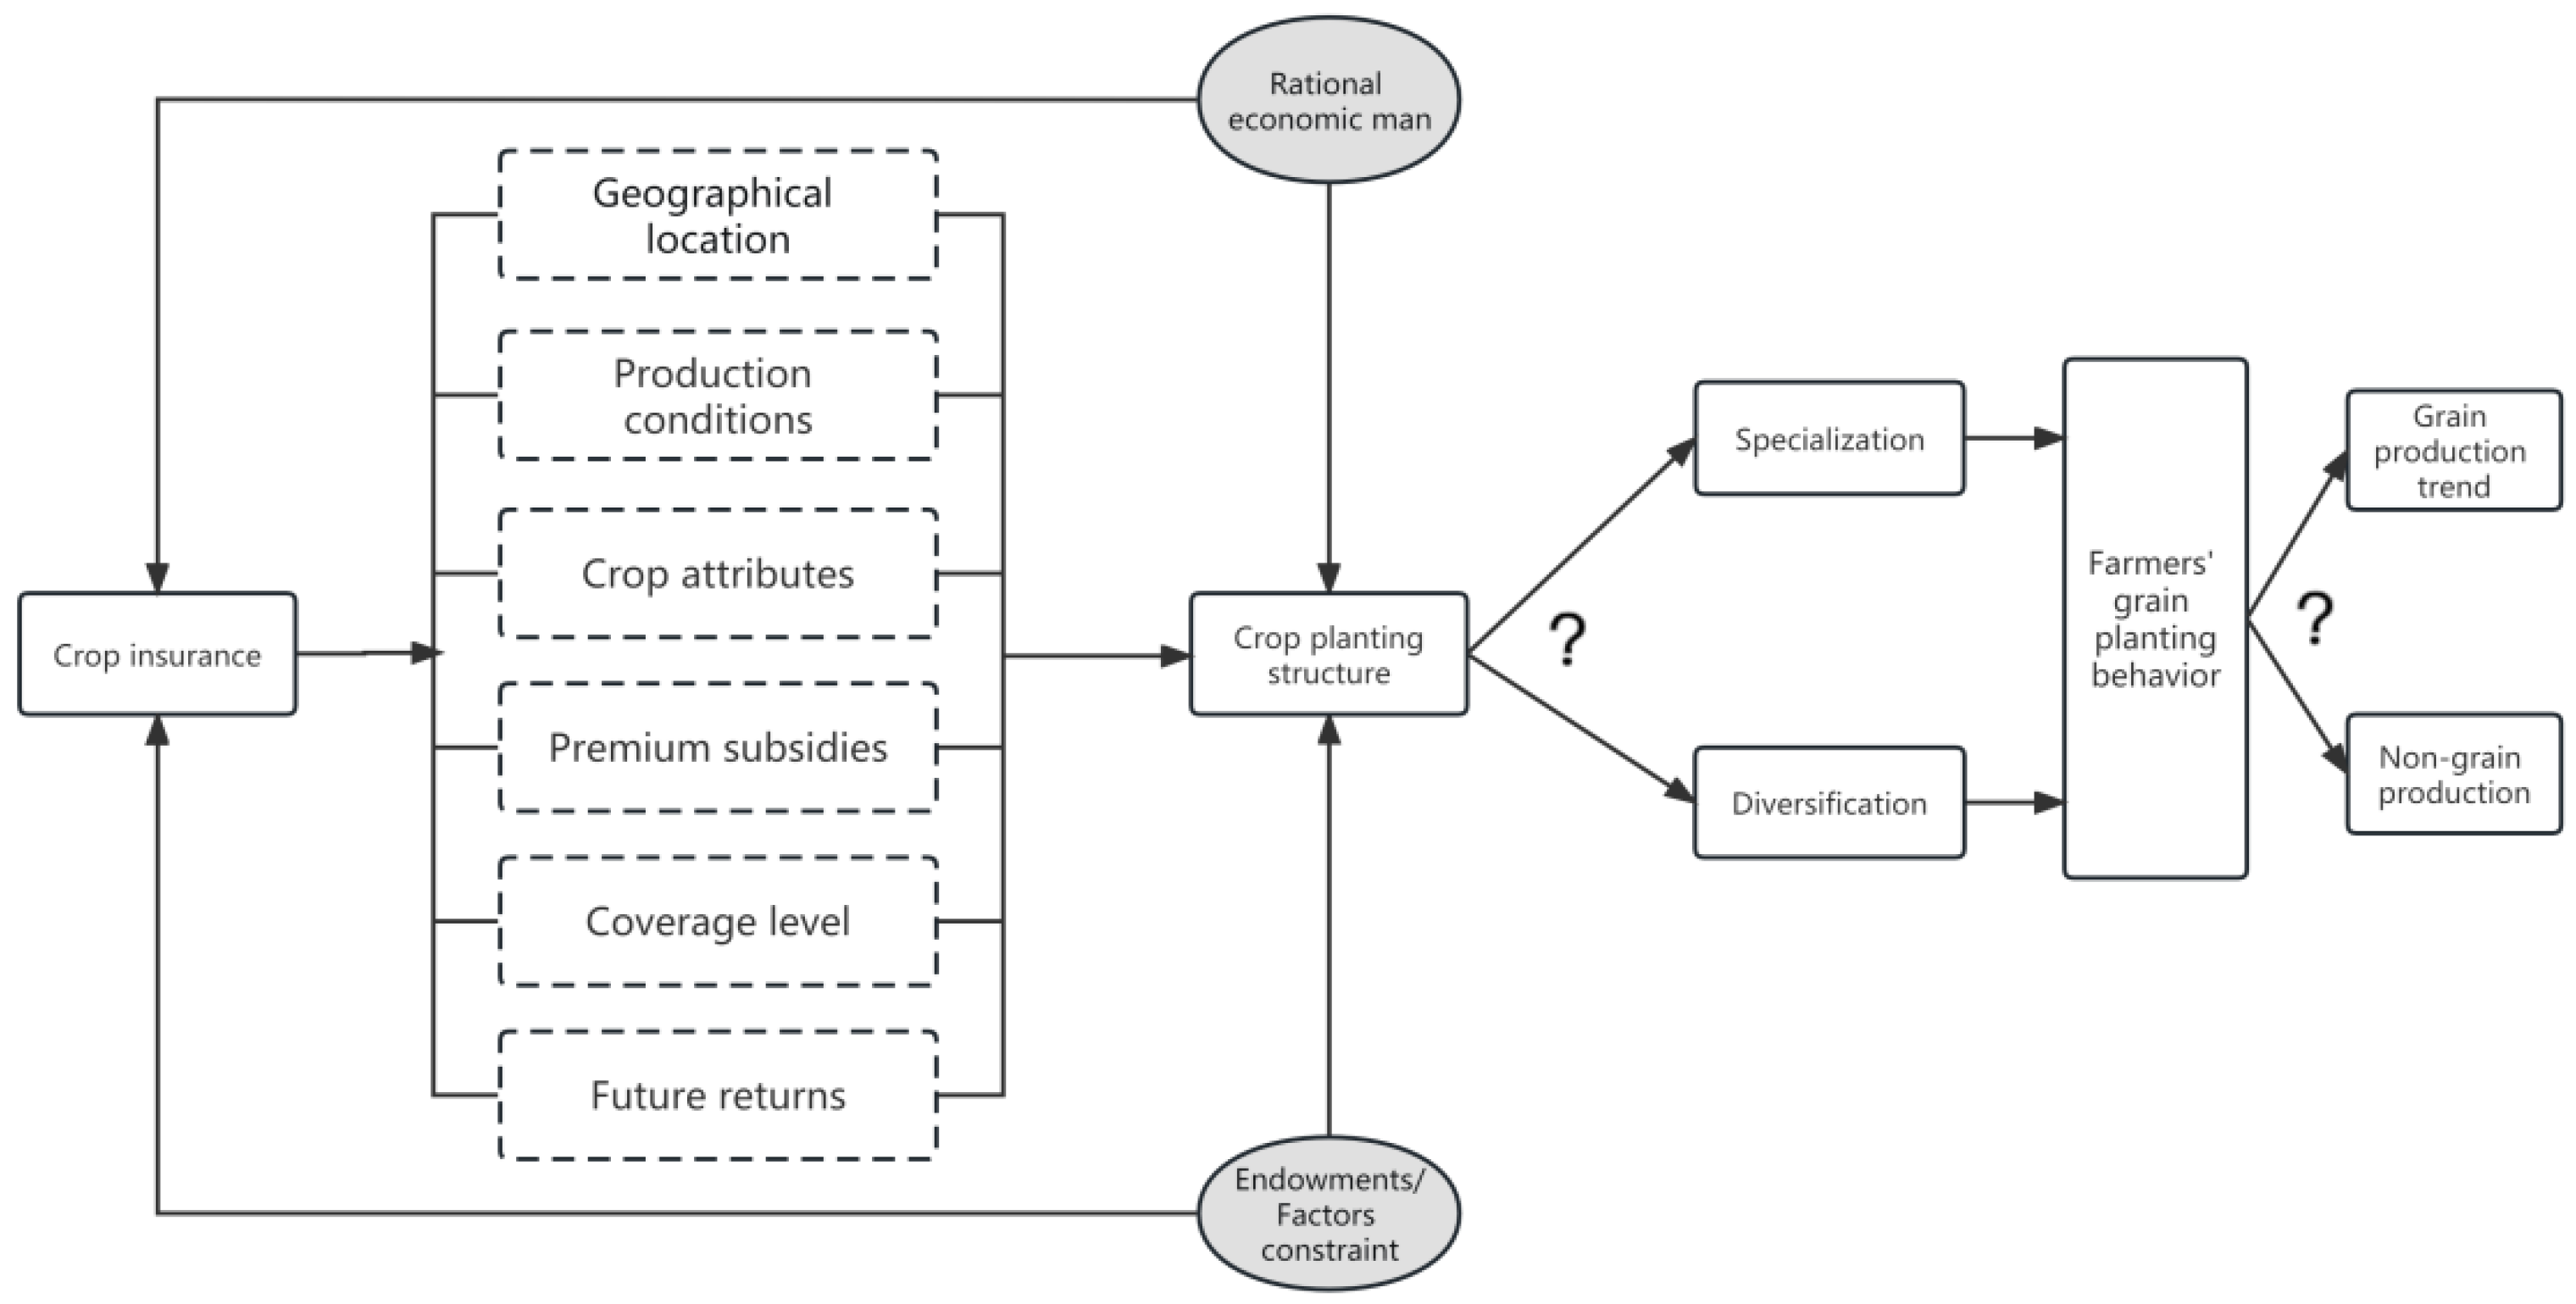
This paper is dedicated to supplementing the above aspects: first, to analyze theoretically the influence mechanism of agricultural insurance participation on farmers’ planting behavior and provide an explanation for the influence of agricultural insurance policy on farmers’ production behavior. Second, to distinguish the influence of agricultural insurance on farmers’ planting behavior as diversification or specialization and further analyze whether it is grain production trend or non-grain production. This discussion is of great significance because planting specialization is the main feature of modern agricultural production, and grain-oriented planting is conducive to ensuring national food security. Third, the empirical evidence is collected through field survey data, and the possible endogeneity of the model is fully considered to ensure the reliability of the research findings. Therefore, the research results of this paper can further expand the current analysis of the micro role of agricultural insurance in China’s theoretical and practical circles and integrate agricultural insurance policy and agricultural structural adjustment, especially farmers’ grain growing behavior. It can enrich research on the impact of China’s agricultural insurance policies on farmers’ production behavior. Fourth, the existing literature mostly demonstrates the effect of yield insurance or income insurance on farmers’ production behavior. We analyze the impact of materialized cost insurance on farmers’ production behavior. In terms of application value, in the context of the in-depth promotion of China’s agricultural supply-side structural reform and the increasing importance of comprehensively improving the ability to guarantee national food security, after more than 10 years of exploration and accumulation, China’s agricultural insurance is transforming into high-quality development. This study investigates whether materialized cost insurance at low coverage levels can lead farmers to change their planting behavior. It is different from existing scholars’ research based on output or income insurance; this insurance policy has Chinese characteristics. The results can provide convincing theoretical and empirical evidence for further optimization of the agricultural insurance system, as well as decision support for the government to formulate policies to strengthen agricultural insurance to help the development of agricultural modernization.

3. Mechanism Analysis

Farmers, as rational economic men, base their planting decisions on multiple objectives, simultaneously considering profit maximization, risk minimization, and household labor input minimization. The profit objective has the largest weight, the labor objective has the second-largest weight, and the risk objective has the smallest weight [29]. In practice, farmers’ planting decisions are a series of choices about planting varieties, planting areas, and planting methods under the constraints of three types of factors: land, labor, and capital, based on the goal of profit maximization [30].
Within agriculture, different sectors have different input–output systems; thus, the focus on steps and effects of agricultural insurance may vary [31]. In general, farmers participate in agricultural insurance to reduce income fluctuations and to avoid losses due to disasters in order to stabilize their production, or to increase agricultural inputs to expand production with confidence [32]. The regional characteristics of agricultural production are obvious, and the differences in natural conditions in different geographical areas will lead to heterogeneity in crop types, distribution of advantageous agricultural resources, and agricultural production risks, which in turn will affect the selection of agricultural insurance policies and their market conditions in different regions [33]. This is true even at this stage when agricultural insurance policies are issued by all provinces. Differences in agricultural production conditions, such as infrastructure conditions, affect the planting structure of farmers [34] and their insurance choices. At the same time, participation in insurance affects farmers’ production behavior, which is related to the probability of damage to their environment [35]. Wu et al. (2015) found that at the national level, irrigation facilities and substandard highways promote grain cultivation in China; at the provincial level, irrigation facilities increase the proportion of grain crops in central and western China but have a negative effect in the east; classified highways have a negative effect on grain crops in the middle and west, and substandard highways promote grain crops in the middle [36]. For a long time, the low comparative efficiency of farmers in grain crops and the rising cost of land transfer have led to widespread “non-grain production”; at the same time, there is a misunderstanding between under-insured and over-insured agricultural insurance varieties in China. Moreover, participation in insurance will make farmers’ planting structure tilt toward the insured varieties [13]. In the case of over-insured economic crops, agricultural insurance may induce the trend of “non-grain production”, which will affect the planting structure and specialization of farmers. Zhang and Yin (2019) pointed out that one of the reasons for the heterogeneity of crop insurance participation rates among eastern, central, and western regions of China is the crop planting structure. Participation in insurance causes farmers to plant insured crop varieties with premium subsidies and high coverage levels [37]. Luo et al. (2011) argued that higher financial subsidies can lower the entry barrier to agricultural insurance so that most farmers can enjoy insurance coverage; higher insurance coverage levels and subsidies will induce farmers to re-cultivate land that was previously abandoned due to excessive risk (i.e., inferior land), which, in turn, will increase the effective sown area of agriculture [38]. Zhang (2012) found that agricultural insurance would induce farmers to re-cultivate land that had been abandoned for years to grow crops in order to obtain the expected income from premium subsidies [39]. Ren et al. (2021) found that the level of agricultural insurance coverage had an inverted U-shaped effect on agricultural production efficiency based on a survey of 1290 households in Hubei, Jiangxi, Sichuan, and Yunnan provinces, China. The improvement in coverage level can improve the specialization level of farmers’ planting structure in the short term and then promote their production investment [40,41]. In addition, the impact of choosing agricultural insurance to address production risk as a policy tool on the distribution of households’ future returns varies by household variety [42] and may have a role in adjusting the planting structure.
Based on the literature review and the above analysis, it is clear that participation in insurance will change the risk profile of farmers’ agricultural production, which is closely related to a series of factors, such as geographical location, agricultural production conditions, crop attributes, premium subsidies, coverage level, and future returns, which, in turn, will motivate them to adjust their planting decisions. During the initial development stage and rapid expansion stage of agricultural insurance from 2007 to 2016, China’s agricultural insurance was promoted on the principle of “wide coverage, low protection”. Some scholars have pointed out that the insufficient level of protection has always been the shortcoming of China’s agricultural insurance. Therefore, the impact of agricultural insurance on farmers’ specialized planting behavior may be relatively limited. Taking the example of the materialized cost insurance that farmers in Inner Mongolia participated in widely in 2018, the empirical analysis of whether agricultural insurance promotes more specialization or diversification of farmers’ agricultural production. Furthermore, how does participation in insurance affect farmers’ grain-growing behavior? It is a tendency for grain production or non-grain production in farmers’ agricultural production. All of these questions require rigorous empirical testing. The mechanism of agricultural insurance on farmers’ crop planting structure adjustment is shown in Figure 3.

4. Data Sources, Variable Selection, and Model Setting

4.1. Data Sources

The Inner Mongolia Autonomous Region is one of the 13 major grain-producing areas in China and one of the five grain-scale external transfer provinces. In 2022, the annual grain output reached CNY 78.01 billion, ranking sixth. From 2016 to 2021, Inner Mongolia‘s agricultural insurance premium income increased from CNY 3 billion to CNY 5.09 billion, an annual growth rate of 11.15%; the amount of risk coverage provided by agricultural insurance increased from CNY 83.88 billion to CNY 342.5 billion, an annual growth rate of 32.50%.
Our data were obtained from a survey administered to farmers in Inner Mongolia, China, in 2018. It includes 12 cities, 54 counties, 136 towns, and 175 villages, and these areas are associated with a concentration of agricultural production in Inner Mongolia. Data collection followed a multi-stage sampling procedure. In the first stage, 54 counties were randomly selected in 12 cities. In the second stage, two or three towns from each selected county were randomly selected. Next, two or three villages were randomly chosen in each town. In the last stage, we randomly interviewed several farmers in each selected village. The survey consists of information covering personal and household resource endowment, agricultural production, income, and agricultural insurance participation (agricultural insurance participation here refers to materialized cost insurance, which is 80% subsidized by the state, and the remaining 20 % is borne by farmers.), etc. In total, the survey targeted 633 farmers and resulted in 629 usable observations after eliminating the samples with serious missing or abnormal information. The temperature and precipitation data were obtained from the Inner Mongolia Statistical Yearbook.

4.2. Model Setting

In order to test the impact of farmers’ participation in crop insurance on their planting structure, the following model is set up to examine:
I n d e x i = α 0 + α 1 I n s u i + α 2 X i + ε i
where I n d e x i denotes the crop diversification of the i household, I n s u i denotes the crop insurance participation status of the i household, X i is control variable, and ε i is a random disturbance term.

4.3. Measurement of Crop Diversification of Households

A dummy variable has been widely used to reflect crop diversification, but it can only qualitatively indicate whether farmers have diversified crops or not, while the specific degree of diversification cannot be described in detail. In view of this, four indicators are used to characterize the degree of crop diversification of households, including the maximization index ( M I ), Herfindahl index ( H I ), Simpson index ( S I ), and total entropy index ( T E ), and the meaning of each indicator is as follows:

4.3.1. Maximization Index

M I . Specifically, the proportion of the largest crop type planted by the farmers to their total planted area of all crops; M I [ 0 ,   1 ] , M I A higher value indicates a higher degree of crop specialization among farmers.

4.3.2. Herfindahl Index

H I = ( α j / A ) 2 . The Herfindahl index is a measure of the number of crops planted by farmers, where α j indicates the area planted by the farmer for j crop, A indicates the total area planted by the farmer for all crops, H I [ 0 ,   1 ] , H I = 0 indicates the highest degree of crop diversification, and H I = 1 indicates the highest degree of crop specialization with only one type of crop planted by the farmer.

4.3.3. Simpson Index

S I = 1 ( α j / A ) 2 S I [ 0 ,   1 ] , S I = 0 . indicates that the farmer grows only one type of crop and S I = 1 indicates that the farmer has the highest degree of crop diversification.

4.3.4. Total Entropy Index

T E = ( S j × ln ( 1 / S j ) ln ( n ) × 100 ) . Where, S j = α j / A , n indicates the number of crop types grown by the farmers; a larger T E means a higher degree of diversification and a lower degree of specialization.
If both M I and H I are larger and both S I and T E are smaller than before participation in agricultural insurance, or if the insured farmers both M I and H I are larger and both S I and T E are smaller than uninsured farmers, this simply supports that insurance participation has an impact on farmers’ crop planting structure adjustment.

4.4. Estimation Methods

In general, whether farmers adjust their crop structure is not only related to their individual resource endowment characteristics but also based on the expected benefits that can be brought by adjusting their crop structure, so farmers’ adjustment of crop structure may be a result of self-selection, which may result in self-selection bias if regressed directly. In order to obtain the real difference, a possible method is to find the “counterfactual” results, but the observational cross-sectional data can only show one type of status, i.e., insured or uninsured, and no strict counterfactual results can be found. The propensity score matching (PSM) method proposed by Rosenbaum and Rubin (1983) allows for the construction of counterfactual results under a large sample of cross-sectional data and has been widely used in academia [43]. The main reason for endogeneity in the estimation of Equation (1) is that insured and non-insured farmers may not have been randomly selected and have systematic differences. In view of this, the propensity score matching method is adopted to solve the self-selective bias problem. We attempt to find two groups of samples that are as nearly random and compared as possible, based on characteristic variables, which can be for causality test. The method in quantifying the impact of agricultural insurance policies on the farmers’ planting structure, due to the lack of data on insured farmers in the case of their being uninsured, one alternative is to create a treatment group of insured farmers whose main characteristics are as similar as possible to the control group of uninsured farmers before their participation in agricultural insurance. Then, the farmers in the treatment group are matched with the control group one by one so that the paired farmers in the two sample groups differ only in whether they participate in agricultural insurance or not but remain the same or similar in other aspects so that the control group can simulate the “counterfactual situation” of the farmers in the treatment group to the greatest extent possible. Finally, by comparing the crop planting structure of the insured farmers before and after the implementation of the agricultural insurance policy, the causal relationship between the agricultural insurance and the crop planting structure of the farmers can be obtained. The specific steps of PSM are as follows.
The first step is to estimate the propensity score. The propensity score is given the sample characteristic X i , the conditional probability of a farmer’s participation in agricultural insurance p ( X i ) , i.e., p ( X i ) = Pr ( D i = 1 | X i ) = E ( D i | X i ) , this step is to construct a L o g i t or P r o b i t selection model for a farmer’s participation in agricultural insurance. Where X i is a vector of a set of farmer characteristic variables (i.e., matching variables) that may affect the participation of farmers in agricultural insurance; D i denotes the observable participation behavior of the farmers, if D i = 1 , then the farmers participate in agricultural insurance, if D i = 0 , then the farmers do not participate in agricultural insurance.
In the second step, the average treatment effect A T T is estimated. Based on the propensity score values, different matching weight algorithms (e.g., nearest neighbor matching, local linear regression matching, radius matching, Mahalanobis matching, kernel matching, etc.) are used to estimate the average treatment effect A T T of household participation in agricultural insurance in the matching model, i.e., the difference between the crop diversification index in the two cases of household participation in agricultural insurance and their non-participation in agricultural insurance, specifically:
A T T E [ I 1 i I 0 i | D i = 1 ] = E E [ I 1 i | D i = 1 , p ( X i ) ] E [ I 0 i | D i = 0 , p ( X i ) ] | D i = 1
where I 1 i and I 0 i denote the crop diversification index of the same farmer under two scenarios of whether to participate in agricultural insurance. In the PSM estimation, the crop planting diversity index (mainly by the Herfindahl index) of farmers was estimated A T T by five matching weight algorithms: nearest neighbor matching, local linear regression matching, radius matching, Mahalanobis matching, and kernel matching. If the Herfindahl index ( H I ) of A T T is significantly positive, it indicates that insurance participation has a significant effect on farmers’ crop planting structure adjustment, thus suggesting that insurance participation can increase the tendency of households to specialize and weaken diversification behavior. It is important to note, in particular, that propensity score matching can only mitigate the endogeneity problem due to observable variables and cannot deal with endogeneity due to the most critical unobservable variables.

4.5. Variable Selection

4.5.1. Farmers’ Crop Diversification

The degree of crop diversification of households is the dependent variable in this paper, which includes four types of indices, i.e., maximization index ( M I ), Herfindahl index ( H I ), Simpson index ( S I ), and total entropy index ( T E ). The Herfindahl index is chosen in the empirical estimation.

4.5.2. Agricultural Insurance Participation

Whether farmers participate in crop insurance or not is the independent variable of this paper. If it takes the value of 1, farmers participate in crop insurance, and 0 otherwise. The results of comparing the crop planting diversification index of the insured and uninsured households are shown in Table 1. It shows that among 629 households, 416 households participate in insurance, with a participation rate of 66.14%, and 213 households do not participate in insurance; the participation rates of M I and H I of the insured households are 0.78 and 0.72, both lower than the uninsured households, indicating that the degree of crop specialization of the insured households is lower than that of the uninsured households; 0.28 and 49.38 for S I and T E of the insured households, both higher than that of the uninsured households, indicating that the degree of crop diversification of the insured households is higher than that of the uninsured households. Therefore, it is clear from the questionnaire survey that the participation of farmers in crop insurance has not led to more specialization in their agricultural production.

4.5.3. Control Variables

As mentioned in the previous section, farmers’ planting decisions are a series of choices regarding planting varieties, planting areas, and planting methods based on the profit maximization objective under the constraints of three types of factors: land, labor, and capital. Therefore, this paper refers to the existing literature to introduce factors including individual-level characteristics, household-level characteristics, agricultural production resource endowment, and regional attributes of the farmers to reduce estimation bias [44]. The variable definition and descriptive analysis are shown in Table 2. Individual characteristics include some demographic characteristics, such as age and years of education. Table 2 shows that the mean age is 51, and insured households are commonly younger than non-insured households. The mean years of education are close to 7 years, suggesting that most farmers only have primary or junior high school education, and the insured households are 0.35 years higher than the non-insured households. Household characteristics include whether there is a cadre in the family and the proportion of family labor aged 16 to 60. We find that 4% of households have cadres, and insured households have more cadres than non-insured households; the proportion of the family labor force on average is 72%, and the non-insured households are significantly lower than that of insured households. Agricultural production resource endowment includes farmland area, farmland quality, agricultural income share, whether the household has borrowed money or not, the types of livestock kept by the household, the number of agricultural production disasters, temperature, precipitation, etc. The average farmland area of the surveyed farmers is 51.29 mu, and about 55% of farmland is irrigated. The farmland area of insured households is 12 mu more than that of non-insured households, and the proportion of irrigated land is 5% higher. The average share of agricultural income is 63%, indicating that agricultural income is the main source of family income, and insured households are 6% higher than that of non-insured households. About 80% of farmers borrowed money, including 79% of insured households and 82% of non-insured households. The number of agricultural production disasters and the types of livestock raised by the insured households are higher than those of the non-insured households. We add temperature and precipitation as climate change indicators. It shows that farmers in areas with high temperatures and low precipitation are more likely to be insured. In addition, this paper divides the households into three categories according to the administrative regions of Inner Mongolia, China: East, Central, and West. The results are shown in Figure 4, which shows that the degree of specialization of crops is “East > Central > West” (the eastern region of Inner Mongolia, China, includes Hulunbeier, Xing’an League, Tongliao, and Chifeng. The central region includes Hohhot, Ulanqab, Xilin Gol League, Ordos, and Baotou. The western region includes Bayannur, Wuhai, and Alashan) and the degree of specialization of uninsured households is higher than that of insured households.

4.6. Mechanism Test

As discussed in the previous section, it is possible to find grain production trends or non-grain production in farmers’ agricultural production. In this paper, we construct the following model to identify the impact of insurance participation on grain planting behavior:
l n ( 1 + g r a i n a r e a i ) = β 0 + β 1 I n s u i + β 2 X i + δ i
where g r a i n a r e a i denotes the area sown to the three major grain crops by the i farmer, and the other variables are defined in the same way as in model (1).

5. Analysis of Empirical Results

5.1. Basic Regression Results

Table 3 reports the baseline regression results of the effect of crop insurance participation on the planting structure, where model 1 is the regression result without control variables; model 2 includes variables for individual-level demographic characteristics; and model 3 adds to regional dummy variables and control variables reflecting household-level characteristics and agricultural production resource endowment.
The regression results of models 1–3 consistently show that participation in crop insurance significantly reduces the level of specialization in agricultural production. Specifically, holding other factors constant, participation in insurance reduces the Herfindahl index of agricultural production by 3 to 6 percentage points. In addition, the significance of the coefficients of the control variables in the regression results is generally in line with expectations and reality. The results show that farmers who are older, have a higher proportion of family labor, have more farmland, have a larger share of agricultural income, do not have borrowing in the household, and have more types of livestock raised by the household tend to diversify their cultivation, while farmland quality contributes to increased specialization, and that temperature and precipitation have an opposite influence on diversification of farmers. Older farmers are more experienced in farming, have more comprehensive information on agricultural production resources, and are usually risk averse. In order to avoid production risks, they are more likely to try to plant multiple crops, and the level of production specialization is low. The two variables of years of education and family cadres are basically insignificant. The higher the household labor force ratio, the lower the level of specialization, which may be due to the fact that farmers need to invest more labor in choosing diversified planting. More family labor is conducive to diversified planting. The larger the farmland area and the main household income from agriculture, the more likely that farmers will increase the types of crops to make full use of the land in order to maximize their income, and diversified cultivation is conducive to reducing the loss of agricultural income due to climate change or natural disasters, so they will choose to diversify their cultivation. No borrowing in the household increases the degree of diversification because specialized cultivation is often accompanied by large-scale production, and no borrowing in the household may be due to a lack of funds for large-scale cultivation. The types of livestock raised by households promote the diversified planting behavior of farmers. The possible explanation is that with the increase in the types of livestock raised by households, the possibility of farmers choosing non-agricultural employment is reduced, and they will pay more attention to the benefits of agricultural production. Therefore, it may be necessary to take into account both food and feed to ensure a virtuous cycle of planting and breeding, which in turn promotes diversified planting behavior. The relationship between the number of agricultural production disasters and planting structure is not significant. The higher quality of farmland, to a certain extent, can lead to the promotion of large-scale specialized planting methods. The temperature and precipitation variables, which represent climate change, have opposite effects on planting behavior. The existing literature shows that there is a scenario-dependent relationship between climate change and farmers’ planting behavior in China’s land conditions, i.e., climate change promotes diversification of planting behavior only in the scenario of a low degree of land fragmentation.

5.2. PSM Estimation Results

According to the previous analysis, theoretically, there is a reciprocal relationship between farmers’ participation in crop insurance and their agricultural production behavior, and farmers’ agricultural production behavior affects their choices of insurance varieties, insured area, and coverage level, while participation in insurance also affects farmers’ production behavior such as crop acreage selection and planting structure adjustment, so the reverse causality between them may lead to endogeneity problems in the basic model estimation. In addition, there are many factors affecting farmers’ planting behavior, some of which may also affect farmers’ participation in crop insurance, and if these factors are not included in the model, resulting in the independent variables being correlated with the nuisance terms, the endogeneity problem will also arise. In view of this, the estimation of the baseline model by OLS will not yield consistent estimates, so the PSM method is used in this paper to deal with the endogeneity problem in order to obtain consistent parameter estimates. Table 4 shows the PSM regression results of the effect of crop insurance participation on planting structure, using a five-category matching strategy, which shows that after eliminating systematic differences between participating and non-participating insurance households, insurance participation significantly reduces the specialization of households’ agricultural production at the 5% level, i.e., insurance participation promotes households’ crop planting structure adjustment, and further, in terms of the average treatment effect of the treatment groups, the adjustment effect of insurance participation on farmers’ planting structure is concentrated at the level of 0.03~0.05. In other words, all other factors being equal, the level of crop specialization is about 3–5 percentage points lower among the participating households than the non-participating households. This indicates that insurance participation does not lead to more specialization in agricultural production, but rather, there is a complementary effect between insurance participation and crop diversification. The possible reason for the complementary effect between insurance participation and crop diversification is that the existing insurance products are not sufficient to fully satisfy the risk coverage needs of farmers, which leads them to choose a diversified approach to agricultural risk management.
Regarding the matching effect of the matching model, Figure 5 presents the kernel density plots of the propensity score values of the treatment group and the control group before and after matching. After matching, the distribution of propensity scores of the two groups is very close to each other, indicating that the matching effect is good.

5.3. Heterogeneity Analysis

A previous paper tested the role of crop insurance participation on farmers’ planting structure adjustment, and then heterogeneity analysis was conducted according to household income structure, farmland area, and type of grain farmers. Household income structure is chosen as a criterion because the dependence on farmland as a factor of production varies among households with different income structures, so there may be heterogeneity in crop planting structure decisions. The choice of farmland area as another classification criterion is due to the fact that households with different farmland areas have different degrees of scale of agricultural production, so their crop planting structure decisions may be heterogeneous. The type of grain farmers is chosen because different types of farmers differ in grain production, and coupled with the difference in the level of insurance coverage for different varieties of crops, the crop planting structure decisions of farmers may be significantly different.

5.3.1. Sub-Income Structure

The sample was divided into low, medium, and high categories according to the agricultural income share of households, where the low category means agricultural income share ≤ 1/3, the medium category means 1/3 < agricultural income share ≤ 2/3, and the high category means 2/3 < agricultural income share ≤ 1, where the control variable of household agricultural income share is excluded, and the results are estimated by the PSM method, as shown in Table 5, which shows that the participation of farm households with agricultural income share at low and medium levels in crop insurance significantly reduces their production specialization at the 5% level, and the effect of insurance participation on the adjustment effect of insurance participation on planting structure is concentrated at the level of 0.01–0.08, i.e., under the same conditions of other factors, the crop planting specialization level of participating insurance households is about 1–8 percentage points lower than that of non-participating insurance households, indicating that the lower the agricultural income share of households, the higher the degree of diversification of their agricultural production.

5.3.2. Sub-Farmland Area

The sample was divided into three categories: small-scale, medium-scale, and large-scale, where small-scale means farmland area ≤ 15 mu, medium-scale means 15 < farmland area ≤ 50 mu, and large-scale means farmland area > 50 mu. The results are shown in Table 6, where the control variables of household farmland area are excluded and estimated by the PSM method. However, the adjustment effect of insurance participation on planting structure varies depending on the size of farmland, with small-scale farmers’ participation in insurance increasing their specialization in agricultural production by 0.003–0.069, medium-scale farmers’ reduction concentrated in 0.02–0.05, and large-scale farmers’ reduction concentrated in 0.01–0.14, indicating that the effect of participation in crop insurance on large-scale farmers’ adjustment of planting structure is more obvious. The possible reason is that large-scale farmers will enter the farmland transfer market due to the risk protection provided by insurance, especially by transferring into farmland to expand their business area, i.e., there is a scale effect [45]. According to the field survey, 60.76% (96 households) of the 158 large-scale farmers have transferred farmland, and the average area transferred is about 110 mu. Meanwhile, among large-scale farmers, 0.69 of H I have transferred farmland and 0.73 of H I have not transferred farmland, i.e., the transfer of farmland may reduce the production specialization level of large-scale farmers and make their operation more diversified, which also indicates that large-scale farmers usually consider planting low-value-added crops and high-value-added crops in an integrated manner in order to reasonably transfer their business risks in agricultural production.

5.3.3. Sub-Grain Farmers Type

Generally speaking, there is a broad and narrow sense of grain; the broad sense includes rice, wheat, corn, soybeans, potatoes, sorghum, and other miscellaneous grains; the narrow sense often refers to grains, especially rice, wheat, and corn. Therefore, in this paper, the sown area of the three major crops of rice, wheat, and corn is used as an indicator to measure farmers’ grain planting, among which farmers who only grow grain crops and do not grow economic crops are defined as pure grain farmers, with 223 households; farmers who grow both grain crops and economic crops but the sown area of the former is greater than or equal to the latter are defined as grain-based farmers, with 156 households; and farmers who grow both grain crops and economic crops but the former less than the latter were defined as grain-subsidized households, with 250 households. The results, estimated by the PSM method, are shown in Table 7, which shows that for pure grain farmers, participation in crop insurance significantly reduces their production specialization at the 1% or 5% level, and the adjustment effect of insurance participation on farmers’ planting structure is concentrated at the level of 0.03–0.04, i.e., all other factors being equal, the level of crop specialization of participating insurance households is about 3–4 percentage points lower than that of non-participating insurance households. This indicates that the larger the grain area of households, the higher the degree of diversification of their agricultural production. The possible reason is that the differences in coverage levels and premium subsidies of different types of grain crop insurance, together with the differences in expected returns, prompt farmers to adjust their choice of grain varieties and area decisions. In addition, for both grain-based and grain-subsidized farmers, participation in crop insurance reduces their production specialization, but the effect is not significant.

5.4. Mechanism Test

In order to reveal how participation in crop insurance affects farmers’ grain growing behavior, the PSM method is estimated in this paper for all farmers and all types of grain farmers, respectively, and the results are shown in Table 8, which shows that participation in crop insurance significantly motivates farmers to expand the sown area of the three major grain crops at the 5% or 10% level, although the effect is small, indicating that insurance participation causes farmers’ agricultural production to have a grain production trend characteristic. Specifically, all other factors being equal, participating households increase the sown area of the three major grain crops by about 0.13–0.23% compared to non-participating households. In addition, the effect of insurance participation on farmers’ grain planting behavior is characterized by heterogeneity, especially the most pronounced effect on grain-subsidized farmers, with an incentive effect of about 0.16% to 0.35%. This paper suggests two possible explanations: first, pure grain farmers and grain-based farmers may not readily adjust their crop planting structure due to the adjustment costs and adjustment risks associated with asset specialization; second, there are differences in the insurance coverage levels of different crop varieties in Inner Mongolia, and the insurance coverage levels of most grain crops are higher than those of economic crops, which, to a certain extent, attracts grain-subsidized farmers to switch to grain crops.

6. Conclusions and Policy Implications

As an important financial tool of agricultural policy, our findings confirm that the development of China‘s agricultural insurance has made great achievements since the new century and has a positive impact on promoting the high-quality development of agricultural insurance and ensuring national food security. This paper examines the impact of crop insurance policy on farmers’ planting structure and theoretically analyzes why and how participation in crop insurance affects farmers’ planting structure and grain growing behavior, taking Inner Mongolia, the main grain-producing area in northern China, as an example. The empirical test is carried out through the field survey data of 629 farmers. The main research findings are: first, farmers’ participation in materialized cost insurance will significantly affect their crop planting structure, especially by reducing the level of specialization in agricultural production. This finding holds true when endogeneity is addressed using propensity score matching; all other factors being equal, the level of crop specialization is about 3% to 6% lower for insured households than uninsured, and there is a complementary effect between farmers’ participation in insurance and their diversification. It is different from the results of existing studies [20]; as mentioned earlier, the actual level of coverage of materialized cost insurance studied in this paper is low and insufficient to have a positive impact on the specialization of agricultural cultivation of general farmers. Therefore, agricultural insurance meets the risk coverage needs of farmers who wish to specialize in planting, but the limited level of coverage fails to play a role in promoting the specialization of planting behavior. Second, there are differences in the effects of different types of farmers’ participation in crop insurance on their agricultural production structure. Participation in insurance significantly reduces the degree of production specialization for farmers with low and medium agricultural income share; participation in insurance has a more pronounced effect on the large-scale farmers’ adjustment of planting structure; for pure grain farmers, participation in insurance reduces their crop specialization by about 3 to 4 percentage points. Third, participation in agricultural insurance will stimulate farmers to expand the sown area of the three major grain crops, but the effect is small, and the sown area of the three major grain crops increases by about 0.13–0.23% more for participating households than non-participating, all other factors being equal. This suggests that insurance participation will lead to the grain production trend in agricultural production.
Based on the above region-specific research findings, mainly considering the main grain-producing areas in the north, which are homogeneous with Inner Mongolia, China, this paper proposes the following policy inspirations. First, due to the low level of materialized cost insurance coverage, it has not been possible to promote the specialization of agricultural production. Therefore, guide farmers to adjust the crop planting structure through the high-quality development of agricultural insurance, including expanding the coverage of agricultural insurance, increasing the number of insurance types, and improving the insurance coverage level so as to encourage farmers to adjust agricultural production to specialization. Second, agricultural insurance products are more targeted and differentiated. The effect of participation in crop insurance on farmers’ planting structure adjustment and grain growing behavior will be heterogeneous depending on the type of farmers. Agricultural insurance should reflect more suitability of different agricultural business subjects and the same business subject of different insurance objects. Increase the precision of support for grain farmers and large-scale farmers. Third, expand the pilot scope of two types of insurance with high coverage levels, namely, complete cost insurance and planting income insurance for grain crops, and gradually replace materialized cost insurance, expand from main grain crops to non-main grain crops, from large grain-producing provinces to non-grain-producing provinces, and from large grain-producing counties to non-grain-producing counties. Then, improve the enthusiasm of farmers to participate in insurance. Fourthly, it is necessary to strengthen the awareness of “large-scale farmers” and “grain growers” of complete cost insurance and income insurance. For a long time, China has implemented the agricultural insurance system of “low protection, low compensation, and wide coverage”, and the majority of farmers have a low awareness of the complete cost insurance and income insurance of “high protection and high compensation”, which, to a large extent, affects the changes in their production behavior after participating the insurance. Therefore, in the future, it is necessary to make farmers understand complete cost insurance and income insurance comprehensively through extensive publicity and special education and to clarify the essential differences between the materialized cost insurance and the complete cost and income insurance. Make more farmers, especially “large-scale farmers” and “grain growers”, actively participate in insurance and integrate into specialized agricultural production.
We recognize that our main results are based on a specific insurance policy (materialized cost insurance) and a specific area (Inner Mongolia, China). Therefore, our study has some limitations. First, although the area of investigation is a major grain-producing province, it is only one of the 13 major grain-producing provinces in China. Second, the sample size is 629 households, which is relatively small, and cross-sectional data are used instead of panel data, which may not be comprehensive enough for the dynamic analysis of the relationship between agricultural insurance policy and farmers’ production behavior. Third, the propensity score matching method chosen in our paper to estimate the causal relationship between insurance participation and crop planting behavior only mitigates the problem of endogeneity due to observable variables rather than unobservable variables. We acknowledge that extrapolation of our findings to areas beyond our study region should be made with caution. Indeed, further impact analyses will help to generalize the results more broadly. However, this research provides an important first step. If the materialized cost insurance in Inner Mongolia has a positive impact on farmers’ grain planting behavior, then the subsequent high coverage level agricultural insurance policies piloted may deepen this effect, which is likely to be studied in the near future. Hence, further research is still needed to use panel data, expand the sample area, optimize the model, and replace materialized cost insurance with agricultural insurance products characterized by high coverage levels. It will help to reveal the dynamic causal relationship between agricultural insurance and farmers’ behavior in China.

Author Contributions

Conceptualization, Z.C.; methodology, Z.C.; software, Z.C.; formal analysis, Z.C.; investigation, Z.C.; data curation, Z.C.; writing—original draft preparation, Z.C. and X.Z.; writing—review and editing, Z.C. and X.Z.; supervision, Z.C.; project administration, Z.C.; funding acquisition, Z.C. All authors have read and agreed to the published version of the manuscript.

Funding

National Natural Science Foundation of China (72063024 and 71873072); Fundamental Research Funds for the University in Inner Mongolia, China (BR230303); Innovation Team of Comprehensive Development in Rural and Pastoral Area from the Education Department of Inner Mongolia Autonomous Region (NMGIRT2223 and STAQZX202301).

Institutional Review Board Statement

Not applicable.

Informed Consent Statement

Not applicable.

Data Availability Statement

The data presented in this study are available upon request from the corresponding author.

Conflicts of Interest

The authors declare no conflicts of interest.

References

  1. Zhang, Q.; Wang, K.; Song, J.G. Analysis and Evaluation of Agricultural Insurance Coverage in China, 1st ed.; China Finance Press: Beijing, China, 2020.
  2. National Bureau of Statistics of the People’s Republic of China. China Statistical Yearbook; China Statistics Press: Beijing, China, 2021.
  3. Turvey, C.G. An Economic Analysis of Alternative Farm Revenue Insurance Policies. Can. J. Agric. Econ. 1992, 40, 403–426. [Google Scholar] [CrossRef]
  4. Young, C.E.; Vandeveer, M.L.; Schnepf, R.D. Production and Price Impacts of U.S. Crop Insurance Programs. Am. J. Agric. Econ. 2001, 83, 1196–1203. [Google Scholar] [CrossRef]
  5. Barnett, B.; Coble, K.; Knight, T.; Meyer, L.; Skees, J. Impact of the Cotton Crop Insurance Program on Cotton Planted Acreage; Technical Report, Report Prepared for the Board of Directors; Federal Crop Insurance Corporation, Risk Management Agency, U.S. Department of Agriculture: Washington, DC, USA, 2002.
  6. Goodwin, B.K.; Vandeveer, M.L.; Deal, J.L. An Empirical Analysis of Acreage Effects of Participation in the Federal Crop Insurance Program. Am. J. Agric. Econ. 2004, 86, 1058–1077. [Google Scholar] [CrossRef]
  7. Seo, S.; Mitchell, P.D.; Leatham, D.J. Effects of Federal Risk Management Programs on Optimal Acreage Allocation and Nitrogen Use in a Texas Cotton-Sorghum System. J. Agric. Appl. Econ. 2005, 37, 685–699. [Google Scholar] [CrossRef]
  8. Zhang, Y.H.; Shi, Q.H.; Gu, H.Y. The welfare impact of agricultural insurance on farmers and the state and an empirical study-evidence from agricultural insurance in Shanghai. Res. Inst. Econ. 2006, 2, 1–23. (In Chinese) [Google Scholar]
  9. O’Donoghue, E.J.; Roberts, M.J.; Key, N. Did the Federal Crop Insurance Reform Act Alter Farm Enterprise Diversification? J. Agric. Econ. 2009, 60, 80–104. [Google Scholar] [CrossRef]
  10. Varadan, R.J.; Kumar, P. Impact of Crop Insurance on Rice Farming in Tamil Nadu. Agric. Econ. Res. Rev. 2012, 25, 291–298. [Google Scholar]
  11. Mobarak, A.M.; Rosenzweig, M.R. Selling Formal Insurance to the Informally Insured; Working Paper; Yale University: New Haven, CT, USA, 2012. [Google Scholar]
  12. Capitanio, F.; Adinolfi, F.; Santeramo, F.G. Environmental Implications of Crop Insurance Subsidies in Southern Italy. Int. J. Environ. Stud. 2014, 72, 179–190. [Google Scholar] [CrossRef]
  13. Zong, G.F.; Zhou, W.J. An empirical research on the Impacts of Agricultural Insurance on Production Behaviors of Farmers. Insur. Stud. 2014, 4, 23–30. (In Chinese) [Google Scholar]
  14. Elabed, G.; Carter, M.R. Ex-Ante Impacts of Agricultural Insurance: Evidence from a Field Experiment in Mali; Working Paper; University of California at Davis: Davis, CA, USA, 2015. [Google Scholar]
  15. Cai, J. The Impact of Insurance Provision on Households’ Production and Financial Decisions. Am. Econ. J. Econ. Policy. 2016, 8, 44–88. [Google Scholar] [CrossRef]
  16. Xu, B.; Sun, R. Effects of Agricultural Insurance on Farmers’ Production Behavior under the Background of Grain Security: Evidence from Grain Production Areas. Financ. Econ. 2016, 6, 97–111. (In Chinese) [Google Scholar]
  17. Liu, W.; Sun, R. The Transmission Mechanism of Crop Insurance Subsidy on Farmers’ Behaviors and Farming Structure—Based on a comparative study on national panel data before and after the application of premium subsidy. Insur. Stud. 2016, 7, 11–24. (In Chinese) [Google Scholar]
  18. Claassen, R.; Langpap, C.; Wu, J.J. Impacts of Federal Crop Insurance on Land Use and Environmental Quality. Am. J. Agric. Econ. 2017, 99, 592–613. [Google Scholar] [CrossRef]
  19. Deryugina, T.; Konar, M. Impacts of Crop Insurance on Water Withdrawals for Irrigation. Adv. Water Resour. 2017, 110, 437–444. [Google Scholar] [CrossRef]
  20. Fu, X.P.; Liang, P. Is policy-oriented agricultural insurance pilot changing farmers’ diversified cultivation practices. J. Agrotech. Econ. 2017, 9, 66–79. (In Chinese) [Google Scholar]
  21. Yu, J.; Smith, A.; Sumner, D.A. Effects of Crop Insurance Premium Subsidies on Crop Acreage. Am. J. Agric. Econ. 2018, 100, 91–114. [Google Scholar] [CrossRef]
  22. Zhang, W.; Yi, P.; Xu, J.; Huang, Y. Incentivizing Effect of Policy Agricultural Insurance on Grain Output. Insur. Stud. 2019, 1, 32–44. (In Chinese) [Google Scholar]
  23. Fang, R.; An, Y.; Liu, W.C. Can the Pilot Project of “Insurance Plus Futures” Improve Farmers’ Enthusiasm to Grow Grain? An Analysis from the Perspectives of Mediating Effect of Farmers’ Participation Willingness and Moderating Effect of Their Satisfaction with Government Subsidies. China Rural Econ. 2019, 6, 113–126. (In Chinese) [Google Scholar]
  24. Ren, T.C.; Yang, R.H. Linking Small-scale Farm Households with Modern Agriculture:Factor Allocation Caused by Agricultural Insurance Evidence from the Third National Agricultural Census of China. Financ. Econ. 2020, 7, 41–53. (In Chinese) [Google Scholar]
  25. Cole, S.; Giné, X.; Vickery, J. How Does Risk Management Influence Production Decisions? Evidence from a Field Experiment; Working Paper; Harvard Business School: Boston, MA, USA, 2013. [Google Scholar]
  26. Karlan, D.; Osei, R.; Osei-Akoto, I.; Udry, C. Agricultural Decisions after Relaxing Credit and Risk Constraints. Q. J. Econ. 2014, 129, 597–652. [Google Scholar] [CrossRef]
  27. Hill, R.V.; Kumar, N.; Magnan, N.; Makhija, S.; De Nicola, F.; Spielman, D.J.; Ward, P.S. Ex Ante and Ex Post Effects of Hybrid Index Insurance in Bangladesh. J. Dev. Econ. 2019, 136, 1–17. [Google Scholar] [CrossRef] [PubMed]
  28. Que, N.D.; Van Song, N.; Mai, T.T.H.; Phuong, N.T.M.; Huong, N.T.X.; Tiep, N.C.; Uan, T.B. Rice Farmers’ Perception and Determinants of Climate Change Adaptation Measures: A Case Study in Vietnam. AgBioForum 2022, 24, 13–22. [Google Scholar]
  29. Liu, Y.; Huang, J.K. A Multi-objective Decision Model of Farmers’ Crop Production. Econ. Res. J. 2010, 45, 148–157. (In Chinese) [Google Scholar]
  30. Xu, Q.; Lu, Y.F.; Zhang, H.C. Have Agricultural Support and Protection Subsidies Encouraged Large-scale Farmers to Grow Grain? An Analysis Based on Data from Fixed Observation Points of the Ministry of Agriculture and Rural Affairs in China. China Rural. Econ. 2020, 4, 15–33. (In Chinese) [Google Scholar]
  31. Zhang, Z.X.; Mu, Y.Y.; Hou, L.L. Does Participation in Agricultural Insurance Optimize Factor Allocation? An Analysis of Endogenous Farmers’ Insurance Decision-making and Its Effect on Production. China Rural. Econ. 2018, 10, 53–70. (In Chinese) [Google Scholar]
  32. He, J. China’s Agricultural Insurance Participation Situation and Promoting Measures: From the Perspective of Behavioral Economics. Insur. Stud. 2020, 11, 19–31. (In Chinese) [Google Scholar]
  33. Gao, K.; Ding, S.Q.; Wang, X. A Research on the Inter-provincial Differences and Its Formation Mechanism of Agricultural Insurance Development in China. Insur. Stud. 2020, 4, 53–68. (In Chinese) [Google Scholar]
  34. Dong, X.X.; Huang, J.K.; Scott, R.; Wang, H.L. A study on geographical location, transportation infrastructure and plantation restructuring. J. Manag. World 2006, 9, 59–63. (In Chinese) [Google Scholar]
  35. Gao, C.X.; Wang, M.; Ye, T.; Shi, P.J. Analysis of differences in planting behavior and insurance decisions among farmers with different income structures. J. Agrotech. Econ. 2013, 10, 46–55. (In Chinese) [Google Scholar]
  36. Wu, Q.H.; Li, G.C.; Zhou, X.S.; Feng, Z.C. Infrastructure, agricultural location and planting adjustments -empirical evidence based on inter-provincial panel data from 1995–2013. J. Agrotech. Econ. 2015, 3, 25–32. (In Chinese) [Google Scholar]
  37. Zhang, Z.; Yin, H. Regional Differentiation of Agricultural Insurance Participation Rates in China—The Explanation from the Planting Structure and Alternative Income Channels. Insur. Stud. 2019, 1, 15–31. (In Chinese) [Google Scholar]
  38. Luo, X.M.; Zhang, W.; Ding, J.F. Income Adjustment Safety of Food Provision and Subsidy Arrangement in Agricultural Insurance in Under-developed regions. Issues Agric. Econ. 2011, 32, 18–23. (In Chinese) [Google Scholar]
  39. Zhang, Z.R. Analysis on Agricultural Insurance Function: Famers’ Choice or Government Behavior. Reform 2012, 5, 132–137. (In Chinese) [Google Scholar]
  40. Ren, T.C.; Zhang, H.Z.; Yang, R.H. How does the level of agricultural insurance security affect agricultural production efficiency: Evidence from the survey data of Hubei, Jiangxi, Sichuan and Yunnan Provinces. China Popul. Resour. Environ. 2021, 31, 161–170. (In Chinese) [Google Scholar]
  41. Ren, T.C.; Zhang, H.Z.; Yang, R.H. Agricultural Insurance Security Level and Farmers’ Production Investment: Evidence from the Survey Data of Hubei, Jiangxi, Sichuan and Yunnan Provinces. China Rural Surv. 2021, 5, 128–144. (In Chinese) [Google Scholar]
  42. Jiang, Y.; Li, Y. Government subsidies, risk management and agricultural insurance participation behavior-an empirical analysis based on farm household survey data in Jiangsu Province. J. Agrotech. Econ. 2012, 10, 65–72. (In Chinese) [Google Scholar]
  43. Rosenbaum, P.R.; Rubin, D.B. The Central Role of the Propensity Score in Observational Studies for Causal Effects. Biometrika 1983, 70, 41–55. [Google Scholar] [CrossRef]
  44. Chai, Z.H. Whether Taking up Crop Insurance can Promote Farmers’ farmland Transfer-in: Based on A Micro-empirical Analysis in Inner Mongolia. Insur. Stud. 2021, 12, 39–54. (In Chinese) [Google Scholar]
  45. Qian, L.; Yuan, H.; Liu, J.J.; Hong, M.Y. Does Transfer of Farmland Affect Grain Planting Structure. J. Agrotech. Econ. 2018, 8, 63–74. (In Chinese) [Google Scholar]
Figure 1. Insurance coverage level and grain crop sown area in China’s planting, 2008–2018. Data Source: insurance coverage level of planting from “Analysis and Evaluation of Agricultural Insurance Coverage in China” by Zhang Q et al. [1].; grain crop sown area from “China Statistical Yearbook 2021” [2].
Agriculture 14 00041 g001
Figure 2. The insurance coverage level of various grain crop types in 2018.
Agriculture 14 00041 g002
Figure 3. Mechanisms of agricultural insurance’s influence on farmers’ crop planting structure adjustment.
Agriculture 14 00041 g003
Figure 4. Comparison of crop diversification between participating and non-participating households in different regions.
Agriculture 14 00041 g004
Figure 5. Distribution of propensity score values of treatment and control groups before and after matching under nuclear matching.
Agriculture 14 00041 g005
Table 1. Comparison of crop diversification between insured and non-insured households.
Whether to Participate
in Insurance
ObservationsMIHISITE
Insured Households4160.780.720.2849.38
Non-insured Households2130.820.780.2237.25
Table 2. Variable definition and descriptive analysis.
VariableMeaningAll HouseholdsInsured HouseholdsNon-Insured Households
MeanS.D.MeanS.D.MeanS.D.
Maximization Index (MI)Actual calculation data0.790.220.780.220.820.23
Herfindahl Index (HI)Actual calculation data0.740.260.720.260.780.27
Simpson Index (SI)Actual calculation data0.260.260.280.260.220.27
Total Entropy Index (TE)Actual calculation data45.2743.0849.3842.4937.2543.19
Farmers’ ageUnit: years50.9410.6250.6310.6451.5310.58
Years of educationUnit: years6.612.816.732.786.382.86
Family cadreYes = 1; No = 00.040.210.050.220.030.18
Household labor force ratioProportion of labor force aged 16 to 600.720.250.730.250.700.26
Farmland areaUnit: mu51.29101.9655.54115.8443.2866.51
Farmland qualityArea of irrigated farmlands/Area of all farmlands0.550.440.570.440.520.44
Share of agricultural incomeActual calculation data0.630.280.650.280.590.28
Household borrowingYes = 1; No = 00.800.400.790.410.820.39
Types of livestock raised by householdsActual calculation data1.521.191.591.181.381.20
Number of agricultural production disastersActual survey data2.971.813.061.812.791.82
TemperatureMean annual temperature in 2017, unit: °C7.592.167.751.867.282.62
PrecipitationAnnual precipitation in 2017, unit: mm281.26121.39270.36123.17302.55115.16
Eastern RegionYes = 1; No = 00.430.500.370.480.550.50
Central RegionYes = 1; No = 00.340.480.370.480.300.46
Western RegionYes = 1; No = 00.220.420.260.440.150.36
Observations 629416213
Table 3. Baseline regression results of the effect of crop insurance participation on crop diversification of farmers.
VariablesModel 1Model 2Model 3
Marginal EffectsStandard ErrorMarginal EffectsStandard ErrorMarginal EffectsStandard Error
Crop insurance participation−0.0606 ***0.0220−0.0599 ***0.0218−0.0325 **0.0210
Farmers’ age −0.0036 ***0.0010−0.0038 ***0.0010
Years of education −0.00120.0039−0.00320.0037
Family cadre −0.06350.0500−0.02120.0471
Household labor force ratio −0.0785 *0.0416−0.0627 *0.0392
Farmland area −0.0156 *0.0119
Farmland quality 0.1528 ***0.0248
Share of agricultural income −0.0736 *0.0406
Household borrowing −0.0420 *0.0247
Types of livestock raised by households −0.0320 ***0.0088
Number of agricultural production disasters −0.00700.0055
Temperature −0.0161 ***0.0051
Precipitation 0.0003 ***0.0001
Regional dummy variablesNoNoYes
Observations629629629
Note: *, **, *** denote significant at the 10%, 5%, and 1% levels, respectively.
Table 4. PSM regression results for the effect of crop insurance participation on crop diversification.
Matching MethodDegree of Crop Cultivation Diversification (HI)Standard ErrorCommon Support Sample Size
Treatment GroupControl GroupATTTreatment GroupControl Group
Nearest Neighbor Matching (1:1)0.71970.7592−0.03940.0307416213
Nearest Neighbor Matching (1:2)0.71970.7666−0.0469 **0.0273416213
Nearest Neighbor Matching (1:3)0.71970.7596−0.0398 **0.0265416213
Partial Linear Regression Matching0.71970.7487−0.0290 **0.0241416213
Radius Matching0.72020.7658−0.0457 **0.0255409206
Mahalanobis Matching0.71970.7562−0.0364 **0.0305416213
Nuclear Matching0.71970.7550−0.0353 **0.0235416213
Note: Least-nearest-neighbor matching takes a put-back approach; in local linear regression matching and kernel matching, the kernel function is normal; in radius matching, the radius is chosen as 0.01. ** denotes significant at the 5% level.
Table 5. PSM regression results for the effect of crop insurance participation on farm diversification under different income structures.
Matching MethodLow (Share ≤ 1/3)Medium (1/3 < Share ≤ 2/3)High (2/3 < Share ≤ 1)
ATTStandard ErrorATTStandard ErrorATTStandard Error
Nearest Neighbor Matching (1:1)−0.0648 **0.0632−0.0490 *0.0701−0.00150.0481
Nearest Neighbor Matching (1:2)−0.0585 **0.0574−0.0103 **0.0594−0.00180.0426
Nearest Neighbor Matching (1:3)−0.0606 **0.0526−0.0510 **0.05510.00860.0411
Partial Linear Regression Matching−0.0823 **0.0486−0.0501 *0.0466−0.01480.0359
Radius Matching−0.05340.0570−0.0505 *0.0533−0.01330.0433
Mahalanobis Matching−0.00040.0622−0.0633 *0.0526−0.0341 **0.0435
Nuclear Matching−0.0803 **0.0477−0.0589 *0.0454−0.01260.0353
Note: Least-nearest-neighbor matching takes a put-back approach; in local linear regression matching and kernel matching, the kernel function is normal; in radius matching, the radius is chosen as 0.01. * and ** denote significant at the 10% and 5% levels, respectively.
Table 6. PSM regression results for the effect of crop insurance participation on farm diversification under different farmland sizes.
Matching Method(Small-Scale 0 ≤ Area ≤ 15 mu)(Medium-Scale 15 < Area ≤ 50 mu)(Large-Scale Area > 50 mu)
ATTStandard ErrorATTStandard ErrorATTStandard Error
Nearest Neighbor Matching (1:1)0.0027 *0.0586−0.03040.0481−0.10150.0887
Nearest Neighbor Matching (1:2)0.0125 *0.0564−0.02140.0422−0.1363 *0.0782
Nearest Neighbor Matching (1:3)0.03550.0545−0.03630.0406−0.0828 *0.0727
Partial Linear Regression Matching0.0486 *0.0463−0.0216 *0.0361−0.0680 *0.0546
Radius Matching0.0685 *0.0524−0.03230.0387−0.0133 *0.0666
Mahalanobis Matching0.05340.0534−0.0515 **0.0420−0.1432 **0.0705
Nuclear Matching0.04460.0461−0.0333 *0.0354−0.0929 *0.0567
Note: Least-nearest-neighbor matching takes a put-back approach; in local linear regression matching and kernel matching, the kernel function is normal; in radius matching, the radius is chosen as 0.01. * and ** denote significant at the 10% and 5% levels, respectively.
Table 7. PSM regression results of the effect of crop insurance participation on the diversification of their planting under different types of grain farmers.
Matching MethodPure Grain FarmersGrain-Based FarmersGrain-Subsidized Farmers
ATTStandard ErrorATTStandard ErrorATTStandard Error
Nearest Neighbor Matching (1:1)−0.0409 **0.0215−0.0155 *0.0480−0.09840.0616
Nearest Neighbor Matching (1:2)−0.0337 **0.0191−0.02130.0396−0.08390.0606
Nearest Neighbor Matching (1:3)−0.0360 **0.0185−0.00740.0378−0.07530.0562
Partial Linear Regression Matching−0.0362 ***0.0167−0.00900.0351−0.01440.0460
Radius Matching−0.0377 ***0.0191−0.0279 *0.0408−0.06490.0552
Mahalanobis Matching−0.0389 **0.0179−0.01010.0382−0.05220.0515
Nuclear Matching−0.0353 ***0.0168−0.01680.0351−0.03490.0459
Note: Least-nearest-neighbor matching takes a put-back approach; in local linear regression matching and kernel matching, the kernel function is normal; in radius matching, the radius is chosen as 0.01. *, **, *** denote significant at the 10%, 5%, and 1% levels, respectively.
Table 8. PSM regression results for the impact of crop insurance participation on households’ grain crop planting.
Matching MethodAll FarmersPure Grain FarmersGrain-Based FarmersGrain-Subsidized Farmers
ATTStandard ErrorATTStandard ErrorATTStandard ErrorATTStandard Error
Nearest Neighbor Matching (1:1)0.20100.1546−0.0423 *0.20520.1287 **0.21250.3492 ***0.2389
Nearest Neighbor Matching (1:2)0.2277 *0.1457−0.06090.16630.0863 *0.21700.3468 **0.2208
Nearest Neighbor Matching (1:3)0.1982 *0.1380−0.03250.15530.2113 *0.20240.3164 *0.2287
Partial Linear Regression Matching0.1312 *0.12890.07650.14220.28250.18040.1598 *0.2108
Radius Matching0.1791 *0.1317−0.0522 *0.17550.12360.17780.3296 **0.2316
Mahalanobis Matching0.10660.15990.10660.17240.22210.19020.2011 **0.2453
Nuclear Matching0.1348 *0.12630.07200.14040.23100.18090.2295 *0.2069
Note: Least-nearest-neighbor matching takes a put-back approach; in local linear regression matching and kernel matching, the kernel function is normal; in radius matching, the radius is chosen as 0.01. *, **, *** denote significant at the 10%, 5%, and 1% levels, respectively.
Disclaimer/Publisher’s Note: The statements, opinions and data contained in all publications are solely those of the individual author(s) and contributor(s) and not of MDPI and/or the editor(s). MDPI and/or the editor(s) disclaim responsibility for any injury to people or property resulting from any ideas, methods, instructions or products referred to in the content.

