Article

A Non-Contact and Fast Estimating Method for Respiration Rate of Cows Using Machine Vision

1
College of Biosystems Engineering and Food Science, Zhejiang University, Hangzhou 310058, China
2
Jockey Club College of Veterinary Medicine and Life Sciences, City University of Hong Kong, Hong Kong SAR, China
3
Key Laboratory of Intelligent Equipment and Robotics for Agriculture of Zhejiang Province, Hangzhou 310058, China
*
Authors to whom correspondence should be addressed.
Agriculture 2024, 14(1), 40; https://doi.org/10.3390/agriculture14010040
Submission received: 4 November 2023 / Revised: 15 December 2023 / Accepted: 20 December 2023 / Published: 25 December 2023

Abstract

:
Detecting respiration rate (RR) is a promising and practical heat stress diagnostic method for cows, with significant potential benefits for dairy operations in monitoring thermal conditions and managing cooling treatments. Currently, the optical flow method is widely employed for automatic video-based RR estimation. However, the optical flow-based approach for RR estimation can be time-consuming and susceptible to interference from various unrelated cow movements, such as rising, lying down, and body shaking. The aim of this study was to propose a novel optical flow-based algorithm for remotely and rapidly detecting the respiration rate of cows in free stalls. To accomplish this, we initially collected 250 sixty-second video episodes from a commercial dairy farm, which included some episodes with interfering motions. We manually observed the respiration rate for each episode, considering it as the ground truth RR. The analysis revealed that certain cow movements, including posture changes and body shaking, introduced noise that compromises the precision of RR detection. To address this issue, we implemented noise filters, with the Butterworth filter proving highly effective in mitigating noise resulting from cow movements. The selection of the region of interest was found to have a substantial impact on the accuracy of RR detection. Opting for the central region was recommended for optimal results. The comparison between the RR estimated by the modified cow respiration rate (MCRR) algorithm and the ground truth RR showed a good agreement with a mean absolute relative error of 7.6 ± 8.9% and a Pearson correlation coefficient of 0.86. Additionally, the results also indicated that reducing the original frame rate from 25 to 5 frames per second and adjusting the image pixel size from 630 × 450 to 79 × 57 pixels notably reduced computational time from 39.8 to 2.8 s, albeit with a slight increase in mean absolute relative error to 8.0 ± 9.0%.

1. Introduction

Heat stress in dairy cows can exert detrimental effects on their milk production, reproductive performance, and immune systems [1,2,3,4], resulting in significant economic losses for the dairy industry [5,6,7,8]. Effectively alleviating heat stress in dairy cows necessitates accurate identification of their stress status [9]. Currently, environmental-parameters-based thermal indices, such as the temperature humidity index, the comprehensive climate index, and the equivalent temperature index for dairy cows, are widely employed to classify the levels of heat stress experienced by cows [9,10,11]. These indices only rely on easily measurable environmental factors (i.e., air temperature, relative humidity, air velocity, and solar radiation), but overlook variations in internal heat generation, which also play an important role in the thermal balance of an animal [7,12].
Alternatively, physiological parameters such as respiration rate and core body temperature can also serve as indicators of the heat stress levels in dairy cows [13]. These parameters offer a more accurate reflection of the cow’s heat stress level, as they represent the physiological responses of the animal to the local thermal environment [14]. Increased respiration rate and elevated core body temperature are common manifestations in cows experiencing heat stress, as these mechanisms aid in dissipating excess heat. However, accurately detecting the core body temperature of cows remains challenging due to not only its narrow range [15], but also the requirement for invasive procedures or precise temperature sensors, making it impractical for routine monitoring. On the other hand, monitoring the respiration rate presents a viable option for assessing heat stress levels [1], given its non-invasive nature and ease of measurement. Furthermore, respiration rate exhibits significant variation between non-heat-stressed and heat-stressed cows [16]. A thermally comfortable cow typically maintains a respiration rate of approximately 20 breaths per minute (bpm), while a severely heat-stressed cow may reach up to 120 bpm [17]. These substantial differences in respiration rate among heat-stressed cows at various heat stress levels make it an effective parameter for categorizing degrees of heat stress.
The traditional method for estimating respiration rate (RR) in cows is manually counting the flank movements [18]. While this method has been widely used, alternative approaches have emerged in recent years, such as the use of differential pressure sensors to measure pressure changes at the nose, infrared thermography techniques, or sensitive air temperature sensors to detect temperature changes in inhaled and exhaled airflow through the nostrils [19,20,21,22,23,24]. These newer methods offer potential advantages in terms of accuracy and non-invasiveness. Nonetheless, the manual observation of flank movements remains the prevailing technique for measuring RR in practice. However, this method is time-consuming and labor-intensive, and impractical for simultaneously monitoring the respiration rates of multiple cows by one observer.
With remarkable advancements in machine vision techniques, researchers have explored the potential application of these technologies for analyzing animal respiration rates. For instance, Upadhya et al. [25] employed optical flow of the human chest wall motion as a feature input for their LSTM (Long Short-Term Memory) model, achieving a 90% accuracy in estimating respiratory signals. Similarly, Wu et al. [26] utilized the Deeplab V3+ semantic segmentation model to process video footage of cows, employing a video amplification algorithm to enhance weak breathing movement signals. By applying an optical flow method, they achieved predictive accuracies for cow respiration rates ranging from 80 to 100%. However, it is essential to note that the waveform of the respiration rate signal can be susceptible to system noise during the recording process and signal noise caused by animal body shaking and posture changes [27,28]. Therefore, the reduction in noise during the detection of dairy cow respiration rates is crucial for improving accuracy and reliability.
Ensuring the precise detection of cow respiration rates, the endeavor of identifying noise characteristics inherent in respiration rate signals and subsequently selecting filters that optimize noise reduction while retaining pertinent respiratory data is of paramount importance. Within the realm of livestock information processing, several filters have been documented that exhibit commendable performance [29,30,31]. However, the performance of filters can vary depending on the specific case and requires further analysis and evaluation. Regarding the determination of the region of interest (ROI) in respiration rate detection, it is noteworthy that not all segments of an animal’s body manifest distinct fluctuations during respiration [26]. Consequently, dividing the cow’s body into discrete sections and pinpointing the area that showcases the most pronounced respiratory-related oscillations could potentially enhance the accuracy of respiration rate measurements. Recently, some studies have reported automatic ROI detection methodologies. For instance, Wang et al. [32] introduced an RGB video-based respiration rate monitoring technique wherein the ROI was autonomously selected via computer vision-based detection. However, it is crucial to acknowledge that automatic ROI detection comes with added time requirements and computational expenses, which, in turn, could introduce errors during subsequent estimation processes.
Currently, existing algorithms designed for estimating the respiration rate primarily prioritize predictive accuracy [26,33], while the corresponding processing time was not always considered. While certain optical flow-based algorithms have achieved impressive accuracy, they rely on high video resolution and frame rates, resulting in a considerable processing time. In real-world scenarios, however, the ability to monitor respiration rates in real-time or nearly real-time is essential for effective heat stress evaluation in dairy cows [34]. This enables the swift implementation of mitigation techniques, thereby minimizing adverse effects on the well-being of the cows [35]. A potential solution is to reduce the frame rate and video resolution. Nonetheless, it is important to consider the potential impact of reducing the frame rate and video resolution on the accuracy of respiration rate detection. Striking the right balance between speed and accuracy entails a thorough evaluation of how diminishing the frame rate and resolution influences the accuracy of respiration rate detection.
Therefore, the primary aim of this study was to develop a rapid and precise algorithm for estimating the respiration rate (RR) of cows in free stalls using the optical flow method. To achieve this goal, this study pursued the following steps: (1) analyzed the spectral characteristics of the cow respiration rate noise, including posture changes and body shaking; (2) assessed the performance of the five different filters in processing cow respiration rate signal; (3) explored the enhancement in accuracy for cow respiration rate detection by using partial body parts as monitoring objects; and (4) investigated the appropriate frame frequency and pixel value for rapid and precise respiratory rate detecting.

2. Methodology and Materials

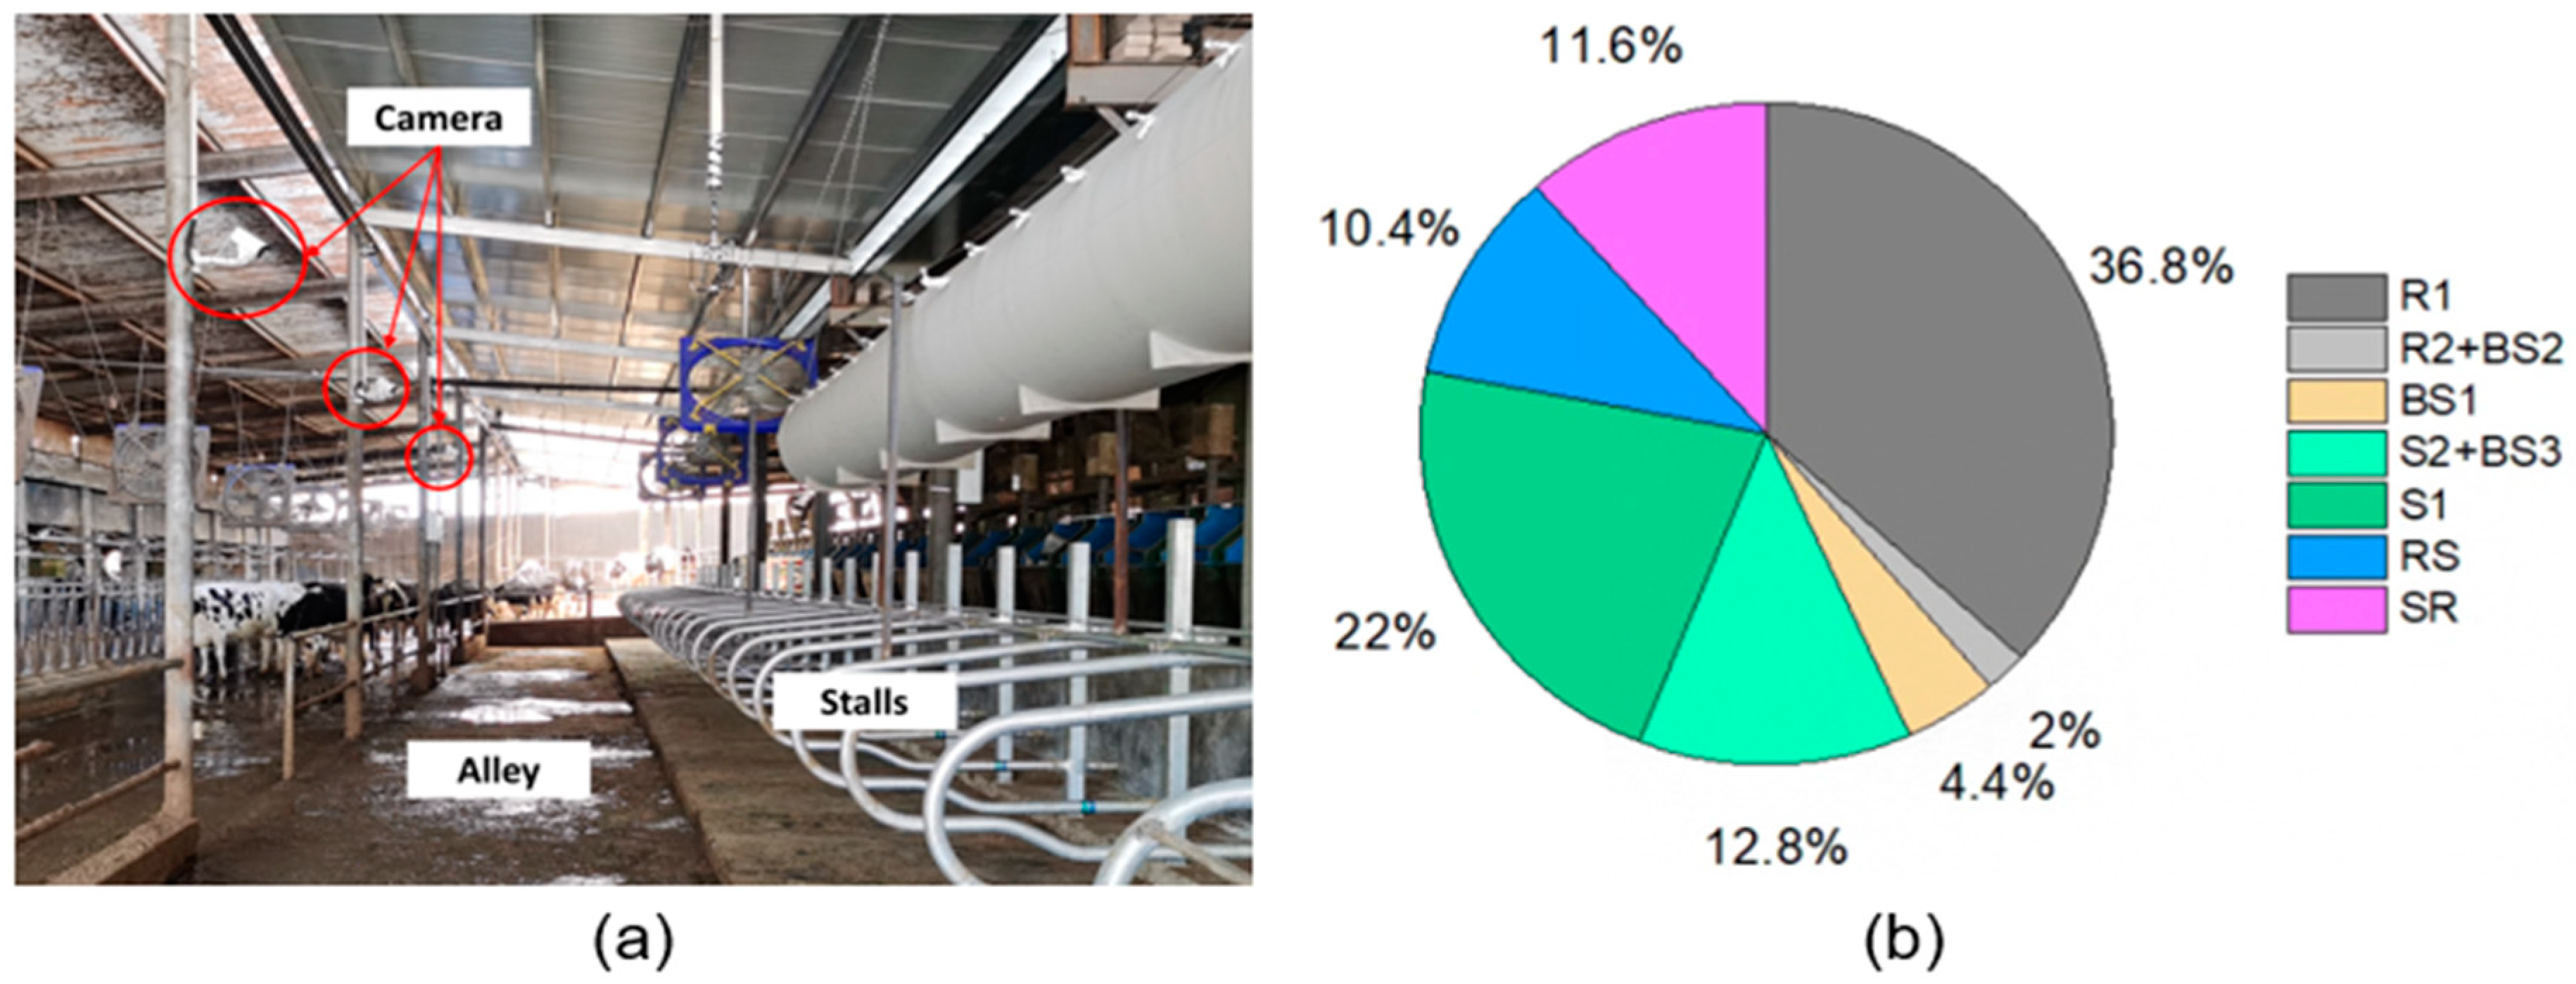
2.1. Data Collection

2.1.1. Experimental Variables and Response

The onsite videos of cows were recorded at a commercial dairy located at Hangzhou, Zhejiang, China using six video cameras (DS-2CD3T47EWDV3-L Hikvision camera, Hangzhou, China). The resolution of the camera was 2560 × 1440 @25 fps. The positions of the cameras are illustrated in Figure 1a. The distance between camera and cow ranged from 4.2 to 5.0 m, which depended on the shooting angle and the posture of the cows. The recording period spanned from 16 to 20 August 2022. A total of 50 healthy lactating Holstein cows were housed in the test barn. A total of 250 one-minute episodes were extracted from the recorded videos, capturing diverse behaviors of the cows, which included five parts: reclining (R), standing (S), transitions from reclining to standing (RS), transitions from standing to reclining (SR), and body shaking (BS). The episode sizes for each behavior were as follows: 97 episodes for reclining posture, 87 episodes for standing posture, 26 episodes for reclining to standing, 29 episodes for standing to reclining, and 48 episodes for body shaking. It is worth noting that there was overlapping data between the group of standing and body shaking, consisting of 32 episodes, as well as between the group of reclining and body shaking, with five episodes. Such distribution of each behavior was mainly based on the time budget of cows and our rough observation. The distribution of different behaviors within the recorded episodes is concisely summarized in Figure 1b.

2.1.2. Respiration Rate Observation

The cow was considered to be exhaling when the flank appears to sink inward and inhaling when the flank appears to rise or expand. Based on this criteria, three observers manually tallied the respiration rates from the 250 episodes, with each flank undulation representing a complete respiration cycle. Each observer independently counted the respiration rates of all the 250 episodes. Each episode was 60 s, which was recommended by Dißmann et al. [36] to ensure more precise respiration rate counting. Interobserver reliability for pairs ranged from 0.95 to 0.99, as measured by the Pearson correlation.

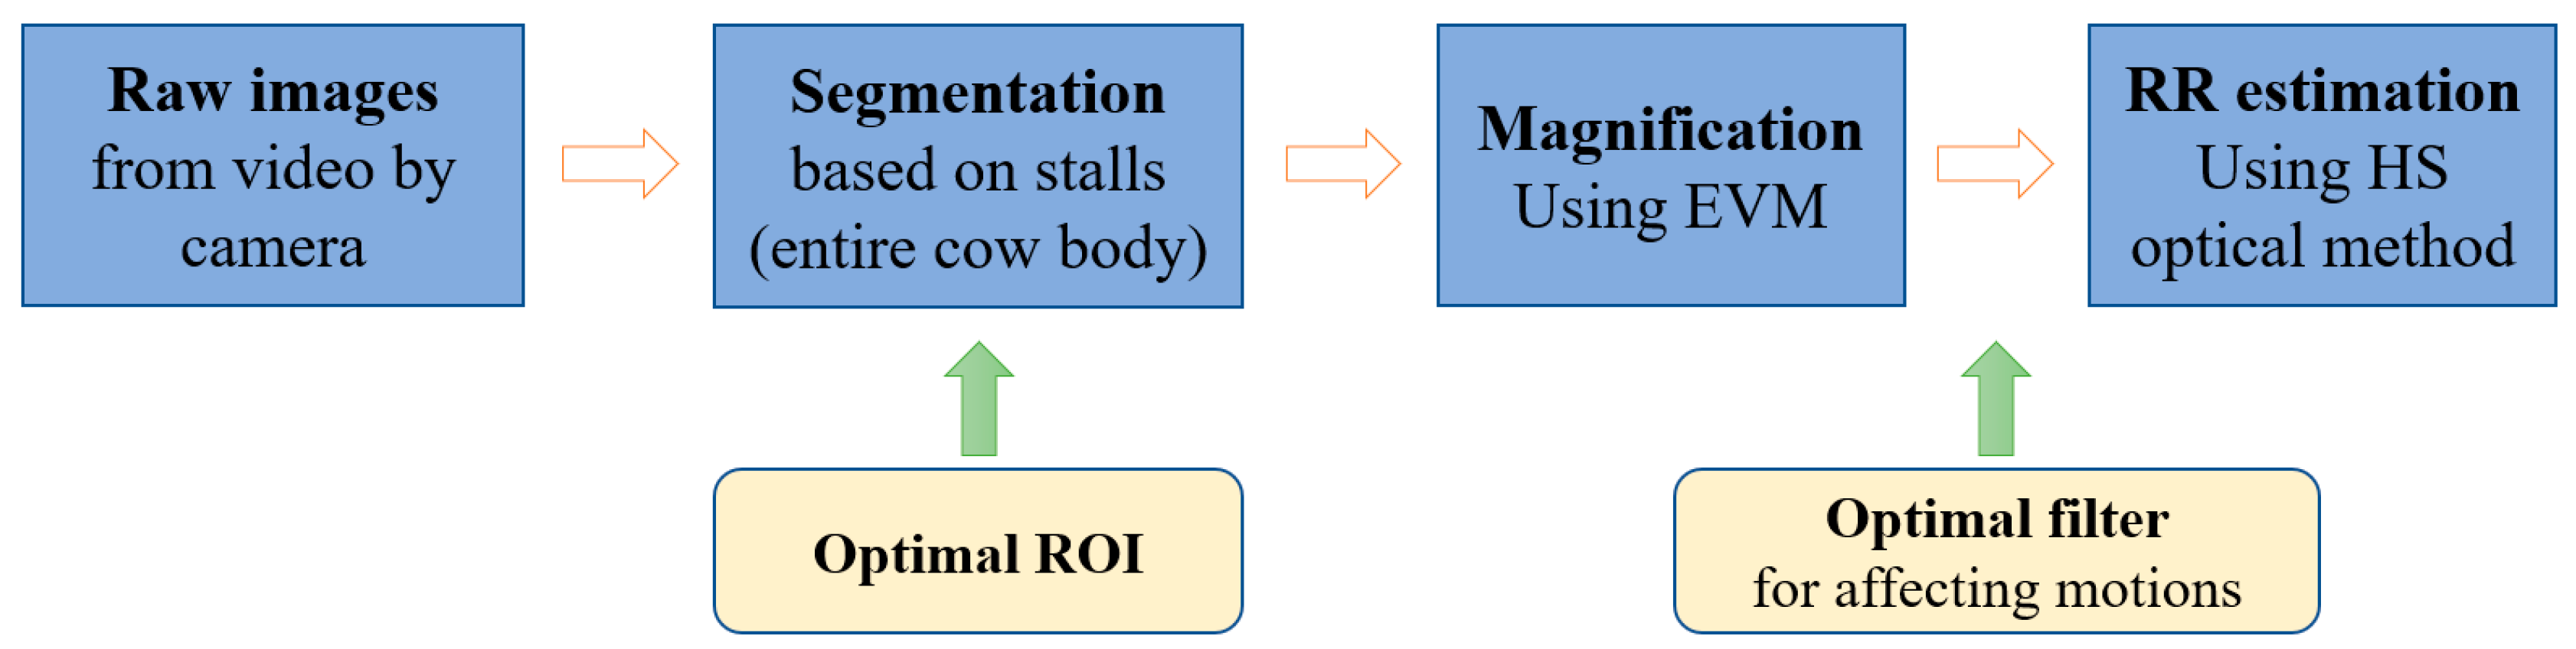
2.2. Signal Processing

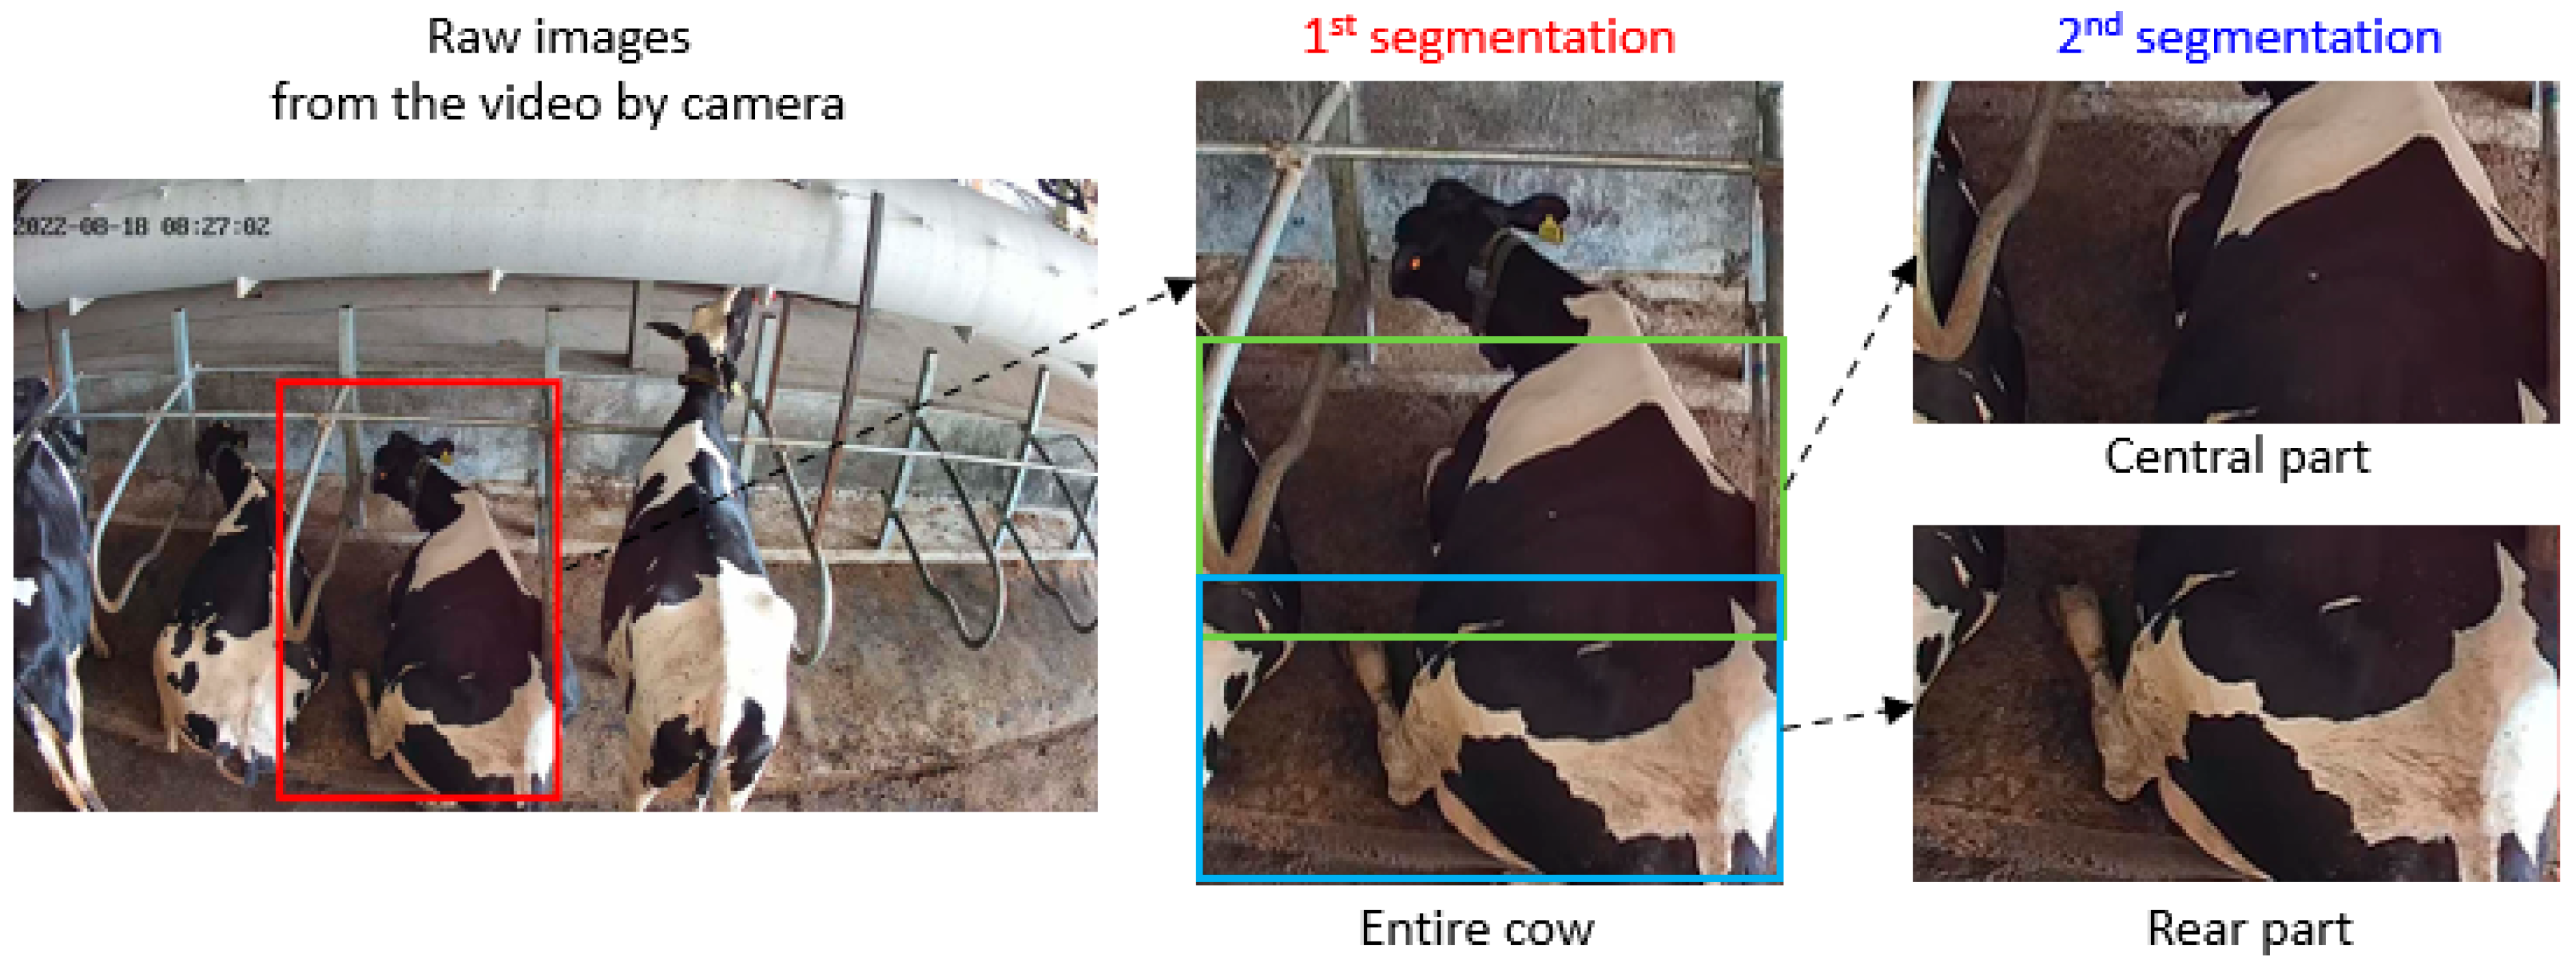
2.2.1. Object Segmentation

The region of interest (ROI) in this study was designed to be segmented at the beginning of the video processing, given the facts that (1) cows stay in their stall for most of the time, (2) the monitoring cameras were normally fixed on beams or the ceiling to capture the videos in the stalls, and (3) the automatic object detection method is time consuming. By doing so, the time for automatic ROI detection could be saved and the RR estimation could be faster.
The object segmentation process in this study involved two parts: (1) the segmentation of cow (stall) from the raw image in the video, and (2) the segmentation of ROI on the cow. In the first step, the video frame was meticulously segmented with a rectangular box, which covered the entire cow body (as shown in Figure 2). The resolution of the image containing the entire cow was set at 890 × 630 pixels. The primary objective of this segmentation process was to isolate the cow from the background and other extraneous elements present in the video.
In the second step, further segmentation was performed on the cow pictures obtained from the previous step. Given that flank fluctuation is the primary motion observed during cow breathing, the central part region was designated as ROI and was precisely segmented from the cow images. Moreover, for comparison purposes, the tail end part was considered as an alternative ROI. As a result, there were three distinct segmentation schemes: the first scheme, referred to as Scheme 1, encompassed images of the entire cow with a resolution of 890 × 630 pixels, the second scheme, referred to as Scheme 2, comprised images of the central part with a resolution of 350 × 630 pixels, and the third scheme, referred to as Scheme 3, consisted of images of the tail end with a resolution of 450 × 630 pixels, as illustrated in Figure 2 marked with red, green, and blue box, respectively.
After the segmentation process, the segmented images were resynthesized to create 60 s videos. This step ensures that the segmented regions of interest were represented in video format, allowing for further analysis and processing of the respiration rate signals.

2.2.2. Video Amplification

The flank movements associated with cow respiration are relatively subtle, and various interfering factors contribute to this periodic fluctuation. To accurately detect the respiration rate (RR), it was imperative to enhance the visibility of these subtle abdominal movements. In this study, Eulerian Video Magnification (EVM) was employed to achieve this amplification. EVM is a well-established method used to capture and amplify small motion signals in continuous image sequences. This technique enables the extraction of quantifiable and processable object motion information [37,38]. By applying EVM, the respiratory motion of cows captured in the video sequences could be significantly enhanced, facilitating easier analysis and quantification.

2.2.3. Horn-Schunck Optical Flow Method

The periodic motions of the cow’s flank, which correspond to respiration, can be observed through the local image deformation between consecutive frames captured via a digital camera over time. To extract the cow’s respiratory information from the video, the Horn-Schunck (HS) optical flow method was adopted in this study. The HS optical flow method is widely used to describe brightness variation in an image by analogy with a flow field [39].
In the HS optical flow method, the variation in optical flow angles across different frames was utilized to capture the periodic fluctuation of the cow’s flank. By employing the Fast Fourier Transform (FFT) on the optical flow data, the frequency with the strongest intensity can be identified. When the cow is stable, the frequency with the highest intensity is the frequency of the respiratory signal (f). Consequently, the cow’s respiration rate (RR) can be obtained using the following equation:
R R = t f
where RR is the respiration rate, bpm, t denotes the time length of the video, s; f is the frequency with the greatest intensity of the signal, Hz.

2.3. Filters for Affecting Motion

To accurately predict the cow’s respiration rate while mitigating the impact of posture transitions and body movements on the prediction, a series of filters were meticulously applied to denoise the behavioral signal derived from periodic flank movements. The effectiveness of the different filtering approaches and segmentation schemes was rigorously compared and evaluated to identify the most suitable method for enhancing the accuracy of respiration rate estimation. The filters used in this study were as follows:
(1)
Butterworth filter: The Butterworth filter is a commonly used signal processing filter designed to have a frequency response that can filter out unwanted frequency signals and retain required frequency signals [40]. It is an Infinite Impulse Response (IIR) filter characterized by a frequency response curve that is as flat as possible with no ripple in the pass band, and gradually decreases to zero in the stop band.
(2)
Elliptic filter: An elliptic filter is a type of filter that introduces ripples in both the passband and stopband [41]. Compared with other types of filters, elliptic filters have the smallest passband and stopband fluctuations under the condition of the same order. Unlike the Butterworth filter, which remains flat in both regions, elliptic filters exhibit equal fluctuations in both the passband and stopband.
(3)
Segmentation filters: In addition to traditional filtering methods, the video data can be divided into multiple segments. According to the spectral characteristics of different cow behaviors, most of the motions lasted less than 20 s, therefore, the video segments exhibiting spectral features associated with posture transitions and body shaking could be potentially removed from the 60 s video episodes. To implement the assumption, this research considered three segmentation schemes: Scheme A, B, and C divided each 60 s video episode into two 30 s parts, three 20 s parts, and six 10 s parts, respectively. The strategies of the segmentation are listed in Table 1.

2.4. Algorithm Development and Comparison

A modified cow respiration rate (MCRR) detecting algorithm was proposed through integrating the optimal region of interest (ROI) for dairy cows and the proper noise filtering algorithm. This integration aimed to yield a more accurate method for estimating the cow’s respiration rate. The dataset obtained from the field experiment was utilized to assess the performance of the MCRR algorithm. The MCRR was compared with the original respiration rate algorithm that was solely based on the HS optical flow method (as illustrated in Figure 3 with blue boxes). Furthermore, in order to comprehensively assess the MCRR algorithm’s efficacy in respiration rate estimation across various cow behaviors, distinct sub-datasets were meticulously examined. Each sub-dataset represented a distinct cow behavioral scenario. This thorough examination allowed for a comprehensive understanding of the MCRR algorithm’s robustness and versatility in accurately estimating respiration rates across a range of diverse behavioral contexts.

2.5. Estimating Speed Optimization

2.5.1. Frame Rate

The respiration rate typically ranges from less than 30 bpm for thermally comfortable cows to up to 120 bpm or even higher (~150 bpm) under severe heat stress conditions [4,9,42,43], corresponding to a frequency range of 0.5–2.5 Hz. According to the Nyquist sampling theorem, the sampling frequency should be twice or more than the frequency of the target signal [44]. So the minimum frequency of the video surveillance system is 5 Hz. Considering that the typical frequency of the video surveillance system is usually 25 Hz, there is an opportunity to reduce the number of frames used for RR estimation. By doing so, the computational cost could be saved and the computational time for each video sample could be reduced. To determine the optimal time interval between consecutive frames for the RR estimation of cows, 60 s video episodes with frame rates of 5, 13, and 25 Hz were selected for analysis. The computational time and the accuracy of respiration rate estimation were subsequently assessed for each frame rate.

2.5.2. Video Resolution

Another approach to reduce computational costs for cow respiration rate estimation is by reducing the video resolution. The raw video frames used in this study had pixel sizes of 630 × 890 or 630 × 450, depending on the different regions of interest used. To evaluate the effect of video resolution on the accuracy of respiration rate estimation and computational time, the resolution was reduced to 315 × 225, 158 × 113, 79 × 57, and 40 × 29, and the corresponding percentage of the raw video resolution was 50%, 25%, 12.5%, and 6.3% of the original size.
The algorithm’s computational time, t, was defined as the duration starting from the video amplification to the output of RR. For the execution of computations, this study utilized a computer equipped with an 8-core i7-9700K CPU, 64 GB of running memory, and an NVIDIA GeForce RTX 2060 graphics card.

2.6. Evaluation Criteria

In this study, we conducted tests to assess the effectiveness of animal motion filters and Region of Interest (ROI) selection in the estimation of respiration rate (RR) using the optical flow method. Furthermore, we sought to identify optimal design parameters, specifically focusing on frame rate and video resolution. To evaluate the proposed algorithms, the absolute relative error ( δ ), and Pearson’s correlation coefficient ( ρ ), and root mean square error (ε) were adopted:
δ = R R e s t R R g t R R g t × 100 %
ρ = c o v ( R R e s t , R R g t ) σ e s t σ g t
ε = i = 1 Ν ( R R e s t ,   i R R g t , i ) 2 N
where RRest and RRgt denote the estimated respiration rate and ground truth respiration rate, bpm, cov(RRest, RRgt) is the covariance, and σ e s t and σ g t are the standard deviation of estimated and ground truth respiration rate, and N is the total number of samples.

3. Results and Discussion

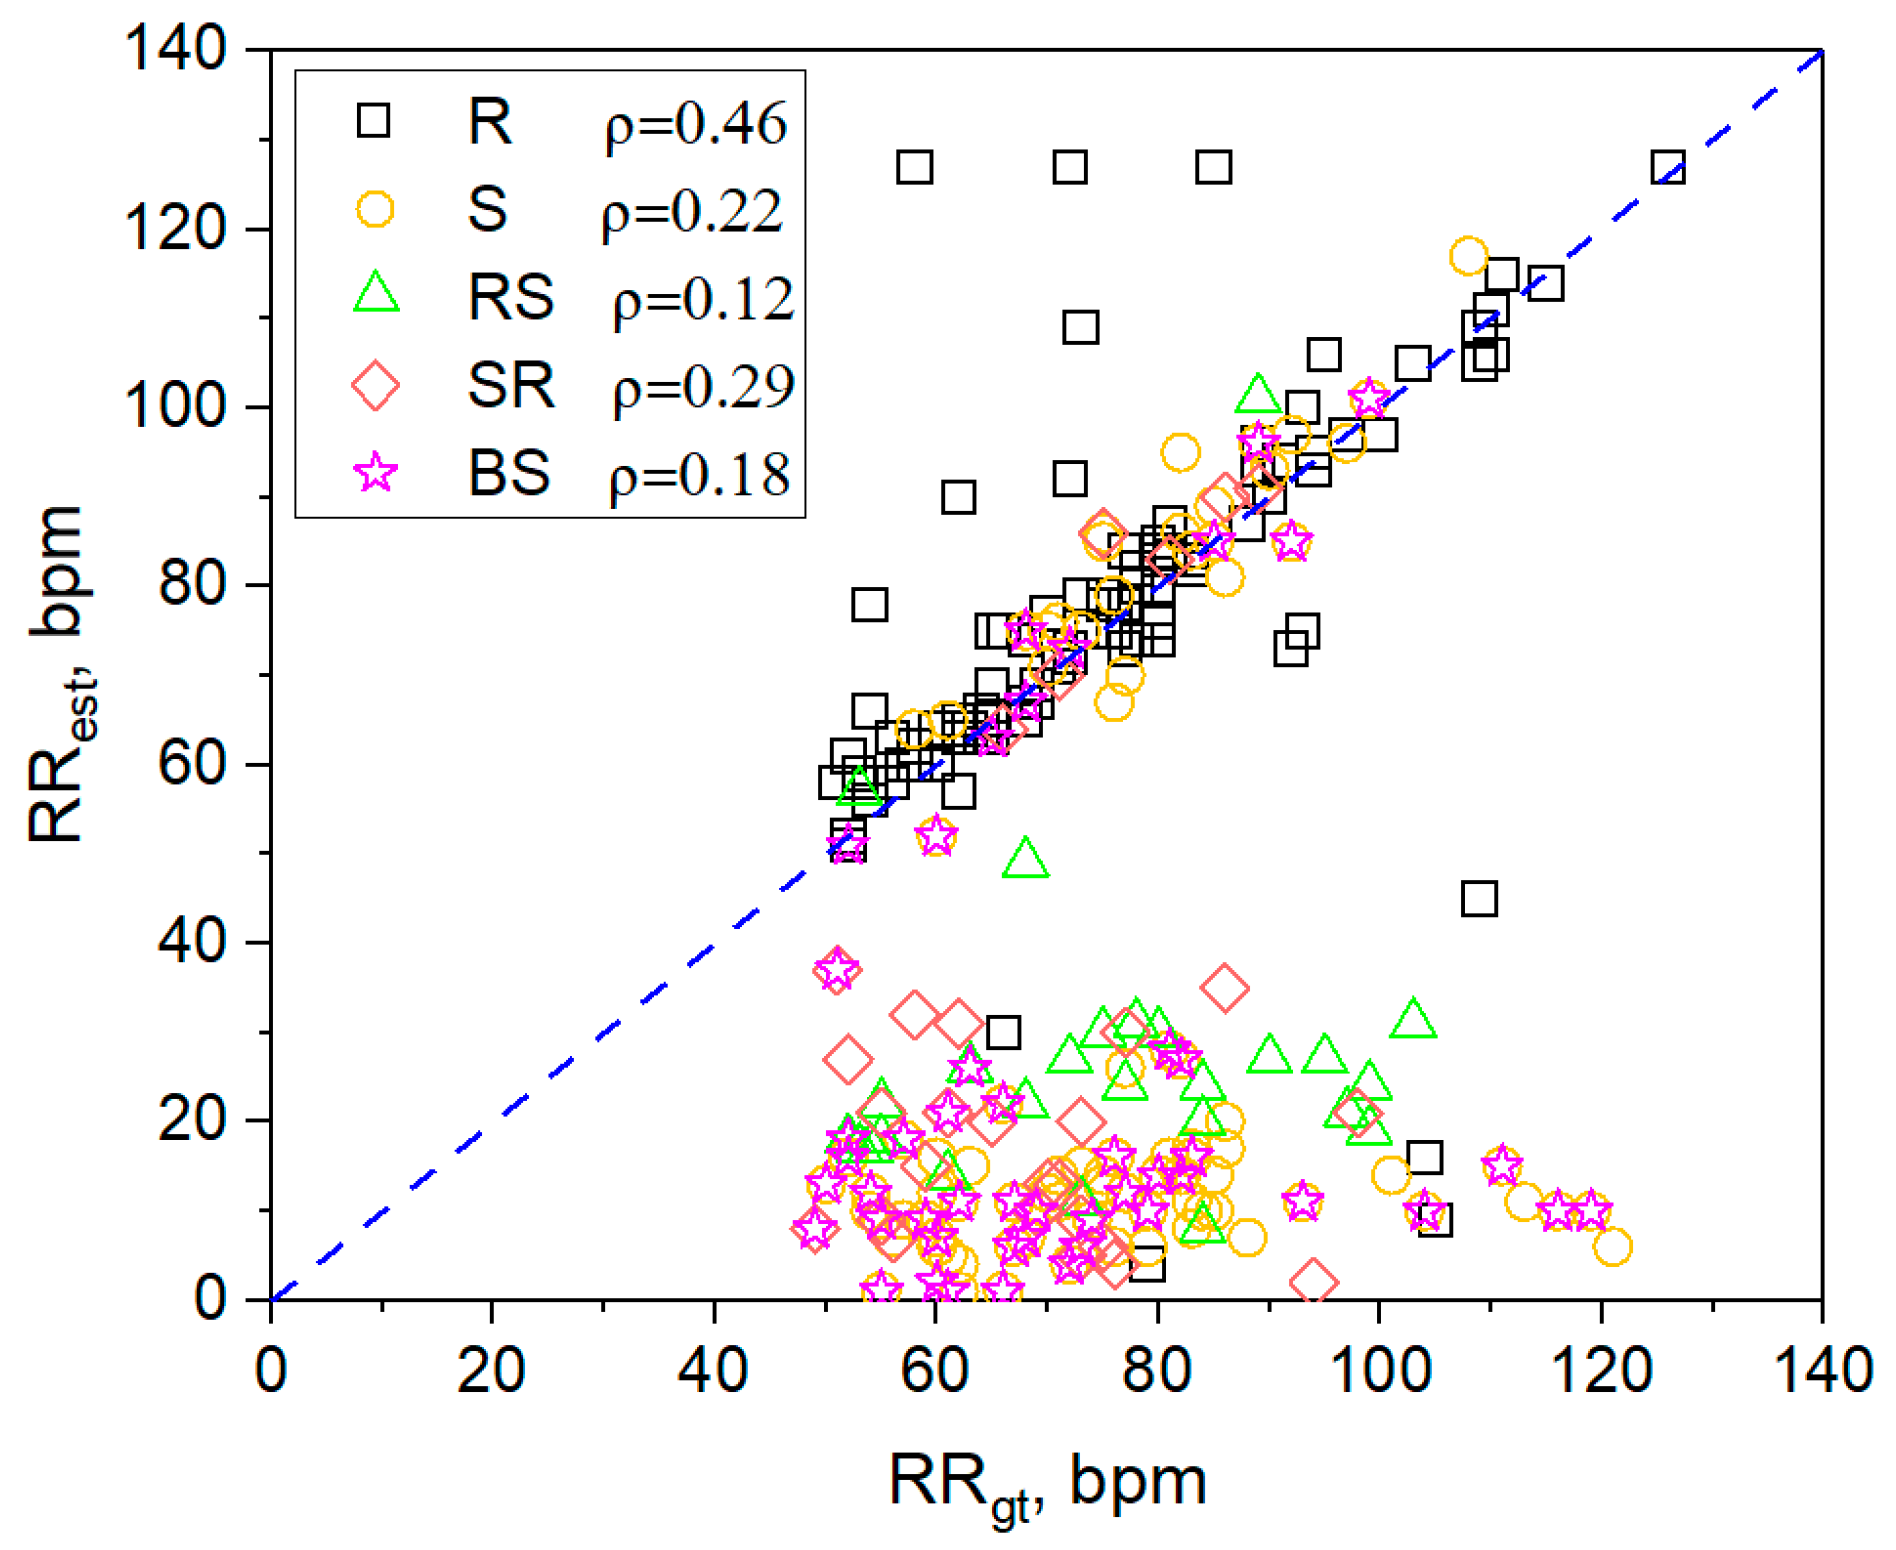
3.1. Motion Effect on Optical Flow-Based RR Estimation

Figure 4 shows the predictive accuracy assessment of the initial RR estimation algorithm utilizing the HS optical flow method. Among the five distinct datasets representing various motions, the dataset corresponding to reclining cows yielded the highest Pearson correlation coefficient. This observation suggests that the original estimation algorithm exhibited superior capability in predicting the respiration rate of cows in a reclined posture compared to other motion types. However, it is noteworthy that despite this performance, the Pearson correlation coefficient only reached 0.46, indicating inadequate precision in predicting the respiration rate for reclining cows.
Among the different motions considered, the algorithm’s poorest performance was in predicting respiration during body shaking. It is important to highlight that the dataset associated with the standing posture displayed a noticeable dissimilarity, possibly arising from the partial inclusion of data originating from the body shaking dataset. The impact of these various motions on prediction accuracy is noteworthy; both posture transitions and body shaking introduce noise to the original respiration rate signal, thereby significantly affecting prediction precision. To achieve enhanced predictive accuracy, it is imperative to appropriately mitigate the influence of motion artifacts. This underscores the necessity of effectively eliminating the effects of motion for precise respiration rate prediction.

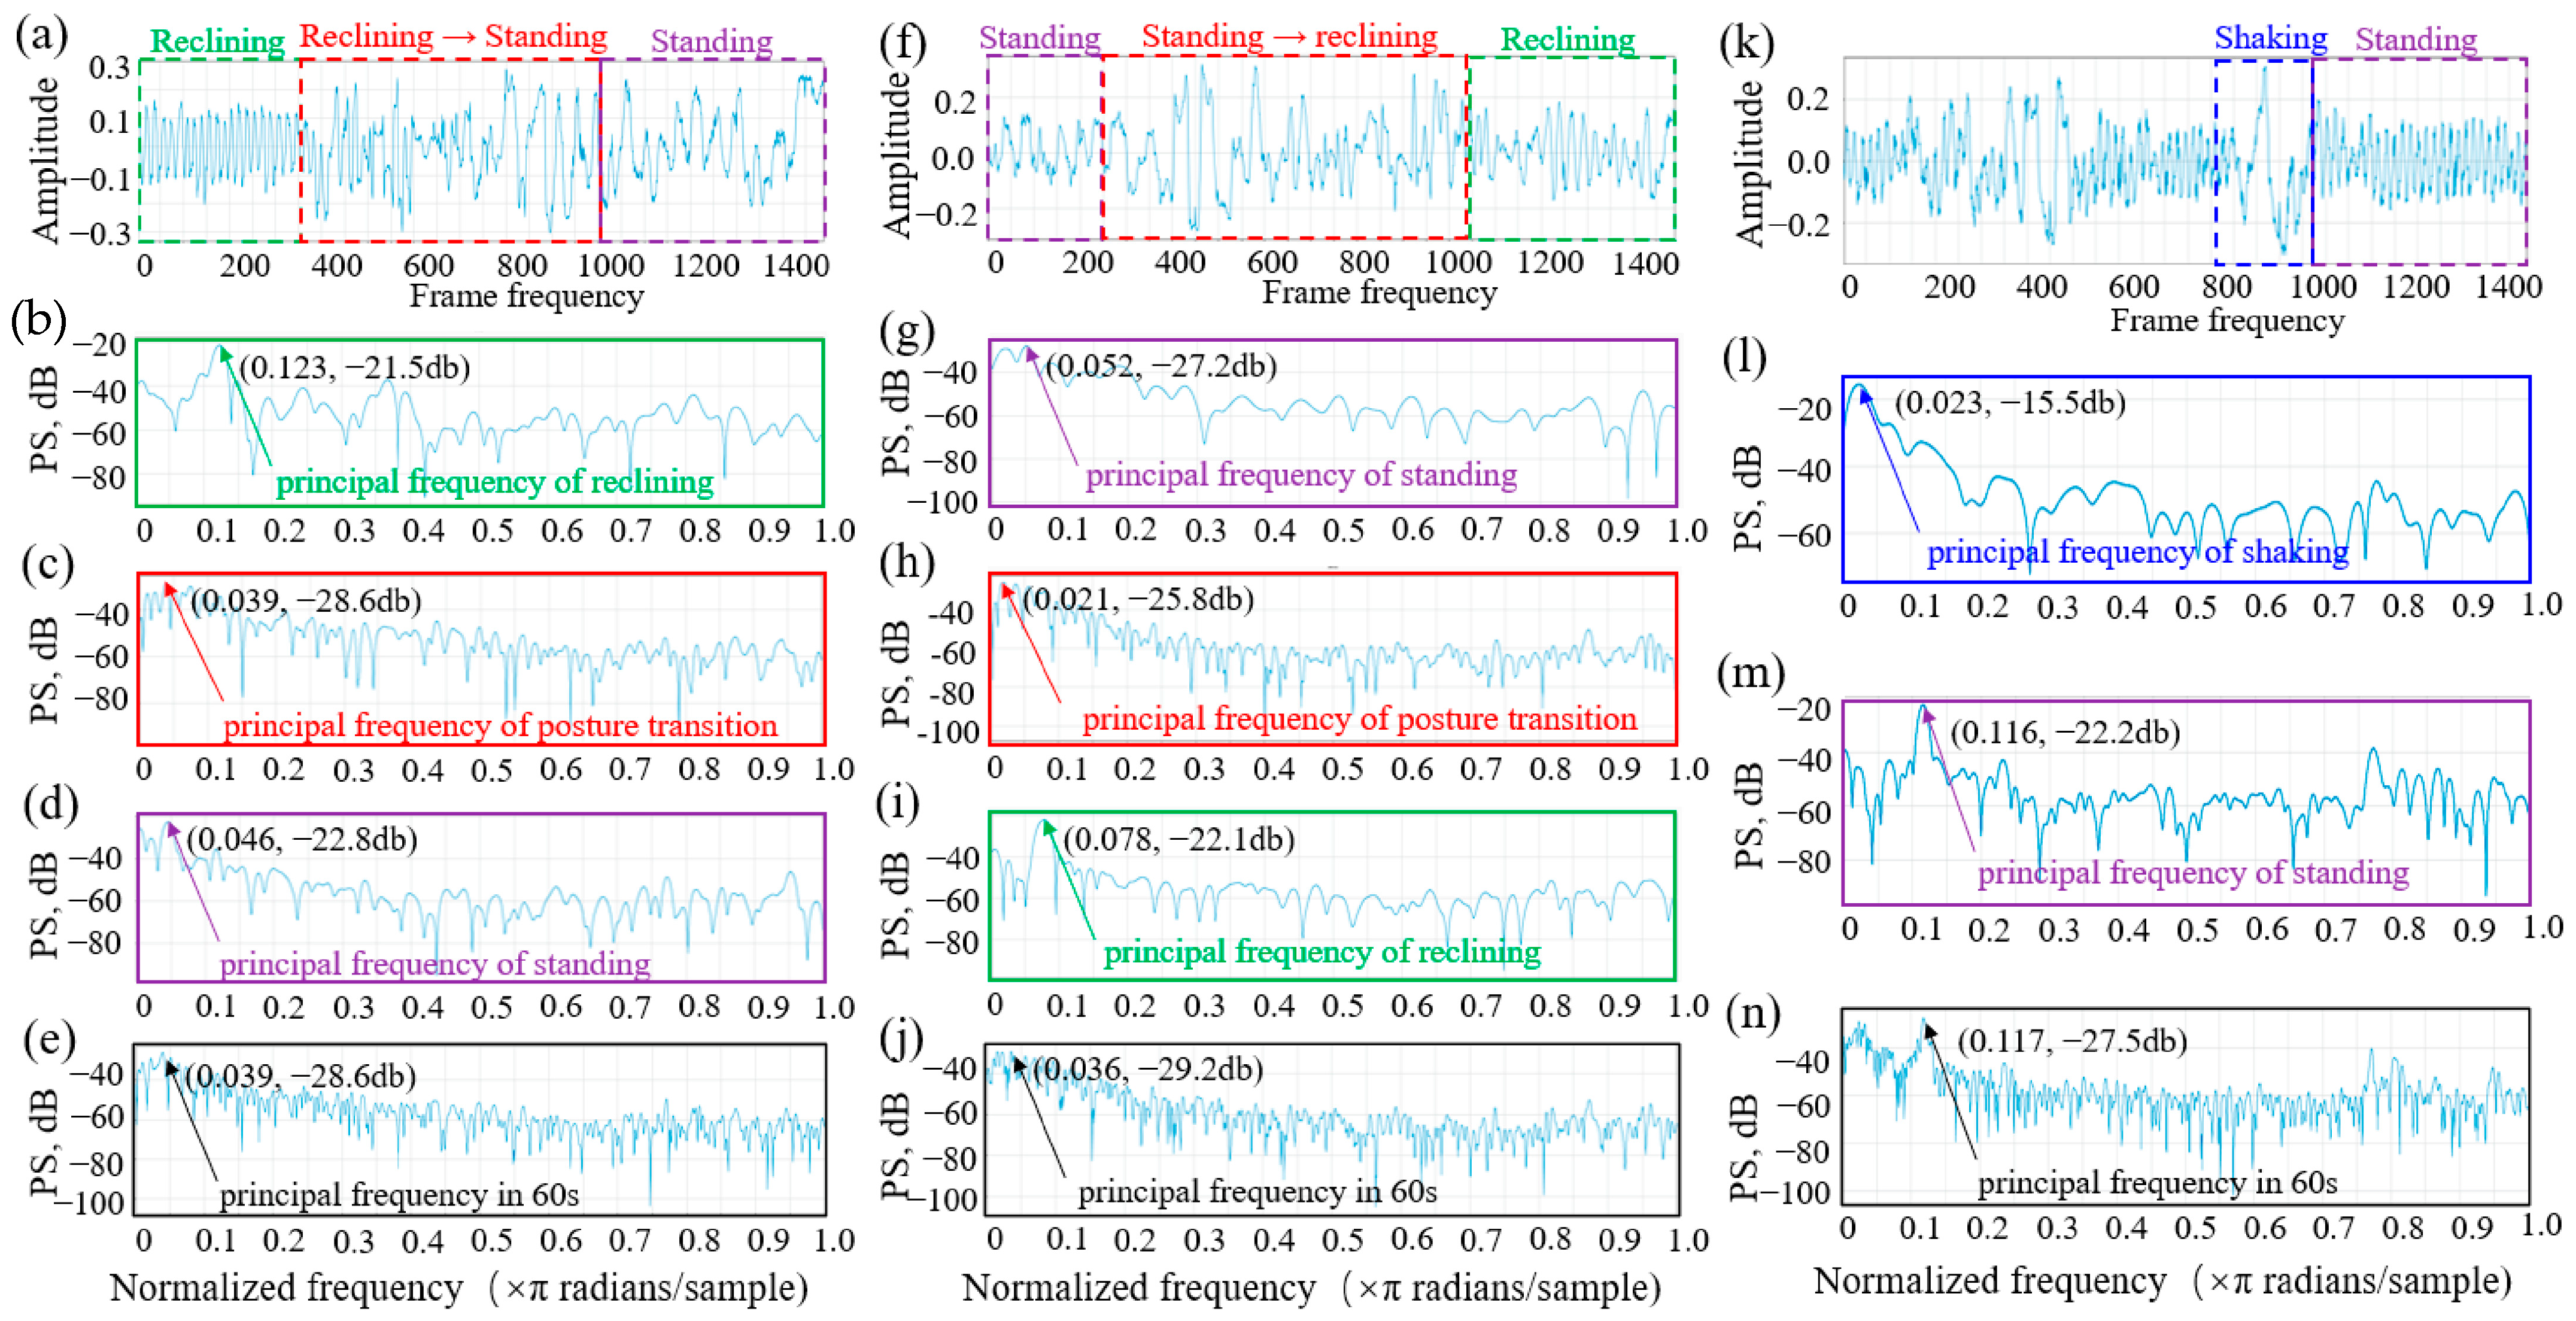
3.2. Spectrum Features of Different Motions

The typical behavior included posture transitions and body shakes. Figure 5 illustrates the spectral characteristics of two distinct scenarios involving a cow undergoing posture transitions: rising and lying down. The rising motion was observed to persist for 650 frame frequencies, constituting more than 40% of the total frames. Similarly, the motion of lying down was observed to span 800 frame frequencies, accounting for approximately 50% of the total frames. For the rising scenario, the normalized principal frequencies of lying state, rising, standing state, and the entire period were 0.123, 0.039, 0.046, and 0.039 π rad sample-1, corresponding to 1.538, 0.488, 0.575, and 0.488 Hz, respectively. The corresponding intensities were −21.5, −28.6, −22.8, and −28.6 dB, as indicated in Figure 5a–e.
Regarding the lying down scenario, the normalized principal frequencies of standing state, lying down, lying state, and whole state were 0.052, 0.021, 0.078, and 0.036 π rad sample-1, corresponding to 0.650, 0.263, 0.975, and 0.450 Hz, and their strengths were −27.2, −25.8, −22.1, and −29.2 dB, as shown in Figure 5f–j. Notably, in both posture transitioning scenarios (rising or lying down), the principal frequency associated with the transition was observed to be lower compared with the other two postures. Clearly, high-intensity signals were generated during the posture transitions, which generally surpassed those of the respiration. However, since a transition was not a repetitive movement, its frequency was expected to be lower than the respiratory frequency signal.
Regarding the body shaking, most of the cow’s body shaking occurs when they are standing. Similar to posture transition, body shaking generated high-intensity but low-frequency signals as well, as shown in Figure 5k–n. The normalized frequency range associated with body shaking fell in the range of 0.001 and 0.050 π rad sample-1, corresponding to 0.013 and 0.625 Hz.
Based on the spectral characteristics of different motion states of cows, it is observed that the frequency of influencing behaviors typically fell into the range between 0.013 and 0.625 Hz. To mitigate the influence of these behaviors on respiratory rate detection, frequencies below 0.625 Hz should be filtered out. Nevertheless, a cow’s respiration rate below 38 breaths per minute can also produce a frequency that overlaps with the range of 0.013 and 0.625 Hz. As a result, accurately capturing the true spectral characteristics of respiration rate becomes challenging when the cow’s respiration rate is below 38 breaths per minute. Typically, a thermally comfortable cow exhibits a respiration rate ranging from 26 to 50 breaths per minute [4]. When experiencing heat stress, the respiration rate would increase and can exceed 120 breaths per minute, even close to 150 breaths per minute in extreme cases [9,42,43]. Given the range of respiration rate for heat-stressed cows, the corresponding main frequency of respiration rate lie in the range from 0.833 to 2.5 Hz. Consequently, the cow respiration rate detecting algorithm could be suitable for conditions of mild heat stress and above.

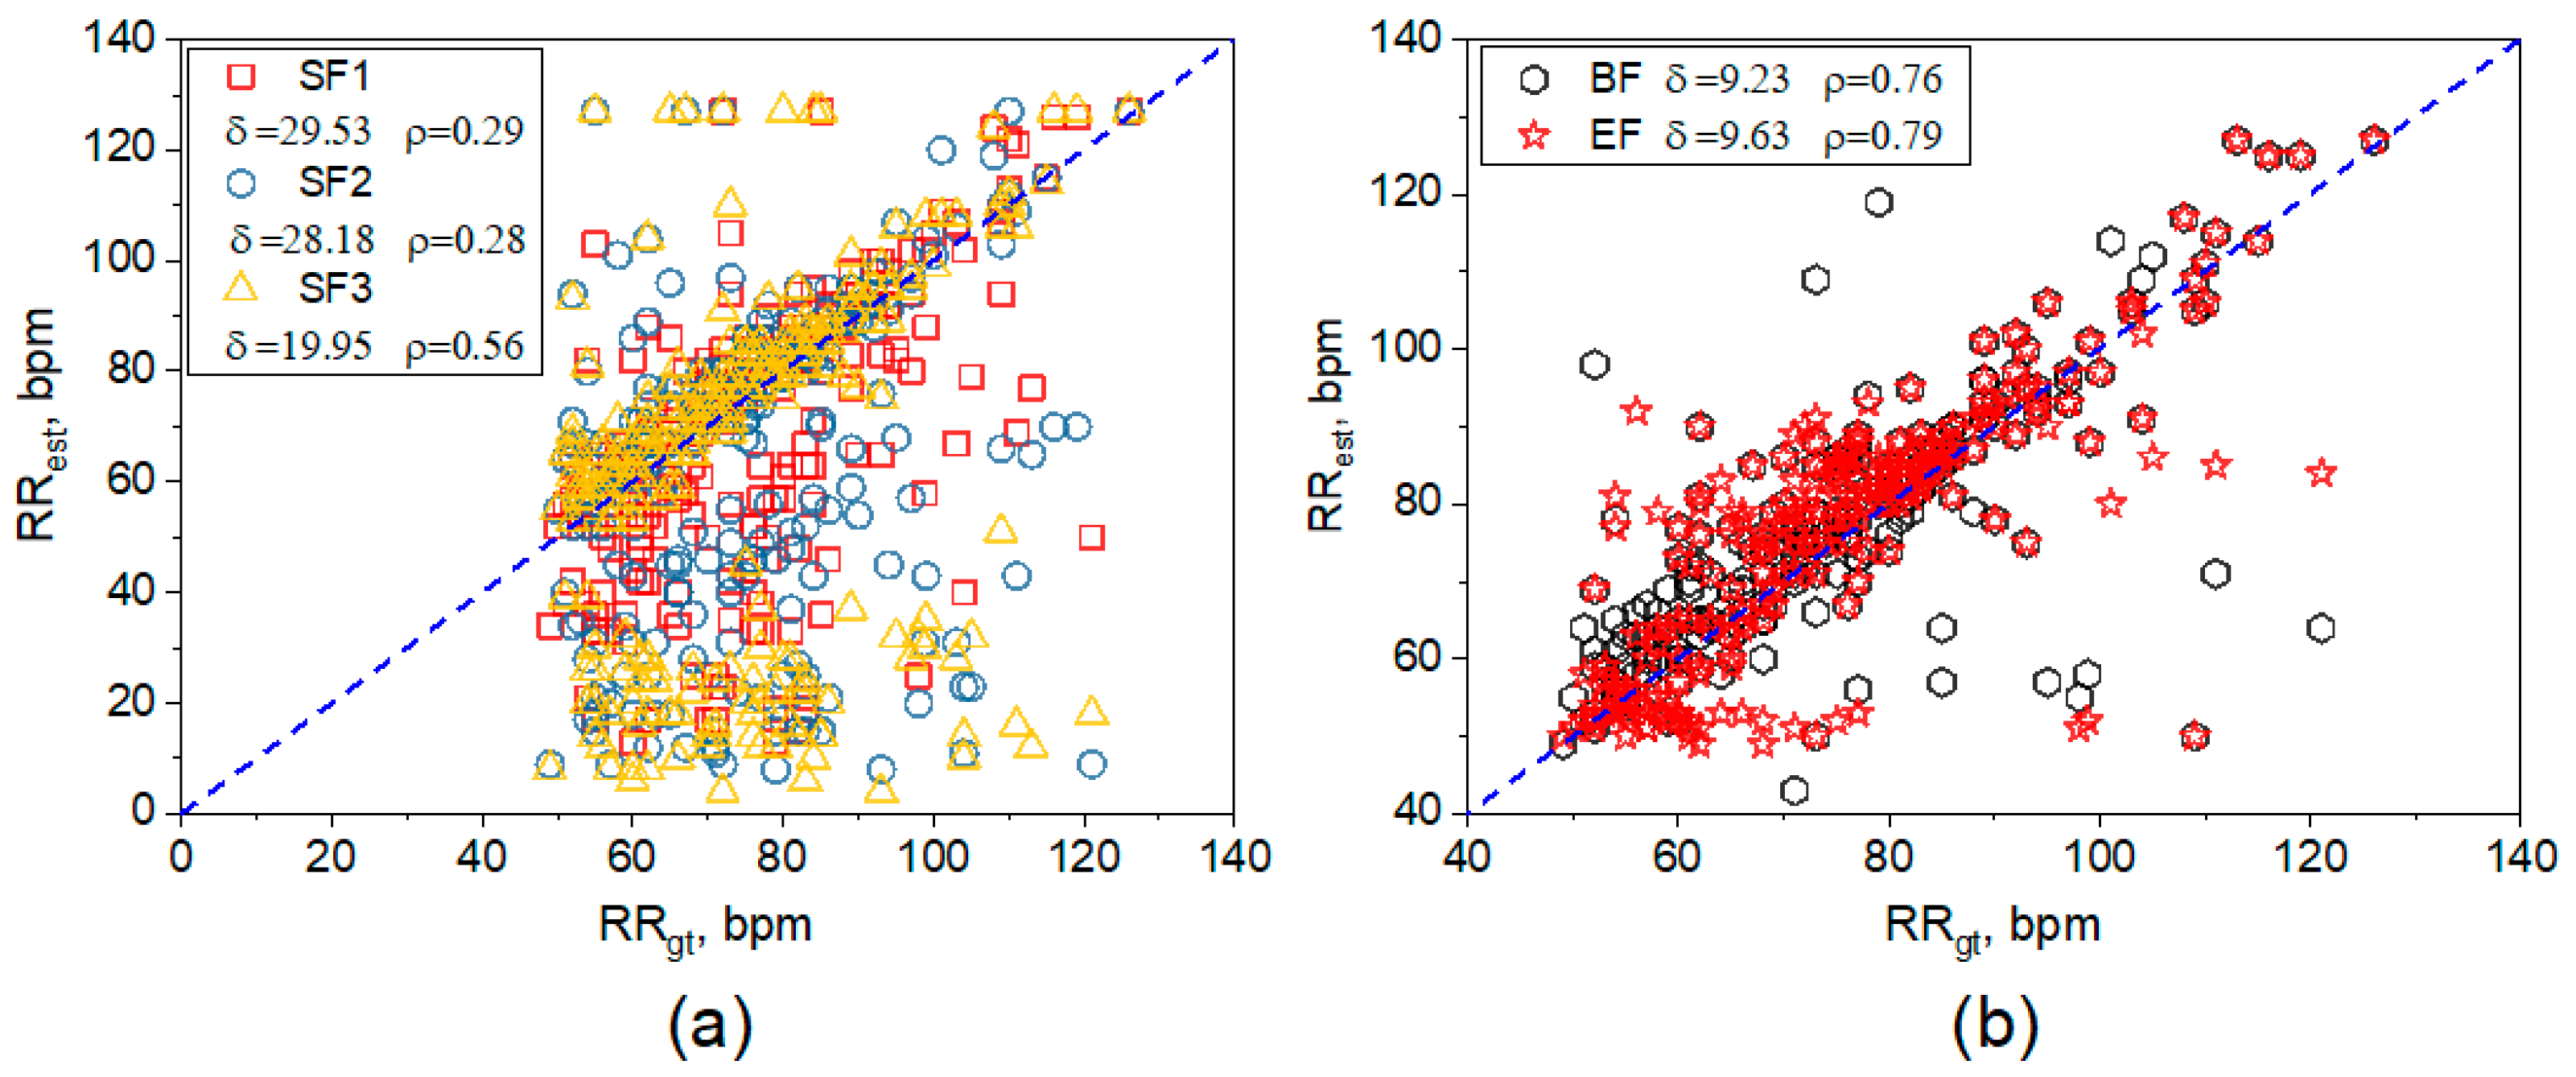
3.3. Performance of Filters

Figure 6 shows the predictive performance of cow respiration rate among different filters. The two traditional filters (Butterworth filter and elliptical filter) had better performances compared with the other three segmentation filters (Schemes A, B, and C). The mean absolute relative error (δ) of the RR estimation with the Butterworth filter and the elliptical filter were both 10 % lower than that of Schemes A, B, and C. Among the three segmentation filtering schemes, a finer video division (Scheme C, SF3) led to higher accuracy, which can be attributed to the dividing scheme. As stated previously, Scheme A divided the video into two parts, both of which might contain posture transition processes. A similar phenomenon could also occur in Scheme B. Scheme C performed relatively better than the other two because it filtered out low-frequency data for 30 s (equivalent to three 10 s parts), which was more likely to exclude the duration of posture transitions. Even so, the MARE (δ) of Scheme C was still greater than those of the two traditional filters. Between the two traditional filters, their performances were quite close. Since the Butterworth filter had 0.4% lower mean absolute relative errors than that of the elliptical filter, the Butterworth filter was selected.

3.4. Effect of Different Region of Interest

Figure 7 presents estimated respiration rate values compared to the ground truth (GT) values under different region of interest (ROI). When treating the entire body area of the cow as the ROI, the absolute relative error (Mean ± SD) of the cow’s respiration rate was 9.2 ± 11.4%. In contrast, when selecting the rear part and central part of the cow as the ROI, the absolute relative error of the cow’s respiratory rate was 8.2 ± 12.3% and 7.6 ± 8.9%, respectively, and the corresponding Pearson correlation coefficient was 0.86 and 0.79, respectively. The central part of the cow body was the best, which could be attributed to (1) setting the central part as the ROI can effectively avoid the influence of body shaking and tail swinging, and (2) the fluctuation of the flank when breathing has the most significant single, while the other two ROIs involved head shaking and/or tail swinging. Hence, designating the central part as the ROI for cow RR estimation performed the most accurate estimation, since this area can provide a better representation of the cow’s respiratory rate signal and minimize the influence of other movements such as body shaking, tail swinging, and head movements. It is also worth noting that using the central part of cows as the ROI can still fail to capture the abdominal fluctuation when a cow has posture changes and body shaking. Therefore, setting the central part as the ROI only marginally enhances the prediction accuracy of the cow’s respiration rate when the cows are rising, lying down, or shaking body.

3.5. Performance of the Improved Algorithm

By integrating the suitable filter for the cow’s motions and ROI for monitoring, the modified cow respiration rate (MCRR) algorithm was synthesized. Figure 8 shows the comparison of prediction performance between the traditional algorithm and the modified cow respiration rate algorithm in different postures and body motions. The implementation of the MCRR algorithm led to a great improvement in the RR prediction of cows. Specifically, the MCRR algorithm enhanced the prediction accuracy of cows with posture transitions and body shaking. Though the degree of the improvement achieved by applying the MCRR algorithm varied with the different cow behaviors, it can be concluded that the MCRR algorithm effectively enhances the prediction accuracy of the respiration rate in dairy cows, meaning that the combination of noise filtering, suitable algorithm selection, and appropriate monitoring area selection contributes to the overall improvement in the estimation of cow respiration rate.

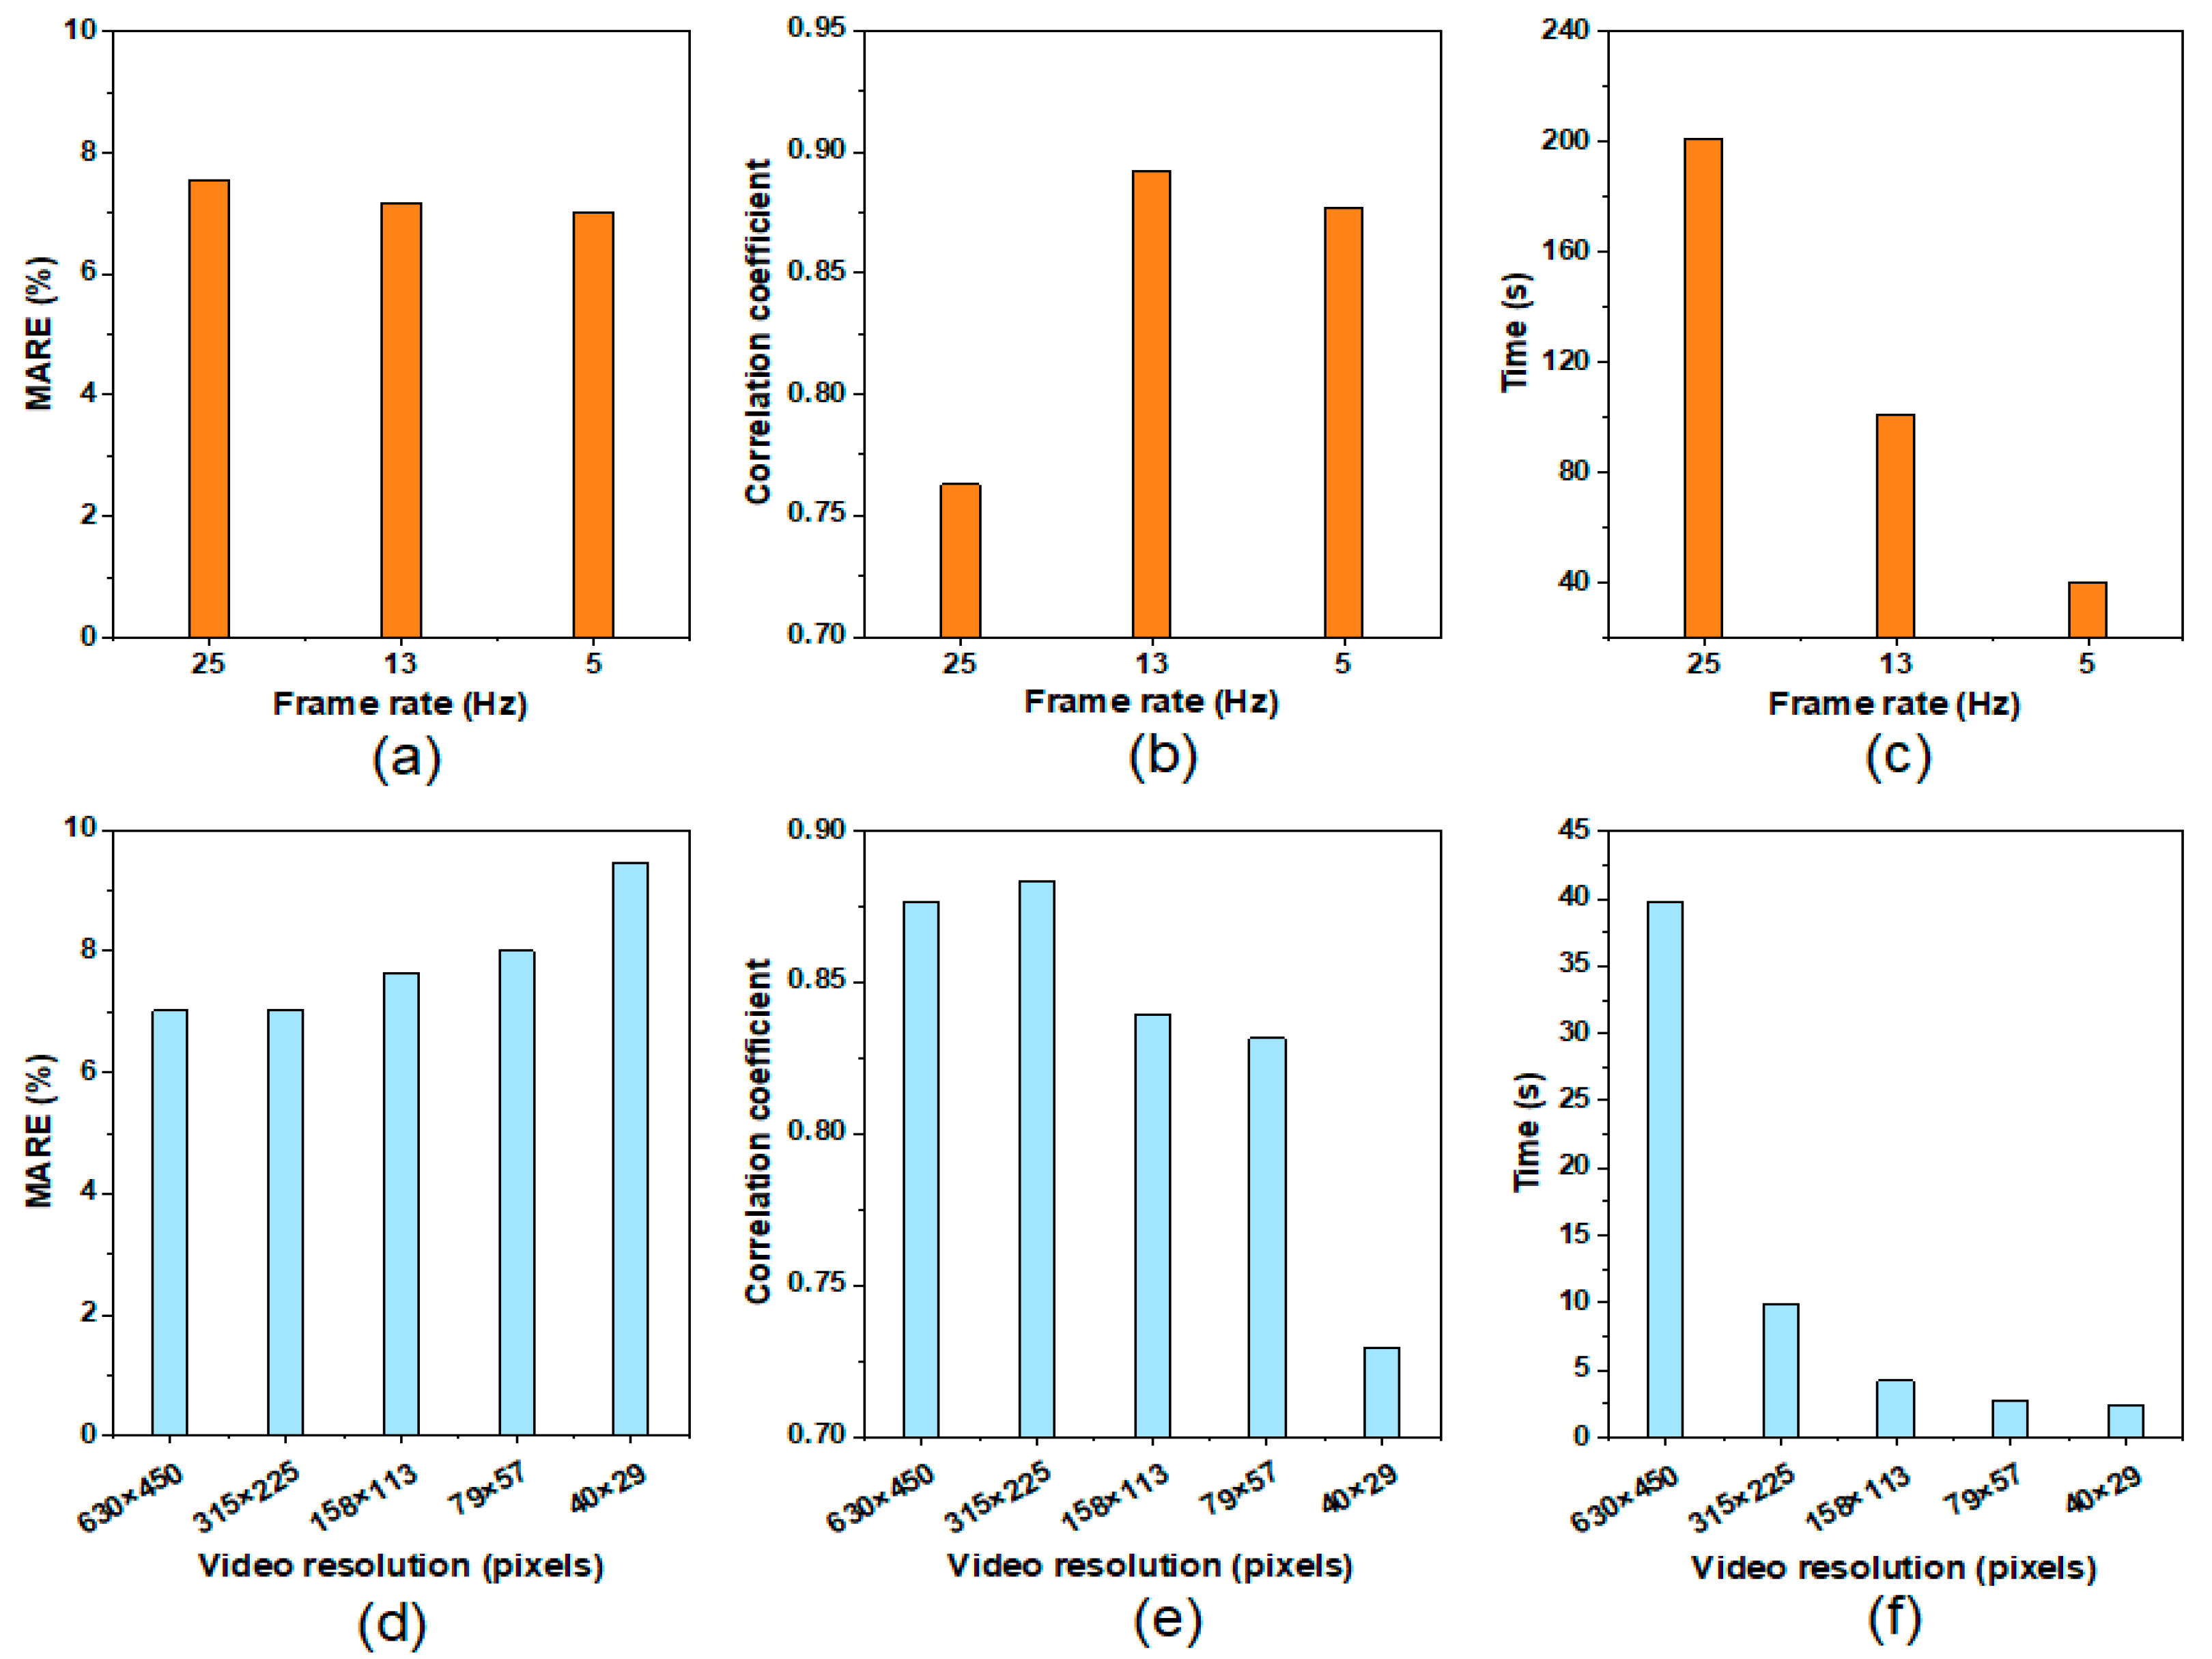
3.6. Computational Speed Improvement

3.6.1. Frame Rate

Figure 9a–c shows the influence of different frame rates (25, 13, and 5 Hz) on the accuracy of the respiration rate of dairy cows and the calculation time. As the frame rate decreases, the absolute relative error of the respiratory rate of dairy cows slightly decreases, with the lowest one of 7.0 ± 8.7% at a frame rate of 5 Hz. The frame rate of 13 Hz had the highest correlation coefficient, and the correlation coefficients associated with the frame rate of 13 and 5 Hz were both 0.1 higher than the one associated with 25 Hz. The reason for this phenomenon may be that with the reduction in frame rate, some unnecessary noise is also removed, so reducing unnecessary frame rate is conducive to improving the accuracy of dairy cow respiration rate. In addition, with the continuous reduction in frame rate, the calculation time of cow respiration rate was significantly reduced, and the calculation time of a 60 s video with 25 frames per second (fps) was 201.2 s, while 13 fps required 100.8 s. At the time of 60 s and 5 fps, the calculation time only needed 39.8 s. The computational time from 25 to 5 Hz can be reduced by 80.25%. Therefore, when monitoring the respiration rate of cows, the shooting method of 5 fps could be recommended for the sake of time-saving. A video of 5 frames/s will also be used in the analysis of the accuracy of the pixel’s respiration rate of the cow.

3.6.2. Resolution

Figure 9d–f shows the influence of different percentages of the raw video resolution (100%, 50%, 25%, 12.5%, and 6%) on the accuracy of the respiration rate of dairy cows and the calculation time. As the video resolution shrunk, the absolute relative error of the respiratory rate of dairy cows gradually increased from 7.0 ± 8.7% to 9.5 ± 14.6%, indicating that higher video resolution could result in a more accurate prediction. The Pearson correlation coefficient for the pixels of 40 × 29 (6% of the raw resolution) was more than 0.1 less than the rest four resolutions. Regarding the computational time, as the video resolution shrunk, the calculation time for the cow respiration rate was greatly reduced from 39.8 to 2.8 s. Though the calculation time of cow respiration rate with 6.3% raw pixels was greatly reduced than that with 100% raw pixels, its accuracy was 1.5% lower and the Pearson correlation coefficient was much smaller than the other four. While the scenario with 12.5% of the raw resolution could not only ensure the accuracy of the respiratory rate of cows, it also ensures the efficient calculation speed with accuracy. To sum up, the 60 s video with 5 fps and 79 × 57 pixels was recommended for the cow respiration rate estimation, which balanced the best results in prediction accuracy and computational times.

3.7. Limitations and Perspectives

Although the average predictive accuracy of the cows’ respiration rate in this study demonstrated improvement by the modified algorithm, reaching 92%, further enhancements were still feasible. Though the HS optical flow method employed in this study was effective, it can be influenced by variations in lighting conditions and shooting angles [45]. Hence, there remains a need for additional research to enhance the monitoring efficacy of cow respiration rate estimation. This study’s findings revealed that interference signals mainly resided in the low-frequency zone, which could potentially impact the accuracy of cow respiration rate estimation, particularly when the respiration rate is below 38 breaths per minute, in which the cows are thermal comfortable. As a result, the proposed algorithm for cow respiration rate detection was recommended specifically for heat stress conditions. Therefore, further studies could be conducted for thermally comfortable cows to ascertain the algorithm’s applicability across a broader range of scenarios. Moreover, due to the limited resource and labors, the current study was primarily based on 250 episodes and encompassed only five typical behaviors, to ensure a more comprehensive assessment of the algorithm’s robustness, we plan to expand our dataset by incorporating a diverse array of cow behaviors and extending the evaluation periods in the future. These endeavors will facilitate a more reliable and rigorous evaluation of the algorithm’s capabilities.

4. Conclusions

In this study, the digital signal processing technology was used to analyze the influence of factors (behavioral noise and region of interest,) on the respiration rate estimation of dairy cows, and based on the analysis, a modified cow respiration rate (MCRR) estimation algorithm based on optical flow method was proposed and optimized in terms of the computational time. The following conclusions can be drawn from the research:
  • The cows posture change and body shaking negatively affect the accuracy of respiration rate detection. The frequencies of these influencing motions fell in the range of 0.013–0.625 Hz. The Butterworth filter performed the best in the mitigation of interference signals of the motions.
  • Designating the central part as the region of interest for the cow respiration rate estimation exhibits the most accurate prediction compared to the entire body and tail end part.
  • The proposed MCRR algorithm greatly improved the accuracy of the cow respiration rate estimation. Based on the comparison, the MCRR algorithm could have an average accuracy of 92%.
  • For computational cost saving, the frame rate can be reduced from 25 to 5 Hz, and the video resolution can be shrunk from 630 × 450 pixels to 79 × 57 pixels. The corresponding computational time can be reduced from 201.2 to 2.8 s, with only an accuracy of 0.4% sacrificed.

Author Contributions

Conceptualization, X.W.; methodology, M.C. and K.C.; software, M.C.; formal analysis, M.C. and K.C.; investigation, X.W. and R.Y.; writing-original draft preparation, M.C. and X.W.; writing-review and editing, X.W. and K.L.; visualization, M.C. and X.W.; data curation, M.C., B.C.; Validation, M.C. and X.W.; supervision, X.W.; project administration, X.W.; funding acquisition, X.W. All authors have read and agreed to the published version of the manuscript.

Funding

This work is supported by the National Key Research and Development Program of China (Grant No. 2021ZD0113601).

Institutional Review Board Statement

This study was conducted according to the guidelines of the Zhejiang University Animal Research. Ethical review and approval were waived for this study, because all images were taken quietly from a distance of at least 5 meters from the dairy cows, without any direct contact with them.

Data Availability Statement

The data presented in this study are available on request from the corresponding author. The data are not publicly available due to privacy.

Conflicts of Interest

The authors declare no conflict of interest.

References

  1. Becker, C.A.; Collier, R.J.; Stone, A.E. Invited review: Physiological and behavioral effects of heat stress in dairy cows. J. Dairy Sci. 2020, 103, 6751–6770. [Google Scholar] [CrossRef] [PubMed]
  2. Nanas, I.; Chouzouris, T.-M.; Dovolou, E.; Dadouli, K.; Stamperna, K.; Kateri, I.; Barbagianni, M.; Amiridis, G.S. Early embryo losses, progesterone and pregnancy associated glycoproteins levels during summer heat stress in dairy cows. J. Therm. Biol. 2021, 98, 102951. [Google Scholar] [CrossRef] [PubMed]
  3. Polsky, L.; von Keyserlingk, M.A.G. Invited review: Effects of heat stress on dairy cattle welfare. J. Dairy Sci. 2017, 100, 8645–8657. [Google Scholar] [CrossRef] [PubMed]
  4. Yan, G.; Li, H.; Zhao, W.; Shi, Z. Evaluation of thermal indices based on their relationships with some physiological responses of housed lactating cows under heat stress. Int. J. Biometeorol. 2020, 64, 2077–2091. [Google Scholar] [CrossRef] [PubMed]
  5. Hempel, S.; Menz, C.; Pinto, S.; Galan, E.; Janke, D.; Estelles, F.; Muschner-Siemens, T.; Wang, X.S.; Heinicke, J.; Zhang, G.Q.; et al. Heat stress risk in European dairy cattle husbandry under different climate change scenarios—Uncertainties and potential impacts. Earth Syst. Dyn. 2019, 10, 859–884. [Google Scholar] [CrossRef]
  6. Joo, S.S.; Lee, S.J.; Park, D.S.; Kim, D.H.; Gu, B.-H.; Park, Y.J.; Rim, C.Y.; Kim, M.; Kim, E.T. Changes in Blood Metabolites and Immune Cells in Holstein and Jersey Dairy Cows by Heat Stress. Animals 2021, 11, 974. [Google Scholar] [CrossRef]
  7. Wang, X.; Bjerg, B.S.; Choi, C.Y.; Zong, C.; Zhang, G. A review and quantitative assessment of cattle-related thermal indices. J. Therm. Biol. 2018, 77, 24–37. [Google Scholar] [CrossRef]
  8. West, J.W. Effects of Heat-Stress on Production in Dairy Cattle. J. Dairy Sci. 2003, 86, 2131–2144. [Google Scholar] [CrossRef]
  9. Wang, X.; Gao, H.; Gebremedhin, K.G.; Bjerg, B.S.; Van Os, J.; Tucker, C.B.; Zhang, G. A predictive model of equivalent temperature index for dairy cattle (ETIC). J. Therm. Biol. 2018, 76, 165–170. [Google Scholar] [CrossRef]
  10. Bohmanova, J.; Misztal, I.; Cole, J.B. Temperature-Humidity Indices as Indicators of Milk Production Losses due to Heat Stress. J. Dairy Sci. 2007, 90, 1947–1956. [Google Scholar] [CrossRef]
  11. Mader, T.; Johnson, L.; Gaughan, J. A comprehensive index for assessing environmental stress in animals. J. Anim. Sci. 2010, 88, 2153–2165. [Google Scholar] [CrossRef] [PubMed]
  12. Hahn, G.; Gaughan, J.B.; Mader, T.L.; Eigenberg, R.A. Thermal indices and their applications for livestock environments. In Livestock Energetics and Thermal Environmental Management; American Society of Agricultural and Biological Engineers: St. Joseph, MI, USA, 2009; Chapter 5. [Google Scholar]
  13. Hillman, P.E.; Lee, C.N.; Willard, S.T. Thermo regulatory responses associated with lying and standing in heat-stressed dairy cows. Trans. ASAE 2005, 48, 795–801. [Google Scholar] [CrossRef]
  14. Shu, H.; Li, Y.; Bindelle, J.; Jin, Z.; Fang, T.; Xing, M.; Guo, L.; Wang, W. Predicting physiological responses of dairy cows using comprehensive variables. Comput. Electron. Agric. 2023, 207, 107752. [Google Scholar] [CrossRef]
  15. Allen, J.D.; Hall, L.W.; Collier, R.J.; Smith, J.F. Effect of core body temperature, time of day, and climate conditions on behavioral patterns of lactating dairy cows experiencing mild to moderate heat stress. J. Dairy Sci. 2015, 98, 118–127. [Google Scholar] [CrossRef] [PubMed]
  16. Gaughan, J.; Holt, S.; Hahn, G.; Mader, T.; Eigenberg, R. Respiration rate-is it a good measure of heat stress in cattle? Asian Australas. J. Anim. Sci. 2000, 13, 329–332. [Google Scholar]
  17. Hahn, G.L. Dynamic responses of cattle to thermal heat loads. J. Anim. Sci. 1999, 77, 10–20. [Google Scholar] [CrossRef]
  18. Santos, S.G.C.G.d.; Saraiva, E.P.; Filho, E.C.P.; Neto, S.G.; Fonsêca, V.F.C.; Pinheiro, A.D.C.; Almeida, M.E.V.; de Amorim, M.L.C.M. The use of simple physiological and environmental measures to estimate the latent heat transfer in crossbred Holstein cows. Int. J. Biometeorol. 2017, 61, 217–225. [Google Scholar] [CrossRef]
  19. Strutzke, S.; Fiske, D.; Hoffmann, G.; Ammon, C.; Heuwieser, W.; Amon, T. Technical note: Development of a noninvasive respiration rate sensor for cattle. J. Dairy Sci. 2019, 102, 690–695. [Google Scholar] [CrossRef]
  20. Jorquera-Chavez, M.; Fuentes, S.; Dunshea, F.R.; Warner, R.D.; Poblete, T.; Jongman, E.C. Modelling and Validation of Computer Vision Techniques to Assess Heart Rate, Eye Temperature, Ear-Base Temperature and Respiration Rate in Cattle. Animals 2019, 9, 1089. [Google Scholar] [CrossRef]
  21. Lowe, G.; Sutherland, M.; Waas, J.; Schaefer, A.; Cox, N.; Stewart, M. Infrared Thermography—A Non-Invasive Method of Measuring Respiration Rate in Calves. Animals 2019, 9, 535. [Google Scholar] [CrossRef]
  22. Kim, S.; Hidaka, Y. Breathing Pattern Analysis in Cattle Using Infrared Thermography and Computer Vision. Animals 2021, 11, 207. [Google Scholar] [CrossRef] [PubMed]
  23. Milan, H.F.M.; Maia, A.S.C.; Gebremedhin, K.G. Technical note: Device for measuring respiration rate of cattle under field conditions. J. Anim. Sci. 2016, 94, 5434–5438. [Google Scholar] [CrossRef] [PubMed]
  24. Handa, D.; Peschel, J.M. A Review of Monitoring Techniques for Livestock Respiration and Sounds. Front. Anim. Sci. 2022, 3, 904834. [Google Scholar] [CrossRef]
  25. Upadhya, V.; Chatterjee, A.; Prathosh, A.P.; Praveena, P. Respiration Monitoring through Thoraco-Abdominal Video with an LSTM. In Proceedings of the 2016 IEEE 16th International Conference on Bioinformatics and Bioengineering (BIBE), Taichung, Taiwan, 31 October–2 November 2016; pp. 165–171. [Google Scholar]
  26. Wu, D.; Yin, X.; Jiang, B.; Jiang, M.; Li, Z.; Song, H. Detection of the respiratory rate of standing cows by combining the Deeplab V3+ semantic segmentation model with the phase-based video magnification algorithm. Biosyst. Eng. 2020, 192, 72–89. [Google Scholar] [CrossRef]
  27. Dudek, R.; Cuenca, C.; Quintana, F. Image Sequences Noise Reduction: An Optical Flow Based Approach. In Computer Aided Systems Theory—EUROCAST 2009; Springer: Berlin, Heidelberg, 2009; pp. 366–373. [Google Scholar]
  28. Nakajim, K.; Matsumoto, Y.; Tamura, T. Development of real-time image sequence analysis for evaluating posture change and respiratory rate of a subject in bed. Physiol. Meas. 2001, 22, N21-8. [Google Scholar] [CrossRef] [PubMed]
  29. Cuan, K.; Zhang, T.; Li, Z.; Huang, J.; Ding, Y.; Fang, C. Automatic Newcastle disease detection using sound technology and deep learning method. Comput. Electron. Agric. 2022, 194, 106740. [Google Scholar] [CrossRef]
  30. Cuan, K.; Li, Z.; Zhang, T.; Qu, H. Gender determination of domestic chicks based on vocalization signals. Comput. Electron. Agric. 2022, 199, 107172. [Google Scholar] [CrossRef]
  31. Miekley, B.; Traulsen, I.; Krieter, J. Detection of mastitis and lameness in dairy cows using wavelet analysis. Livest. Sci. 2012, 148, 227–236. [Google Scholar] [CrossRef]
  32. Wang, M.; Li, X.; Larsen, M.L.V.; Liu, D.; Rault, J.-L.; Norton, T. A computer vision-based approach for respiration rate monitoring of group housed pigs. Comput. Electron. Agric. 2023, 210, 107899. [Google Scholar] [CrossRef]
  33. Zeng, F.; Li, B.; Wang, H.; Zhu, J.; Jia, N.; Zhao, Y.; Zhao, W. Detection of calf abnormal respiratory behavior based on frame difference and improved YOLOv5 method. Comput. Electron. Agric. 2023, 211, 107987. [Google Scholar] [CrossRef]
  34. Rashamol, V.P.; Sejian, V.; Pragna, P.; Lees, A.M.; Bagath, M.; Krishnan, G.; Gaughan, J.B. Prediction models, assessment methodologies and biotechnological tools to quantify heat stress response in ruminant livestock. Int. J. Biometeorol. 2019, 63, 1265–1281. [Google Scholar] [CrossRef]
  35. Hoffmann, G.; Herbut, P.; Pinto, S.; Heinicke, J.; Kuhla, B.; Amon, T. Animal-related, non-invasive indicators for determining heat stress in dairy cows. Biosyst. Eng. 2020, 199, 83–96. [Google Scholar] [CrossRef]
  36. Dißmann, L.; Heinicke, J.; Jensen, K.C.; Amon, T.; Hoffmann, G. How should the respiration rate be counted in cattle? Vet. Res. Commun. 2022, 46, 1221–1225. [Google Scholar] [CrossRef]
  37. Chen, J.G.; Wadhwa, N.; Cha, Y.-J.; Durand, F.; Freeman, W.T.; Buyukozturk, O. Modal identification of simple structures with high-speed video using motion magnification. J. Sound Vib. 2015, 345, 58–71. [Google Scholar] [CrossRef]
  38. Wu, H.-Y.; Rubinstein, M.; Shih, E.; Guttag, J.; Durand, F.; Freeman, W. Eulerian video magnification for revealing subtle changes in the world. ACM Trans. Graph. 2012, 31, 65. [Google Scholar] [CrossRef]
  39. Horn, B.K.P.; Schunck, B.G. Determining optical flow. Artif. Intell. 1981, 17, 185–203. [Google Scholar] [CrossRef]
  40. Milic, L.; Damjanovic, S. Frequency transformations of half-band Butterworth filters with filter bank applications. In Proceedings of the TELSIKS 2005—2005 uth International Conference on Telecommunication in ModernSatellite, Cable and Broadcasting Services, Nis, Serbia, 28–30 September 2005; Volume 1, pp. 107–110. [Google Scholar]
  41. Amari, S.; Rosenberg, U. Characteristics of cross (bypass) coupling through higher/lower order modes and their applications in elliptic filter design. IEEE Trans. Microw. Theory Tech. 2005, 53, 3135–3141. [Google Scholar] [CrossRef]
  42. Davison, C.; Michie, C.; Hamilton, A.; Tachtatzis, C.; Andonovic, I.; Gilroy, M. Detecting Heat Stress in Dairy Cattle Using Neck-Mounted Activity Collars. Agriculture 2020, 10, 210. [Google Scholar] [CrossRef]
  43. Shu, H.; Wang, W.; Guo, L.; Bindelle, J.J.A. Recent advances on early detection of heat strain in dairy cows using animal-based indicators: A review. Animals 2021, 11, 980. [Google Scholar] [CrossRef]
  44. Jerri, A.J. The Shannon sampling theorem—Its various extensions and applications: A tutorial review. Proc. IEEE 1977, 65, 1565–1596. [Google Scholar] [CrossRef]
  45. Gaidon, A.; Wang, Q.; Cabon, Y.; Vig, E. Virtual worlds as proxy for multi-object tracking analysis. In Proceedings of the IEEE Conference on Computer Vision and Pattern Recognition, Las Vegas, NV, USA, 27–30 June 2016; pp. 4340–4349. [Google Scholar]
Figure 1. (a) Illustration of the camera positions (annotated by the red circles) and (b) the proportion of different scenarios. R, S, RS, SR, and BS represent the posture of reclining, standing, transition from reclining to standing, transition from standing to reclining, and body shaking, respectively. The total episode sizes for reclining, standing, and body shaking are R1 + R2, S1 + S2, and BS1 + BS2 + BS3, respectively.
Agriculture 14 00040 g001
Figure 2. Segmentation procedure and different selection of the region of interest. The red box indicated the ROI of the entire cow, and the green and blue boxes indicated the ROI of the central and rear parts, respectively.
Agriculture 14 00040 g002
Figure 3. The procedure of traditional (blue boxes) and the modified (blue and gold boxes) algorithms for cow respiration rate estimation.
Agriculture 14 00040 g003
Figure 4. The prediction performance of the initial cow RR estimation based on the HS optical flow method. RRest and RRgt represent the respiration rate estimated by the algorithm and manually calculated by observers, respectively.
Agriculture 14 00040 g004
Figure 5. The spectral characteristics of a cow’s motions, including rising (ae), lying down (fj), and body shaking (kn).
Agriculture 14 00040 g005
Figure 6. Comparison between different filters. (a) segmentation filters 1 to 3, and (b) Butterworth and elliptical filters.
Agriculture 14 00040 g006
Figure 7. (a) Estimated RR against the ground truth (GT) values and (b) the Bland–Altman plot.
Agriculture 14 00040 g007
Figure 8. Comparison of prediction performance between the optical flow method based traditional algorithm and the cow respiration rate algorithm in different postures and body motions. (ae) representing cows in reclining posture (R), standing posture (S), reclining to standing (RS), standing to reclining (SR), and body shaking (BS), respectively.
Agriculture 14 00040 g008
Figure 9. Mean absolute relative error (MARE) and the Pearson correlation coefficient of the cow respiration rate estimation as well as the computational times under different frame rates (ac) and video resolutions (df).
Agriculture 14 00040 g009
Table 1. Strategy of segmentation filters.
SchemeVideo DurationSegments DividedSegment DurationSegments Kept
A60 s230 s1
B60 s320 s1
C60 s610 s3
Disclaimer/Publisher’s Note: The statements, opinions and data contained in all publications are solely those of the individual author(s) and contributor(s) and not of MDPI and/or the editor(s). MDPI and/or the editor(s) disclaim responsibility for any injury to people or property resulting from any ideas, methods, instructions or products referred to in the content.

