Article

QTL Mining and Validation of Grain Nutritional Quality Characters in Rice (Oryza sativa L.) Using Two Introgression Line Populations

1
National Key Laboratory of Crop Genetic Improvement, and National Center of Crop Molecular Breeding, Huazhong Agricultural University, Wuhan 430070, China
2
Agriculture Research Station, Nepal Agriculture Research Council, Pakhribas 56809, Nepal
3
College of Life Science, Heilongjiang University, Harbin 150080, China
*
Authors to whom correspondence should be addressed.
Agriculture 2023, 13(9), 1725; https://doi.org/10.3390/agriculture13091725
Submission received: 27 July 2023 / Revised: 29 August 2023 / Accepted: 29 August 2023 / Published: 31 August 2023
(This article belongs to the Special Issue Breeding and Genetic Research of Cereal Grain Quality)

Abstract

:
Nutritional grain quality is mainly influenced by the protein fraction content and grain protein content. Quantitative trait loci (QTL) mining for five traits, about 245 and 284 BC3F3 individual families of two introgression line (IL) populations were derived from Kongyu 131/Cypress (population-I) and Kongyu 131/Vary Tarva Osla (population-II), respectively. A genetic linkage map was developed using 127 simple sequence repeat (SSR) markers in population-I and 119 SSR markers in population-II. In total, 20 and 5 QTLs were detected in population-I and population-II, respectively. About twenty QTLs were mapped in population-I: five QTLs for albumin, seven QTLs for globulin, six QTLs for prolamin, one QTL for glutelin, and one QTL for grain protein content. In total, five QTLs were mapped in population-II: one QTL for albumin and four QTLs for grain protein content. Out of 25 QTLs, 19 QTLs exhibit co-localization with the previously reported QTLs. QTL-like qGPC7.3 was delineated for total protein content. This QTL was derived from population-I and was successfully validated in NILs (near-isogenic lines). The grain protein phenotype showed a significant variation between two NILs. This investigation serves as groundwork for additional cloning of nutritional quality-related genes in rice grains.

1. Introduction

Rice (Oryza sativa L.) is an essential food crop among all cereals, feeding more than 3.5 billion people of the world’s population, who are primarily dependent on the rice crop as their primary source of food. About 90% of the total production and consumption occurs in Asian countries like China and India, and China alone contributes about 55% of the total production and consumption [1]. Rice grain quality is a comprehensive trait and has become a hotspot for current breeding. Rice grain quality constitutes an enormous component, including milling, appearance, eating and cooking, and nutritional quality [2,3,4]. Among all the components, rice nutritional quality attributes like protein contents, lipids, mineral elements, and phytochemicals are the principal elements in determining rice nutritional quality.
Rice grain protein is the major determinant of nutritional quality, and it constitutes the maximum proportion of the endosperm next to starch. Ordinarily, rice grain protein content varies from 5% to 16%. In addition, Indica rice contains a 2–3% higher proportion of GPC than Japonica rice [5,6,7]. The rice protein fraction content roughly accounts for 8% of the total grain weight (dry weight basis) and serves as a prominent substance next to starch. The rice grain accounts for the lowest proportion of protein as compared with the other cereal grains but has the highest level of protein utilization [8]. High-grain protein is an essential element, and it is utilized to improve the nutritional properties of human health among rural and poor family communities, particularly where rice is regarded as a staple food. Consequently, enhancing the protein fraction content has become the core breeding target to improve rice nutritional properties.
Rice protein fractions are classified into albumin, globulin, prolamin, and glutelin in accordance with their solubility differences. Glutelin individually accounts for more than 80% of the total fraction of protein and is localized in the heart of the milled portion, while prolamin, an eventually scattered protein, constitutes less than 5% [9]. Glutelin accounts for a higher proportion of the endosperm and hence, dominantly affects nutritional grain properties, and it is an important regulator of high-lysine content and digestibility [10]. Quantitative variations within glutelin content directly modulate rice grain nutritional quality. Grain protein content is a major concern for modifying rice nutritional grain quality, which collectively influences rice eating and cooking quality [11]. Based on amino acid sequences, glutelin is divided into four subclasses such as GluA, GluB, GluC, and GluD [12]. Ordinarily, gene cloning and characterization of rice protein fraction content are mainly accomplished using rice mutants [13]. A glutelin precursor of about 57 kDa is synthesized in the rough endoplasmic reticulum. For example, a 57H mutant can accumulate a higher magnitude of 57 kDa as pro-glutelin and result in an opaque endosperm trait [12,14]. From 57H mutants, solely gpa3, Osvpe1, and OsRab5a were evidently cloned [14]. Prolamins account for around 34 gene replications and multiple gene families. Prolamins are divided into three subclasses based on their molecular masses: 10 kDa (RP10), 13 kDa (RM1, RM2, RM4, and RM9), and 16 kDa [15]. Collectively, albumins and globulins are synthesized in rice bran and are usually removed during the milling process [16]. Globulins are mainly associated with normal digestion, and genes have been cloned on a limited scale and poorly characterized [17,18]. Albumin is associated with proteins like RA16 and RA17, which were previously recognized as allergic proteins, while at this moment, it is an essential protein for reducing blood sugar and plasma insulin [19,20]. Previous investigations into grain protein content state that high followed by low protein content are associated with reduced and improved eating and cooking qualities, respectively [21,22,23].
Genetic elucidation was initiated with QTL mapping using genetic markers and linkage map construction [4]. Countless efforts have been made in rice grain protein investigation to reveal its genetic basis. Numerous QTLs have been found for grain protein content, which was repeatedly confirmed [24,25,26,27,28,29,30,31,32,33]. Nevertheless, PFCs and GPC are meaningfully susceptible to ecological factors, and most of the completed investigations are based on single ecological/environmental conditions. Hence, characterized QTLs for rice PFCs and GPC are often inconsistent due to the various environmental conditions or used populations. To date, only two QTLs, i.e., qPC1 and qGPC-10, were cloned and functionally characterized under natural conditions, which resulted in an increase in rice grain protein content [4,34]. The QTL qPC1 functionally translates an amino acid transporter like OsAAP6, which can increase grain protein content by synthesizing starch and storage proteins. This gene is responsible for protein synthesis by an inclusive gene expression in rice varieties, concurrently improving amino acid and protein content, which affects the nutritional quality of rice grains [4]. The QTL qGPC-10 decodes an OsGluA2 precursor, and positively regulates grain protein content in rice. OsGluA2 enhances grain protein content by improving rice glutelin content and manipulating the nutritional properties of rice grain quality [34]. The summarized allelic expression of OsAPP6 and OsGluA2 genes are conspicuously localized and are allocated for low Gpc breeding in combination with MAS. In addition, vast genetic resources are required for rice nutrition as well as eating and cooking quality improvement. Normally, high-protein content is desirable for nutritional quality aspects, while high Gpc usually results in a condensed rice grain structure, which is characterized by poor palatability [35,36]. Therefore, genetic explorations for the corresponding nutritional as well as eating and cooking quality in rice grains are the major concerns of the breeding program.
Although enormous efforts were previously made to characterize rice nutritional grain quality, to date, limited successes have been obtained in QTL mapping and functional characterization. In this investigation, we attempted to dissect QTLs associated with rice nutritional grain quality traits (albumin, globulin, prolamin, glutelin, and grain protein content) using two BC3F3 introgression line populations obtained from the crosses of Kongyu 131/Cypress (population-I) and Kongyu 131/Vary Tarva Osla (population-II).

2. Materials and Methods

2.1. Plant Materials and Field Experiments

Two BC3F3 genetic mapping populations were developed from three parents including Kongyu 131 (short and round grains, cold-resistant, high quality, early maturity, and highly stable), Cypress (long and bold grains, semi-dwarf, high grain quality, high yielding, and early maturity), and Vary Tarva Osla (long and wide grains, high white core ratio), respectively. These two BC3F3 populations were provided by Professor Jiang Gonghao, School of Life Science, Heilongjiang University, China. Population-I was derived from a crossing between parent Kongyu 131 × Cypress, followed by a test cross and selfings, while population-II was derived from a crossing between parent Kongyu 131 ×Vary Tarva Osla, followed by a test cross and selfings. Population-I is a long and wide grain type, while population-II is a short and bold grain type. In both populations, parent Kongyu 131 is used as the female, while Cypress and Vary Tarva Osla were used as the male parent. The grain protein fractions (albumin, globulin, prolamin, glutelin) and grain protein content of Kongyu 131 are higher than the Cypress and Vary Tarva Osla, except for the albumin content for both parent (Cypress and Vary Tarva Osla), while the globulin content in Vary Tarva Osla is lower than Kongyu 131. Two BC3F3 populations were planted at Huazhong Agricultural University, in Hubei province, Wuhan, China, in 2018 at an eastern longitude of 113°41′–115°05′ and northern latitude of 29°58′–31°22′. About 96 individual fertile plants were collected for genetic linkage map development and phenotypic characterizations from both populations. Population-I (Kongyu 131/Cypress) and population-II (Kongyu 131/Vary Tarva Osla) were constructed with 245 and 284 individual plants.
Paddy seeds were poured into clean water for about 72 h and then placed into a dark room for pre-sprouting (24 h) at room temperature. Germinated seeds were dispersed on a seed bed on the 25th of May in the year 2018 and approximately 21 days old seedlings were used for transplanting. Each line was planted in three replications, and each row contained 12 individual plants. The plant-to-plant and row-to-row distance was maintained at 16.5 cm and 26.4 cm apart in a randomized block design, respectively. All agronomic practices followed the standardized protocol of the field management department. The chemical fertilizer application was performed with nitrogen @ 48.7 kg/ha, phosphorus @ 58.5 kg/ha, and potassium @ 93.75 kg/ha. Topdressing was performed in two split doses with nitrogen fertilizer @ 86.25 kg/ha during tillering and @ 26.6 kg/ha during the booting stage of rice.

2.2. Quantitative Evaluation of Albumin, Globulin, Prolamin, Glutelin, and Grain Protein Contents

Healthy paddy seeds were individually harvested, threshed, sun-dried, and stored at room temperature for at least 3 months. Approximately 50 g of paddy seeds were de-hulled with a TR 200 Sheller (Kett, Tokyo, Japan), and the de-hulled paddy seeds were processed with a flour mill at Pearle’s Mill (Kett, Tokyo, Japan) using equipment known as the CT410 (Cyclotec) mill (FOSS, Hillerod, Denmark). The milled rice grains were used to make rice flour, followed by sieving with 80-mesh and storing for a short duration at −20 °C and for a long duration at −80 °C [12].
Protein fractions (albumin, globulin, prolamin, glutelin) were examined using the method described in [37], and grain protein content was measured using the near-infrared spectrum instrument system (NIRS) as formerly reported by [12]. For albumin content extraction, 0.1 g rice samples were weighed and transferred to centrifuge tubes. Then, 1 mL of 10 mM Tris-HCl buffer (pH 7.5) was added. For globulin content, 1 mL of 1 M NaCl solution was added to 0.1 g of a rice flour sample. For prolamin content, 0.1 g of rice flour was weighed, and 1 mL of 60% n-propanol-1 mM EDTA-2Na stock solution was added. For glutelin content, 0.1 g of rice flour was added to 1 mL of 0.05 M NaOH stock solution. The solution was thoroughly mixed at room temperature for at least 2 h, centrifuged at 12,000 rpm for 15 min at 4 °C, and the extract was isolated in a new tube. All four protein fractions (albumin, globulin, prolamin, glutelin) were detected from the same sample. This protocol was sequentially repeated about three times, and the pooled extracts were stored at −20 °C until the next step. The protein content in the fractions was monitored using a bovine albumin serum as the standard solution and a binding dye known as G-250 Coomassie Brilliant Blue, as described in [38]. Quantitative analyses were performed using an instrument called Infinite M200 (Tecan Group, Mennedorf, Switzerland) [4,12]. Quantification of albumin, globulin, prolamin, glutelin, and grain protein content was performed in three replications, and the mean values were used for the final estimation of protein fractions and grain protein content.

2.3. QTL Fingerprinting, Genetic Linkage Map Assembly, and Validation

The genotyping of two BC3F3 populations was evaluated by extracting high-quality DNA from rice leaves including their designated parents. The CTAB method was used for DNA extraction, which is explained in [39]. Briefly, around 834 SSR markers were applied to three parents to find 127 and 119 SSR markers. The fragment size of the SSR marker was 100–300 bp, and the normal GC content ratio varied from 40 to 60%. The amplicon size was measured using the available sequence information of Nipponbare reference genome (http://redb.ncpgr.cn), and additionally with the evaluation of PCR products using gel electrophoresis. About 127 single sequence repeat (SSR) markers were applied in population-I and about 119 SSR markers were applied in population-II. These markers were utilized in two BC3F3 populations, including their parents, to distinguish the polymorphism between parents and to construct a genetic linkage map (the markers are provided in Supplementary Table S1). Genetic linkage map construction and genetic effect analysis were performed using the QTL Cartographer 2.5 [40] and Map-Maker/QTL1.1 [41]. The Kosambi mapping method was used to determine recombination distances [42], and composite interval mapping was used to capture the additive effects of QTLs. The logarithm of odds (LOD) score was kept above 2.5 to discriminate the major effect of QTL. A correlation analysis of two BC3F3 populations was computed using the R program version R4.2.3. A descriptive analysis of two BC3F3 populations for all five traits was completed using Microsoft Office Excel 2010. An LSD test between two consecutive populations was performed using SPSS22 software. Student’s t-test was performed to compare individual means between the two BC3F3 populations.

3. Results

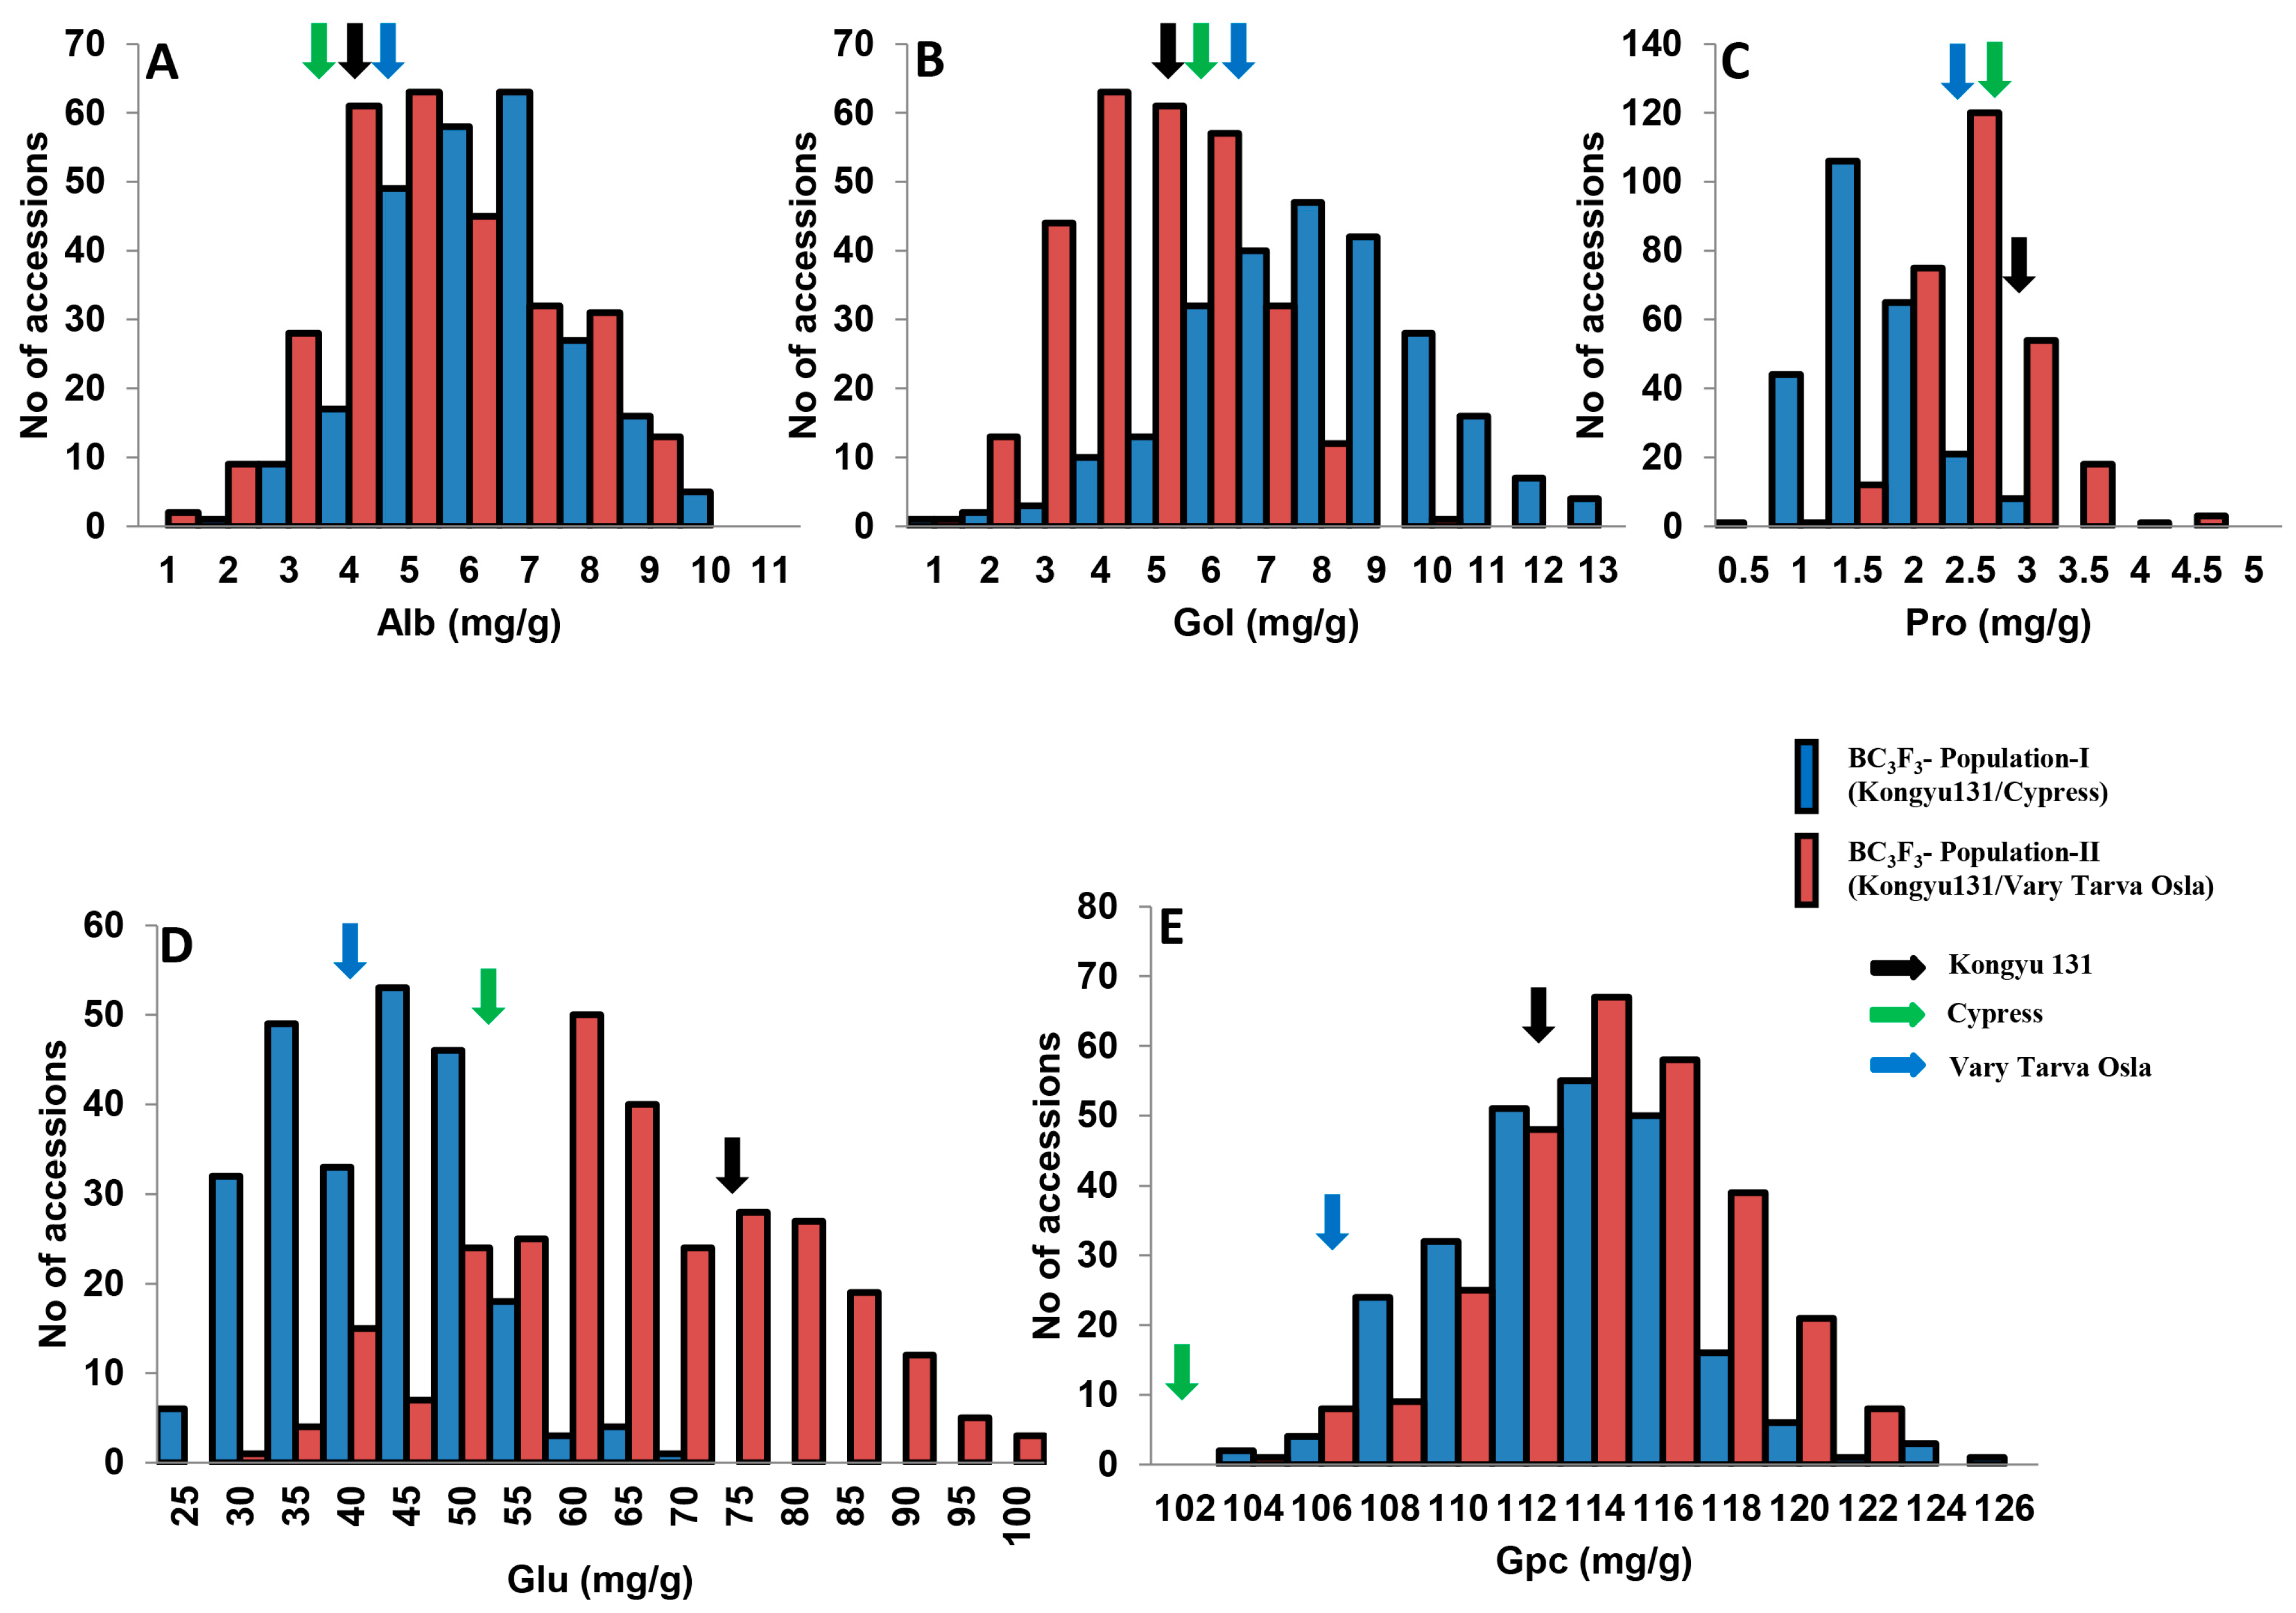
3.1. Phenotypic Variations in Nutritional Quality Traits in the Two ILs Populations

The protein fraction content (albumin, globulin, prolamin, glutelin) and grain protein content performance of the involved parents and progeny population were evaluated. Phenotypic values for the BC3F3 population including their recipient and donor parent for population-I (Kongyu 131/Cypress) and population-II (Kongyu 131/Vary Tarva Osla) are presented in Figure 1. The mean value of parent Kongyu 131 is higher than those parents of Cypress and Vary Tarva Osla for the five traits, except for the globulin content in population-I and the albumin and globulin contents in population-II. For the Kongyu 131 parent, the mean values of albumin, globulin, prolamin, glutelin, and grain protein content are 4.2 mg/g, 5.1 mg/g, 3 mg/g, 75.8 mg/g, and 113.4 mg/g, respectively, while for Cypress, the mean values are 4.1 mg/g, 6.5 mg/g, 2.7 mg/g, 50.5 mg/g, and 98.9 mg/g respectively, and for Vary Tarva Osla, the mean values are 4.3 mg/g, 6.9 mg/g, 2.5 mg/g, 43.2 mg/g, and 107.4 mg/g, respectively. Phenotypic estimation of albumin, globulin, prolamin, glutelin, and grain protein content was comprehensively explained in two BC3F3 populations. A wide range of transgressive segregation and phenotypic variations was verified in both IL populations (Figure 1 and Table 1). The average mean enactment of albumin, globulin, prolamin, glutelin, and grain protein content in population-I (Kongyu 131/Cypress) was as 6.31 mg/g, 7.91 mg/g, 1.68 mg/g, 42.08 mg/g, and 113.30 mg/g, respectively (Figure 1 and Table 1), while in population-II (Kongyu 131/Vary Tarva Osla), the phenotypic mean accounts for 5.33 mg/g, 4.86 mg/g, 2.52 mg/g, 65.79 mg/g, and 114.50 mg/g, respectively (Figure 1 and Table 1). The frequency distribution analysis for all five traits identifies a normal distribution pattern throughout both populations, suggesting that these nutritional characters were quantitatively inherited, dominantly governed by polygenes, and, hence, anticipated for QTL mining.

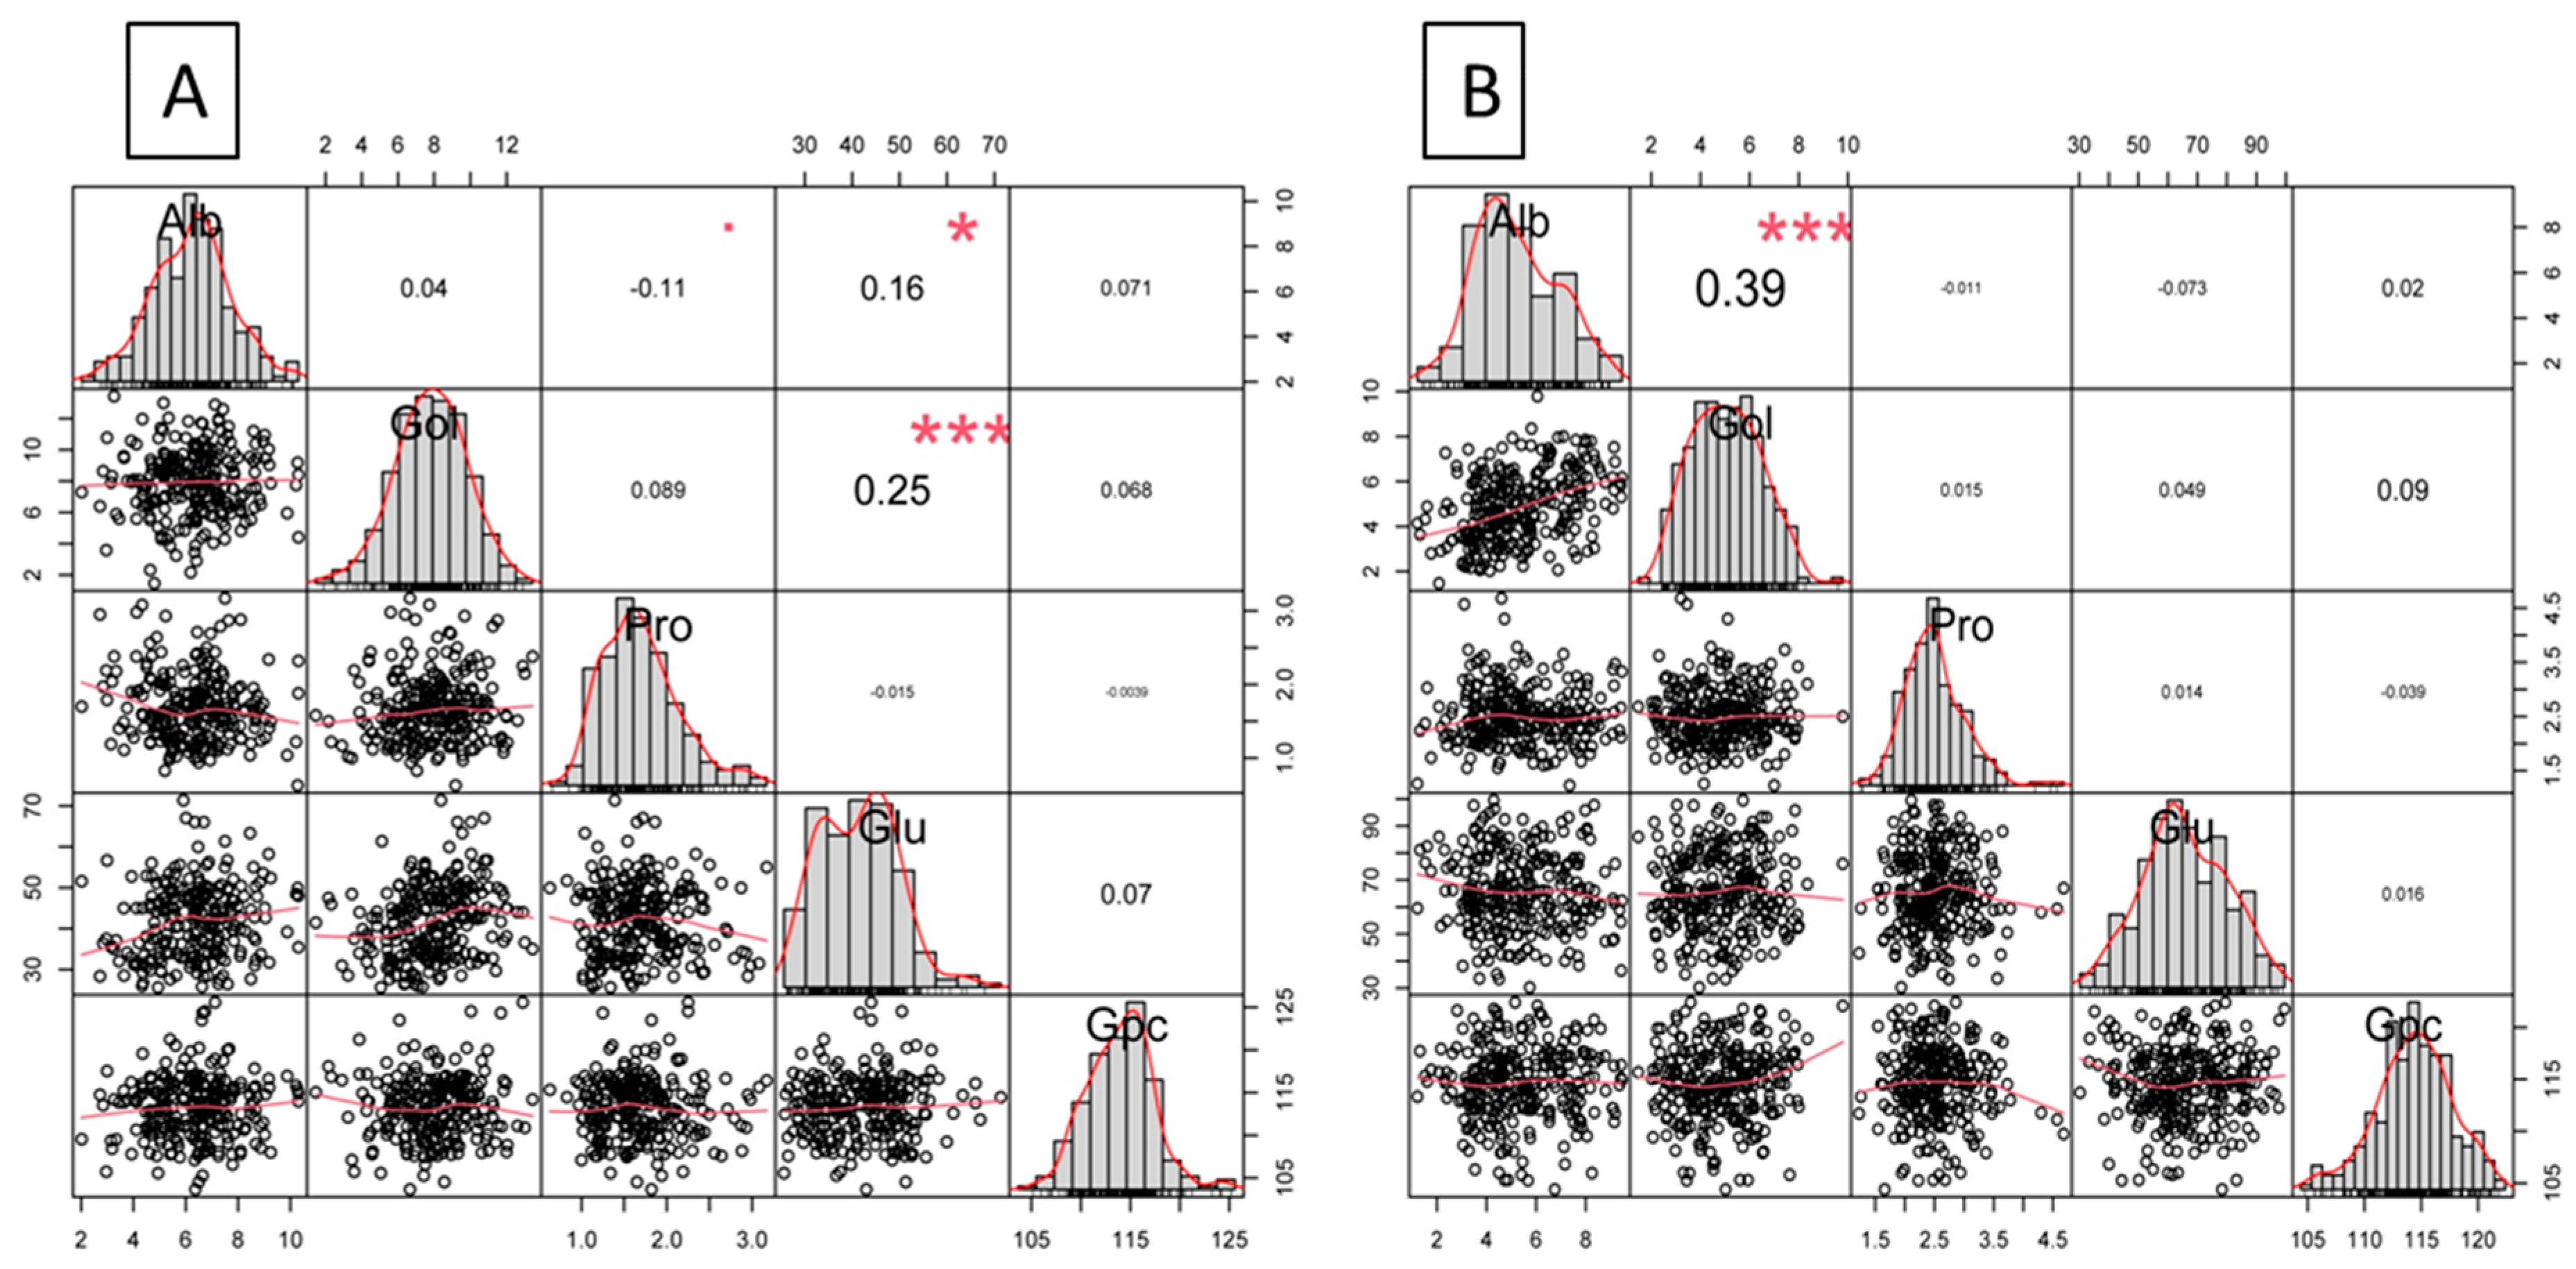
3.2. Correlation Delineation

The correlation analysis for the albumin, globulin, prolamin, glutelin, and grain protein content of the two BC3F3 populations demonstrated significant positive and negative correlations among all five characters. In population-I (Kongyu 131/Cypress), the albumin, globulin, and grain protein contents have a significant and positive correlation, while prolamin and glutelin exhibit a negative correlation. The maximum correlation was observed between globulin and glutelin content in population-I. In population-II (Kongyu 131/Vary Tarva Osla), the albumin and globulin content have a significant and positive correlation, while a significant and negative correlation was determined between prolamin, glutelin, and grain protein content. The maximum correlation was determined between albumin and globulin in population-II. Significant evidence of the phenotypic valuation is described below (Figure 2). The overall correlation summary for the two populations demonstrates that prolamin, glutelin, and grain proteins were significantly negatively correlated.

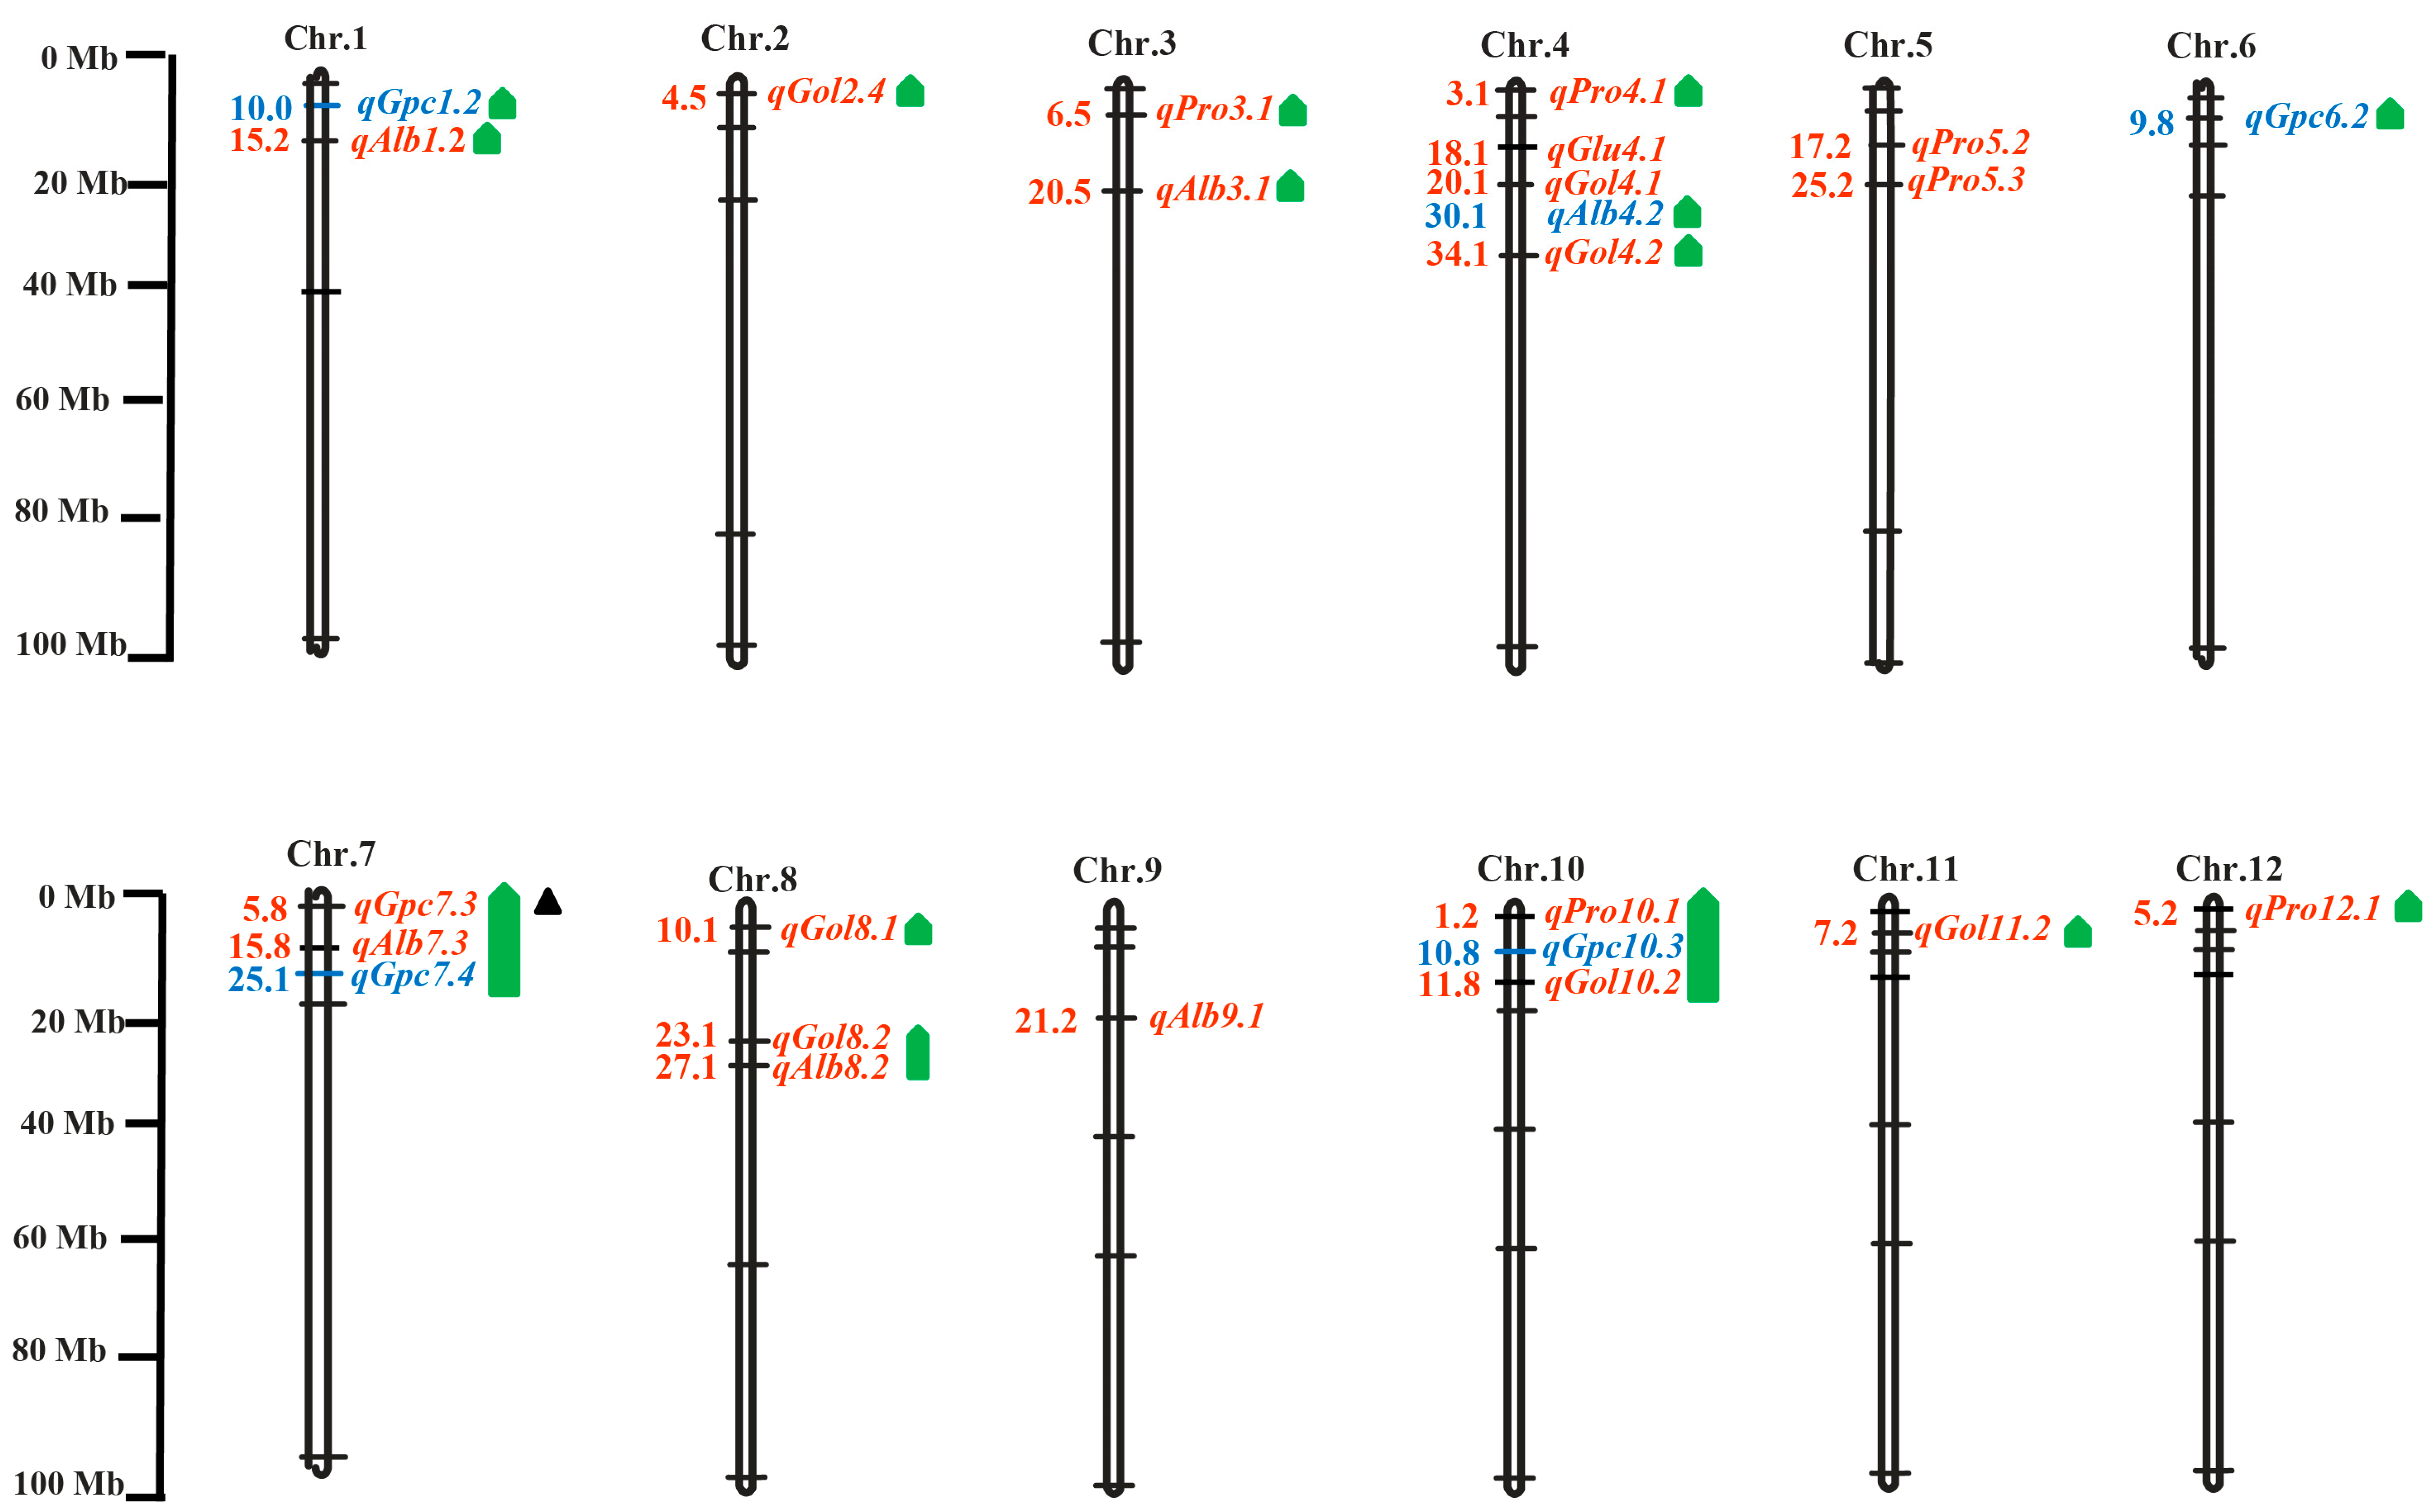
3.3. QTL Fingerprinting in Albumin, Globulin, Prolamin, Glutelin, and Grain Protein Content

A genetic linkage map was developed using 246 SSR markers for the two BC3F3 populations. QTL mapping for albumin, globulin, prolamin, glutelin, and grain protein content was performed in two BC3F3 populations. A total of 25 QTLs for five characters were recognized across all the chromosomes in the two populations, and genetic variation contributed by individual QTLs ranged from 1.6% to 61.85% (Figure 3 and Table 2). Amongst that, 20 QTLs were described in population-I (Kongyu 131/Cypress), while 5 QTLs were described in population-II (Kongyu 131/Vary Tarva Osla).
Twenty QTLs were identified in population-I for all five characters, which are scattered on the entire chromosomes of rice except on chromosome 6. The genetic variations described by individual QTL varied from 1.6% to 61.85%.
Six QTLs for albumin content were identified in both populations. qAlb1.2 was recognized between RM140 and C1.23.3 on chromosome 1, describing a phenotypic variation of 48.53%. qAlb3.1 was identified between T3-4 and C3.26.6 on chromosome 3, demonstrating a phenotypic variation of 42.58%. qAlb4.2 was detected between RM470 and RM567 on chromosome 4, explaining a phenotypic variation of 7.23%. qAlb7.3 was determined between RM501 and T7-3 on chromosome 7, contributing a phenotypic variation of 22.09%. qAlb8.2 was recognized between Z8.25.3 and RM264 on chromosome 8, describing a phenotypic variation of 1.6%. qAlb9.1 was identified between RM160 and Z9-22.4 on chromosome 9, explaining a phenotypic variation of 40.16%.
Seven QTLs for globulin content were recognized in population-I. qGol2.4 was identified between T2-1 and T2-2 on chromosome 2, describing a phenotypic variation of 2.67%. qGol4.1 was detected between Z4-17.7 and T4-6 on chromosome 4, explaining a phenotypic variation of 33.57%. qGol4.2 was localized between W4.30.6 and Z435.1 on chromosome 4, demonstrating a phenotypic variation of 13.68%. qGol8.1 was located between RM404 and RM515 on chromosome 8, contributing a phenotypic variation of 33.26%. qGol8.2 was detected between RM556 and Z8-25.3 on chromosome 8, contributing a phenotypic variation of 46.73%. qGol10.2 was dissected between A10.2.84 and Z10-16.6 on chromosome 10, contributing a phenotypic variation of 15.5%. qGol11.2 was identified between W11-6.6 and RM536 on chromosome 11, describing a phenotypic variation of 55.78%.
Six QTLs for prolamin content were dissected in population-I. qPro3.1 was dissected between T3-1 and RM218 on chromosome 3, demonstrating a phenotypic variation of 6.9%. qPro4.1 was localized between RM518 and Z4-4.0 on chromosome 4, describing a phenotypic variation of 34.28%. qPro5.2 was identified between RM509 and RM164 on chromosome 5, contributing a phenotypic variation of 51.7%. qPro5.3 was recognized between RM-164 and RM480 on chromosome 5, describing a phenotypic variation of 47.17%. qPro10.1 was mapped between W10-0.1 and A10.2.84 on chromosome 10, contributing a phenotypic variation of 61.85%. qPro12.1 was delimited between Z12-0.94 and Z12-9.4 on chromosome 12, describing a phenotypic variation of 45.53%. One QTL for glutelin content was mapped in population-I including qGlu4.1, which was recognized between Z4-17.7 and Z4-26.5 on chromosome 4, describing a phenotypic variation of 7.52%.
Five QTLs for grain protein content were mapped in both populations. qGpc1.2 was delineated between RM292 and T1-3 on chromosome 1, describing a phenotypic variation of 4.1%. qGpc6.2 was dissected between T6-7 and T6-4 on chromosome 6, contributing a phenotypic variation of 6.27%. qGpc7.3 was mapped between RM481 and RM501 on chromosome 7, explaining a phenotypic variation of 3.14%. qTpc7.4 was delimited between T7-1 and T7-3 on chromosome 7, demonstrating a phenotypic variation of 23.63%. qGpc10.3 was recognized between RM239 and D10-7F on chromosome 10, contributing a phenotypic variation of 4.47% (Figure 3 and Table 2).

3.4. Co-Localization of Linked Positions with Previously Reported QTLs/Genes in Multiple Nutritional Quality Traits

QTL mapping of albumin, globulin, prolamin, glutelin, and grain protein content was successfully used in population-I (Kongyu 131/Cypress) and population-II (Kongyu 131/Vary Tarva Osla). About 25 QTLs were originally identified in all five traits, out of that, 19 QTLs unveil pleiotropic connotation with the previously described QTLs/genes (Figure 3 and Table 2). The QTL co-localization was determined using the assonant/distinguished traits and is present inside the corresponding regions. For albumin content, five QTLs qAlb1.2, qAlb3.1, qAlb7.3, qAlb8.2, and qAlb9.1 were derived from population-I and one QTL qAlb4.2 was derived from population-II. All QTLs show co-localization with formerly delimited QTLs like qPR1, qALB-1, qPC-1a, qPC-1b, Cpb1, Cph1, qPC3, qPC3-1, qPC7, qPC7-1, qPC7-2, qPC-7, qAAC7.3, qPC-8b, qAAC8.2, qPC4, and qRPC-4 except for QTL qAlb9.1. For globulin content, seven QTLs qGol2.4, qGol4.1, qGol4.2, qGol8.1, qGol8.2, qGol10.2, and qGol11.2 were derived from population-I, which shows a pleiotropic association with previously reported QTLs qPC-2, qGLB2.1, qSGpc2.1, Cph2, qPC4, qRPC-4, qPC8, qPC-8b, qAAC8.1, qAAC8.2, qPC10, qPC10-2, qPC10-3, qPC10.1, except for QTLs qGol4.1 and qGol11.2, respectively. For prolamin content, six QTLs qPro3.1, qPro4.1, qPro5.2, qPro5.3, qPro10.1, and qPro12.1 were identified from population-I and were co-localized with formerly identified QTLs qPC3, qPLA3, qPC-3.1, qPC-3.2, qPC-3.3, qAAC3.1, qAAC3.2, qPC-4, Cpb4, Cph4, qPC10-1, qPC-10, qSGpc12.1, and qPC-12, except for QTL qPro5.2 and qPro5.3, respectively. For glutelin content, one QTL qGlu4.1 was identified from population-I, which shows no co-localization with previously reported QTLs. For grain protein content, one QTL qGpc7.3 was derived from population-I, while four QTLs qGpc1.2, qGpc6.2, qGpc7.4, and qGpc10.3 were derived from population-II. All these QTLs shows co-localization with previously reported QTLs qPC7.1, qPC7, qPC-7, qRPC-7, qAAC7.1, qAAC7.2, qSGpc1.3, qPC-1a, qPC-1b, qALB-1, Cpb1, Cph1, qPC-6, qPC1, qPC10, and qPC10.1, respectively (Figure 3 and Table 2). QTL co-localizations for all five traits are in accordance with [12,17,24,26,28,30,43,45,46,47,48,49,50,51,52] for both populations and are also presented in (Table 2).

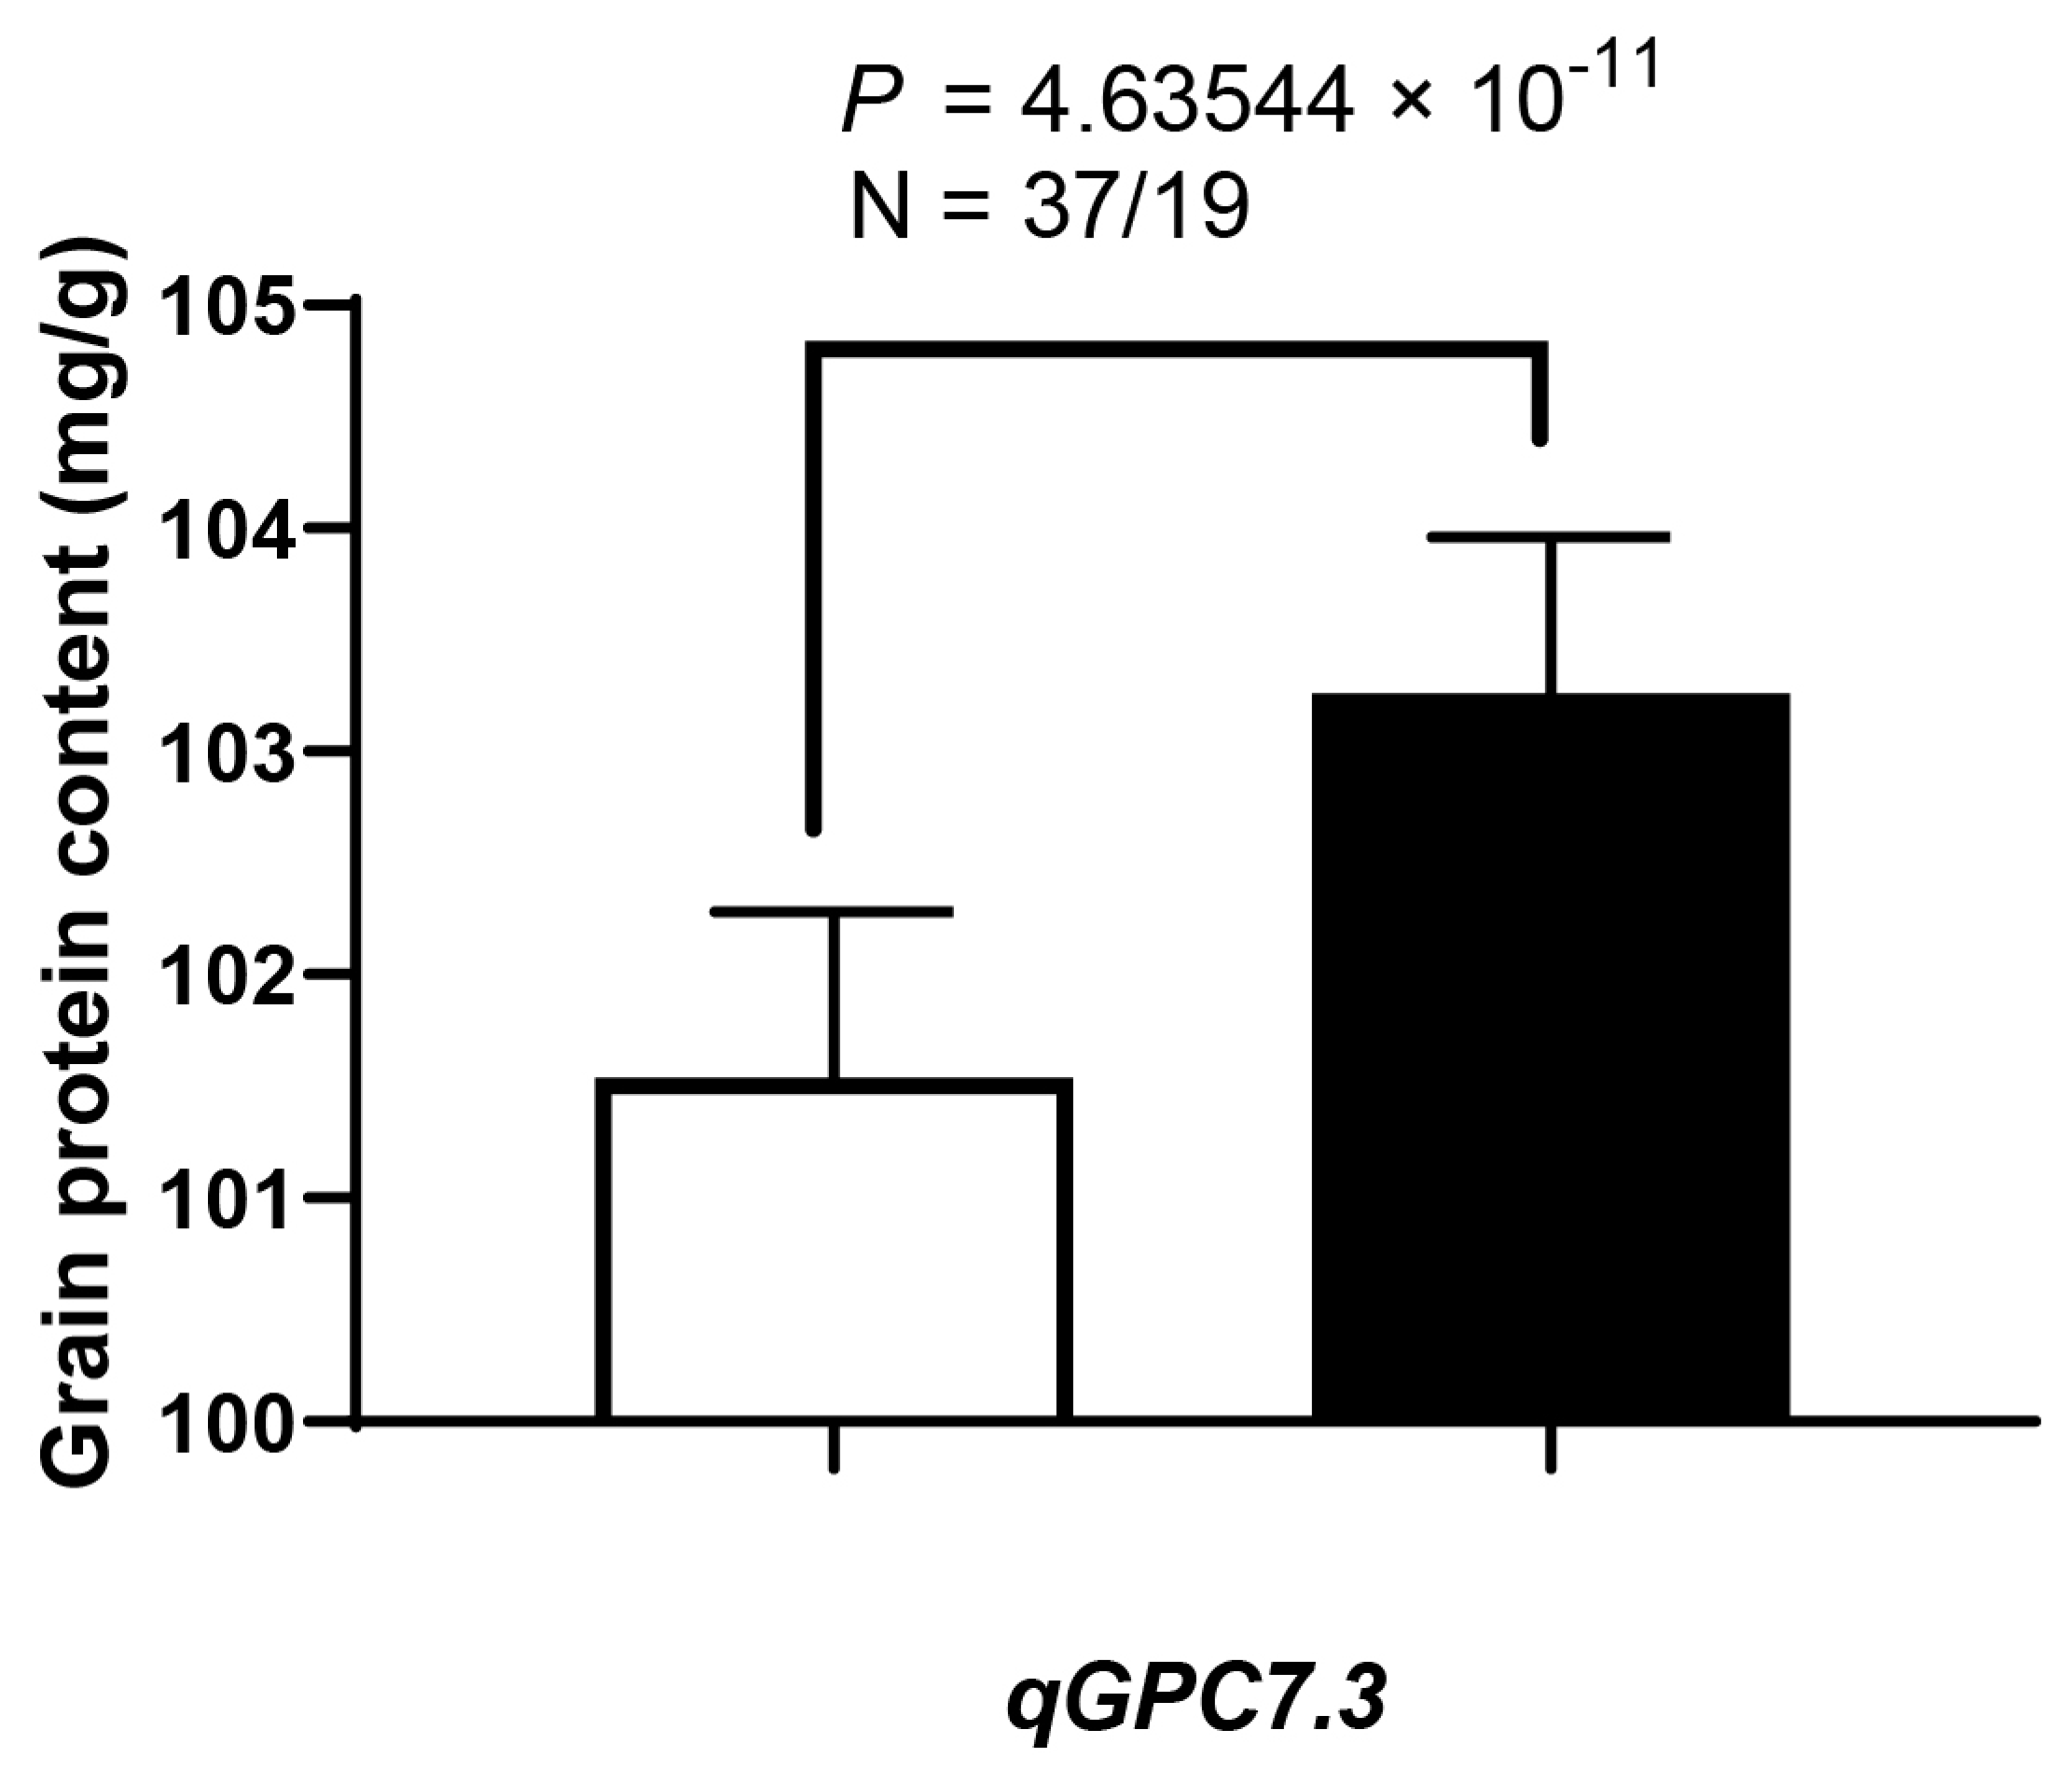
3.5. QTL Validation (qGpc7.3) and Co-Localization with Previously Reported QTLs

There was no particular gene reported on chromosome 7 that affected rice grain protein content. Grain protein predominantly influences eating and cooking, followed by nutritional rice quality. Hence, QTL qGpc7.3 was used for genetic validation. QTL validation was conducted with randomly segregating a population of BC3F4 generation, which was derived from a heterozygous line of BC3F3 generation. The derived population was genotyped with two flanking molecular markers, and phenotypic differences among the corresponding genotypes were compared. As presented in Figure 4 and Table 3, qGpc7.3 was validated between two near isogeneic lines (NIL). In the NIL population, qGpc7.3, an allele from the Cypress genotype increased grain protein content by a mean value of 1.72 mg/g and a percent change value of 1.69%, respectively (Figure 4 and Table 3). This QTL also exhibits co-localization with previously identified QTLs qPC7.1, qPC7, qPC-7, qRPC-7, qPC7, qAAC7.1, qAAC7.2, and qAAC7.1 [26,28,48,50,52]. These results indicate that this locus has a significant effect on the grain protein content and the potential to increase grain protein in rice.

4. Discussion

4.1. Phenotypic Variations in Nutritional Quality Traits

The genetic advantages of utilizing an introgression line population in rice lead to an emergence of transgressive segregants in the elite genetic background, which is received either due to the de novo raised genetic variation or wild allelic introgression. In the current study, all nutritional quality traits exhibit transgressive segregants in both BC3F3 populations. An investigation of nutritional grain quality traits with transgressive segregants was previously reported in rice [12,24,26,43,44,47,48,49,52,53]. Kongyu 131 is a short grain type and widely adopted Japonica rice cultivar in Heilongjiang province, China [54]. Many studies on inter-specific crosses were previously reported in Indica and Japonica rice species [55,56]. In this examination, PFC constituent and grain protein content exhibit a normal distribution pattern in both BC3F3 populations and seems to be extensively influenced by environmental factors (Figure 1). Protein fractions are quantitatively inherited and comprehensively influenced by environmental factors [24,57]. A wider variation in albumin, globulin, prolamin, glutelin, and grain protein content was demonstrated by both BC3F3 populations, which suggests that there would be a complex genetic mechanism. A significant number of variations in PFC constituents and grain protein contents were noticed in this study, which is in accordance with earlier reports described by [12,34]. Amid four PFC constituents, glutelin establishes a large quantity and constitutes the maximum degree of essential amino acids that are fractionally acquired by human beings. Quantitative improvement of PFC constituents may lead to the enhancement of the grain protein content and establish a tightened interaction between PFC and GPC in rice [58]. Remarkably, in this investigation, a significant positive and negative correlation was delimited amongst all PFC constituents and GPC in both populations, which is in correspondence with previous work described by [12,59]. These results indicate that PFC constituents infrequently support mutual genetic regulation mechanisms. They may have either dependent or independent genetic regulation systems. Advanced gene cloning and meaningful genetic explanations of validated QTLs will direct the underlying genetic mechanism of rice grain protein.

4.2. QTL Localization and Pleiotropic Associations of Alb, Gol, Pro, Glu, and Gpc Content

Rice nutritional quality is dominantly affected by the content of albumin, globulin, prolamin, glutelin, and grain protein. Albumin is regarded as one of the major components of rice storage proteins, and it is widely disseminated over the rice endosperm. Previously, it was regarded as an allergenic protein that alters the nutritional quality of rice [17]. In addition, the current study attempted to validate that albumin protein is an imperative element that diminishes diabetes (blood sugar or glucose level) and plasma insulin in humans [60]. To date, a limited number of QTL/genes were mapped for albumin content, such as qALB-1, qALB-2, and qAlb4, which were extensively localized on chromosome numbers 1, 2, and 4 [12,17]. It was previously suggested that the Wx gene may regulate albumin content, but the Wx gene has hastened grain protein content in rice [12]. Globulin protein is normally saturated in rice bran and removed during the milling process. However, globulin is simultaneously expressed with glutelin in a segment of protein body type II (PB-II), which performs a function of easy digestibility for rice grain [61]. Therefore, mining of QTLs/genes connected with globulin may contribute to rice nutritional quality improvement. It has been widely described that globulin and glutelin are jointly regulating rice nutritional qualities, so identifying the effect of QTLs/genes that are linked with globulin and glutelin would be useful for upcoming nutritional rice enhancement [37]. Inadequate numbers of the QTLs were detected in rice globulin protein and were disseminated on chromosomes 1, 2, and 5 [17]. The prolamin protein content was about 20–30% of PFC, and a high quantity of prolamin is thought to worsen the nutritional quality of rice; therefore, low prolamin content potentially enhances the required nutritional quality [53]. QTL mining of prolamin originated decades earlier, but an insufficient quantity of the QTLs was revealed on chromosomes 1, 3, 9, and 10 [17,62]. Glutelin represents the maximum proportion of PFC, which functionally influences eating and cooking quality, nutritional quality, and palatability and contributes the utmost nutritional importance as compared with other cereals [15,63]. A limited quantity of QTLs/genes associated with the glutelin content was previously revealed on chromosomes 2, 10, 11, and 12 [17]. To date, many effective QTLs associated with total protein content were verified, but only quantifiable QTLs were effectively cloned and functionally characterized. Among those, OsGluA2 was characterized under a natural population that improves rice total protein content [34]. Therefore, characterizing innovative QTLs/genes for glutelin content will improve rice grain palatability, eating and cooking quality, and nutritional superiority. The grain protein content (Gpc) is the hub of nutritional quality improvement, and countless efforts have been previously made to discriminate genetic mechanisms underlying grain protein content. GPC is a major complex character, and it is a validated component of the rice grain that determines eating and cooking quality, as well as the nutritional superiority of rice. Many QTLs have been reported in rice grain protein, which mainly influence grain protein content, but only notable QTLs were finally cloned [32]. Notwithstanding, grain protein content is extremely sensitive to ecological factors, especially, the application of nitrogen fertilizers during the dough stage of rice. Currently, QTL mapping of rice grain protein with broad genetic base materials is naturally variable; hence, a limited quantity of QTLs was detected. However, descriptive genetic variation in grain protein content is widely known. It may be associated with the characterization and cloning of multifarious linked QTLs/genes [34]. Enormous QTLs linked with grain protein content were previously identified and are widely distributed across rice chromosomes [11]. But only two QTLs qPC1 and qPC10 were functionally investigated on chromosomes 1 and 10, which positively regulate rice grain protein content [4]. In this study, a total number of 25 QTLs were identified for albumin, globulin, prolamin, glutelin, and grain protein content, which are widely dispersed over all chromosomes of rice in both populations (Figure 2 and Table 3). Out of twenty-five QTLs, six QTLs for albumin content were distributed on chromosomes 1, 3, 4, 7, 8, and 9; seven QTLs for globulin content were disseminated on chromosomes 2, 4, 8, 10, and 11; six QTLs for prolamin content were localized on chromosomes 3, 4, 5, 10, and 12; one QTL for glutelin content was localized on chromosome 4; and five QTLs for grain protein content were widely scattered on chromosomes 1, 4, 6, 7, and 10. The identified QTLs in both populations for albumin, globulin, prolamin, glutelin, and grain protein content seem to be extensively demonstrating co-localization with previously reported QTLs, except for the QTLs qAlb9.1, qGol4.1, qGol11.2, qPro5.2, and qPro5.3, which tend to be newly identified QTLs (Table 3) [12,17,24,26,28,30,43,44,45,46,47,48,49,50,51,52]. Additionally, qGpc7.3 had an immense effect on rice grain protein content. This investigation provides major resources for QTLs associated with albumin, globulin, prolamin, glutelin, and total protein content that can facilitate nutritional quality improvement in rice. Conclusively, these characteristics are functionally associated with eating and cooking superiority, palatability, digestibility, and human health nutrition, which is the existing requirement of rice nutritional breeding.

5. Conclusions

The production of highly nutritious rice has become a major demand of modern growing populations. Enhanced nutritive rice grain will be obtained by improving albumin, globulin, prolamin, glutelin, and protein content. This investigation validates that Kongyu 131, Cypress, and Vary Tarva Osla could function as impending resources for major/minor alleles to increase protein fractions and grain protein content in rice. These results demonstrate that the parents have potential alleles that can translate protein fractions and grain protein content at various chromosomal locations, and population progenies have higher contents constituting advantageous alleles introduced from desirable parents. QTL mapping of an introgression line and validation of QTL qGpc7.3 will enhance grain protein content in rice. Additionally, this investigation also provides a broad range of protein fractions as well as protein content. The near isogenic lines (NIL) can be further explored in upcoming breeding strategies as a reservoir of promising genetic resources for improving protein fractions and protein content in rice, especially in China, where rice is a staple food crop and fulfill primary dietary intake. Moreover, these outcomes imply that favorable allele pyramiding with an inter-specific cross is an effective strategy to improve highly nutritive rice grain via enhancing protein fractions and protein content. The QTLs outlined in this investigation for protein fractions and total protein content would be worthwhile for evolving high nutritive rice crops.

Supplementary Materials

The following supporting information can be downloaded at: https://www.mdpi.com/article/10.3390/agriculture13091725/s1, Table S1: Enlisted markers and designed primer sequences utilized in the QTL mapping of population I (Kongyu 131/Cypress); Table S2: Enlisted markers and designed primer sequences utilized in the QTL mapping of population II (Kongyu 131/Vary Tarva Osla).

Author Contributions

M.A. and Y.H. designed the experiment. M.A., G.J., X.T., H.Z. and Y.Z. conducted the experiment and collected phenotypic data. M.A. and G.L. analyzed the data. M.A., G.L., A.H., A.H., P.B. and Y.H. supported the graphical representation. Y.H. and H.Y. supervised the entire investigation. M.A. wrote the manuscript. All authors have read and agreed to the published version of the manuscript.

Funding

This work was supported by grants from the National Natural Science Foundation of China (U21A20211), the Ministry of Science and Technology (2021YFF1000200, 2022YFD1200100), AgroST Project (NK20220501), and the China Agriculture Research System (CARS-01-01).

Institutional Review Board Statement

Not applicable.

Data Availability Statement

The data matrixes produced under the current investigation are accessible from the corresponding author upon justifiable request.

Acknowledgments

The authors extend their appreciation to the support from the National Key Laboratory of Crop Genetic Improvement, Huazhong Agricultural University.

Conflicts of Interest

The authors declare no conflict of interest.

References

  1. Fukagawa, N.K.; Ziska, L.H. Rice: Importance for global nutrition. J. Nutr. Sci. Vitaminol. 2019, 65, S2–S3. [Google Scholar] [CrossRef] [PubMed]
  2. Butardo, V.M.; Sreenivasulu, N.; Juliano, B.O. Improving rice grain quality: State-of-the-art and future prospects. In Rice Grain Quality: Methods and Protocols; Springer: Berlin/Heidelberg, Germany, 2019; pp. 19–55. [Google Scholar]
  3. Birla, D.S.; Malik, K.; Sainger, M.; Chaudhary, D.; Jaiwal, R.; Jaiwal, P.K. Nutrition. Progress and challenges in improving the nutritional quality of rice (Oryza sativa L.). Crit. Rev. Food Sci. Nutr. 2017, 57, 2455–2481. [Google Scholar] [CrossRef]
  4. Peng, B.; Kong, H.; Li, Y.; Wang, L.; Zhong, M.; Sun, L.; Gao, G.; Zhang, Q.; Luo, L.; Wang, G. OsAAP6 functions as an important regulator of grain protein content and nutritional quality in rice. Nat. Commun. 2014, 5, 4847. [Google Scholar] [CrossRef]
  5. Lin, R.; Luo, Y.; Liu, D.; Huang, C. Determination and analysis on principal qualitative characters of rice germplasm. In Rice Germplasm Resources in China; Agricultural Science and Technology Publisher of China: Beijing, China, 1993; pp. 83–93. [Google Scholar]
  6. Zhou, L.; Liu, Q.; Zhang, C.; Xu, Y.; Tang, S.; Gu, M. Variation and distribution of seed storage protein content and composition among different rice varieties. Acta Agron. Sin. 2009, 35, 884–891. [Google Scholar] [CrossRef]
  7. Chen, P.; Lou, G.; Wang, Y.; Chen, J.; Chen, W.; Fan, Z.; Liu, Q.; Sun, B.; Mao, X.; Yu, H.; et al. The genetic basis of grain protein content in rice by genome-wide association analysis. Mol. Breed. 2022, 43, 1. [Google Scholar] [CrossRef] [PubMed]
  8. Juliano, B.O. Structure, chemistry, and function of the rice grain and its fractions. Cereal Foods World 1992, 37, 772–779. [Google Scholar]
  9. Jayaprakash, G.; Bains, A.; Chawla, P.; Fogarasi, M.; Fogarasi, S. A Narrative Review on Rice Proteins: Current Scenario and Food Industrial Application. Polymers 2022, 14, 3003. [Google Scholar] [CrossRef]
  10. He, W.; Wang, L.; Lin, Q.; Yu, F. Rice seed storage proteins: Biosynthetic pathways and the effects of environmental factors. J. Integr. Plant Biol. 2021, 63, 1999–2019. [Google Scholar] [CrossRef]
  11. Long, X.; Guan, C.; Wang, L.; Jia, L.; Fu, X.; Lin, Q.; Huang, Z.; Liu, C. Rice Storage Proteins: Focus on Composition, Distribution, Genetic Improvement and Effects on Rice Quality. Rice Sci. 2023, 30, 207–221. [Google Scholar]
  12. Chen, P.; Shen, Z.; Ming, L.; Li, Y.; Dan, W.; Lou, G.; Peng, B.; Wu, B.; Li, Y.; Zhao, D. Genetic basis of variation in rice seed storage protein (Albumin, Globulin, Prolamin, and Glutelin) content revealed by genome-wide association analysis. Front. Plant Sci. 2018, 9, 612. [Google Scholar] [CrossRef]
  13. Ren, Y.; Wang, Y.; Liu, F.; Zhou, K.; Ding, Y.; Zhou, F.; Wang, Y.; Liu, K.; Gan, L.; Ma, W. GLUTELIN PRECURSOR ACCUMULATION3 encodes a regulator of post-Golgi vesicular traffic essential for vacuolar protein sorting in rice endosperm. Plant Cell 2014, 26, 410–425. [Google Scholar] [CrossRef] [PubMed]
  14. Wang, Y.; Zhu, S.; Liu, S.; Jiang, L.; Chen, L.; Ren, Y.; Han, X.; Liu, F.; Ji, S.; Liu, X. The vacuolar processing enzyme OsVPE1 is required for efficient glutelin processing in rice. Plant J. 2009, 58, 606–617. [Google Scholar] [CrossRef] [PubMed]
  15. Kawakatsu, T.; Yamamoto, M.P.; Hirose, S.; Yano, M.; Takaiwa, F. Characterization of a new rice glutelin gene GluD-1 expressed in the starchy endosperm. J. Exp. Bot. 2008, 59, 4233–4245. [Google Scholar] [CrossRef] [PubMed]
  16. Shewry, P.R. Improving the protein content and composition of cereal grain. J. Cereal Sci. 2007, 46, 239–250. [Google Scholar] [CrossRef]
  17. Zhang, W.; Bi, J.; Chen, L.; Zheng, L.; Ji, S.; Xia, Y.; Xie, K.; Zhao, Z.; Wang, Y.; Liu, L. QTL mapping for crude protein and protein fraction contents in rice (Oryza sativa L.). J. Cereal Sci. 2008, 48, 539–547. [Google Scholar] [CrossRef]
  18. Bhullar, N.K.; Gruissem, W. Nutritional enhancement of rice for human health: The contribution of biotechnology. Biotechnol. Adv. 2013, 31, 50–57. [Google Scholar] [CrossRef]
  19. Adachi, T.; Izumi, H.; Yamada, T.; Tanaka, K.; Takeuchi, S.; Nakamura, R.; Matsuda, T. Gene structure and expression of rice seed allergenic proteins belonging to the α-amylase/trypsin inhibitor family. Plant Mol. Biol. 1993, 21, 239–248. [Google Scholar] [CrossRef]
  20. Swamy, B.; Rahman, M.A.; Inabangan-Asilo, M.A.; Amparado, A.; Manito, C.; Chadha-Mohanty, P.; Reinke, R.; Slamet-Loedin, I.H. Advances in breeding for high grain zinc in rice. Rice 2016, 9, 49. [Google Scholar] [CrossRef]
  21. Li, H.; Yang, J.; Yan, S.; Lei, N.; Wang, J.; Sun, B. Molecular causes for the increased stickiness of cooked non-glutinous rice by enzymatic hydrolysis of the grain surface protein. Carbohydr. Polym. 2019, 216, 197–203. [Google Scholar] [CrossRef]
  22. Zhang, H.; Jang, S.-G.; Lar, S.M.; Lee, A.-R.; Cao, F.-Y.; Seo, J.; Kwon, S.-W. Genome-wide identification and genetic variations of the starch synthase gene family in rice. Plants 2021, 10, 1154. [Google Scholar] [CrossRef]
  23. Xiong, Q.; Sun, C.; Wang, R.; Wang, R.; Wang, X.; Zhang, Y.; Zhu, J. The Key Metabolites in Rice Quality Formation of Conventional japonica Varieties. Curr. Issues Mol. Biol. 2023, 45, 990–1001. [Google Scholar] [CrossRef]
  24. Chattopadhyay, K.; Behera, L.; Bagchi, T.B.; Sardar, S.S.; Moharana, N.; Patra, N.R.; Chakraborti, M.; Das, A.; Marndi, B.C.; Sarkar, A. Detection of stable QTLs for grain protein content in rice (Oryza sativa L.) employing high throughput phenotyping and genotyping platforms. Sci. Rep. 2019, 9, 3196. [Google Scholar] [CrossRef] [PubMed]
  25. Yang, Y.; Guo, M.; Li, R.; Shen, L.; Wang, W.; Liu, M.; Zhu, Q.; Hu, Z.; He, Q.; Xue, Y. Identification of quantitative trait loci responsible for rice grain protein content using chromosome segment substitution lines and fine mapping of qPC-1 in rice (Oryza sativa L.). Mol. Breed. 2015, 35, 130. [Google Scholar] [CrossRef]
  26. Tan, Y.; Sun, M.; Xing, Y.; Hua, J.; Sun, X.; Zhang, Q.; Corke, H. Mapping quantitative trait loci for milling quality, protein content and color characteristics of rice using a recombinant inbred line population derived from an elite rice hybrid. Theor. Appl. Genet. 2001, 103, 1037–1045. [Google Scholar] [CrossRef]
  27. Wang, L.; Zhong, M.; Li, X.; Yuan, D.; Xu, Y.; Liu, H.; He, Y.; Luo, L.; Zhang, Q. The QTL controlling amino acid content in grains of rice (Oryza sativa) are co-localized with the regions involved in the amino acid metabolism pathway. Mol. Breed. 2008, 21, 127–137. [Google Scholar] [CrossRef]
  28. Lou, J.; Chen, L.; Yue, G.; Lou, Q.; Mei, H.; Xiong, L.; Luo, L. QTL mapping of grain quality traits in rice. J. Cereal Sci. 2009, 50, 145–151. [Google Scholar] [CrossRef]
  29. Ye, G.; Liang, S.; Wan, J. QTL mapping of protein content in rice using single chromosome segment substitution lines. Theor. Appl. Genet. 2010, 121, 741–750. [Google Scholar] [CrossRef]
  30. Zheng, L.; Zhang, W.; Chen, X.; Ma, J.; Chen, W.; Zhao, Z.; Zhai, H.; Wan, J. Dynamic QTL analysis of rice protein content and protein index using recombinant inbred lines. J. Plant Biol. 2011, 54, 321–328. [Google Scholar] [CrossRef]
  31. Zheng, L.; Zhang, W.; Liu, S.; Chen, L.; Liu, X.; Chen, X.; Ma, J.; Chen, W.; Zhao, Z.; Jiang, L.; et al. Genetic relationship between grain chalkiness, protein content, and paste viscosity properties in a backcross inbred population of rice. J. Cereal Sci. 2012, 56, 153–160. [Google Scholar] [CrossRef]
  32. Cheng, L.; Xu, Q.; Zheng, T.; Ye, G.; Luo, C.; Xu, J.; Li, Z. Identification of stably expressed quantitative trait loci for grain yield and protein content using recombinant inbred line and reciprocal introgression line populations in rice. Crop Sci. 2013, 53, 1437–1446. [Google Scholar] [CrossRef]
  33. Kashiwagi, T.; Munakata, J. Identification and characteristics of quantitative trait locus for grain protein content, TGP12, in rice (Oryza sativa L.). Euphytica 2018, 214, 165. [Google Scholar] [CrossRef]
  34. Yang, Y.; Guo, M.; Sun, S.; Zou, Y.; Yin, S.; Liu, Y.; Tang, S.; Gu, M.; Yang, Z.; Yan, C. Natural variation of OsGluA2 is involved in grain protein content regulation in rice. Nat. Commun. 2019, 10, 1949. [Google Scholar] [CrossRef]
  35. Hamaker, B.R.; Griffin, V.K. Effect of disulfide bond-containing protein on rice starch gelatinization and pasting. Cereal Chem. 1993, 70, 377–380. [Google Scholar]
  36. Martin, M.; Fitzgerald, M. Proteins in rice grains influence cooking properties! J. Cereal Sci. 2002, 36, 285–294. [Google Scholar] [CrossRef]
  37. Kumamaru, T.; Satoh, H.; Iwata, N.; Omura, T.; Ogawa, M.; Tanaka, K.J.T.; Genetics, A. Mutants for rice storage proteins: 1. Screening of mutants for rice storage proteins of protein bodies in the starchy endosperm. Theoret. Appl. Genet. 1988, 76, 11–16. [Google Scholar] [CrossRef]
  38. Bradford, M.M. A rapid and sensitive method for the quantitation of microgram quantities of protein utilizing the principle of protein-dye binding. Anal. Biochem. 1976, 72, 248–254. [Google Scholar] [CrossRef] [PubMed]
  39. Paterson, A.H.; Brubaker, C.L.; Wendel, J.F. A rapid method for extraction of cotton (Gossypium spp.) genomic DNA suitable for RFLP or PCR analysis. Plant Mol. Biol. Rep. 1993, 11, 122–127. [Google Scholar] [CrossRef]
  40. Wang, S. Windows QTL Cartographer 2.5. 2006. Available online: http://statgen.ncsu.edu/qtlcart/WQTLCart.Htm (accessed on 1 November 2018).
  41. Lincoln, S. Mapping genes controlling quantitative traits with MAPMAKER/QTL 1.1. In Whitehead Institute for Biomedical Research Technical Report; Whitehead Institute: Cambridge, MA, USA, 1992. [Google Scholar]
  42. Kosambi, D.D. The estimation of map distances from recombination values. In D.D. Kosambi: Selected Works in Mathematics and Statistics; Springer: New Delhi, India, 2016; pp. 125–130. [Google Scholar]
  43. Kepiro, J.; McClung, A.; Chen, M.-H.; Yeater, K.; Fjellstrom, R. Mapping QTLs for milling yield and grain characteristics in a tropical japonica long grain cross. J. Cereal Sci. 2008, 48, 477–485. [Google Scholar] [CrossRef]
  44. Liu, X.; Wan, X.; Ma, X.; Wan, J. Dissecting the genetic basis for the effect of rice chalkiness, amylose content, protein content, and rapid viscosity analyzer profile characteristics on the eating quality of cooked rice using the chromosome segment substitution line population across eight environments. Genome 2011, 54, 64–80. [Google Scholar]
  45. Zhong, M.; Wang, L.-Q.; Yuan, D.-J.; Luo, L.-J.; Xu, C.-G.; He, Y.-Q. Identification of QTL affecting protein and amino acid contents in rice. Rice Sci. 2011, 18, 187–195. [Google Scholar] [CrossRef]
  46. Kinoshita, N.; Kato, M.; Koyasaki, K.; Kawashima, T.; Nishimura, T.; Hirayama, Y.; Takamure, I.; Sato, T.; Kato, K. Identification of quantitative trait loci for rice grain quality and yield-related traits in two closely related Oryza sativa L. subsp. japonica cultivars grown near the northernmost limit for rice paddy cultivation. Breed. Sci. 2017, 67, 191–206. [Google Scholar] [CrossRef] [PubMed]
  47. Zhao, L.; Zhao, C.-F.; Zhou, L.-H.; Yao, S.; Zhao, Q.-Y.; Chen, T.; Zhu, Z.; Zhang, Y.-D.; Wang, C.-L. Mapping QTLs for rice (Oryza sativa L.) grain protein content via chromosome segment substitution lines. Cereal Res. Commun. 2022, 50, 699–708. [Google Scholar] [CrossRef]
  48. Jang, S.; Han, J.-H.; Lee, Y.K.; Shin, N.-H.; Kang, Y.J.; Kim, C.-K.; Chin, J.H. Mapping and validation of QTLs for the amino acid and total protein content in brown rice. Front. Genet. 2020, 11, 240. [Google Scholar] [CrossRef] [PubMed]
  49. Yu, Y.-H.; Li, G.; Fan, Y.-Y.; Zhang, K.-Q.; Min, J.; Zhu, Z.-W.; Zhuang, J.-Y. Genetic relationship between grain yield and the contents of protein and fat in a recombinant inbred population of rice. J. Cereal Sci. 2009, 50, 121–125. [Google Scholar] [CrossRef]
  50. Hu, Z.-L.; Li, P.; Zhou, M.-Q.; Zhang, Z.-H.; Wang, L.-X.; Zhu, L.-H.; Zhu, Y.-G. Mapping of quantitative trait loci (QTLs) for rice protein and fat content using doubled haploid lines. Euphytica 2004, 135, 47–54. [Google Scholar] [CrossRef]
  51. Wang, X.; Pang, Y.; Zhang, J.; Wu, Z.; Chen, K.; Ali, J.; Ye, G.; Xu, J.; Li, Z. Genome-wide and gene-based association mapping for rice eating and cooking characteristics and protein content. Sci. Rep. 2017, 7, 17203. [Google Scholar] [CrossRef]
  52. Bruno, E.; Choi, Y.-S.; Chung, I.K.; Kim, K.M. QTLs and analysis of the candidate gene for amylose, protein, and moisture content in rice (Oryza sativa L.). 3 Biotech 2017, 7, 40. [Google Scholar] [CrossRef]
  53. Aluko, G.; Martinez, C.; Tohme, J.; Castano, C.; Bergman, C.; Oard, J. QTL mapping of grain quality traits from the interspecific cross Oryza sativa× O. glaberrima. Theor. Appl. Genet. 2004, 109, 630–639. [Google Scholar] [CrossRef]
  54. Nan, J.; Feng, X.; Wang, C.; Zhang, X.; Wang, R.; Liu, J.; Yuan, Q.; Jiang, G.; Lin, S. Improving rice grain length through updating the GS3 locus of an elite variety Kongyu 131. Rice 2018, 11, 21. [Google Scholar] [CrossRef]
  55. Harushima, Y.; Nakagahra, M.; Yano, M.; Sasaki, T.; Kurata, N. A genome-wide survey of reproductive barriers in an intraspecific hybrid. Genetics 2001, 159, 883–892. [Google Scholar] [CrossRef] [PubMed]
  56. Chin, J.H.; Chu, S.-H.; Jiang, W.; Cho, Y.-I.; Basyirin, R.; Brar, D.S.; Koh, H.-J. Identification of QTLs for hybrid fertility in inter-subspecific crosses of rice (Oryza sativa L.). Genes Genom. 2011, 33, 39–48. [Google Scholar] [CrossRef]
  57. Pradhan, S.K.; Pandit, E.; Pawar, S.; Baksh, S.Y.; Mukherjee, A.K.; Mohanty, S.P. Development of flash-flood tolerant and durable bacterial blight resistant versions of mega rice variety ‘Swarna’through marker-assisted backcross breeding. Sci. Rep. 2019, 9, 12810. [Google Scholar] [CrossRef] [PubMed]
  58. Hillerislambers, D.; Rutger, J.; Qualset, C.; Wiser, W. Genetic and environmental variation in protein content of rice (Oryza sativa L.). Euphytica 1973, 22, 264–273. [Google Scholar] [CrossRef]
  59. Kawakatsu, T.; Hirose, S.; Yasuda, H.; Takaiwa, F. Reducing rice seed storage protein accumulation leads to changes in nutrient quality and storage organelle formation. Plant Physiol. 2010, 154, 1842–1854. [Google Scholar] [CrossRef]
  60. Ina, S.; Ninomiya, K.; Mogi, T.; Hase, A.; Ando, T.; Matsukaze, N.; Ogihara, J.; Akao, M.; Kumagai, H.; Kumagai, H. Rice (Oryza sativa japonica) albumin suppresses the elevation of blood glucose and plasma insulin levels after oral glucose loading. J. Agric. Food Chem. 2016, 64, 4882–4890. [Google Scholar] [CrossRef]
  61. Yamagata, H.; Sugimoto, T.; Tanaka, K.; Kasai, Z. Biosynthesis of storage proteins in developing rice seeds. Plant Physiol. 1982, 70, 1094–1100. [Google Scholar] [CrossRef]
  62. Park, S.-G.; Park, H.-S.; Baek, M.-K.; Jeong, J.-M.; Cho, Y.-C.; Lee, G.-M.; Lee, C.-M.; Suh, J.-P.; Kim, C.-S.; Kim, S.-M. Improving the glossiness of cooked rice, an important component of visual rice grain quality. Rice 2019, 12, 87. [Google Scholar] [CrossRef]
  63. Kawakatsu, T.; Takaiwa, F. Cereal seed storage protein synthesis: Fundamental processes for recombinant protein production in cereal grains. Plant Biotechnol. J. 2010, 8, 939–953. [Google Scholar] [CrossRef]
Figure 1. Phenotypic distribution of albumin, globulin, prolamin, glutelin, and grain protein content in BC3F3 population-I (Kongyu 131/Cypress) and population-II (Kongyu 131/Vary Tarva Osla) during the year 2018. The blue bar represents population-I and the red bar represents population-II. Black, green, and blue arrows represent the mean values of Kongyu 131, Cypress, and Vary Tarva Osla, respectively. Histograms (AE) depict the albumin (Alb), globulin (Gol), prolamin (Pro), glutelin (Glu), and grain protein content (Gpc) evaluated in 2018. Data was derived from three biological replicates.
Agriculture 13 01725 g001
Figure 2. Correlation analysis of albumin, globulin, prolamin, glutelin, and grain protein content within BC3F3 population-I (Kongyu 131/Cypress) and population-II (Kongyu 131/Vary Tarva Osla) during the year 2018. (A)—Represents population—I, (B)—represents population—II. Alb—albumin, Gol—globulin, Pro—prolamin, Glu—glutelin, Tpc—total protein content in the year 2018. * significant at p < 0.05, *** Significant p < 0.001 level.
Agriculture 13 01725 g002
Figure 3. Genetic linkage map of the QTLs dissected in population-I (Kongyu 131/Cypress) and population-II (Kongyu 131/Vary Tarva Osla) Chr.—chromosome, numerical digits—chromosome numbers, q—quantitative trait loci, Alb—albumin, Gol—globulin, Pro—prolamin, Glu—glutelin, Gpc—grain protein content. QTLs are presented at the right side of each chromosome in italic font. QTLs presented in orange color were identified in population I, and those in blue color were identified in population II. The first numeric digit in each QTL indicates chromosome number, and the second digit indicates the numbers of QTLs. Physical distances (Mb) of individual QTLs are located on the left side of each chromosome. The pentagonal shape at the right side of the QTLs determines co-localization with previously identified QTLs. The tringle shape indicates validated QTLs. The Scale bar is located on left side of the entire chromosome.
Agriculture 13 01725 g003
Figure 4. Genetic consequences of QTL qGpc7.3. The p-values were calculated using two-tailed t-tests. Error bars indicate standard deviations for each genotype. Black and white bars indicate Cypress and Kongyu 131 genotypes, respectively.
Agriculture 13 01725 g004
Table 1. Descriptive analysis of albumin, globulin, prolamin, glutelin, and grain protein content in BC3F3 population-I (Kongyu 131/Cypress) and population-II (Kongyu 131/Vary Tarva Osla) during the year 2018.
PopulationTraitsBC3F3 Introgression Line Populations
MeanSDMinimumMaximum
Population I
(Kongyu 131/Cypress)
Alb (mg/g)6.31 C1.532.0210.31
Gol (mg/g)7.91 C2.141.4613.43
Pro (mg/g)1.68 D0.460.633.17
Glu (mg/g)42.08 B8.8525.6471.33
Gpc (mg/g)113.3 A3.59103.7125.6
Population-II
(Kongyu 131/Vary Tarva Osla)
Alb (mg/g)5.33 C1.791.219.46
Gol (mg/g)4.86 C1.521.479.79
Pro (mg/g)2.52 D0.511.234.68
Glu (mg/g)65.79 B14.3230.2699.47
Gpc (mg/g)114.5 A3.52104.4122.4
Alb—albumin, Gol—globulin, Pro—prolamin, Glu—glutelin, and Gpc—grain protein content were evaluated in the year 2018. Same letters indicates no significant difference and different letters signifies significant differences.
Table 2. Putative QTLs delineated for albumin, globulin, prolamin, glutelin, and grain protein content in BC3F3 IL population-I (Kongyu 131/Cypress) and population-II (Kongyu 131/Vary Tarva Osla) during the year 2018.
TraitPopChr.QTLMarkerPhysical Interval (Mb)LODAdditive EffectR2 (%)Co-Localization/
Previous/Chr. Interval/QTLs/Genes
References
AlbP-I1qAlb1.2RM140-C1.23.312.4–23.33.924.5548.53qPR1, qALB-1, qPC-1a, qPC-1b, qALB-1, Cpb1, Cph1[17,43,44,45]
3qAlb3.1T3-4-C3.26.619.1–26.672.58−2.7742.58qPC3, qPC3-1[46,47]
7qAlb7.3RM501-T7-38.0–18.13.54.522.09qPC7, qPC7-1, qPC7-2, qPC-7, qAAC7.3([12,28,45,47,48]
8qAlb8.2Z8.25.3-RM26425.3–28.02.964.461.6qPC-8b, qAAC8.2[12,48,49]
9qAlb9.1RM160-Z9-22.420.4–22.32.62−2.6340.16
P-II4qAlb4.2RM470-RM56728.6–35.14.49−2.527.23qPC4, qRPC-4[47,50]
GolP-I2qGol2.4T2-1-T2-24.5–6.95.159.42.67qPC-2,qGLB2.1, qSGpc2.1, Cph2[17,24,43,46]
4qGol4.1Z4-17.7-T4-617.7–24.66.019.433.57
4qGol4.2W4.30.6-Z435.130.66–35.15.965.4913.68qPC4, qRPC-4[47,50]
8qGol8.1RM404-RM51515.5–20.35.339.4233.26qPC8, qPC-8b[44,47]
8qGol8.2RM556--Z8-25.322.4–25.36.739.3746.73qPC-8b, qAAC8.1, qAAC8.2[44,48]
10qGol10.2A10.2.84-Z10-16.62.8–16.63.88−3.9415.5qPC10, qPC10-2, qPC10-3, qPC10.1[47,49,51]
11qGol11.2W11-6.6-RM5366.6–9.06.799.3755.78
ProP-I3qPro3.1T3-1-RM2180.7–8.42.82−1.796.9qPC3, qPLA3, qPC-3.1, qPC-3.2, qPC-3.3, qAAC3.1, qAAC3.2[12,17,30,48,49]
4qPro4.1RM518-Z4-4.02.0–4.02.98−2.1134.28qPC-4, Cpb4, Cph4[30,43]
5qPro5.2RM509-RM16416.3–19.24.74−1.6951.7
5qPro5.3RM-164-RM48019.2–27.57.53−1.9547.17
10qPro10.1W10-0.1-A10.2.840.1–2.86.83−2.0961.85qPC10-1, qPC-10[30,47]
12qPro12.1Z12-0.94-Z12-9.40.9–9.45.89−2.1345.53qSGpc12.1, qPC-12[24,30]
GluP-I4qGlu4.1Z4-17.7-Z4-26.517.7–26.52.5−13.327.52
GpcP-I7qGpc7.3RM481-RM5012.9–8.03.71−1.673.14qPC7.1, qPC7,qPC-7, qRPC-7, qPC7, qAAC7.1, qAAC7.2, qAAC7.1[26,28,48,50,52]
P-II1qGpc1.2RM292-T1-39.5–12.53.542.54.1qSGpc1.3, qPC-1a, qPC-1b, qALB-1, Cpb1, Cph1[17,24,43,44]
6qGpc6.2T6-7-T6-48.5–185.262.186.27qPC-6, qPC-6, qPC-6[28,28,44]
7qGpc7.4T7-1-T7-324.8–27.818.44.8223.63qPC1[26]
10qGpc10.3RM239-D10-7F9.8–11.83.31−44.47qPC10, qPC10.1[12,49,51]
Alb—albumin, Gol—globuin, Pro—proplamin, Glu—glutelin, and Gpc—grain protein content. P-I and P-II represents population-I and population-II, respectively. Positive additive effect derived from Kongyu 131, and negative additive effects derived from Cypress/Vary Tarva Osla, respectively. PC/Pro/TGP, protein content; RPC, relative protein content; cpb, crude protein of brown rice; cph, crude protein of head rice; GLB, globulin content; GLT, glutelin content; PLA, prolamin content; CP, crude protein; qSGpc, stable grain protein content; qAAC, amino acid content.
Table 3. The phenotypic effect of QTL qGpc7.3 in between two near isogenic lines (NILs) for grain protein content was validated in a BC3F4 population during the year 2019.
QTLsNGN(Mean ± SD)p-Value%
qGpc7.337KY131101.54 ± 0.744.63544 × 10−111.69
19Cypress103.26 ± 0.70
N—Number of accession, GN—genotypes, mean, SE, p-values. Data were derived from three biological replications and statistically analyzed using Student’s t-tests at p < 0.05 and p < 0.01 levels of significance, respectively.
Disclaimer/Publisher’s Note: The statements, opinions and data contained in all publications are solely those of the individual author(s) and contributor(s) and not of MDPI and/or the editor(s). MDPI and/or the editor(s) disclaim responsibility for any injury to people or property resulting from any ideas, methods, instructions or products referred to in the content.

