Article

Characteristics of the Supply Chain of Tobacco and Tobacco Products: Evidence from Serbia

1
Department of Finance and Accounting, Faculty of Economics in Subotica, University of Novi Sad, 24000 Subotica, Serbia
2
Department of Agricultural Economics and Agribusiness, Faculty of Economics in Subotica, University of Novi Sad, 24000 Subotica, Serbia
*
Authors to whom correspondence should be addressed.
Agriculture 2023, 13(9), 1711; https://doi.org/10.3390/agriculture13091711
Submission received: 21 July 2023 / Revised: 18 August 2023 / Accepted: 25 August 2023 / Published: 30 August 2023
(This article belongs to the Special Issue Sustainable Development of Agricultural Markets and Economics)

Abstract

:
Serbia is a significant producer of tobacco in Europe and the only country in Europe where tobacco production is growing. Due to privatization, some of the most important multinational companies are now producing tobacco products in Serbia. Bearing in mind the liberalization of the market and the harmful effect tobacco products have on health, this research tried to analyze the tobacco and tobacco products sector in Serbia. The study’s main goal was to analyze the characteristics of the tobacco and tobacco supply chain in Serbia and determine comparative advantages and levels of integration with the world market. The methodology used in this study included the index of concentration of tobacco manufacturers, followed by a panel regression analysis to determine factors that affected profitability in this industry. Also, foreign trade performances were analyzed using the indices of revealed comparative advantages and integration. The research was conducted for the period from 2013 to the last available year. The results indicate the growth of tobacco production despite the decline in the number of farms, the highly concentrated production of tobacco products, and the significant intensification of foreign trade despite modest comparative advantages.

1. Introduction

Due to its harmful impact on human health, the topic of the production and consumption of tobacco products mainly occupies the attention of scientists in medicine, law, and ethics. At the same time, in recent years, there have been very few studies concerning the economic characteristics of the production itself, especially in the territory of Europe. The main reason is public pressure to minimize tobacco production, which is reflected in the new European Union (EU) regulations. The situation is different in developing countries. Tobacco remains a dominant cash crop in many low-income and middle-income countries, despite the evidence suggesting that it is not as profitable as the industry claims and is harmful to health and the environment [1]. In the territory of the EU, tobacco production is represented only in a few countries: Italy, Spain, Greece, and Poland.
In the EU, tobacco cultivation has steadily decreased since 2013—when approximately 210,000 tons were grown in eight EU countries—to 135,000 tons in 2021 [2]. Figure 1 shows the share of tobacco production in Europe by country. Almost one quarter was produced in Italy but with a decrease in production by 4% per year in the period 2013–2021. And from the point of consumption, Italy is particularly interesting. According to Gallus et al. [3], there are increasing trends of nicotine use for the first time over the last six decades, which can slow down the drop in production. Also, there was a decrease in production in the top five countries (Italy, Spain, North Macedonia, Poland, and Greece). Considering tobacco varieties in the EU, “Flue-cured” Virginia varieties account for 71% of the output, “light-air-cured” Burley varieties 16%, “sun-cured” or oriental 7%, and other varieties (“dark-air-cured” and “fire-cured”) 6% [4].
Serbia is the sixth-largest tobacco producer in Europe with a 6% share. Also, this is the only country where tobacco production is growing (1% per year). The case of Serbia is particularly interesting because it gives evidence for a country in which the tobacco market is characterized by high tobacco consumption, low prices, and a large perceived impact of multinational tobacco companies on the public revenues, exports, and employment, given the considerable cigarette production in Serbia [5]. All of this is the reason why the supply chain of tobacco and tobacco products in Serbia was the subject of this study.
Tobacco production is regulated by the Law on Tobacco [6] in Serbia. The main reason is that tobacco is an excise good. Agricultural farms are obliged to enter a contract with tobacco processors to obtain seeds for production and register the plots on which tobacco will be produced. Also, with the same contract, they commit to selling tobacco to processors by the end of the current year. When buying tobacco, it is classified according to quality, and the price is determined based on that. In addition to production in the field, farmers also carry out the process of tobacco drying and packaging.
In the creation supply chain of final tobacco products, in addition to farms that produce the raw material base, tobacco processors and manufacturers also participate (Figure 2). The regional distribution of the farms and tobacco processors and manufacturers is shown in Figure A1. Tobacco processing includes sorting, fermentation, and other actions in the technological process of tobacco processing and packaging [6]. A manufacturer of tobacco products is a business entity that produces cigarettes, cigars, cigarillos, and other tobacco products.
The Serbian tobacco industry is of significant academic interest primarily because Serbia is a country where the tobacco industry is distinguished by high levels of tobacco consumption, affordable prices, and a substantial effect of international tobacco corporations on government revenues, exports, and hiring [5]. The Serbian tobacco market is relatively minor when measured against the global and developed economies’ tobacco markets. The tobacco market in Serbia consists of 12 tobacco processors, whereby 4 companies are also manufacturers of tobacco products [7]. In 2021, a total of 35,227 million cigarettes were produced, which is not unexpected given that three out of the four major tobacco product manufacturers have their production facilities located in Serbia, referring to British American Tobacco (BAT) in Vranje, Japan Tobacco International (JTI) in Senta, and Philip Morris International (PMI) in Niš. In 2020, a 4.7% increase in the production of tobacco products was recorded compared with the previous year, while in 2021, such growth amounted to 2.2% [8]. Numerous factors have influenced the trends in the tobacco-processing industry in Serbia, including country disintegration, the imposition of U.N. trade sanctions, economic transition, market liberalization, and significant privatization within the sector [9].
In addition to producers, consumers and the state also appear in the tobacco market. The state plays multiple roles in the market of tobacco and tobacco products:
  • Through excise taxes, the state affects the price of cigarettes, thus collecting revenues and potentially reducing consumption, which implies a reduction in the demand for raw tobacco.
  • It determines the game’s rules in this market through the appropriate legal regulation.
  • In some cases, its agricultural policy measures affect tobacco production by providing various support to tobacco producers.
In order to obtain a better overview of the supply chain of tobacco and tobacco products, it is necessary to look at the trends in foreign trade and the competitive positions achieved by producers and manufacturers from Serbia on the world market. In the process of international economic integration, Serbia significantly liberalized the market but maintained certain barriers to imports, regardless of preferential trade agreements (quotas after importing certain quantities that are regulated separately) [10]. The liberalization of the market caused the intensification of exchange, both exports and imports, and it is necessary to look at the revealed comparative advantages and the level of integration of the tobacco and tobacco products of the Serbia market with the international market.
In accordance with the above, this study aimed to analyze the characteristics of the tobacco and tobacco supply chain in Serbia and determine comparative advantages and levels of integration with the world market. The contributions of this study are as follows:
  • This research examined the entire supply chain of tobacco, and thus fills the gap in the literature, especially in the European territory.
  • Based on the results, all participants in the supply chain can adjust their operations so that the supply chain remains sustainable.
  • Based on the research, it is possible to determine the critical problems within the chain and give adequate recommendations to the creators of economic policies.
Following the structure of tobacco production, this paper is organized as follows. After the introduction, an overview of the literature related to tobacco production and the methodology is given. The results are divided into four segments. In the first, the results from analyzing tobacco production on the farm is given. The second part is focused on the analysis of the tobacco industry. The third part presents the situation regarding cigarette consumption in Serbia. In the last segment, the results of the foreign trade competitiveness analysis are given. The discussion brings together the obtained results. In conclusion, all the results are summarized, and the limitations of the study are shown, as well as ideas for further research.

2. Literature Review

In the last few years, the economic aspect of tobacco production on the farm has been the focus of researchers in developing countries [11,12,13], while research in Europe is not represented. Research in Europe is mainly focused on government regulation to reduce cigarette consumption [14,15]. In the case of Serbia, only Matkovski and Đokić [16] analyzed the effects of support for tobacco production on farms, which has not been current since 2012.
Regarding the foreign trade exchange of tobacco and tobacco products and the positioning of Serbia regarding competitive advantages, there is a limited number of papers in the literature. Most of the research deals mainly with the entire agri-food sector, and as part of that research, the positions of tobacco and tobacco products are also considered. For example, earlier research that looked at the export competitiveness of the entire agri-food sector of the Western Balkan countries shows that Serbia has comparative advantages when it comes to the export of tobacco and tobacco products, and in addition to Serbia, Croatia, and North Macedonia also have comparative advantages [17,18]. The highest level of comparative advantages is observed in North Macedonia [19], where tobacco and tobacco products represent more than 20% of exports [18], and tobacco production represents a significant source of income for a large number of agricultural farms in this country [20].
When it comes to research on the comparative advantages of tobacco and tobacco products from Serbia, depending on the research period and the applied methodology [21], different levels of comparative advantages are observed in CEFTA and EU countries, but there is a tendency of increase of comparative advantages on the world market [22]. In certain studies that use the traditional Balassa methodology, a higher level of comparative advantage is observed in the EU market [21,23], while in studies where the LFI methodology is used, a higher level of comparative advantage is observed in the market of the countries of the region (CEFTA) than is the case in EU countries [21]. The same is the case with the research that analyzes Vojvodina by looking at the export positions of the agribusiness sector, where a higher level of comparative advantages for tobacco and tobacco products on the market of CEFTA countries is observed than in the case with EU countries [21]. Among the countries in the region, Serbia achieves the highest level of comparative advantages of tobacco and tobacco products in Montenegro [24].
The Serbian tobacco industry has undergone significant changes in the past 15 years, which were marked by three considerable tobacco companies; the privatization processes by prominent multinationals, such as PMI, JTI, and BAT; and one Greenfield investment [5], which has left significant consequences on the market concentration. Higher concentrated markets may result in higher market power, leading to inefficient operations, reduced competition, and increased prices [25]. Swinnen and Vandeplas [26] consider that the phenomenon of “double market power” may arise when firms operating in highly concentrated industries make use of their market dominance to obtain lower prices from manufacturers while simultaneously taking advantage of their negotiating power by charging consumers higher prices compared with a competitive market scenario. Hence, industry consolidation may result in higher profitability for leading companies. Despite extensive empirical research in the field of market concentration, the relationship between concentration and profitability remains a subject of debate. Most scientific research in this domain is related to the financial industry, which is widely regarded as a highly concentrated sector across nations. However, compared with the real sector, merely a minor percentage of authors have successfully identified the patterns in the relationship between industrial integrations and the financial performance of firms. Vuković et al. [27] conducted a study analyzing tobacco manufacturers’ market concentration in the Republic of Serbia from 2010 to 2013. The research indicated a reverse relationship between the market share and performance indicators of prominent tobacco-producing firms in the Republic of Serbia. Mirović et al. [28] examined the disparity in market share between the top three acquired chains and the top three local retail chains in Serbia and concluded that trading chains that obtain a greater market share through acquisition tend to gain reduced profitability rates. The market concentration of agricultural enterprises in Vojvodina, which is an autonomous provincial republic of Serbia, was analyzed by Pjanić et al. [29]. The findings indicate that the structure of the agricultural market in Serbia is characterized by the presence of a relatively small proportion of large- and medium-sized enterprises, which constitute approximately 5% of the market. Moreover, it was observed that a significant proportion of the market, amounting to 60% in terms of sales revenue and gross value added, is contributed by small enterprises and farms. However, Kastratović et al. [30] examined 30,037 financial reports of firms operating in the manufacturing industry sector in Serbia from 2015 to 2017 and concluded that market concentration significantly and positively affects profitability. As far as the research of other countries is concerned, the most comprehensive and up-to-date research was conducted by Grullon et al. [31]. They researched companies established in the USA operating between 1972 and 2014 in several industries. Their analysis resulted in the conclusion that businesses operating in U.S. industries that are experiencing rising levels of industry concentration saw a proportional increase in their profits. While an increase in market concentration corresponds with companies’ improved profitability, there is no correlation between concentration and asset utilization. The results suggest that the rise in profitability derives from higher prices.
The problem of consuming tobacco products is one of the world’s most significant global health challenges today, and the issue of tobacco control is one of the priorities faced by governments of almost all countries in the world. The issue of tobacco control is one of the main challenges facing the World Health Organization (WHO). In 2003, WHO led the development of the Framework Convention on Tobacco Control (FCTC), which was the first global health treaty intended to bolster tobacco use curtailment efforts among signatory member states [32]. The goal of adopting the Convention is to protect current and future generations from the devastating health, social, ecological, and economic consequences of using tobacco products. In 2008, WHO introduced the MPOWER package through six evidence-based control measures: monitor tobacco use and prevention policies; protect people from tobacco smoke; offer help to quit tobacco use; warn about the dangers of tobacco; enforce bans on tobacco advertising, promotion, and sponsorship; and raise taxes on tobacco [33]. Consumers’ purchasing power or affordability of tobacco products is dependent on the price of tobacco products relative to consumer income. Tobacco taxation, through its effect on tobacco product prices, influences the affordability of tobacco products and consumers’ demand for them [34]. This indicates states’ significant influence on tobacco and tobacco product consumption. Driven by the spread of MPOWER tobacco control measures, global cigarette sales began declining in 2012 and have continued ever since, even as the global population has grown [33]. Furthermore, Serbia is one of the leading consumers of tobacco products. In 2021, the retail trade turnover of tobacco products amounted to RSD 147,628 million, surpassing the turnover of meat, fish, and processed products (RSD 122,651 million); bread and bakery products (RSD 93,361 million); and non-alcoholic beverages (RSD 65,771 million) [7].

3. Materials and Methods

The methodological framework of this research examined the supply chain of tobacco and tobacco products by looking at the production performance of agricultural farms, the tobacco processing industry, and tobacco consumption. In addition, the research was supplemented by analyzing the comparative advantages and foreign trade performance. For this research, data were used for the period from 2013 to the last available year. Data on the production and structure of agricultural holdings were taken from the Tobacco Administration of the Republic of Serbia [35], while financial data for the tobacco industry was gathered from financial reports acquired through the T.P. Catalyst database [36]. Data on consumption and foreign trade were taken from the database of the Statistical Office of the Republic of Serbia [37]. Data for foreign trade analysis include division 12—Tobacco and tobacco manufactures from Standard International Trade Classification—rev 4 [38].
Given that competitiveness is a multidimensional concept [39], measurement at the macro level is most often based on the analysis of the conditions under which countries trade, that is, on the observation of tendencies in international trade. To measure competitiveness at the macro level, the index of revealed comparative advantages is most often used in the literature, and numerous ways of measuring this index have been developed since its establishment by the author Balassa [40]. One of the convenient ways is the LFI [41], which was used in numerous studies [18,21,42], the advantage of which is a complete analysis given that it also considers imports. This methodology provides a more comprehensive analysis of specific positions in a particular sector, and it can eliminate the influence of cyclical factors that can impact trade in the short term [43]. The main disadvantage of this methodology is that numerous other factors are not considered in the analysis, which are difficult to determine, and which also affect the competitiveness of the sector on the international market. The analysis was completed by looking at the level of specialization through the Grubel–Lloyd index of intra-industry exchange. This index successfully determines the degree of integration of a particular sector with the international market and was used in numerous studies in the literature [18,23,42].
For the analysis of the competitive positions of Serbian tobacco and tobacco products on the international market, but also in the EU and the CEFTA countries, the Lafay index (LFI) was used as an indicator of comparative advantages [41]:
LFI   j i = 100   ( x   j i m   j i x   j i + m   j i j = 1 N ( x   j i m   j i ) j = 1 N ( x   j i + m   j i ) ) x   j i + m   j i j = 1 N ( x   j i + m   j i )
where x represents an export, m is an import, i is a country, j is a commodity, and N is the number of analyzed items. Therefore, LFI   j i represents the Lafay index in country i (Serbia) of commodity j (tobacco and tobacco products). LFI > 0 indicates the existence of comparative advantages; the higher the value of the LFI, the greater the comparative advantages. Compared with traditional methodologies for calculating comparative advantages, the advantage of this index is that it also includes imports and represents a complete analysis.
The Grubel–Lloyd index of intra-industry trade (GLIIT) was used to analyze the integration of the Serbian tobacco and tobacco products market with the international market [44]:
GLIIT j = [ 1 j X ij M ij j X ij + M ij ] * 100
where X represents an export, M is an import, i is a country, and j is a commodity. Therefore, GLIIT j represents the Grubel–Lloyd index of the commodity j (tobacco and tobacco products). GLIIT > 15% indicates the intra-industry character of trade, and the closer the value of this index is to 100%, it indicates good integration of the analyzed market with the international market.
The sample used for the tobacco industry analysis consisted of 12 manufacturers of tobacco products actively operating in the Republic of Serbia in the period from 2013 to 2021: BAT Vranje ad Vranje, Philip Morris Operations Niš, J.T. International ad Senta, Monus doo Beograd, Duvan ad Ljubovija, DIB doo Bujanovac, Duvanska Han doo Vladicin Han, Ad Tabak Niš, Duvanska ad Čoka, Copex doo Novi Sad, Tabex doo Sremska Mitrovica, and Intabak doo Ljubovija. The following Figure 3 displays the segmentation of the sample according to specific criteria. When considering this overview in the context of market concentration based on criteria such as turnover, net income, and total assets, it could be concluded that the industry is relatively homogeneous, with no small number of companies standing out from the average in comparison with the majority.
One of the objectives of this study was to investigate the performances of tobacco processors in the Republic of Serbia based on the market concentration and profitability factors assessment. The Herfindahl–Hirschman index (HHI) is a commonly used indicator applied in the process of determining the degree of concentration of a market and the level of competition within an industry [27,31,45,46,47,48]:
HHI = i = 1 N S i 2
where S i represents the market share of the company on the market and N represents the number of companies in the industry.
To determine whether the degree of market concentration affects the profitability of companies within the industry, it is necessary to develop a panel regression model that identifies the determinants of profitability [49,50,51,52,53,54,55]. One of the easiest ways to measure competitiveness on the micro level is based on traditional tendencies, such as the return on assets (ROA) [56]. The research concentrates on the ROA as a dependent variable. The ROA is a widely utilized accounting metric for evaluating the financial performance of corporations primarily due to its power to provide insight into a company’s operational efficiency and ability to generate profit from its assets [50,51,52,57,58] and because it is calculated using objective financial data derived from financial statements, which are less prone to manipulation or external biases compared with market indicators [54,59]. The ROA can assess the performance of both publicly traded and non-publicly traded companies, which was more appropriate for the sample used in this research. Numerous studies in global literature were dedicated to examining the various factors that influence the profitability of firms. Although one of the main objectives of this study was to focus on the impact of market concentration on profitability, the following variables were shown to have an impact on profitability and were considered in the model as control variables: liquidity, financial leverage, debt ratio, firm size, tangibility, total assets turnover, fixed assets turnover, current assets turnover, and growth. Table 1 provides a comprehensive description of the variables mentioned, relying primarily on research undertaken by Dakić et al. [60], Arian et al. [50], Tekić et al. [55], and Vuković et al. [61].
All these mentioned methods together can clearly look at specific segments of the supply chain of tobacco and tobacco products and determine the factors that affect the supply chain of tobacco and tobacco products, which was the main goal of this research.

4. Results

In the production of tobacco in Serbia, Virginia tobacco has the largest share at around 90%, followed by Burley with almost 9% and other varieties are statistically insignificant. The reason for this structure can be explained by the structure of the final tobacco product, which is usually a cigarette, in which Virginia represents the basic neutral element that serves to bind the other materials that make up the cigarette. Such importance in the final product can be transferred to the demand for raw tobacco of this type, which causes a greater production of it. However, this is not the only reason. The long-term practice of farmers in the territory of Serbia has shown that Virginia-type tobacco is better adapted to the climate of this area and that it has more stable yields.
Table 2 shows the characteristics of tobacco production in Serbia. Unfortunately, there is no financial data about farms that produce tobacco in the Farm Accountancy Data Network (FADN), and thus, the only available data was collected from the Tobacco Administration, which is part of the Ministry of Finance. Considering farms, this department only makes records of the number of registered farms that produce tobacco. The average production per farm was obtained by dividing the total production at the state level by the total number of tobacco producers expressed in tons, while the average farm size was obtained by comparing the total area under tobacco with the number of farms expressed in hectares. This is not an idealistic calculation due to the problem of tobacco varieties. For example, data on the average yields and average farm size are taken for all types of tobacco together, although production characteristics are different. The production of Burley is mainly carried out by smaller farms because it is very difficult to provide adequate space for drying large quantities of that tobacco, while the production of Virginia implies the use of a tobacco leaf drying machine, and therefore, production is possible over larger areas.
In the observed period, the number of tobacco producers radically decreased from 1781 in 2013 to 775 in 2021. On the other hand, total production increased, as well as the average area per farm. It can be concluded that with the passage of time, more productive, and therefore, more successful producers survived in the market. As in other crop production, variations in yields are dominantly influenced by the weather conditions.
In the past two decades, the foreign trade exchange of agri-food products has changed significantly, and there has been a growth in exports and imports. This is conditioned by the conclusion of preferential trade agreements with the EU and CEFTA countries and certain bilateral agreements, and the new Open Balkan initiative with Albania and North Macedonia further liberalizes the market. Given the particular sensitivity and control of tobacco and tobacco products, specific barriers are currently in place after certain quantities are imported, which is defined by the nomenclature of the customs tariff, from which it can be seen that there has been a significant liberalization of the import of these products with EU countries and CEFTA [10].
Regarding the export of tobacco and tobacco products, in the analyzed period (Figure 4), there was a significant increase in the value of these products at an average annual rate of as much as 6%. The share of export of tobacco and tobacco products in the agri-food export on the world market in the analyzed period amounted to about 8%. The most significant growth in the export of tobacco and tobacco products is present in the countries of the rest of the world (which were not analyzed in the scope of the EU and CEFTA as the most important trade partners of Serbia), where almost 80% of the total export of these products was placed. In the structure of exports to these countries (the rest of the world), tobacco and products made up almost a third of recent years. The most important countries for the export of tobacco and tobacco products from the rest of the world in recent years are Algeria, Japan, Egypt, Israel, and Turkey. Regarding the structure of exports, the export of tobacco and tobacco manufactures dominates, while only a significant percentage of unmanufactured tobacco is present in exports to EU countries.
When it comes to the import of tobacco and tobacco products, it accounted for about 10% of the total import of agri-food products in the analyzed period (Figure 5). At the same time, there was an increase in the import of tobacco and tobacco products at an average annual rate of 11%. The most significant proportion of imports was from the EU, where over 50% of these products have been imported in recent years. In contrast with exports, unmanufactured tobacco had a significant place in imports (especially from the EU).
In the analyzed period, a positive foreign trade balance can be observed in the exchange of tobacco and tobacco products, which has been achieved permanently since 2014 (Figure 6). Such indicators are the result of a faster growth in exports than is the case with imports. As previously mentioned, there has been a significant increase in the export of processed tobacco products to non-traditional markets.
Due to the previously described tendencies, significant growth in comparative advantages measured using the LFI methodology can be observed in the market of non-traditional partners, that is, in the market of the rest of the world (Figure 7). Although previous research that used this methodology indicates the existence of comparative advantages for the previous period, the period covered by the analysis in this study shows very weak or no comparative advantages, which was also a consequence of the increase in imports, given that this methodology includes imports in the analysis. Slight comparative advantages were observed in the CEFTA countries in the last period, while the worst situation was in the EU countries.
During the analyzed period, the GLIIT values were higher than the lower limit of 15%, indicating that the intra-industry character of trade is present. The highest degree of integration, and the slightest changes, are present in the analysis results of the entire foreign trade exchange of tobacco and tobacco products. In contrast, the most significant decline in integration is observed in the exchange of these products with CEFTA countries (Figure 8).
The significance of the Herfindahl–Hirschman index lies in its consideration of individual market shares of all companies operating in the tobacco processing market. Table 3 displays the values of the Herfindahl–Hirschman Index utilizing operating revenue, net income, equity, and number of employees.
Pursuant to the U.S. Department of Justice and the Federal Trade Commission [62], an HHI value between 0.15 and 0.25 indicates a moderately concentrated market, whereas an index value over 0.25 indicates a highly concentrated market. Another categorization, offered by the European Commission [63], classifies such category ranges as from 0.10 to 0.20 and above 0.20, respectively. The HHI value declines as the number of competitors in the market grows. Furthermore, the value of the index rises as the inequality in market power size increases, as larger companies have a greater value in the calculation due to the fact that market shares are squared.
According to the results of the HHI (Figure 9), in the period from 2013 to 2021, the tobacco processing market was categorized as highly concentrated, except for the HHI by the number of employees, which construes the market as moderately concentrated according to both classifications [62,63]. Upon observing the HHI by net income, this index ranged from 0.337 (2021) to a maximum of 0.953 (2014), which represents the highest value of HHI in all four instances. The minimum value of the HHI was recorded at 0.193 in 2014, as measured by the number of employees. The obtained values of the HHI, using the number of employees, indicate noticeably lower values in comparison with the other three balance positions throughout the observed period, ranging from a minimum of 0.193 to 0.496.
Bearing in mind the trend of the decline in HHI, which reflects a decrease in the level of market concentration, it could be inferred that the intensity of competition in the tobacco processing market of the Republic of Serbia increased during the observed period from 2013 to 2021. It could be considered that the HHI declined due to pricing power loss and more competition.
After the calculation of market concentration indexes, the impact of market concentration on profitability was tested. Before evaluating the econometric model examining the impact of market concentration on the profitability of tobacco processing companies, it is crucial to diagnose the appropriate regression model.
A model characterized by varying intercepts across both observation units and periods is referred to as a model involving individual and time effects. The individual and time effects may be considered as fixed or as a stochastic model. Once selecting an appropriate panel model, it is imperative to ascertain the presence of individual and time effects in either a fixed or stochastic specification. The Hausman test for model specifications is commonly employed for assessing models. Provided that the null hypothesis is not accepted, it may be more suitable to employ the fixed effects model [64]. Model specifications, as well as the effect test results, are given in the following Table 4.
Based on a determined p-value of 0.0000, it is indicated that the model under evaluation should incorporate a random specification involving both time and individual effects.
Upon the selection of the model, it became crucial to scrutinize the fundamental assumptions that support the use of panel data analysis. One of the basic premises refers to the phenomenon of multicollinearity. The verification of the presence of multicollinearity could be ascertained through the evaluation of variance impact factors (VIF) and tolerance (TOL), as outlined in Table 5. Based on the results, it could be identified that both the VIF coefficient and the TOL (1/VIF) coefficient meet the criteria. Specifically, the VIF coefficient does not surpass the threshold of 10, while the TOL coefficient is not lower than the prescribed value of 0.1. Consequently, it may be concluded that all the independent variables indicate a lack of significant correlation among themselves.
Table 6 presents the results of evaluating fundamental premises regarding the possibility of autocorrelation and heteroskedasticity. The Wooldridge test was used to examine the existence of autocorrelation. The Wooldridge test revealed a p-value of greater than 0.05, indicating that the fundamental use of panel data analysis remained unaffected. To examine the presence of heteroskedasticity, the Breusch–Pagan/Cook–Weisberg test was employed. The findings of this test led to the rejection of the null hypothesis, which assumes homoscedasticity, and the acceptance of the alternative hypothesis, suggesting the presence of heteroskedasticity, at a significance level of 1%. Therefore, because of the failure to satisfy the fundamental assumptions, it became imperative to transform the model.
For the final evaluation of the model, it is necessary to eliminate the effects of heteroskedasticity through the computation of robust standard errors [65]. Table 7 presents the results of the evaluation of the transformed panel regression model.
An overall R-squared value of 0.5771 indicates that the independent variables explain approximately 57.71% of the total variation in the dependent variable, which could be considered high and significant. Analyzing panel regression results, it could be assumed that the HHI calculated based on operating revenue had a statistically significant effect on profitability at the 1% level of statistical significance. Considering the value of the coefficient of HHI, namely, −0.5684, it could be interpreted that with an increase in HHI of 1%, the profitability measured by the return of assets would fall by more than 0.5%, which is also confirmed by [49]. Based on Table 3, the Serbian tobacco market is considered highly or moderately concentrated. It is important to acknowledge that it could be concluded that any increase in concentration reduces profitability; although this trend is rare, it is possible for several reasons. When several corporations compete, they could reduce investments in technology and motives for distinctiveness or might be willing to maintain market share through economies of scale, consumer awareness, or distribution channels, which could adversely affect their earnings. Provided that companies experience less pressure to reduce prices, prices could rise, and sales volume could drop, which may eventually impair profitability due to weakened competitive pressure.
Considering the control variables, there is a negative and significant effect of liquidity on profitability, which is in line with Tekić et al. [55], but opposite to our previous estimation. Keeping hold of additional funds or highly liquid assets may lead to the inefficient usage of resources. The findings implied that the debt-to-assets ratio had a negative impact on profitability, confirming the conclusions by Ahmed et al. [66,67], Basdekis et al. [51], Mahssouni et al. [53], and Vuković et al. [61], while in contrast, the results reveal that leverage had a positive effect, being consistent with Arian et al. [50]. Higher levels of debt may lead to greater fixed financial commitments, thus imposing pressure on its profitability. Conversely, corporations may choose leverage as a means of financing expansion efforts. These considerations should be taken into account within the wider context of a company’s comprehensive financial strategy. Similar to the results reported by Arian et al. [50], this study identified a negative influence of size, as well as sales growth and fixed asset turnover. This finding is in contrast with related empirical studies [54,60,66,67] and our previous estimation. But, despite appearing illogical, it is not uncommon for organizations that prioritize quick growth of assets and sales to allocate significant resources to expansion activities, including research and development, marketing, and new facilities. These investments may initially result in a decrease in profitability, but their main purpose is to produce future income. In contrast with total and fixed asset turnover, current asset turnover positively affects ROA. The results imply that faster inventory turnover, effective receivables management, and reduced operating cycles contribute to higher earnings.
The consumption of tobacco products in Serbia is very widespread, and the consumption of classic cigarettes stands out. The prevalence has decreased over the years but is still high. Serbia has a cigarette prevalence rate of 26.2% of daily smokers compared with 18.4% for the EU, where 15.8% of the population consumes more than 20 cigarettes a day, which is also above the EU average of 5.9% [68]. The consumption of cigarettes and other tobacco products in the Republic of Serbia represents a significant economic burden for households and society in general. Figure A2 shows the structure of household individual consumption in Serbia in 2021. The group of products “Alcoholic beverages and tobacco” accounts for 4.8% of the total individual consumption of households in Serbia, which is comprised of the following: spirits 0.4%, wine 0.3%, beer 0.6%, and cigarettes and tobacco 3.5%. If the share of cigarettes and tobacco in urban and rural areas of Serbia is observed, it is noticeable that the share in rural areas is higher and amounts to 4.2% of the total personal consumption of households, while it is 3.2% in urban areas [69].
Figure 10 shows the growing trend of household spending on cigarettes and tobacco products from 2011 to 2021. According to the available data published by the Institute for Public Health Serbia, the young population is also affected by the tobacco epidemic, where 16.2% of the population aged 13–15 are consuming cigarettes with increasing tendencies [70]. This research pointed out important problems, whereby 70.4% of current smokers between the ages of 13 and 15 buy cigarettes on their own, even though this is prohibited by law.
The policies in Serbia that control and reduce the use of tobacco products are, for the most part, harmonized with those applied by most developed countries, and among the most important laws that have been adopted are the Law on the Protection of the Population from Exposure to Tobacco Smoke [6,71]. Also, in 2016, a new law concerning advertising was passed, which imposes new challenges on companies operating in the tobacco industry. Tobacco companies have limited opportunities to promote their products, which makes brand building very difficult [72].
Although the WHO report indicates progress in tobacco control in Serbia (e.g., the growth of excise duties on cigarettes, with excise duties and VAT accounting for 76.5% of the weighted average retail price of cigarettes) [33], it is still necessary to work on the better implementation of existing laws and MPOWER measures.

5. Discussion

Serbia is the only European country with a growth in tobacco production. There are a few reasons for this trend. First, Serbia is not an EU member, and thus, the legislation is different, and there is no high political pressure to reduce tobacco production. Second, the concentration in the tobacco industry, where the biggest multinational companies exist. Third, the local consumption of tobacco production is very high. On the other hand, the number of producers drastically decreased in the observed period. This trend was greatly influenced by the abolition of support for tobacco producers, which was current until 2011. After 2000, tobacco producers received support through payments per hectare or payments per kilogram of production. According to Matkovski and Đokić [16], this kind of support was significant for processors due to the lower prices of raw tobacco, which is the primary input in their production. The proof of this was a sudden increase in the price of tobacco, from EUR 1 to EUR 1.5 per kilogram after the abolition of payments per kilogram in 2009. The abolition of support was the main reason for the decline in the number of producers after 2012. Without state support, many producers, especially small farms, no longer had an interest in producing tobacco. Other factors probably influenced the further decline in producers:
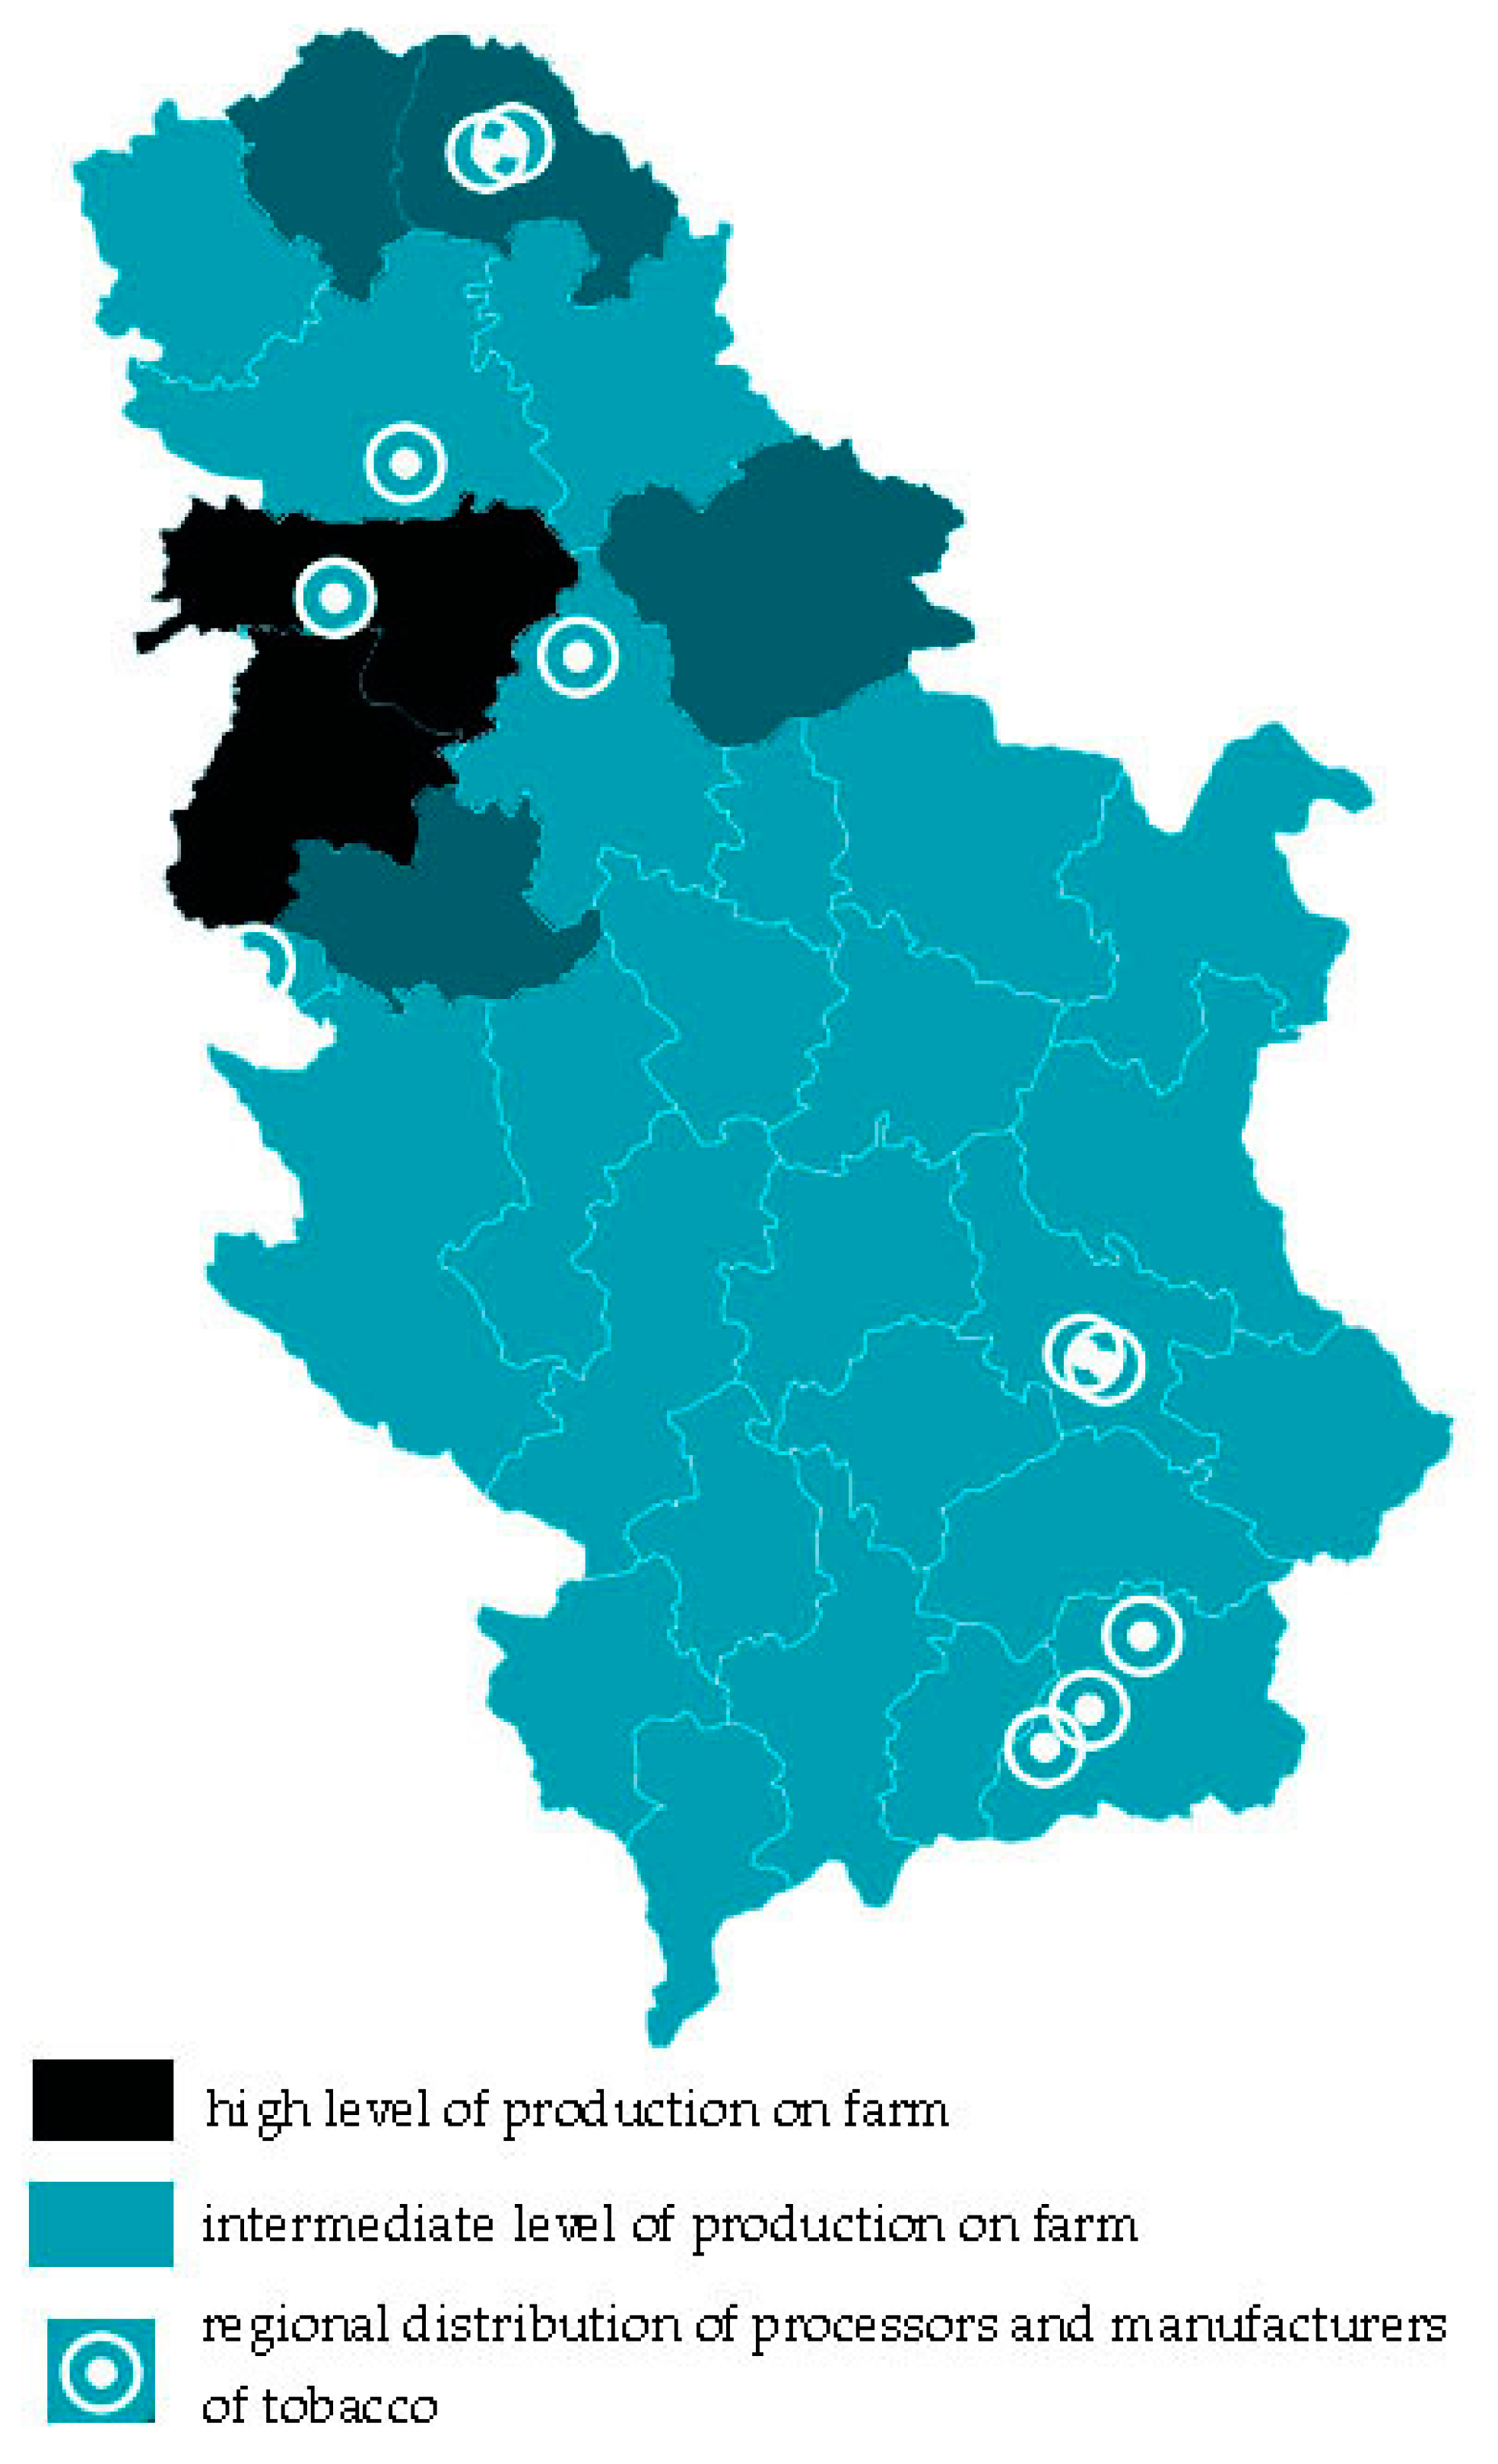
  • The producers are in a poor negotiating position due to market concentration conditioned by the relatively low price of tobacco (Figure A3). Also, according to the Law on Tobacco [6], agricultural farms are obliged to enter a contract with tobacco processors and to sell tobacco to processors by the end of the current year. This kind of law puts farmers in a worse position than processors because the free sale of tobacco on the market is impossible.
  • As already mentioned, farms perform the process of drying and packaging tobacco, which requires additional capital investments to purchase dryers. The energy consumption for drying is relatively high (natural gas is used most often), which increases production costs, especially in cases of shocks in the energy market, which was a characteristic of the observed period.
  • Tobacco production requires a relatively large number of seasonal workers, which is a limiting factor. With the economic development in Serbia, there has been a significant labor force migration toward industry, while specific technological solutions are still expensive for producers. Indeed, reducing the number of farms is a characteristic of Serbian agriculture in the transition period, which also affected the tobacco production sector.
Market concentration is of great importance over the long-term because of its potential impact on welfare losses, primarily due to the manipulative abilities of oligopoly/oligopsony participants to influence input and output prices to a large extent and thereby earn large profit margins. Currently, global corporations are the primary parties in the tobacco products industry. In Serbia, the production of tobacco products is influenced by a group of 12 actors. These entities possess a competitive advantage in terms of pricing policies and compliance with legislation relating to tobacco quality and safety, thereby making it more challenging for smaller businesses to thrive in this industry.
The results of the panel regression analysis demonstrate that the changes in the level of concentration measured by the HHI have a significant and negative effect on the performance of firms in terms of profitability. These results are in accordance with previous research conducted on Serbian markets [27,28]. This relationship may be based on particular circumstances. First, in a market that is concentrated, the number of competitors is limited, resulting in less rivalry between companies. Consequently, the incentive to engage in innovation, product differentiation, or price competition is reduced. Thus, companies might show an impression of self-satisfaction, resulting in lost actions toward enhancing productivity, minimizing expenses, or providing higher-quality products or services. Therefore, the absence of competition could limit a company’s will to enhance its profitability. Furthermore, concentrated markets result in increased market power of the leading companies. In instances where a limited number of companies hold a substantial portion of the market, they possess greater power in determining prices and managing supply chains. In this way, the dominance of large participants could limit the profitability of smaller market actors. The adverse relationship between the HHI and firm profitability could also be attributed to the presence of hidden expenses resulting from significant investments in fixed capital in earlier periods that become technologically obsolete. This phenomenon could lead companies to become captured in low profitability without new investments, especially in R&D.
The consumption of cigarettes is very high in Serbia, creating a high domestic demand. In the case of other products, this indicates a great potential for developing this sector. However, as tobacco products are harmful to health, government policy must focus on measures that will reduce consumption. Vladisavljevic et al. [5] estimated a negative cigarette price elasticity (−0.639) for Serbia, which suggests that tobacco tax policy could be used effectively to reduce cigarette consumption in Serbia, which could lower the harmful health effects of cigarettes. Also, it indicates that increasing tobacco taxes could have positive fiscal effects, as the expected revenue from the taxes would increase. As O’Rourke and Djukic [73] concluded, Serbia had embarked on a legislative and regulatory path toward greater tobacco control, but implementation and enforcement are still lax. They also emphasized that increased government interventions are needed to reduce the prevalence of smoking in the population.
Regarding competitiveness, the analysis of revealed comparative advantages indicates slight comparative advantages in the world market. Of the countries with which Serbia carries out the most significant part of the total foreign trade exchange of agri-food products when it comes to tobacco, slight comparative advantages can be observed in the market of the CEFTA region. Viewed individually, of the 12 analyzed processors and manufacturers, PMI is by far the largest exporter (over 58% of the total export of tobacco products in 2022), and the export destination with the largest share of exports is Algeria [74]. Additional improvements in productivity and efficiency will be very important, together with agricultural modernization, since they are crucial in the process of improving competitiveness and future sustainable development [75].
When analyses of production, processing, consumption, and foreign trade of tobacco and tobacco products are taken into account, certain policy implications can be drawn. In particular, considering the growth of production, the decline in the number of farms, and the decline in prices, the creators of agricultural policy will have a severe task in adjusting support and regulations. In addition, the situation surrounding the concentration in the production of tobacco products must be looked at, and policymakers should look at their potential abuses in the position of oligopoly or oligopsony and react appropriately so that support at the farm level has an adequate effect.

6. Conclusions

Based on the results, it was possible to draw the following conclusions:
  • Serbia was the only country in Europe where tobacco production was increasing. The key reasons were the presence of the largest multinational companies and weaker state regulations than in the EU.
  • The number of farms producing tobacco decreased in the previous period, which, along with the production growth, suggests that the most efficient farms survived on the market. The further survival of these farms was threatened mainly due to a worse negotiating position on the market, which affected the relatively low price of tobacco and the increase in production costs due to the unstable global energy market. One of the solutions is a change in state regulations that will allow farms to sell tobacco freely on the market and encourage the association of producers.
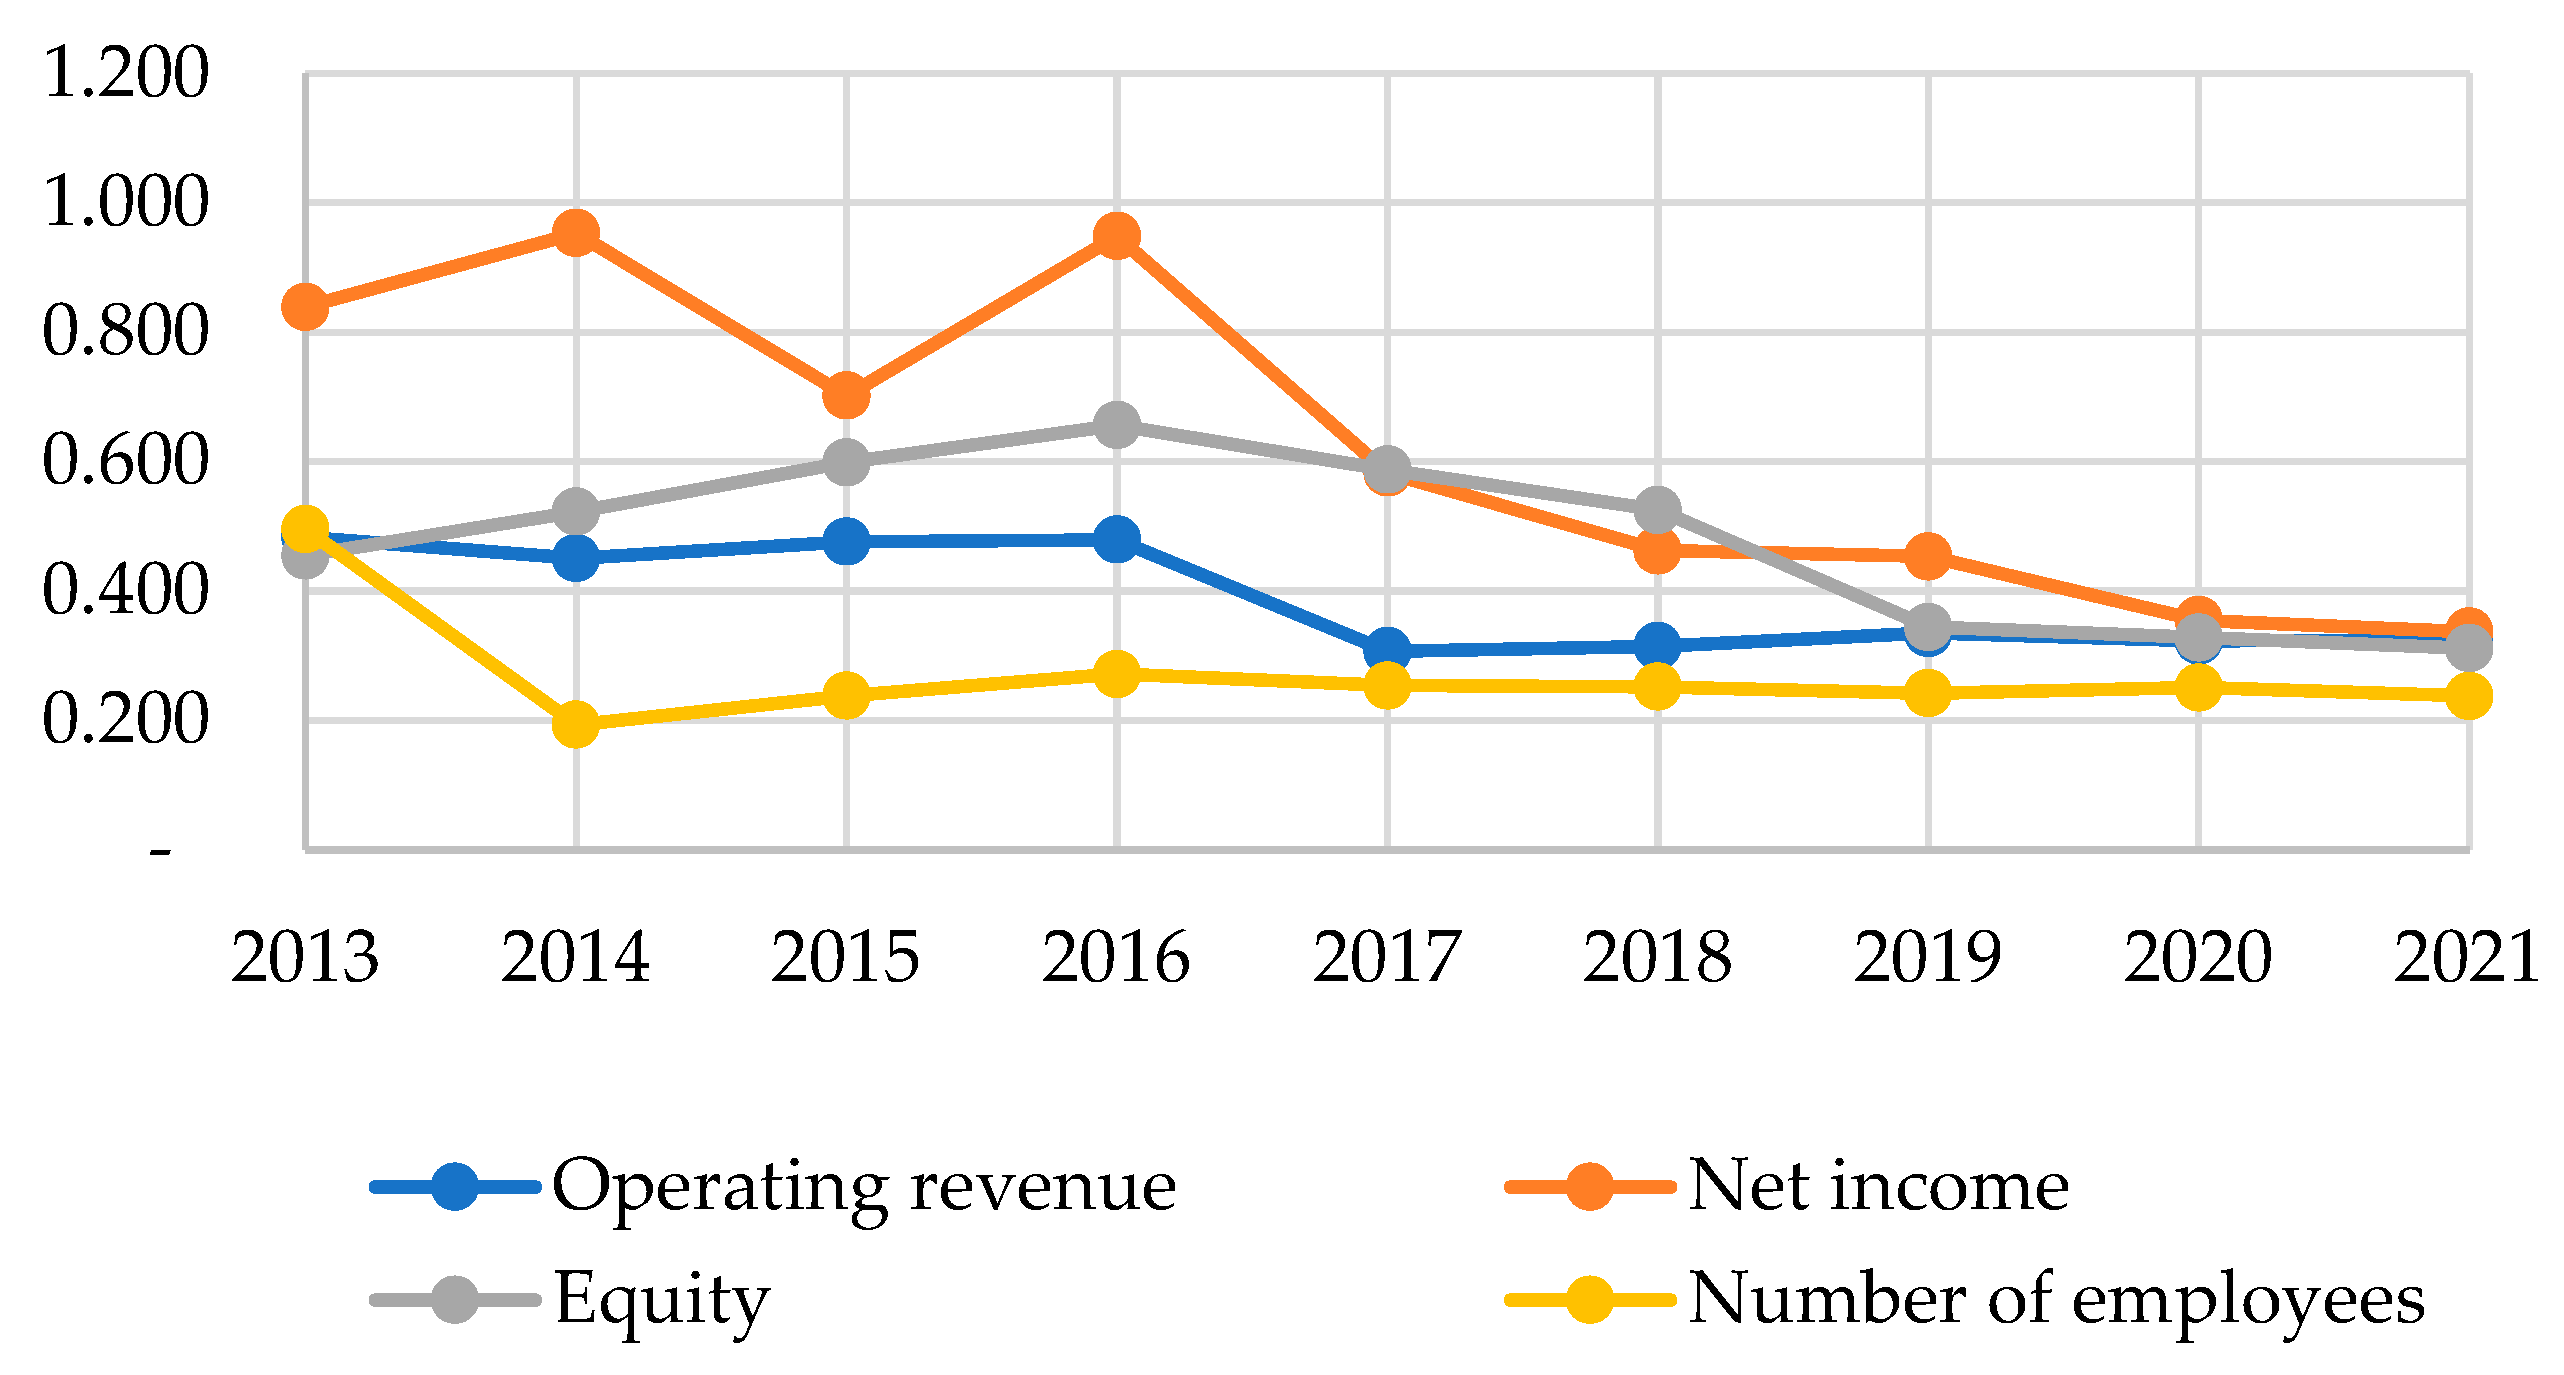
  • There was a high market concentration in the Serbian tobacco industry. In the long term, this can potentially impact welfare losses primarily due to the manipulative abilities of oligopoly or oligopsony participants.
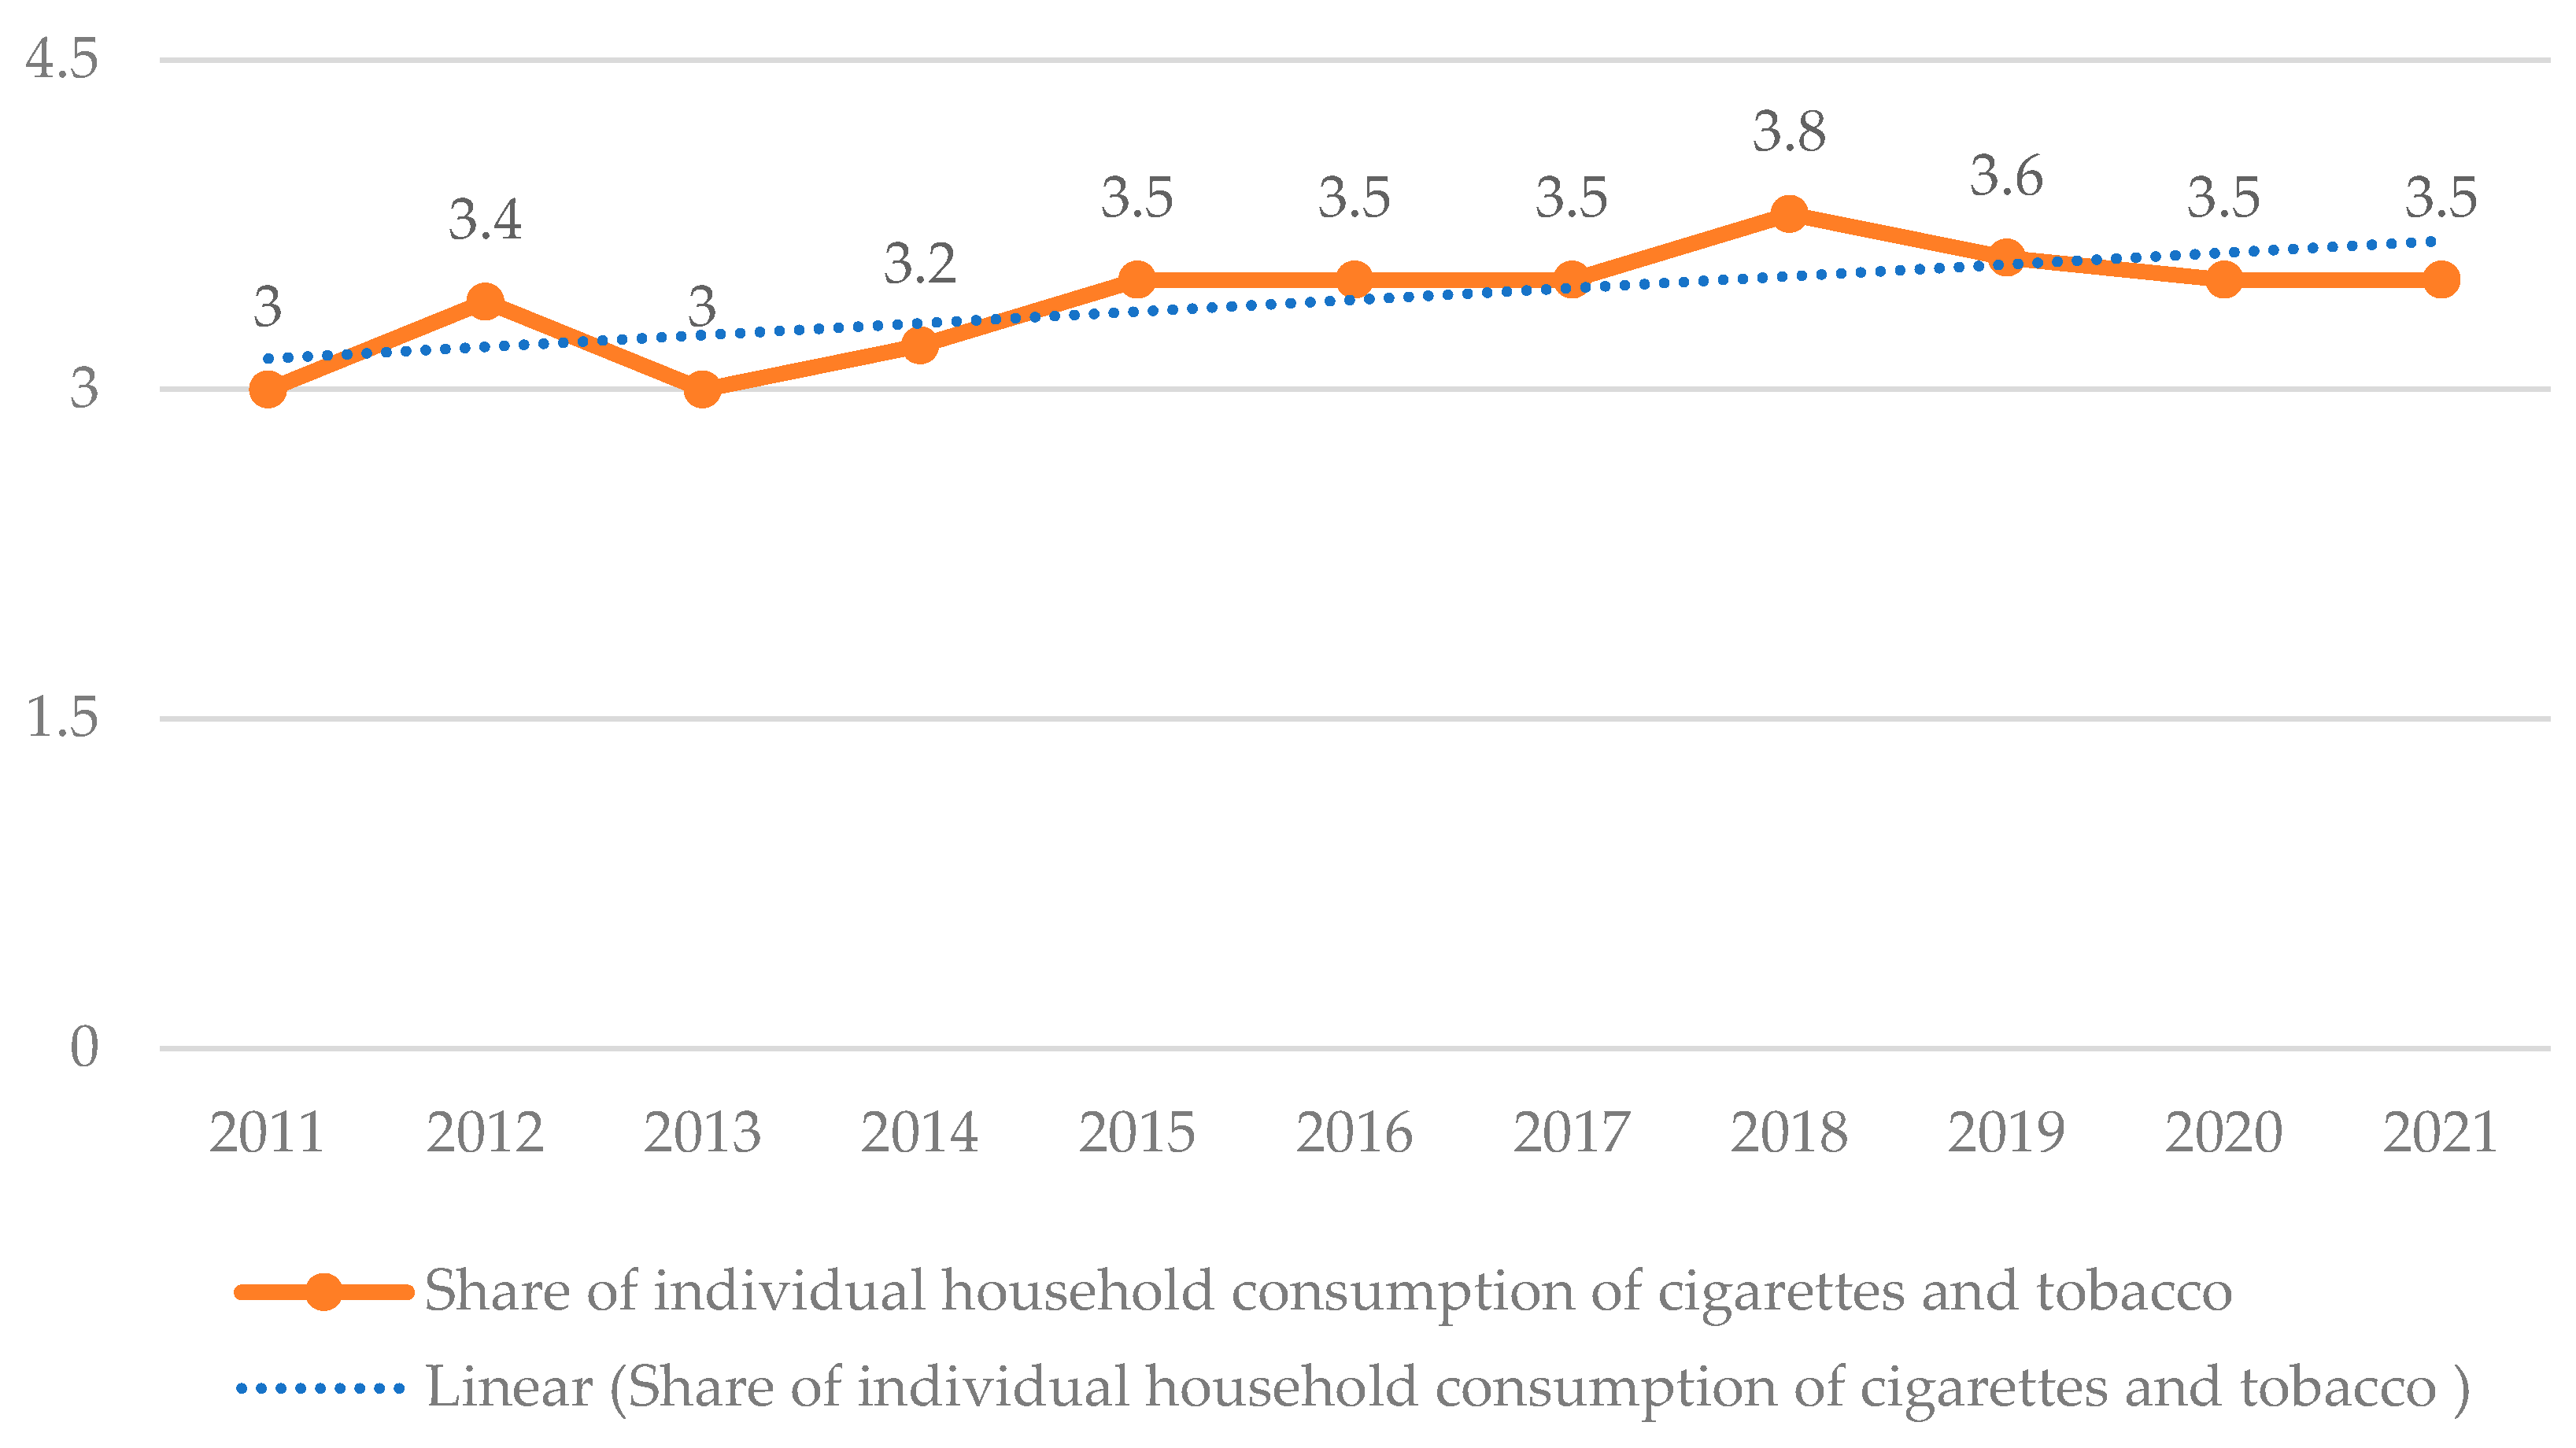
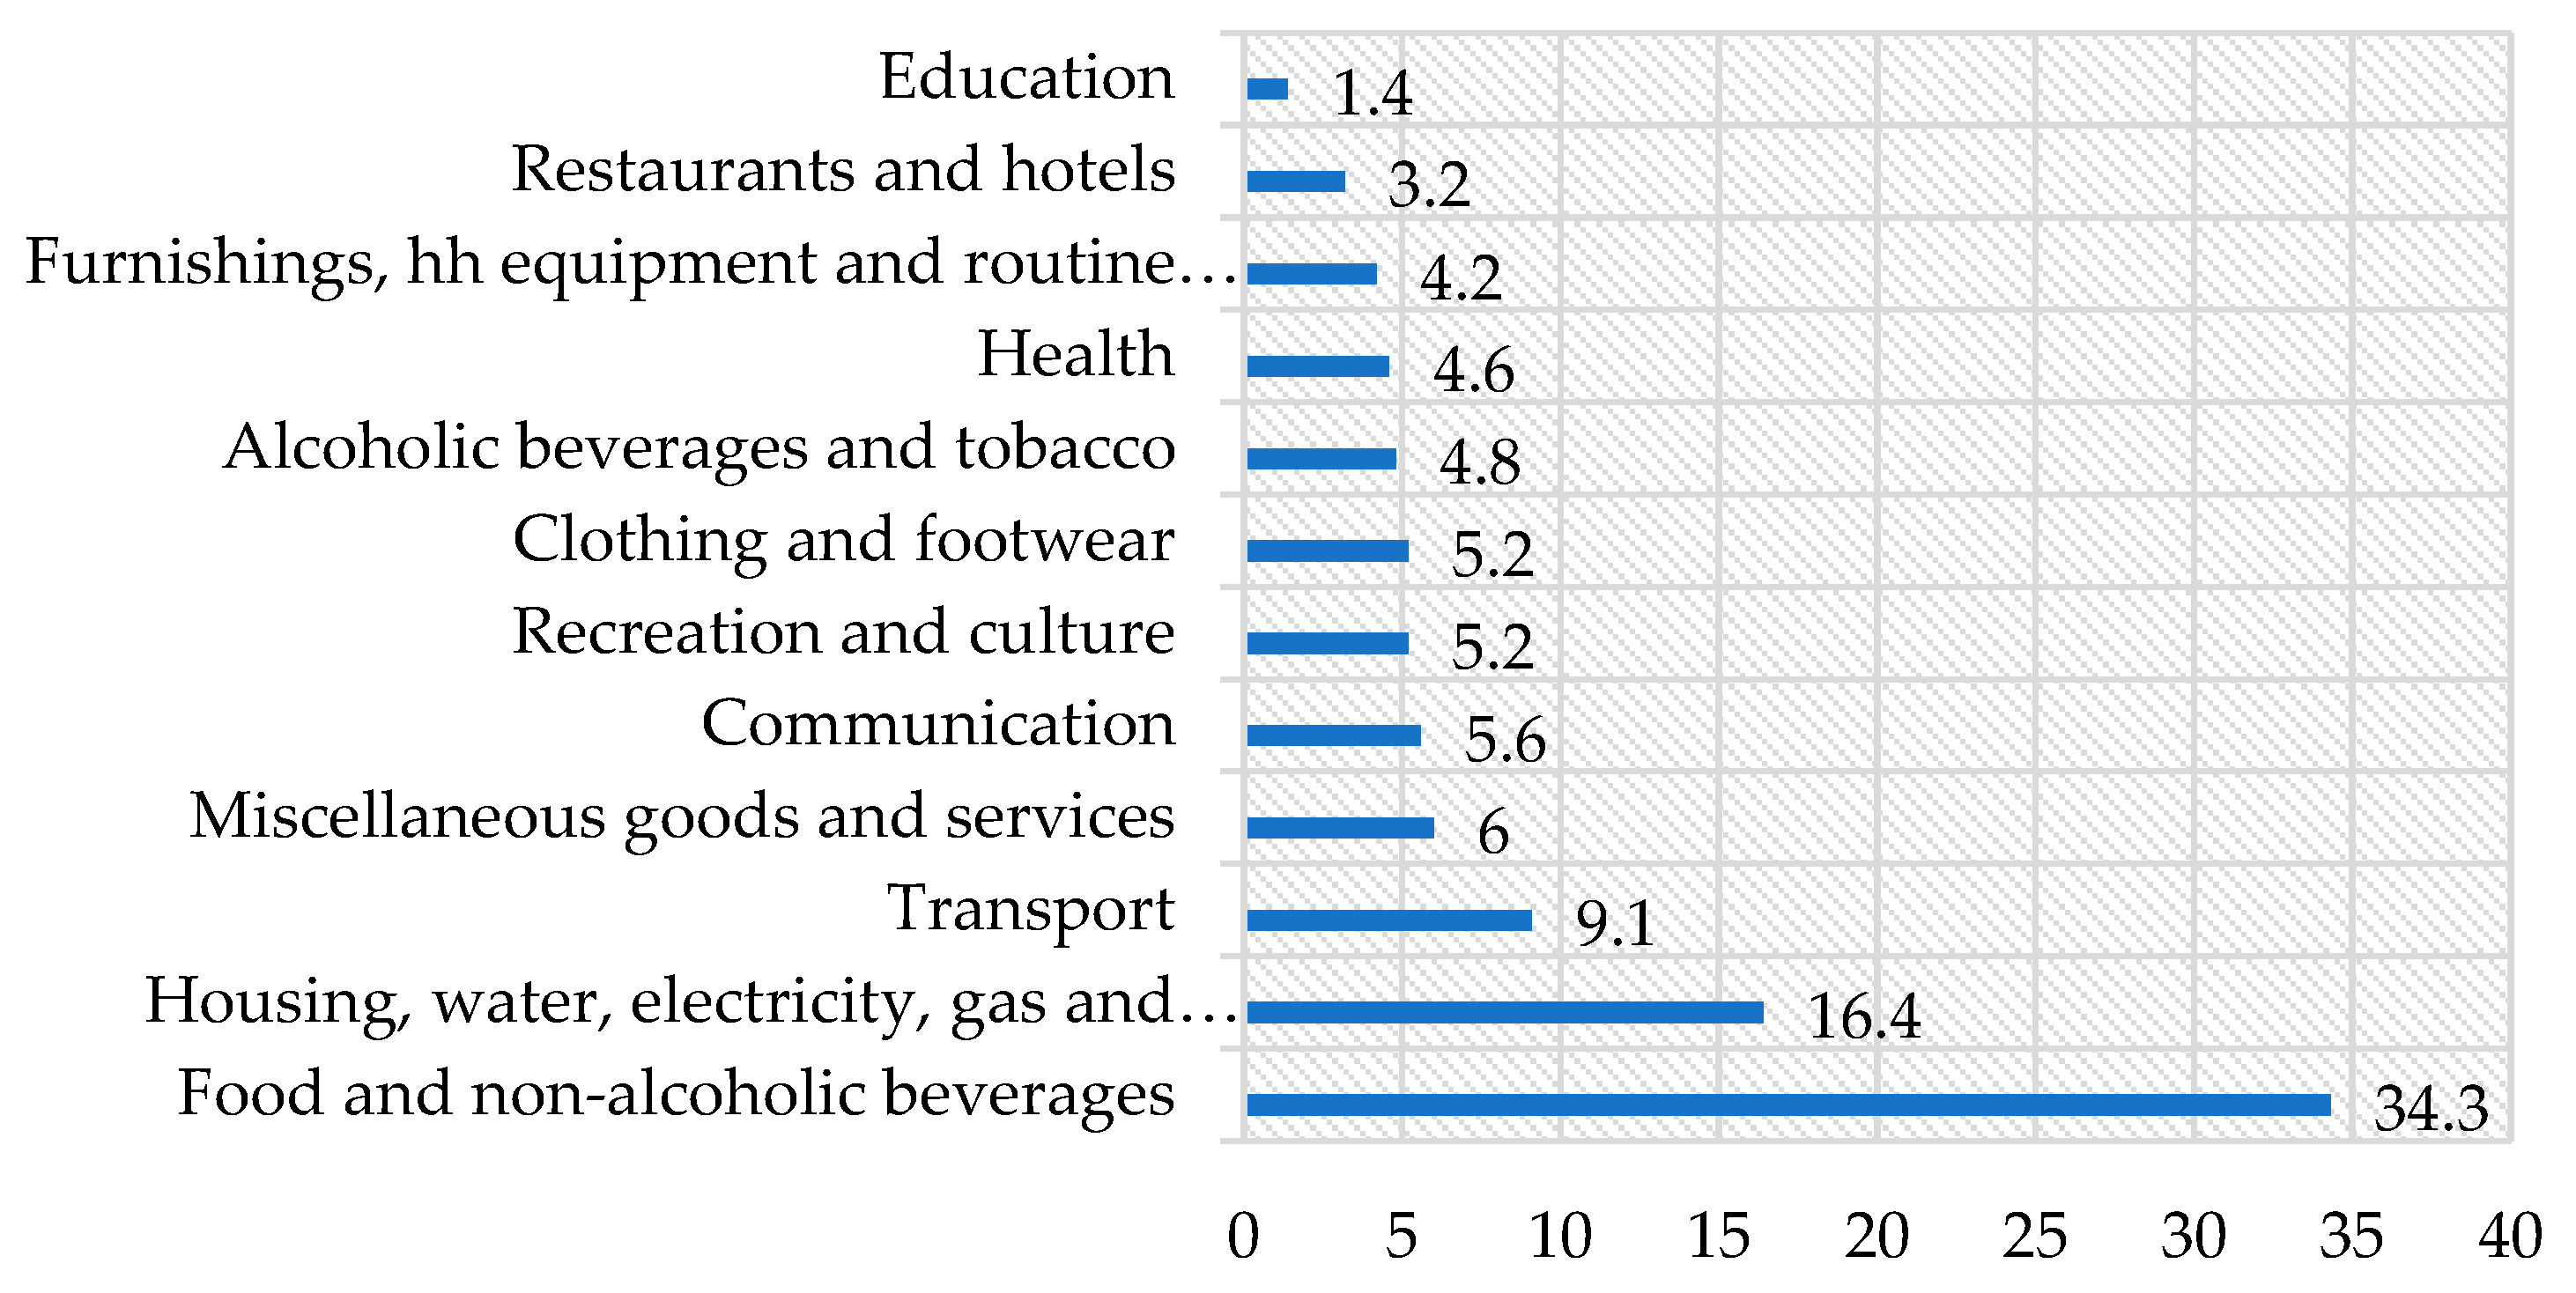
  • The consumption of cigarettes was very high in Serbia. As tobacco products harm health, government policy must focus on measures that will reduce consumption. An adequate tax policy could affect this reduction and provide additional fiscal revenues.
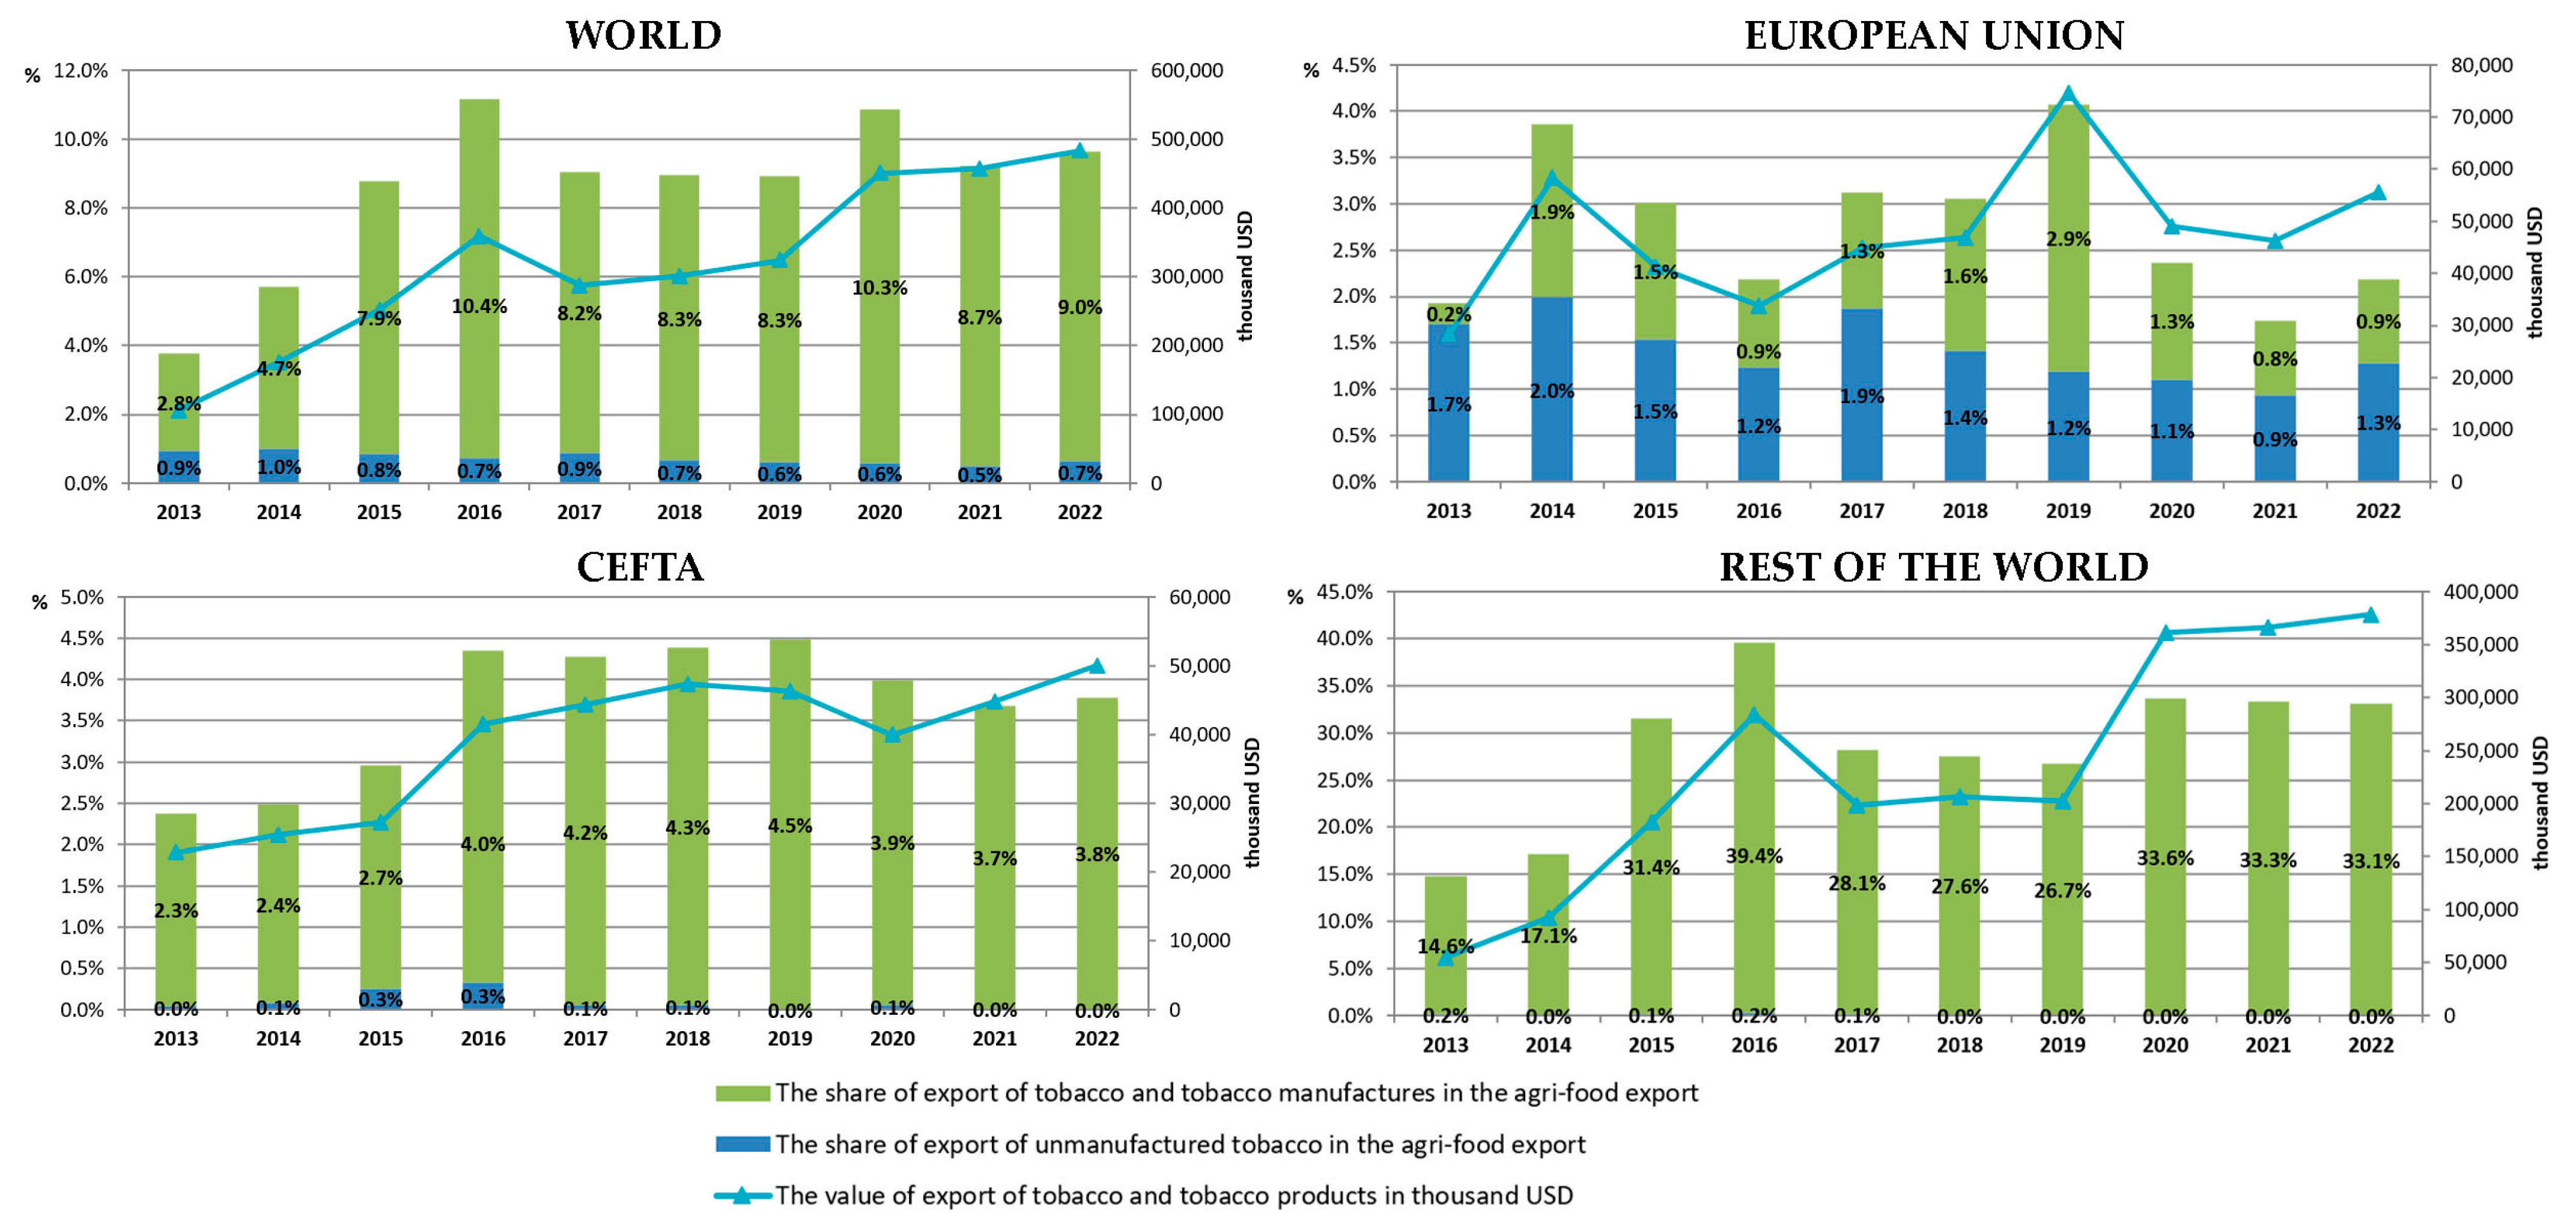
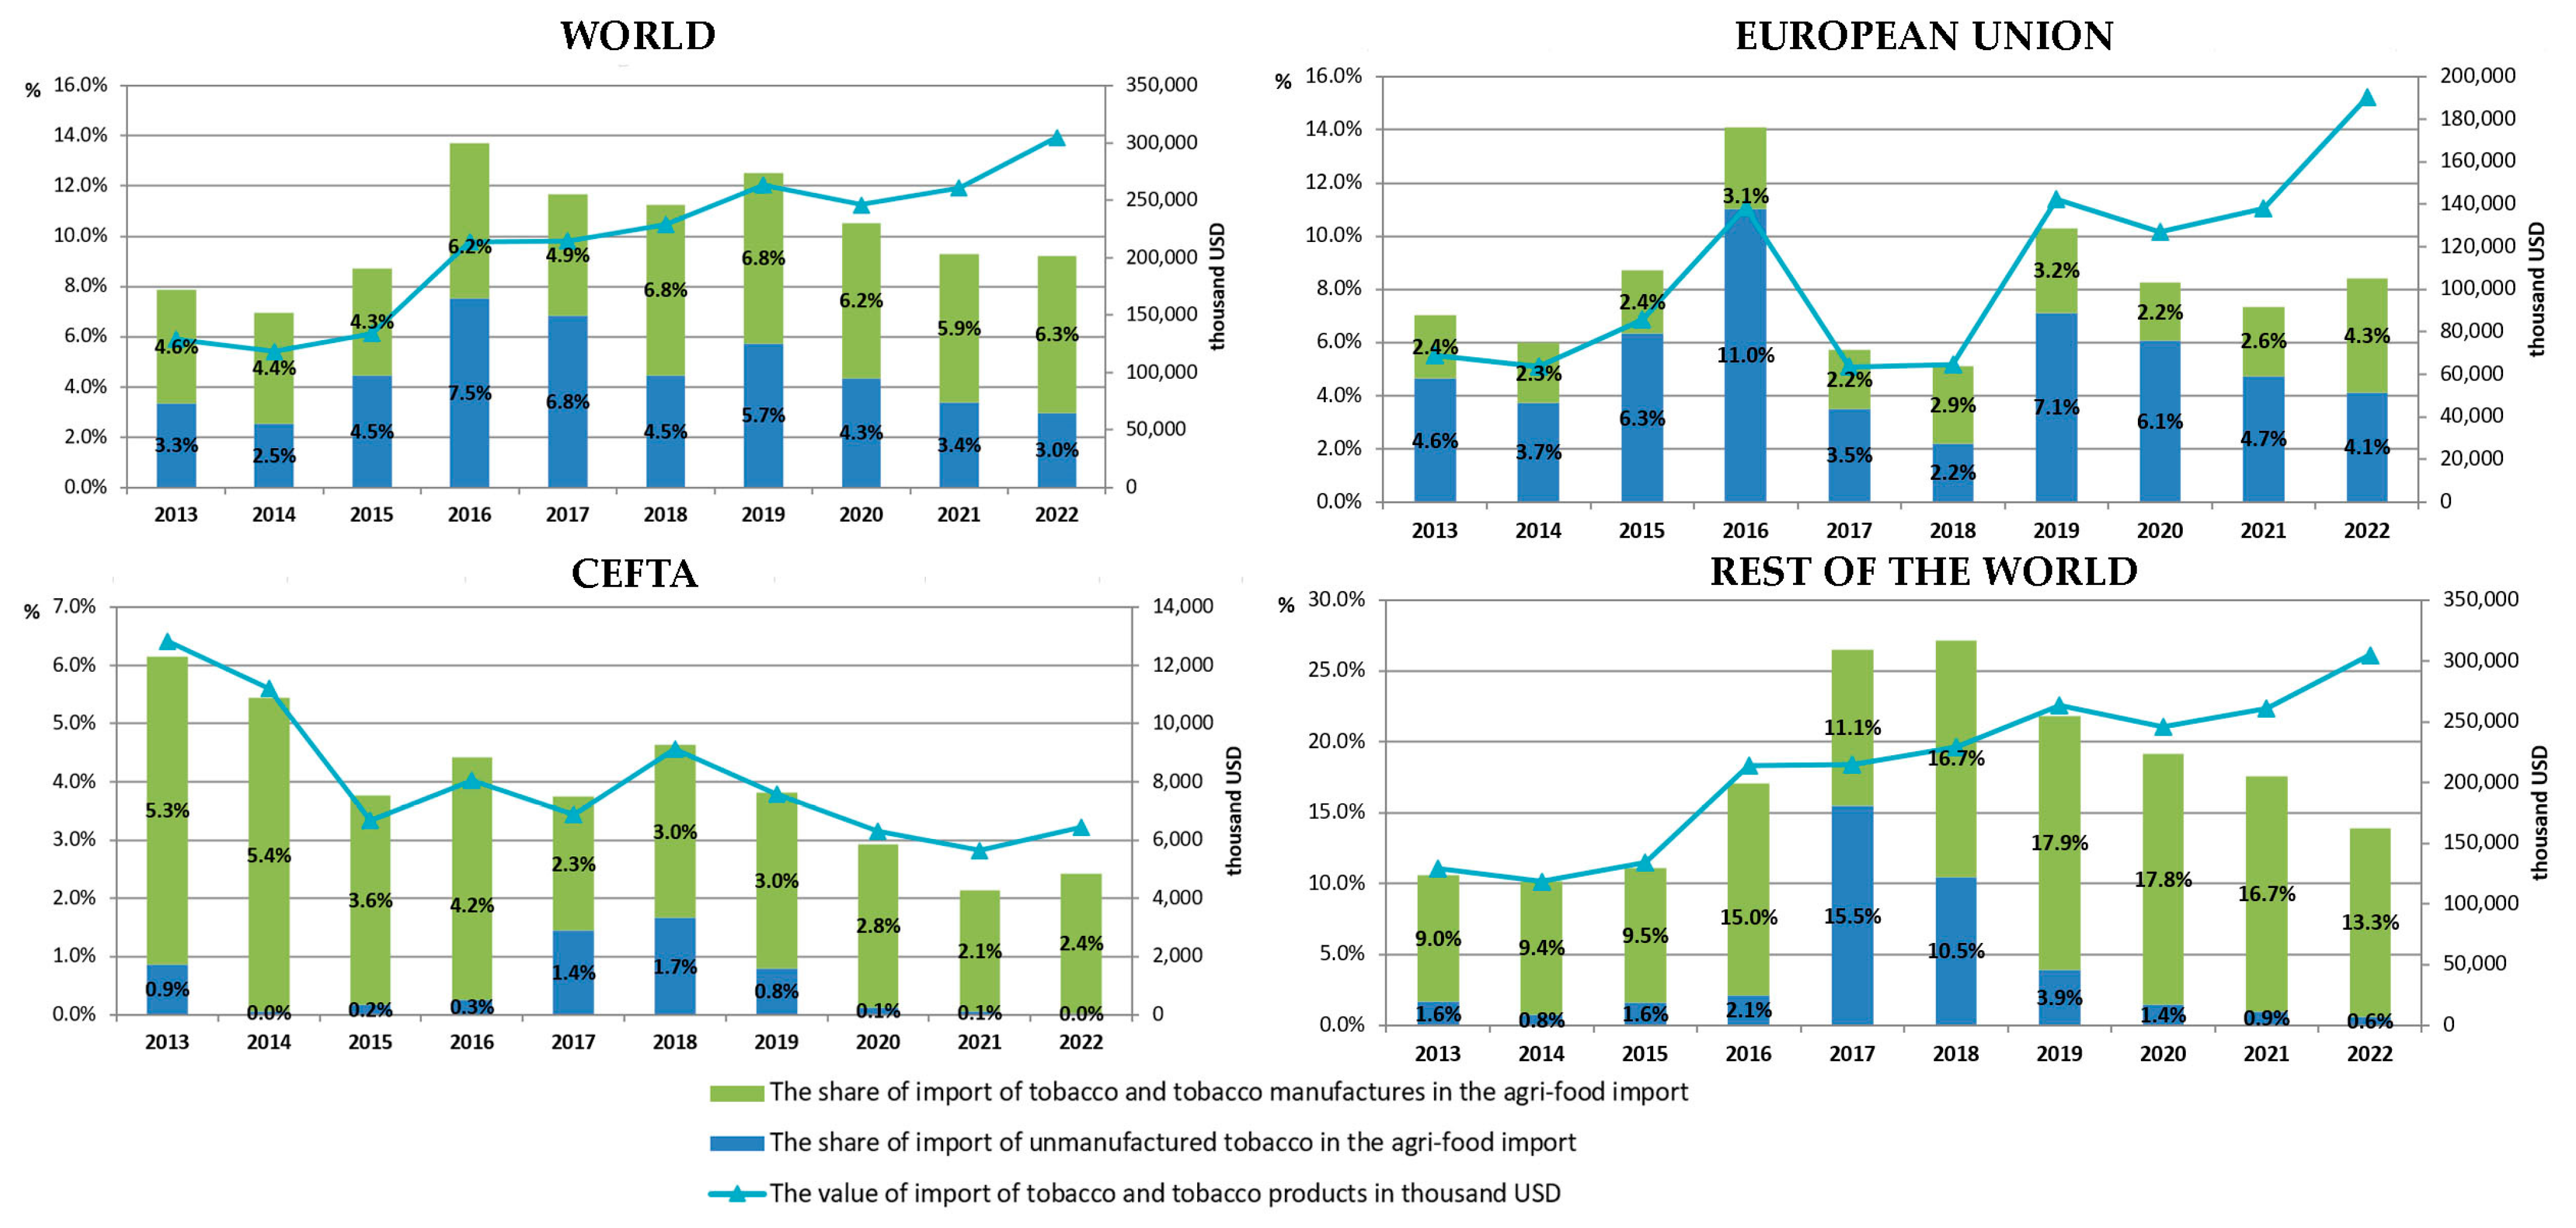
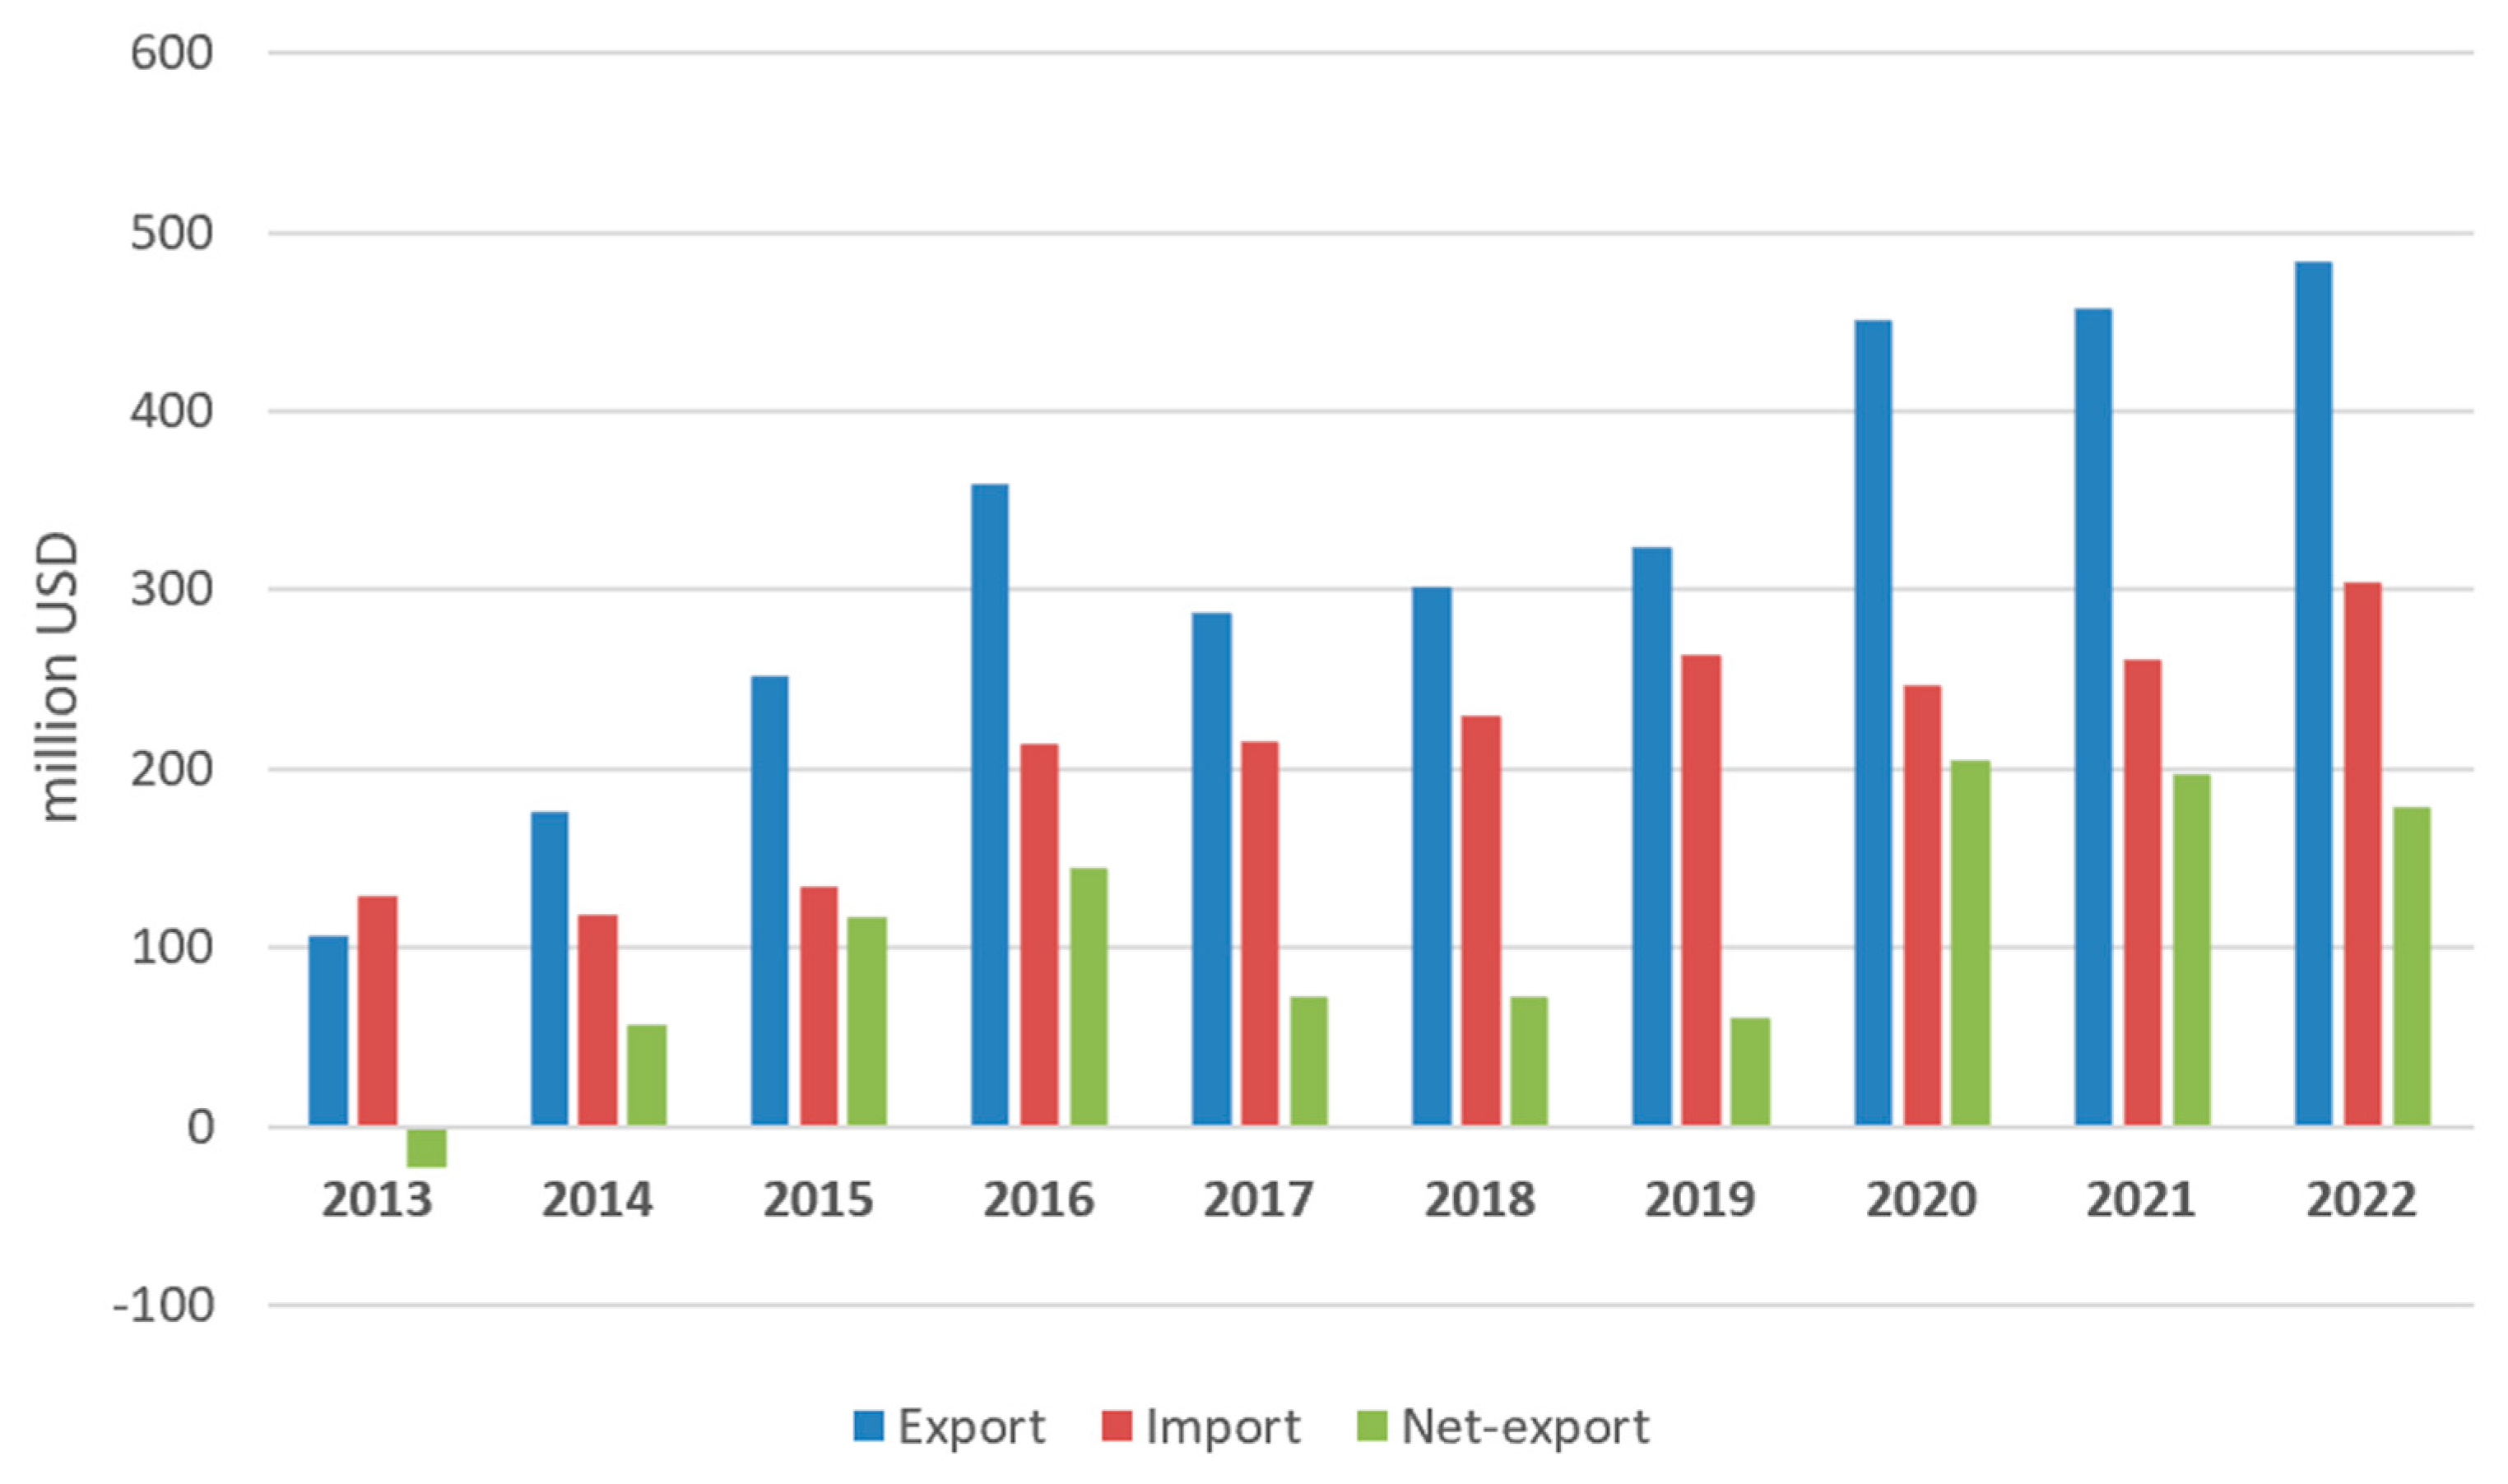
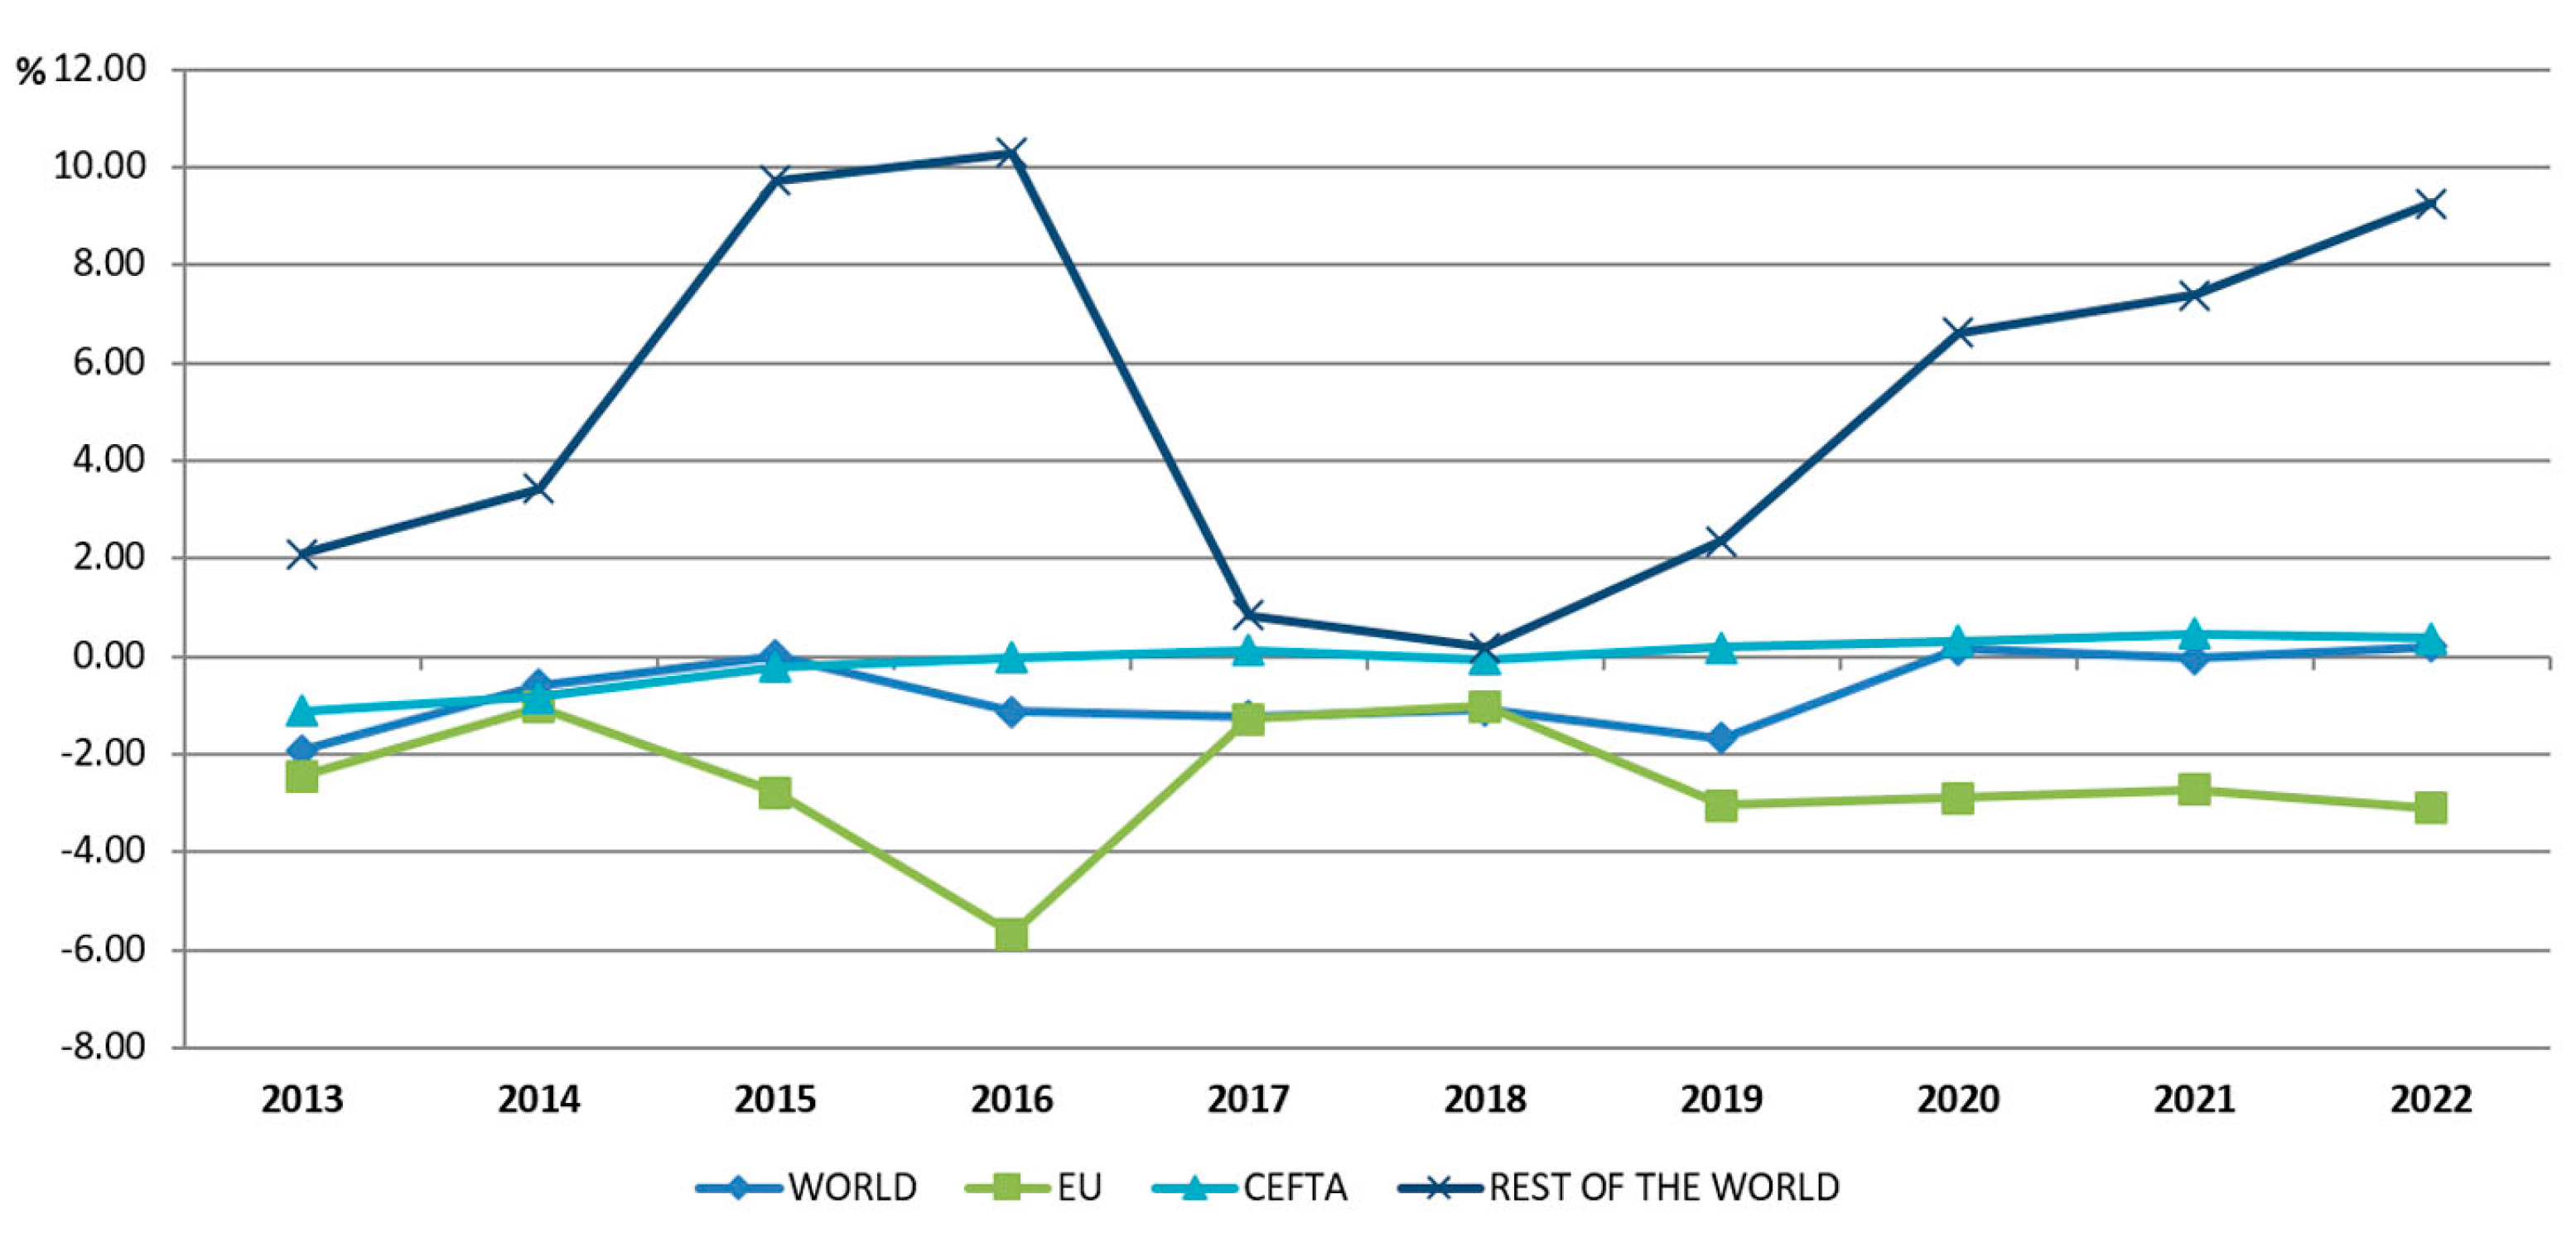
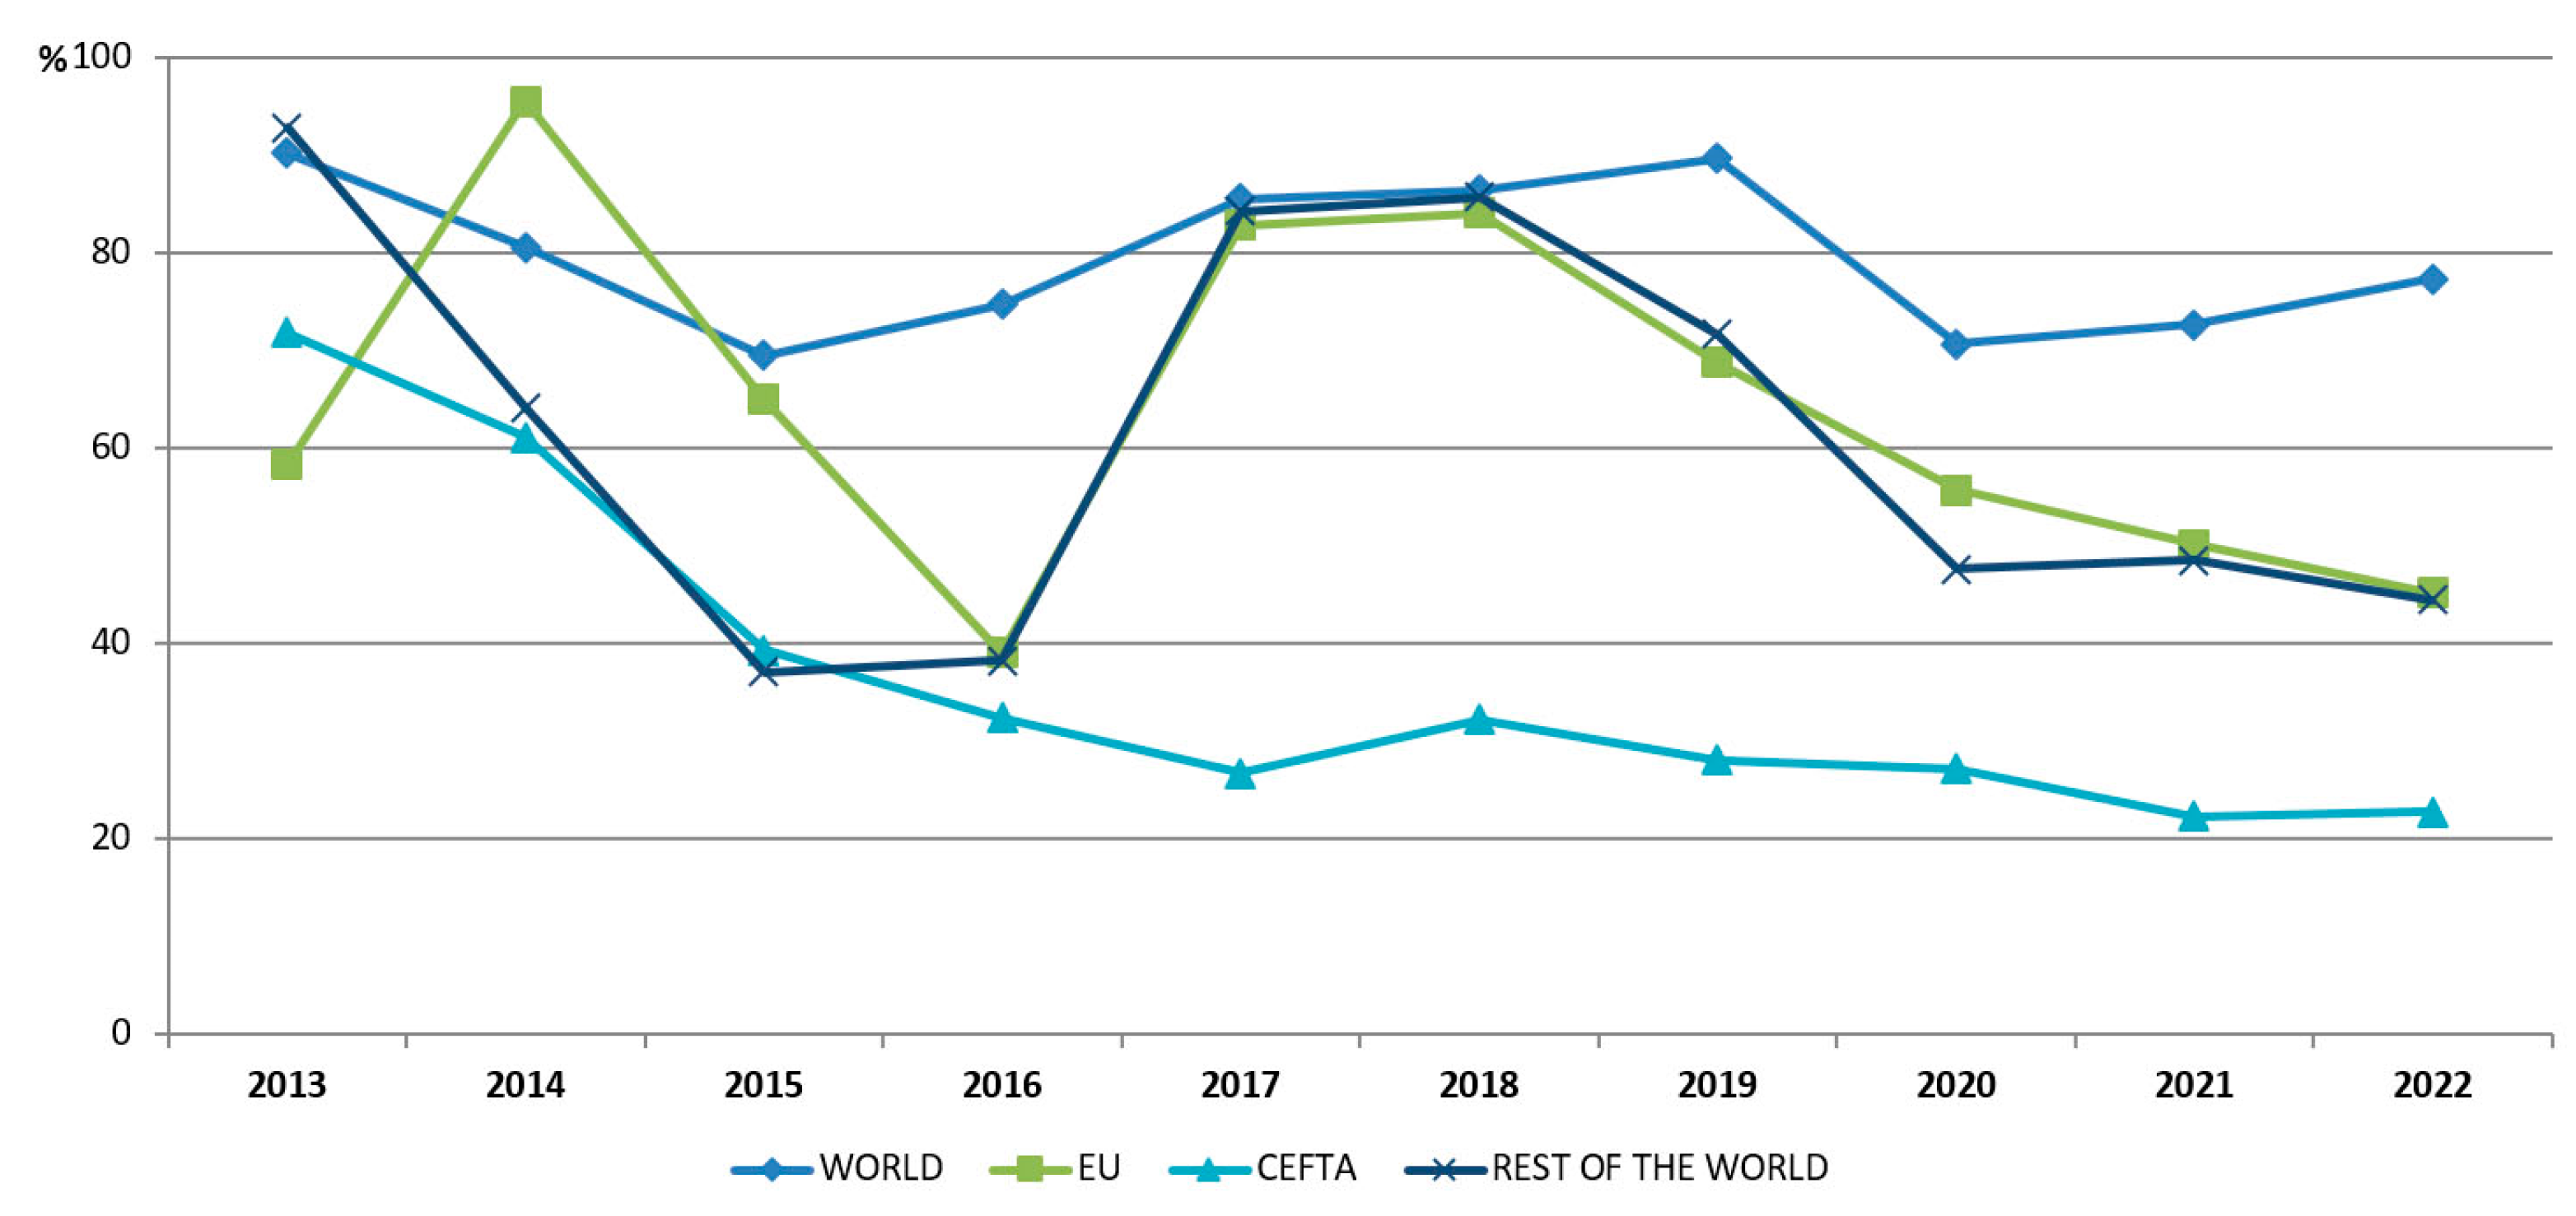
  • Regarding foreign trade, there was a significant intensification, tobacco products were mainly exported to non-traditional markets (Algeria), and exports were dominated by one company—PMI. The tobacco and tobacco products market in Serbia was generally well integrated with the world market, but the level of revealed comparative advantages was low.
The main limitation of this research was the lack of adequate data at the farm level that would indicate the success of their business. Future research will be aimed at eliminating this problem and discovering the key factors contributing to the high consumption of tobacco products in Serbia.

Author Contributions

Conceptualization, T.T., B.M. and D.Đ.; methodology and investigation, T.T., D.Đ. and B.M.; writing—original draft preparation, review and editing, T.T., B.M., D.Đ. and Ž.J.; visualization, B.M. and Ž.J.; supervision, T.T. and Ž.J. All authors read and agreed to the published version of the manuscript.

Funding

This research was supported by the Science Fund of the Republic of Serbia, Program DIASPORA, GRANT No 6406679, AgriNET.

Institutional Review Board Statement

Not applicable.

Informed Consent Statement

Not applicable.

Data Availability Statement

The datasets generated for this study are available on request to the corresponding author.

Conflicts of Interest

The authors declare no conflict of interest.

Appendix A

Figure A1. Regional distribution of the farms and tobacco processors and manufacturers in Serbia. Source: Tobacco Administration of the Republic of Serbia [35] and T.P. Catalyst database [36].
Agriculture 13 01711 g0a1
Figure A2. Structure of individual consumption of household—all households (%) in 2021. Source: Statistical Office of the Republic of Serbia. Household Budget Survey; Statistical Office of the Republic of Serbia: Belgrade, Serbia, 2021 [69].
Agriculture 13 01711 g0a2
Figure A3. Price of tobacco in Serbia (100 = 2013). Source: Statistical Office of the Republic of Serbia. Household Budget Survey; Statistical Office of the Republic of Serbia: Belgrade, Serbia, 2021 [37].
Agriculture 13 01711 g0a3

References

  1. Appau, A.; Drope, J.; Witoelar, F.; Chavez, J.J.; Lencucha, R. Why Do Farmers Grow Tobacco? A Qualitative Exploration of Farmers Perspectives in Indonesia and Philippines. Int. J. Environ. Res. Public Health 2019, 16, 2330. [Google Scholar] [CrossRef]
  2. FAOSTAT. Available online: https://www.fao.org/faostat/en/ (accessed on 16 June 2023).
  3. Gallus, S.; Borroni, E.; Odone, A.; van den Brandt, P.A.; Gorini, G.; Spizzichino, L.; Pacifici, R.; Lugo, A. The Role of Novel (Tobacco) Products on Tobacco Control in Italy. Int. J. Environ. Res. Public Health 2021, 18, 1895. [Google Scholar] [CrossRef]
  4. Crop Productions and Plant-Based Products. Available online: https://agriculture.ec.europa.eu/farming/crop-productions-and-plant-based-products_en (accessed on 10 June 2023).
  5. Vladisavljevic, M.; Zubović, J.; Đukić, M.; Jovanović, O. Tobacco Price Elasticity in Serbia: Evidence from a Middle-Income Country with High Prevalence and Low Tobacco Prices. Tob. Control 2020, 29 (Suppl. S5), s331–s336. [Google Scholar] [CrossRef] [PubMed]
  6. Official Gazette of the Republic of Serbia. Zakon o Duvanu. Available online: https://www.paragraf.rs/propisi/zakon_o_duvanu.html (accessed on 10 June 2023).
  7. Statistical Office of Republic of Serbia. Statistical Yearbook. Available online: https://publikacije.stat.gov.rs/G2022/PdfE/G20222055.pdf (accessed on 5 June 2023).
  8. Statistical Office of Republic of Serbia. Statistical Calendar of Republic of Serbia 2023. Available online: https://publikacije.stat.gov.rs/G2023/Pdf/G202317016.pdf (accessed on 5 June 2023).
  9. Zubović, J.; Đukić, J.; Jovanović, O. Economic Aspects of Tobacco Control and Empirical Findings in Serbia; Institute of Economic Science: Belgrade, Republic of Serbia, 2020; Volume 180–181. [Google Scholar]
  10. Official Gazette of the Republic of Serbia no. 121/2021 and 18/2022). Uredba o Usklađivanju Nomenklature Carinske Tarife za 2022. Godinu. Available online: https://www.mfin.gov.rs/propisi/uredba-o-usklaivanju-nomenklature-carinske-tarife-za-2022-godinu-slubeni-glasnik-rs-broj-12121 (accessed on 5 June 2023).
  11. Appau, A.; Drope, J.; Goma, F.; Magati, P.; Labonte, R.; Makoka, D.; Zulu, R.; Li, Q.; Lencucha, R. Explaining Why Farmers Grow Tobacco: Evidence From Malawi, Kenya, and Zambia. Nicotine Tob. Res. 2020, 22, 2238–2245. [Google Scholar] [CrossRef] [PubMed]
  12. Chingosho, R.; Dare, C.; Walbeek, C. van. Tobacco Farming and Current Debt Status among Smallholder Farmers in Manicaland Province in Zimbabwe. Tob. Control 2021, 30, 610–615. [Google Scholar] [CrossRef]
  13. Rahman, M.S.; Ahmed, N.A.M.F.; Ali, M.; Abedin, M.M.; Islam, M.S. Determinants of Tobacco Cultivation in Bangladesh. Tob. Control 2020, 29, 692–694. [Google Scholar] [CrossRef]
  14. Bertollini, R.; Ribeiro, S.; Mauer-Stender, K.; Galea, G. Tobacco Control in Europe: A Policy Review. Eur. Respir. Rev. Off. J. Eur. Respir. Soc. 2016, 25, 151–157. [Google Scholar] [CrossRef]
  15. Straarup, M.S.; O’Donovan, F.; Lambrou, A.; Weber, C.; Gebetsberger-Hartleitner, I.; Solimini, R.; Labarbe, B.; Lange, C.C.; Stærmose, S.; Staal, Y.C.M.; et al. The Joint Action on Tobacco Control: A Cooperation Project for Strengthening Tobacco Control in Europe. Tob. Prev. Cessat. 2022, 8, 26. [Google Scholar] [CrossRef]
  16. Matkovski, B.; Đokić, D. Podrška Proizvodnji Duvana u Srbiji. Agroekonomika 2014, 43, 154–164. [Google Scholar]
  17. Matkovski, B.; Kalaš, B.; Zekić, S.; Jeremić, M. Agri-Food Competitiveness in South East Europe. Outlook Agric. 2019, 48, 326–335. [Google Scholar] [CrossRef]
  18. Matkovski, B.; Zekić, S.; Đokić, D.; Jurjević, Ž.; Đurić, I. Export Competitiveness of Agri-Food Sector during the EU Integration Process: Evidence from the Western Balkans. Foods 2022, 11, 10. [Google Scholar] [CrossRef]
  19. Božić, D.; Nikolić, M. Foreign Trade and Comparative Advantages of Agrarian Sector of Serbia and Neighboring Countries. Ekon. Poljopr. 2019, 66, 737–753. [Google Scholar] [CrossRef]
  20. Tuna, E.; Georgiev, N.; Nacka, M. Competitiveness Analysis of the Tobacco Sub-Sector in the Republic of Macedonia. Agroecon. Croat. 2013, 3, 53–60. [Google Scholar]
  21. Zekić, S.; Matkovski, B.; Đokić, D.; Kleut, Ž. Competitiveness of Tobacco and Tobacco Products: The Case of Serbia. Custos E Agronegocio 2016, 12, 191–211. [Google Scholar]
  22. Božić, D.; Nikolić, M.M. Obeležja Spoljnotrgovinske Razmene Poljoprivredno-Prehrambenih Proizvoda Srbije: Characteristics of Serbian Foreign Trade of Agricultural and Food Products. Marketing 2016, 47, 293–304. [Google Scholar] [CrossRef]
  23. Matkovski, B.; Lovre, K.; Zekic, S. The Foreign Trade Liberalization and Export of Agri-Food Products of Serbia. Agric. Econ. Zemědělská Ekon. 2017, 63, 331–345. [Google Scholar] [CrossRef]
  24. Birovljev, J.; Matkovski, B.; Ćetković, B. The Competitiveness of the Serbian Agri-Food Products on the Market of Countries in the Region. Anali Ekon. Fak. U Subotici 2015, 33, 61–78. [Google Scholar]
  25. Blažková, I. Convergence of Market Concentration: Evidence from Czech Food Processing Sectors. Agris Line Pap. Econ. Inform. 2016, 4, 25–36. [Google Scholar] [CrossRef]
  26. Swinnen, J.F.M.; Vandeplas, A. Market Power and Rents in Global Supply Chains. Agric. Econ. 2010, 41, 109–120. [Google Scholar] [CrossRef]
  27. Vuković, B.; Mijić, K.; Spahić, N. Concetracion of Tobacco Market: Evidence from Serbia. Econ. Agric. 2015, 62, 385–398. [Google Scholar] [CrossRef]
  28. Mirović, V.; Andrašić, J.; Kalaš, B. Impact of the Market Concentration on Trading Chains’ Performance in Serbia. Šk. Biznisa 2019, 1, 1–14. [Google Scholar] [CrossRef]
  29. Pjanić, M.; Vuković, B.; Mijić, K. Analysis of the Market Concentration of Agricultural Enterprises in AP Vojvodina. Strateg. Manag. 2018, 23, 40–45. [Google Scholar] [CrossRef]
  30. Kastratović, R.; Lončar, D.; Milošević, S. Market concentration and profitability: The empirical evidence from Serbian manufacturing industry. Zb. Rad. Ekon. Fak. U Rijeci Časopis Za Ekon. Teor. Praksu 2019, 37, 213–233. [Google Scholar] [CrossRef]
  31. Grullon, G.; Larkin, Y.; Michaely, R. Are U.S. Industries Becoming More Concentrated? Rev. Financ. 2018, 23, 697–743. [Google Scholar] [CrossRef]
  32. Flor, L.S.; Reitsma, M.B.; Gupta, V.; Ng, M.; Gakidou, E. The Effects of Tobacco Control Policies on Global Smoking Prevalence. Nat. Med. 2021, 27, 239–243. [Google Scholar] [CrossRef]
  33. WHO Report on the Global Tobacco Epidemic 2021: Addressing New and Emerging Products. Available online: https://www.who.int/publications-detail-redirect/9789240032095 (accessed on 10 June 2023).
  34. Nargis, N.; Stoklosa, M.; Shang, C.; Drope, J. Price, Income, and Affordability as the Determinants of Tobacco Consumption: A Practitioner’s Guide to Tobacco Taxation. Nicotine Tob. Res. 2021, 23, 40–47. [Google Scholar] [CrossRef]
  35. Ministry of Finance, Republic of Serbia. Website. Tobacco Administration. Available online: https://www.duvan.gov.rs/ (accessed on 20 June 2023).
  36. TP Catalyst. Database. Available online: https://tpcatalyst.bvdinfo.com/202305/version-20230602092050/TpCatalyst/Companies/Login?returnUrl=%2F202305%2Fversion-20230602092204%2FTpCatalyst%2FCompanies (accessed on 20 June 2023).
  37. Statistical Office of the Republic of Serbia. Database. Available online: https://www.stat.gov.rs/en-US/ (accessed on 20 May 2023).
  38. Standard International Trade Classification. United Nations Statistics Division—Trade Statistics. Available online: https://unstats.un.org/unsd/trade/sitcrev4.htm (accessed on 1 July 2023).
  39. Krstić, M.; Gawel, A. Improving the competitiveness—Determinants and solutions for quality of local business conditions. Int. J. Qual. Res. 2023, 17, 529–554. [Google Scholar] [CrossRef]
  40. Balassa, B. Trade Liberalisation and “Revealed” Comparative Advantage1. Manch. Sch. 1965, 33, 99–123. [Google Scholar] [CrossRef]
  41. Lafay, G. The Measurement of Revealed Comparative Advantages. In International Trade Modelling; Springer: Berlin/Heidelberg, Germany, 1992. [Google Scholar]
  42. Matkovski, B.; Zekić, S.; Jurjević, Ž.; Đokić, D. The Agribusiness Sector as a Regional Export Opportunity: Evidence for the Vojvodina Region. Int. J. Emerg. Mark. 2021, 17, 2468–2489. [Google Scholar] [CrossRef]
  43. Burianová, J.; Belová, A. The Competitiveness of Agricultural Foreign Trade Commodities of the CR Assessed by Way of the Lafay Index. Agris Line Pap. Econ. Inform. 2012, 4, 27–36. [Google Scholar]
  44. Grubel, H.G.; Loyd, P.J. Intra-Industry Trade: The Theory and Measurement of International Trade in Differentiated Product. Econ. J. 1975, 85, 646–648. [Google Scholar]
  45. Hou, K.; Robinson, D.T. Industry Concentration and Average Stock Returns. J. Financ. 2006, 61, 1927–1956. [Google Scholar] [CrossRef]
  46. Lado-Sestayo, R.; Otero-González, L.; Vivel-Búa, M.; Martorell-Cunill, O. Impact of Location on Profitability in the Spanish Hotel Sector. Tour. Manag. 2016, 52, 405–415. [Google Scholar] [CrossRef]
  47. Krivokapic, R.; Njegomir, V.; Stojic, D. Effects of Corporate Diversification on Firm Performance: Evidence from the Serbian Insurance Industry. Econ. Res. Ekon. Istraživanja 2017, 30, 1224–1236. [Google Scholar] [CrossRef]
  48. Stojanović, B.; Kostić, M. Competition Policy and the Impact of Market Structure on Companies’ Profitability. Ekon. Preduz. 2013, 61, 325–338. [Google Scholar] [CrossRef]
  49. Vojinović, Ž.; Milutinović, S.; Sertić, D.; Leković, B. Determinants of Sustainable Profitability of the Serbian Insurance Industry: Panel Data Investigation. Sustainability 2022, 14, 5190. [Google Scholar] [CrossRef]
  50. Arian, A.; Sands, J.; Tooley, S. Industry and Stakeholder Impacts on Corporate Social Responsibility (CSR) and Financial Performance: Consumer vs. Industrial Sectors. Sustainability 2023, 15, 12254. [Google Scholar] [CrossRef]
  51. Basdekis, C.; Katsampoxakis, I.; Anathreptakis, K. Women’s Participation in Firms’ Management and Their Impact on Financial Performance: Pre-COVID-19 and COVID-19 Period Evidence. Sustainability 2023, 15, 8686. [Google Scholar] [CrossRef]
  52. Bui, T.N.; Nguyen, X.H.; Pham, K.T. The Effect of Capital Structure on Firm Value: A Study of Companies Listed on the Vietnamese Stock Market. Int. J. Financ. Stud. 2023, 11, 100. [Google Scholar] [CrossRef]
  53. Mahssouni, R.; Makhroute, M.; Touijer, M.N.; Elabjani, A. Dual Perspectives on Financial Performance: Analyzing the Impact of Digital Transformation and COVID-19 on European Listed Companies. J. Risk Financ. Manag. 2023, 16, 371. [Google Scholar] [CrossRef]
  54. Tarighi, H.; Hosseiny, Z.N.; Akbari, M.; Mohammadhosseini, E. The Moderating Effect of the COVID-19 Pandemic on the Relation between Corporate Governance and Firm Performance. J. Risk Financ. Manag. 2023, 16, 306. [Google Scholar] [CrossRef]
  55. Tekić, D.; Mutavdžić, B.; Milić, D.; Matkovski, B.; Đokić, D.; Novaković, T. Profitability Determinants of Small Agricultural and Food Companies in the Republic of Serbia. Custos E Agronegocio 2022, 18, 124–145. [Google Scholar]
  56. Jambor, A.; Babu, S. Competitiveness of Global Agriculture; Springer International Publishing: Cham, Switzerland, 2016. [Google Scholar] [CrossRef]
  57. Hamad, H.A.; Cek, K. The Moderating Effects of Corporate Social Responsibility on Corporate Financial Performance: Evidence from OECD Countries. Sustainability 2023, 15, 8901. [Google Scholar] [CrossRef]
  58. Parzonko, A.; Parzonko, A.J.; Bórawski, P.; Wicki, L. Return on Equity in Dairy Farms from Selected EU Countries: Assessment Based on the DuPont Model in Years 2004–2020. Agriculture 2023, 13, 1403. [Google Scholar] [CrossRef]
  59. Walsh, J.; Parsons, R.; Wang, Q.; Conner, D. What Makes an Organic Dairy Farm Profitable in the United States? Evidence from 10 Years of Farm Level Data in Vermont. Agriculture 2020, 10, 17. [Google Scholar] [CrossRef]
  60. Dakić, S.; Mijić, K.; Jakšić, D. Multiple Regression Approach to Modelling Determinants of Business Success Based on Financial Statements: Evidence from Food Processing Companies in the Republic of Serbia. Custos E Agronegocio 2019, 15, 485–501. [Google Scholar]
  61. Vuković, B.; Milutinović, S.; Mijić, K.; Krsmanović, B.; Jakšić, D. Analysis of Financial Performance Determinants: Evidence from the European Agricultural Companies. Custos E Agronegocio 2022, 18, 285–306. [Google Scholar]
  62. U.S. Department of Justice and the Federal Trade Commission. Horizontal Merger Guidelines. 2010. Available online: https://www.justice.gov/sites/default/files/atr/legacy/2010/08/19/hmg-2010.pdf (accessed on 7 June 2023).
  63. European Commission. Guidelines on the Assessment of Horizontal Mergers under the Council Regulation on the Control of Concentrations between Undertakings. 2004. Available online: https://eur-lex.europa.eu/legal-content/EN/ALL/?uri=celex%3A52004XC0205%2802%29 (accessed on 5 June 2023).
  64. Das, P. Econometrics in Theory and Practice: Analysis of Cross Section, Time Series and Panel Data with Stata 15.1|SpringerLink. Available online: https://link.springer.com/book/10.1007/978-981-32-9019-8 (accessed on 17 August 2023).
  65. Hsiao, C. (Ed.) Analysis of Panel Data; Econometric Society Monographs; Cambridge University Press: Cambridge, UK, 2022; pp. 469–497. [Google Scholar] [CrossRef]
  66. Ahmed, A.M.; Nugraha, D.P.; Hágen, I. The Relationship between Capital Structure and Firm Performance: The Moderating Role of Agency Cost. Risks 2023, 11, 102. [Google Scholar] [CrossRef]
  67. Ahmed, A.M.; Sharif, N.A.; Ali, M.N.; Hágen, I. Effect of Firm Size on the Association between Capital Structure and Profitability. Sustainability 2023, 15, 11196. [Google Scholar] [CrossRef]
  68. Eurostat. Tobacco Consumption Statistics. Available online: https://ec.europa.eu/eurostat/statistics-explained/index.php?title=Tobacco_consumption_statistics (accessed on 4 June 2023).
  69. Statistical Office of the Republic of Serbia. Household Budget Survey. Available online: https://www.stat.gov.rs/en-us/oblasti/potrosnja-prihodi-i-uslovi-zivota/potrosnja-domacinstva/ (accessed on 20 June 2023).
  70. Kilibarda, B.; Nikolić, N.; Krstev, S.; Šović, N.; Gudelj Rakić, J. Global Survey of Tobacco Use among Young People Aged 13–15 in Serbia in 2017; Institute for Public Health of Serbia “Dr. Milan Jovanović Batut”: Belgrade, Serbia, 2018. [Google Scholar]
  71. Official Gazette of the Republic of Serbia. Zakon o Zaštiti Stanovništva od Izloženosti Duvanskom Dimu. Available online: https://www.paragraf.rs/propisi/zakon_o_zastiti_stanovnistva_od_izlozenosti_duvanskom_dimu.html (accessed on 21 June 2023).
  72. Official Gazette of the Republic of Serbia. Zakon o Oglašavanju. Available online: https://www.paragraf.rs/propisi/zakon_o_oglasavanju.html (accessed on 21 June 2023).
  73. O’Rourke, M.; Djukic, J. Welcome to Serbia: Feel Free to Smoke. Tob. Control 2008, 17, 428–430. [Google Scholar] [CrossRef]
  74. Checkpoint. Database. Available online: https://www.checkpoint.rs/ (accessed on 15 July 2023).
  75. Đokić, D.; Novaković, T.; Tekić, D.; Matkovski, B.; Zekić, S.; Milić, D. Technical Efficiency of Agriculture in the European Union and Western Balkans: SFA Method. Agriculture 2022, 12, 1992. [Google Scholar] [CrossRef]
Figure 1. Share of tobacco production in Europe by country in 2021. Source: FAOSTAT [2].
Agriculture 13 01711 g001
Figure 2. Supply chain of tobacco and tobacco products in Serbia. Source: the authors’ illustration.
Agriculture 13 01711 g002
Figure 3. The structure of the analyzed sample of 12 companies in terms of 4 criteria based on financial reports data from 2021. (a) Turnover, net income, and total assets are expressed in thousands of EUR; (b) number of employees are expressed as an absolute value. Source: the authors’ calculations.
Agriculture 13 01711 g003
Figure 4. Values of the export of tobacco and tobacco products of Serbia. Source: the authors’ calculations.
Agriculture 13 01711 g004
Figure 5. Values of the imports of tobacco and tobacco products of Serbia. Source: the authors’ calculations.
Agriculture 13 01711 g005
Figure 6. Net export of tobacco and tobacco products of Serbia. Source: the authors’ calculations.
Agriculture 13 01711 g006
Figure 7. Comparative advantages (LFI) of tobacco and tobacco products of Serbia. Source: the authors’ calculations.
Agriculture 13 01711 g007
Figure 8. GLIIT of tobacco and tobacco products of Serbia. Source: the authors’ calculations.
Agriculture 13 01711 g008
Figure 9. Comparative analysis of the HHI of tobacco processing market in Serbia. Source: the authors’ calculations.
Agriculture 13 01711 g009
Figure 10. Share of individual household consumption of cigarettes and tobacco from 2011 to 2021. Source: Statistical Office of the Republic of Serbia. Household Budget Survey; Statistical Office of the Republic of Serbia: Belgrade, Serbia, for the corresponding year (2011–2021) [69].
Agriculture 13 01711 g010
Table 1. Regression model variables details.
VariableNotationFormulationIndicatorPredicted Effect
ProfitabilityROANet income/Total assetsCompany’s capacity to generate profits derived from its assets./
Market concentration (operating revenue-based)HHI Equation (1)Extent to which a market is dominated by a small number of large companies.+
LiquidityLIQCurrent assets/Current liabilitiesCompany’s capacity to fulfill its short-term financial obligations.
Financial leverageLEVTotal liabilities/EquityCompany’s indebtedness in relation to equity.
Debt ratioDEBTTotal liabilities/Total assetsCompany’s indebtedness in relation to total assets.
Firm sizeSIZELn (Total assets)Size of organization through total assets.+
TangibilityTANGFixed assets/Total assetsCompany’s asset structure.
Total assets turnoverTATSales revenue/Average total assetsCompany’s capacity to generate sales derived from its assets.+
Fixed assets turnoverFATSales revenue/Average fixed assetsCompany’s capacity to generate sales derived from its fixed assets.+
Current assets turnoverCATSales revenue/Average current assetsCompany’s capacity to generate sales derived from its current assets.+
GrowthGRWTurnover (year t) − Turnover (year t1)/Turnover (year t − 1)Company’s ability to increase sales between two time periods.+
ProfitabilityROANet income/Total assetsCompany’s capacity to generate profits derived from its assets./
Market concentration (operating revenue-based)HHI Equation (1)Extent to which a market is dominated by a small number of large companies.+
LiquidityLIQCurrent assets/Current liabilitiesCompany’s capacity to fulfill its short-term financial obligations.
Financial leverageLEVTotal liabilities/EquityCompany’s indebtedness in relation to equity.
Debt ratioDEBTTotal liabilities/Total assetsCompany’s indebtedness in relation to total assets.
Firm sizeSIZELn (Total assets)Size of organization through total assets.+
TangibilityTANGFixed assets/Total assetsCompany’s asset structure.
Total assets turnoverTATSales revenue/Average total assetsCompany’s capacity to generate sales derived from its assets.+
Fixed assets turnoverFATSales revenue/Average fixed assetsCompany’s capacity to generate sales derived from its fixed assets.+
Current assets turnoverCATSales revenue/Average current assetsCompany’s capacity to generate sales derived from its current assets.+
GrowthGRWTurnover (year t) − Turnover (year t − 1)/Turnover (year t − 1)Company’s ability to increase sales between two time periods.+
Source: the authors.
Table 2. Tobacco production in Serbia (2013–2021).
YearArea
(ha)
Total
Production (t)
Yield (t/ha)Number of FarmsProduction per Farm
(t)
Area per Farm
2013493979771.6217814.482.77
2014489993411.9116955.512.89
2015501287761.7512357.114.06
2016525678101.499598.145.48
2017506971731.429837.305.16
2018576271691.249927.235.81
2019702379921.148859.037.94
2020674589241.329009.927.49
2021580310,0971.7477513.037.49
Source: Ministry of Finance, Republic of Serbia, Tobacco Administration [35].
Table 3. The degree of market concentration according to the HHI value.
Herfindahl–Hirschman IndexOperating RevenueNet IncomeEquityNumber of Employees
HHI 20130.484 0.839 0.455 0.496
HHI 20140.451 0.953 0.523 0.193
HHI 20150.476 0.702 0.599 0.238
HHI 20160.479 0.949 0.656 0.272
HHI 20170.307 0.583 0.587 0.254
HHI 20180.314 0.463 0.525 0.252
HHI 20190.335 0.453 0.344 0.242
HHI 20200.323 0.355 0.328 0.251
HHI 20210.324 0.337 0.312 0.238
Source: the authors’ calculations.
Table 4. Panel regression model identification.
Testp-ValueDecision
Hausman test0.9870The random effects model was appropriate
Time effect0.0000Time effect included
Individual effect0.0000Individual effect included
Source: the authors’ calculations.
Table 5. Variance impact factors and tolerance test findings.
VariableVIF1/VIF (TOL)
HHI 1.190.8382
LIQ1.230.8152
LEV1.170.8556
DEBT1.300.7695
SIZE1.820.5493
TANG3.780.2645
TAT10.820.0925
FAT7.250.1379
CAT4.670.2142
GRW1.230.8128
Mean VIF3.45-
Source: the authors’ calculations.
Table 6. Heteroskedasticity and autocorrelation verification.
Testp-ValueDecision
Wooldridge test0.2556Absence of autocorrelation
Breusch–Pagan test/Cook–Weisberg test0.0022Presence of heteroskedasticity
Source: the authors’ calculations.
Table 7. Regression model variables details.
ROACoefficientRobust Standard ErrorzP > |z|95% Conf.Interval
HHI −0.56840.1872−3.040.002−0.9352−0.2016
LIQ−0.00080.0003−2.840.005−0.0014−0.0002
LEV0.00470.0025 1.910.057−0.00010.0096
DEBT−0.07120.0010−7.130.000−0.0907−0.0516
SIZE−0.01240.0077−1.610.107−0.02750.0027
TANG−0.18680.0928−2.010.044−0.3686−0.0049
TAT0.15520.0633 2.450.014 0.03110.2792
FAT−0.02350.0093−2.540.011−0.0417−0.0053
CAT0.01280.0205 0.620.533−0.02730.0529
GRW−0.04460.0111−4.000.000−0.0664−0.0228
Constant0.60910.2237 2.720.006 0.17061.0477
Source: the authors’ calculations. Wald chi2(10) = 766.48; prob > chi2 = 0.0000; R−sq: within = 0.3622, between = 0.8922, overall = 0.5771.
Disclaimer/Publisher’s Note: The statements, opinions and data contained in all publications are solely those of the individual author(s) and contributor(s) and not of MDPI and/or the editor(s). MDPI and/or the editor(s) disclaim responsibility for any injury to people or property resulting from any ideas, methods, instructions or products referred to in the content.

