1. Introduction
With increasing openness and integration, the importance of a mutual comparison of individuals, companies, countries, and regions increases. Especially in connection with ensuring long-term progress, an objective assessment of the current situation, possibilities, and capabilities compared to competitors is important. Competitiveness—a concept that is no longer something new and unknown—is still difficult to measure. It is primarily related to its complexity and specificity. Competitiveness research is mainly focused on the identification and description of decisive factors. Among the most important are the nature of the competitive advantage and the associated technological level of the production process, the innovative ability, the volume of research and development expenditures, unit labor costs, and the real exchange rate. However, the business sector, which is the main source of a country’s competitiveness, may perceive many of them as unimportant [
1].
Competitiveness in view of the constantly changing market environment is one of the basic characteristics of a company. Methods are increasingly used to evaluate competitiveness, which guarantees the company’s survival in the competitive environment and give hope that the company will soon become a leader in its field. The goal of every company is to gain such a position in the given industry that it is able to face competitive pressures as best as possible, or to turn their influence to its advantage [
2].
The meaning of the word competitiveness represents the ability of a given entity to compete on the market. Competitiveness is a feature that allows a business entity to succeed in competition with other business entities, and its assessment is, therefore, related to the nature and conditions of this competition. The winner is the one who knows how to appropriately apply some competitive advantage in the competition and, thus, gain an advantage over their rivals. Being permanently competitive means for a company to create tomorrow’s competitive advantages faster than its rival can copy its present-day competitive advantages [
3].
The conceptual framework of competitiveness was referenced in the 17th century, specifically regarding theories of international trade, the nature of which focused on economic aspects. The main author, regarded as a mentor to these theories, was David Ricardo (1817), who developed the methodology of competitive advantages. Classical economic theory bases the comparative advantages of a region or nation on the abundant endowment of basic factors of production (land, labor, and capital) and, above all, on the relative abundance of natural resources [
4]. In 1990, Michael Porter also presented the theory of international competitiveness in his book The Competitiveness of Nations [
5]. Porter leans towards the managerial definition of competitiveness and understands it as the ability of a company to take advantage of an opportunity in the market to gain a position in which it can defend itself, or to use resources for further growth. He, thus, understands the external environment as the main determinant of the company’s ability to compete [
3].
According to Aceleanu [
6], the development of every industry is currently under pressure to respect the principles of sustainability, which supports economic, environmental, and social progress. The implementation of sustainable development in companies requires new methods of production and consumption, as well as new principles of business implementation, in which the environment and quality of life become the main pillars of every business strategy. The concept of competitiveness and the associated term of competitive advantage represent a multidimensional concept that can be studied at the corporate, sectoral, and national level. In reality, competitiveness can also be measured at the level of regions, which explains why the existing literature provides definitions of these concepts at the micro- and macroeconomic level. Among these levels, enterprise-level measurement has so far received the most attention from researchers and practitioners (Sachitra and Chong [
7]; Yerkan and Isikli [
8]; Grupe and Rose [
9]). It is not at all surprising to understand how, in this fast pace of competition, every company is required to be increasingly competitive and efficient. Competitive advantage from a microlevel perspective represents the ability of individual businesses to offer products and services that meet or exceed customer needs offered by competitors at a given time. Thus, the competitiveness of a company includes its ability to create, innovate, produce, and sell goods and services on national or international markets, thereby maintaining and improving its market position [
7,
10].
The importance of competitiveness and sustainability lies mainly in their ability to bring profit for stakeholders. Nations and industries must also be competitive; therefore, competitiveness can be divided into several levels [
3]:
Corporate competitiveness;
Industry competitiveness;
National competitiveness.
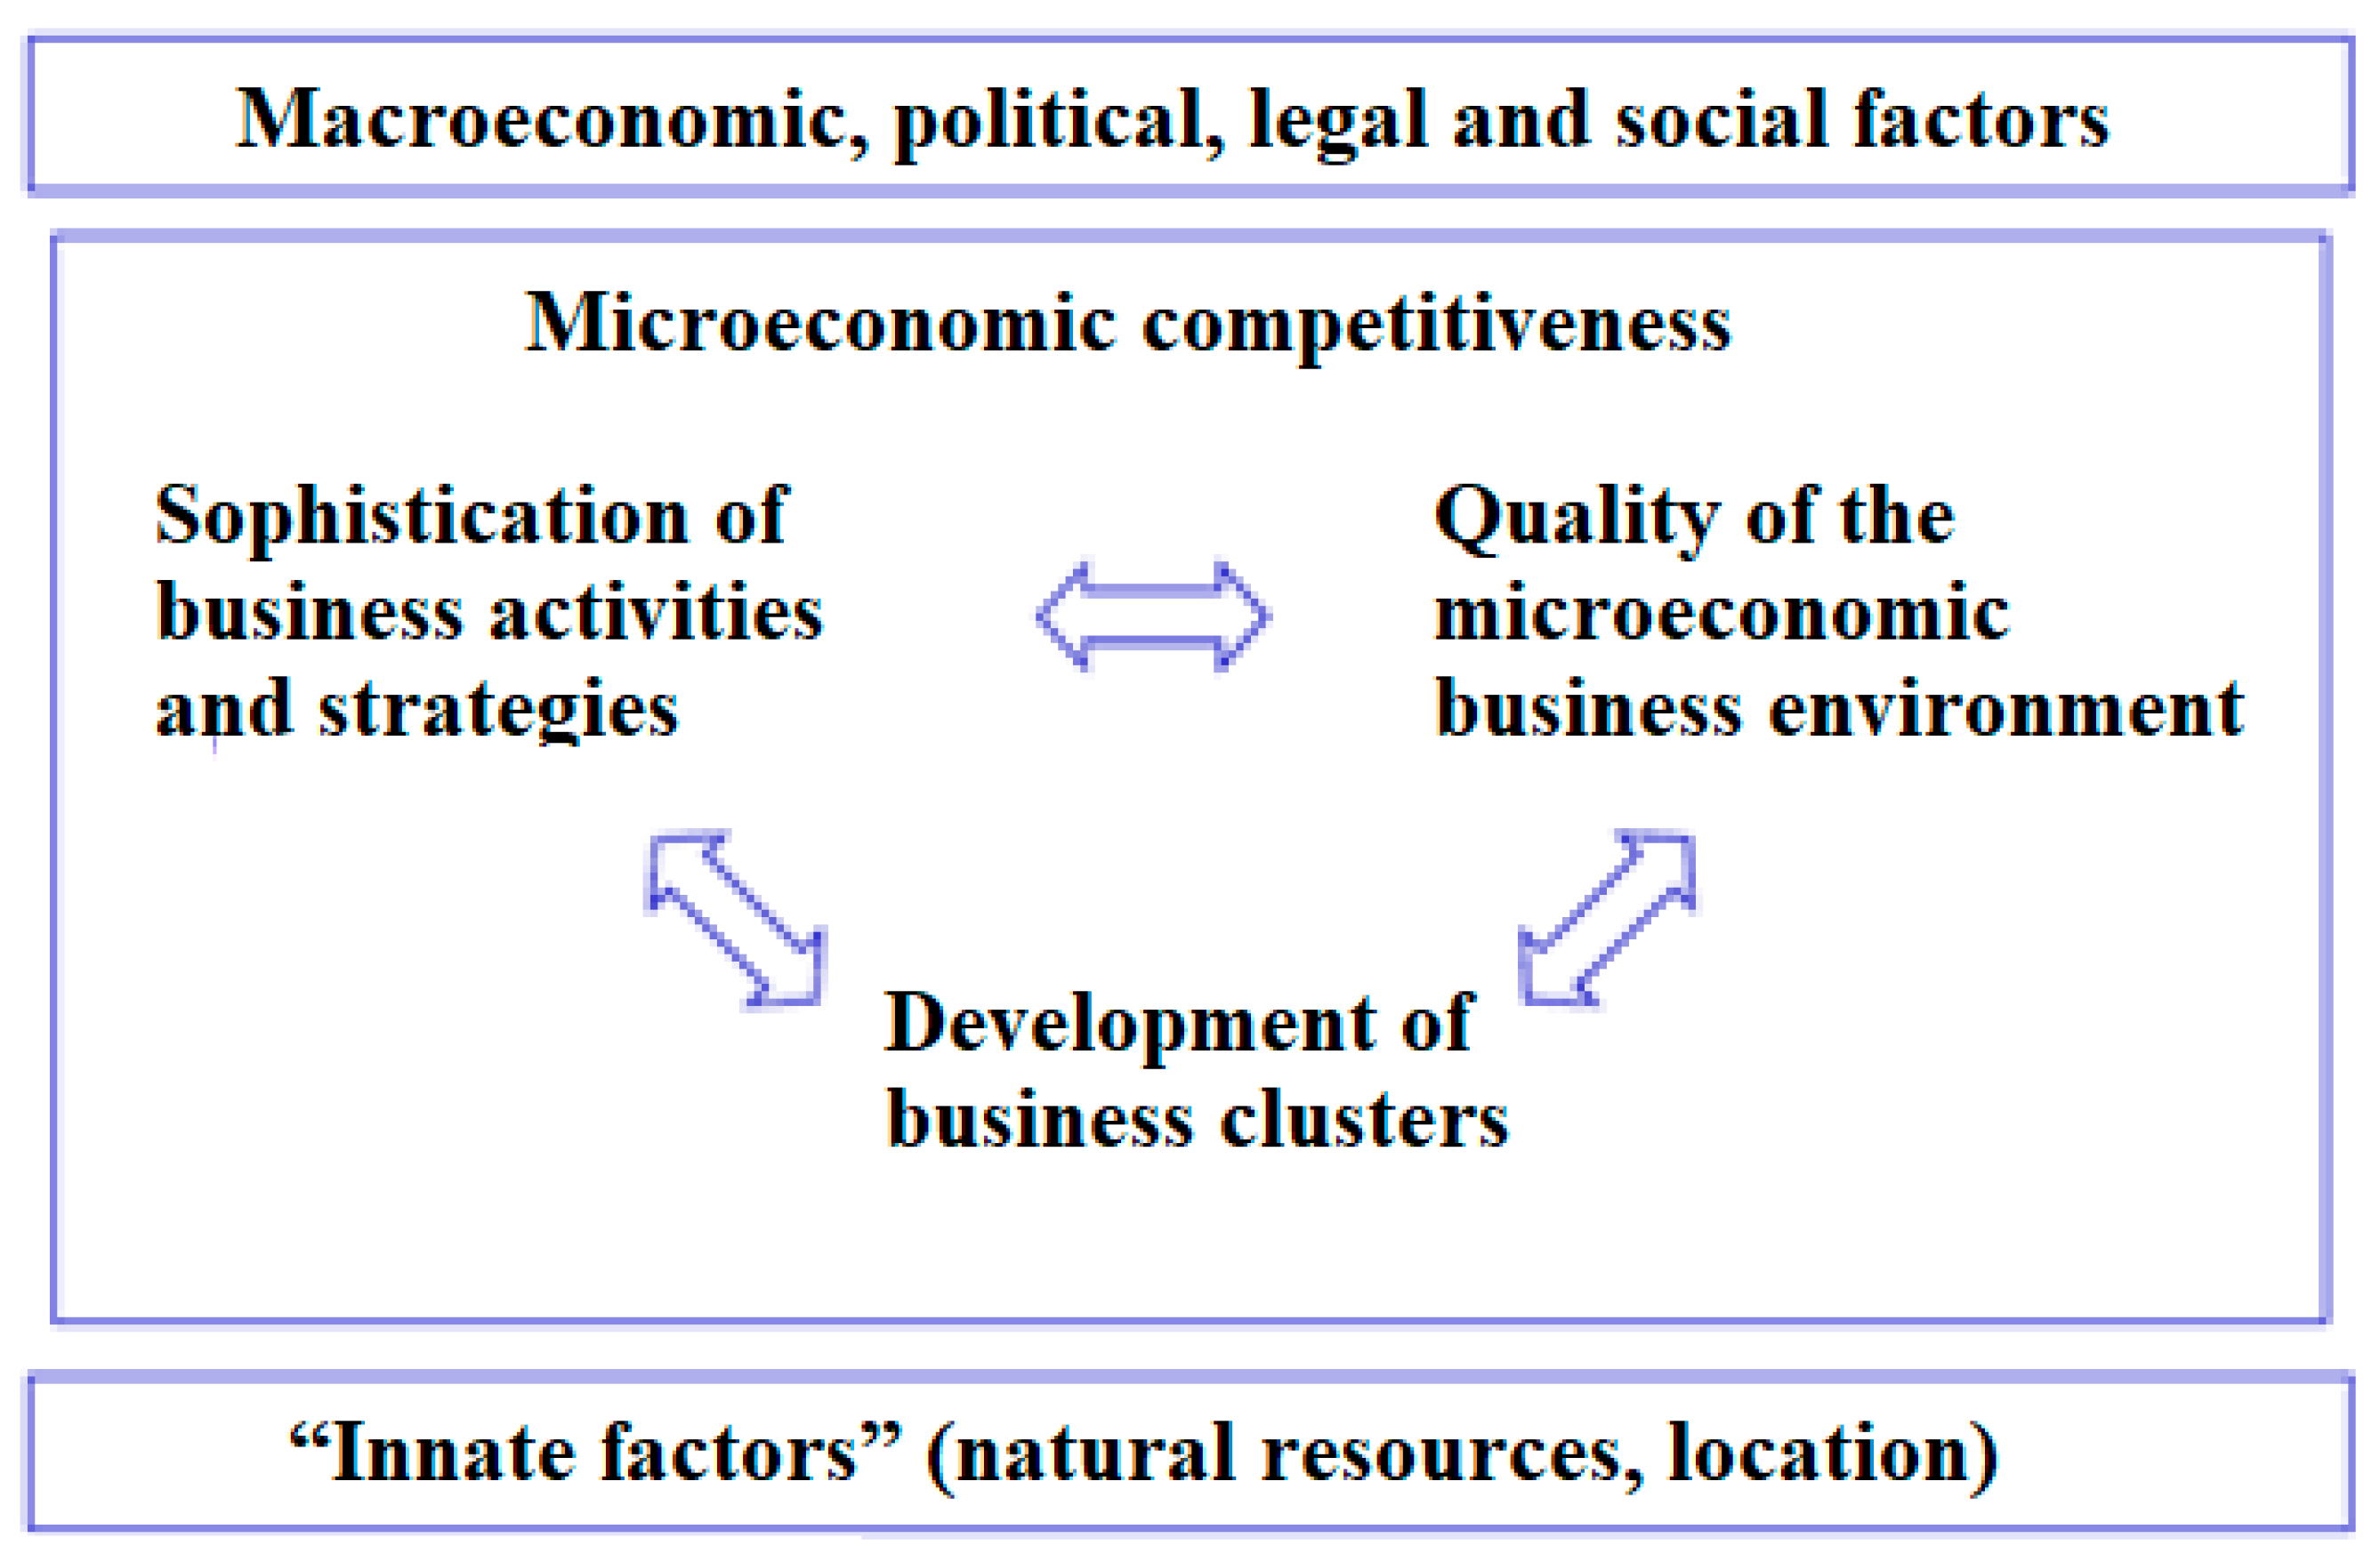
Currently, extensive attention is also being paid to the competitiveness of countries. Porter originally researched corporate competitiveness and, thus, realized the close interrelationship of the micro- and macrolevels (
Figure 1). The business environment creates the conditions for the competitiveness of businesses, which are subsequently reflected in the competitiveness of the country. The basis is the decisions, abilities, and real performance of companies. However, more sophisticated strategies and more productive activities require more educated people, better information, more effective government decisions, better infrastructure, more developed research institutions, etc. The higher quality, productivity, and market success of the production of enterprises is subsequently reflected in the export performance of the country, in its economic growth, and ultimately, in the higher standard of living of its inhabitants [
1].
The existence, advancement, and growth of a company’s competitiveness are largely determined by its field of business and the nature of the company’s production. An important factor in the growth of a company’s competitiveness is ensuring the improvement of current production and increasing the utility value, while simultaneously reducing production costs. With Slovakia’s entry into the EU, the need to pay attention to the international and European environment is increased, with involvement in international trade being currently one of the key sources of business advancement [
1]. Achieving competitiveness means creating the best possible economic effect with available production factors. Production factors represent the production potential of the company, which depends on their quantity and quality. Socioeconomic transformations after the accession of countries into the EU caused a number of structural changes in the sources and distribution of production factors in agriculture. It should be emphasized that, compared to other sectors of the economy, the changes in the agricultural sector are relatively more pronounced [
12]. According to Jacková and Chodasová [
2], the integration and globalization processes in Europe have created a new business environment for business entities with the entry of the Slovak Republic into the European Union, which reflects a number of business changes of positive and negative natures. Due to the scope of the changes, a new competitive environment was created. In order for companies to be able to respond to the aforementioned changes in the business environment, and thus be competitive, it is first of all necessary to manage themselves in a modern way, i.e., to introduce new approaches, tools, and techniques, set ambitious goals, emphasize sustainable performance, track a comprehensive set of performance criteria, and strive for strategic innovation. It is also essential to create a dynamic and flexible organizational management structure to constantly improve key competencies and to look for opportunities to increase the competitiveness of the company, primarily by evaluating it. Slovakia’s membership in the EU and the introduction of the Common Agricultural Policy of the EU significantly changed the necessary conditions for the functioning of agriculture and forestry. Increasing competitiveness on the internal market of agricultural and food products requires accelerating the structural development of agricultural entities and improving production conditions and product quality. This can contribute to a more balanced regional development of lagging rural areas on development pillars [
13].
Currently, we have the opportunity to see the positives and negatives of the common market and its regulation in practice, as well as know the options for choosing suitable tools and methods of solutions, not only reflecting specifics of the individual EU member countries, but also responding to the main tendencies of the world agrarian sector development. Every day, we can see that significant regional and structural differences are still hidden behind the aggregated data about the average economic performance of the agrarian sector of the EU and that different approaches and priorities for solutions to individual issues can be chosen, provided that the issues have been identified and assessed in an objective manner [
14].
Agriculture in the European Union is highly differentiated, and one of the objectives of the Common Agricultural Policy is to improve agricultural competitiveness. Therefore, surveys regarding the competitiveness of agriculture and grouping countries of the European Union (EU) according to similar characteristics of agriculture are very valuable. They help make strategic decisions concerning the agricultural sector. The studies revealed that EU agriculture varies in terms of both resources and relationships between production factors, as well as the efficiency of their utilization. A clear difference in the level of competitiveness occurred between old and new member states, although some new countries ranked relatively high in terms of competitiveness sources (Czechia and Poland). It was demonstrated that human resources were of utmost importance in the structure of competitiveness sources [
15].
The competitiveness of companies is largely dependent on the quality of their management. The quality of management indicates whether top management is able to create effective development strategies and ensure long-term prosperity and sustainable growth of the company. Its task is also to be able to effectively use the decisive factors of the development of the company. By the quality of management, we first of all understand the professional performance of managerial functions. This means that, when the business is successful, managers take most of the credit, whereas, when the business is not doing well, they tend to blame external influences. Here, we could also argue that the role of management is also to ensure sufficient flexibility of the company and the ability to use environmental changes for the benefit of the company’s development [
1]. The internal structure of cooperatives has a direct impact on their prosperity. The management of cooperatives is responsible for a large number of people, and a classic problem is prioritizing the partial interests of individual members over the interests of the cooperative as such. They can often be in conflict; therefore, the management is often unable to enforce decisions that can be fundamental for the cooperative [
16].
Agricultural cooperatives compete for market share with non-cooperative organizations (most often with limited liability companies, joint-stock companies, or self-employed farmers). They are pressured in the business environment for gains in scale and scope. In a competitive scenario, cooperatives need to consider their capacities, resources, and processes, forcing the adoption of new organizational structures, such as diversification of the production chain, verticalization, and expansion of geographical operations [
17,
18]. Agricultural cooperatives are similar to capital organizations but follow cooperative doctrinal principles and, in addition to the economic–financial dimension, they consider the firm’s social dimension [
19].
Several authors, such as Zia et al. [
20], Jarosz-Angowska et al. [
21], Nowak and Kasztelan [
22], Nowak and Rozanska-Boczula [
15], Besic et al. [
23], Stoeva et al. [
24], Hoang [
25], Simin et al. [
26], Wigier [
12], and Markovic [
27] dealt with the issue of the competitiveness of companies working on the soil. However, there are few studies that evaluated the competitiveness of agricultural enterprises through the RCR coefficient, which presents an opportunity for research.
2. Materials and Methods
Competitiveness can be evaluated at different levels of the economy: at the level of the product, company, industry, and the entire economy. In our study, we focused on the analysis of the competitiveness of enterprises. For the research, we used a sample of agricultural sector enterprises, and, using the RCR coefficient, we evaluated the competitiveness of enterprises from the point of view of individual legal forms (cooperatives and non-cooperatives, which were trading companies).
In order to analyze the competitiveness of enterprises, we used the coefficient RCR (recourse cost ratio). This coefficient is calculated as the share of the costs of non-tradable domestic inputs (capital, land, and labor) and the income from tradable products.
The RCR index is a ratio indicator that works with two variables in the following form:
where
RCRi is the RCR coefficient in year
I,
Ii is the incomes in year
i, and
Ei denotes the expenses in year
i.
ExpensesI) represent procurement costs + production consumption + personnel costs + depreciation + taxes and fees. Income
(I) represents sales of goods + production + subsidies. The presented research focuses on the RCR index of entities operating on agricultural land in the Slovak Republic in the period 2004–2019, i.e., a period of 16 years (including the latest available data). In the period under review, attention is paid to the development of this index while monitoring the differences resulting from the legal form of the evaluated subjects (agricultural cooperatives (AC) or agricultural non-cooperatives (Non_AC)). The data for the analysis came from agricultural companies (balance sheets, profit and loss statements, etc.) and were provided by the Ministry of Agriculture and Rural Development of the Slovak Republic in the form of information sheets on anonymized agricultural enterprises. The total sample included both “legal” and “natural” persons in the period following the accession of Slovakia to the European Union (2004–2019). Within the sample, we also present a closer specification of enterprises depending on the size according to the number of employees, and operation in terms of natural conditions. From the perspective of the number of employees, we divided enterprises into small (up to and including 49 employees), medium (from 49 to 249 employees), and large (over 249 employees). The number of employees affects personnel costs, which are part of the cost side of the RCR coefficient. We further divided the enterprises in the sample depending on whether or not they operate in unfavorable natural conditions, which is why they receive subsidies from the Rural Development program, which affects the income side of the RCR coefficient. These are payments for areas with natural or special constraints, i.e., mountain areas, areas facing significant natural constraints, areas affected by specific constraints, areas from former LFA cadastres. Partial analyses from the point of view of these variables will be the subject of further research. The sample included only those enterprises with continuous financial data for the period under review and with flawless, balanced control over their financial statements (
Table 1).
The purpose of our research was to answer a simple question: What is the cause of the recorded development of the RCR index? Since this index is a ratio indicator, three scenarios can be assumed:
A. Stagnation of the RCR index, which would be caused by the same development of the aforementioned numerator and denominator, i.e., income and expenses of assessed entities;
B. Growth of the RCR index, which could be caused by an increase in the income of the assessed entities (i.e., an increase in the numerator) or a decrease in expenses (i.e., a decrease in the denominator);
C. A decrease in the RCR index, which could be caused by a decrease in the income of the assessed entities (i.e., a decrease in the numerator) or an increase in expenses (i.e., an increase in the denominator).
From our point of view, scenario A represents a neutral development of the index, as a change in one variable is accompanied by a (similar) change in the other variable. In the case of scenarios B and C, it is necessary to primarily identify the cause of the growth or decline in the RCR index, while a deeper analysis could be the content of future research.
For the purpose of statistical verification of the above, a set of methods consisting of basic moment characteristics and subsequent statistical methods/tests was used:
- -
The Shapiro–Wilk test was used for the verification of the normal distribution of the assessed variables:
is a constant, is the value of the i-th statistical unit, and is the average value of the variable.
- -
Kendall’s rank correlation coefficient (hereinafter referred to as Kendall’s coefficient) was used for quantifying the strength of the linear relationship:
where
n is the number of observations of a pair of variables,
nc is the number of concordant pairs, and
nd is the number of discordant pairs.
- -
Coefficient of determination was used for the quantification of the explanatory power of the created regression models:
where
is the measured value of the dependent variable,
is the estimated value of the dependent variable, and
is the average value of the dependent variable.
All analyses were processed in MS Excel, Statistica 13.4, and Statgraphics 19.
3. Results
The development of the RCR index in the monitored period of 2004 to 2019 showed significant variability from the point of view of momentary characteristics, which was disturbed only by the results in 2012. For this reason, the majority of years were marked as below average by ANOM analysis. The exception was the result in 2005 (i.e., the year that can be described as the second best; see
Figure 2).
By dividing the research sample according to legal form (cooperatives and non-cooperatives), it was possible to identify periods with greater or lesser differences (years 2005, 2012, and 2016) and highly balanced periods (years 2008–2011), as documented in
Figure 3. From the point of view of the mean value (average), the differences were significant especially in 2012, which we attribute to the fact that there was one company (non-cooperative) in the sample with a particularly high value of the RCR coefficient (above 5.000). Toward the end of the monitored period, slightly better values of the RCR index persisted on the side of non-cooperatives.
The development of the median value (average) of the RCR index, with occasional exceptions, showed similar characteristics across the majority of the evaluated years. Behind this homogeneity, however, in the case of cooperatives or non-cooperatives, hides a different development of the input variables, from the point of view of either momentary characteristics of position or variability (
Figure 4). For cooperatives, we mainly monitored the differences in the position of incomes and expenses of individual entities from year to year, while, for non-cooperatives, the differences can be attributed primarily to their variability.
The differences outlined above make it possible to assume a different cause of the stagnation of the RCR index for entities operating on agricultural land, depending on their legal form. The next two subsections deal with their quantification.
3.1. Quantification of the Impact of Income and Expenses on the Development of the RCR Index in the Case of Agricultural Cooperatives
In the first step, the relevant relationship was verified through correlation analysis. The Shapiro–Wilk test rejected the hypothesis of a normal distribution of the studied data; hence, for this purpose, the Kendall coefficient was used, and the results in individual years are shown in
Table 2.
In the majority of years, a statistically significant connection between RCR and incomes and expenses was confirmed, but with slightly different intentions. In the case of the income–RCR index pair in 2010, we observed a statistically insignificant relationship, which subsequently moved from a negative and trivial level to a positive relationship, which we can describe as weak. In the case of the expenditures–RCR index pair, the statistical significance of this relationship persisted, with the exception of 2006 and 2007. With the passage of time, it also moved from a negative to a positive relationship, whose strength was similar on both sides.
Figure 5 captures the quantification of the dependence of the RCR index on its two subinput variables (see
Section 2) in 2004. While the relationship with expenditure could only be illustrated using a simple linear regression model with a relatively low explanatory power at the level of 38% (as also observed in the previous analysis), the relationship with income was best described by a regression model with a logarithm of the dependent variable. At the same time, its reporting ability, expressed by the coefficient of determination, was twofold (76.78%). Already in the first of 16 years, we can see that the nature of the relationship could be significantly different (
Table 3).
Only in one case was the regression linear model proven to be the model with the highest explanatory power (expenditure–RCR index, 2017), even at a relatively low level of 45%. Starting from 2008 and with the exception of 2017, the relationship in both pairs of variables could best be described by a regression model in the form RCR = (a × ln(I))2. In each case, this relationship was positive, while the coefficient of determination (R2) exceeded the value of 90%.
3.2. Quantification of the Impact of Incomes and Expenses on the Development of the RCR Index in the Case of Non-Cooperatives
Similar to cooperatives, the first step was to monitor the relationship of the RCR index with income and expenditure, verified through correlation analysis. The Shapiro–Wilk test rejected the hypothesis of a normal distribution of the studied data in the very first of the 16 monitored years; hence, for this purpose, the Kendall coefficient was used, and the results in individual years are shown in
Table 4.
The evaluation of the obtained results could be related to the two periods that bordered the year 2014. Until this year, the occurrence of statistically insignificant relationships was considerable. While in the case of incomes, this occurred in three out of 11 years, in the case of expenses, this occurred in up to nine out of 11 monitored years. Since 2014, there was a linear relationship between RCR and income or expenses, which was statistically significant and positive. Its power could be characterized as trivial, weak at best, and it stagnated over the years.
Considering the failure to demonstrate a linear relationship between pairs of variables or statistically significant cases of linear relationships with trivial strength, the relationship was subjected to analysis through a regression model.
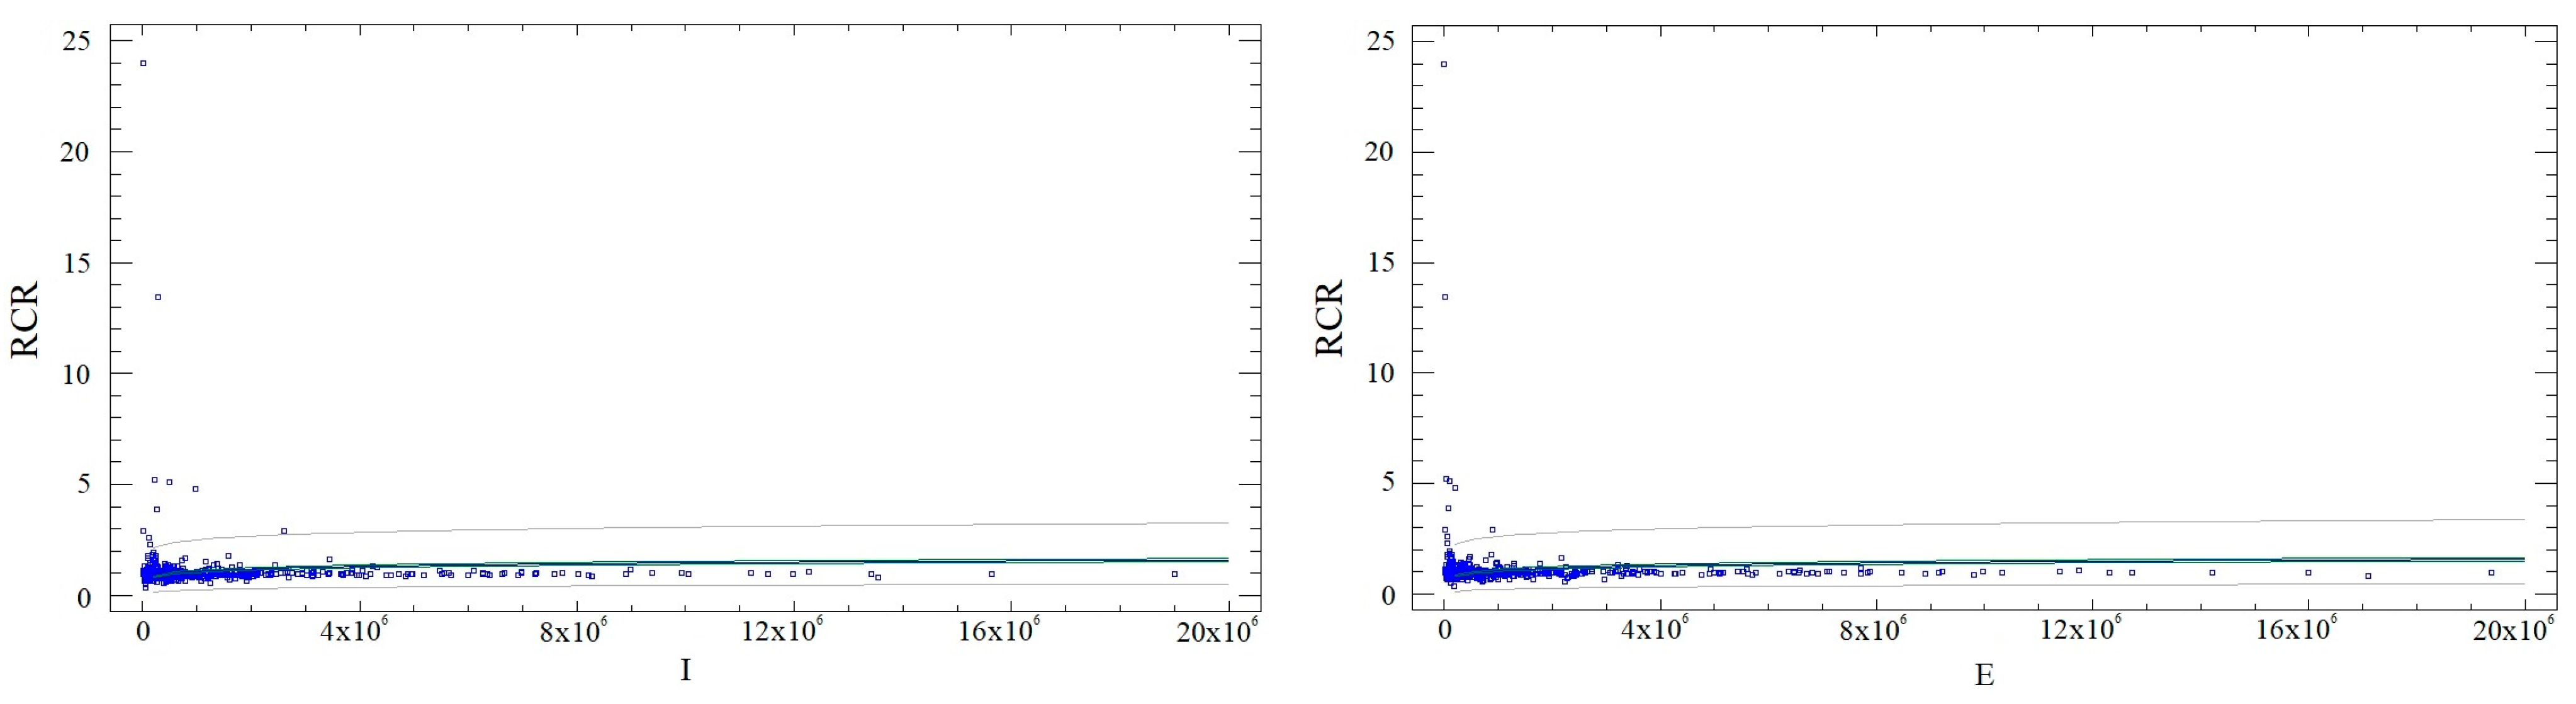
Figure 6 captures the quantification of the dependence of the RCR index on its two partial input variables (see
Section 2) in 2004. In both cases, the model with the best explanatory power was that whose regression function could be written in the form RCR = (a × ln(I))
2, while the coefficient of determination exceeded 90% (
R2 I = 92.88%;
R2 E = 91.87%).
Table 5 describes the situation in each year.
The results of the regression analysis show a higher number of cases when it was not possible to quantify the relationship between a pair of variables using the regression model. This supports the results of the previous correlation analysis, which identified either the linear relationship as statistically insignificant or its potential strength as trivial. If it was possible to quantify this relationship in individual years, the variability of the regression functions and their predictive value were considerable. However, a common feature was the positive impact of both income and expenses on the value of the RCR index (in selected years).
3.3. Development of the Regressor in the RCR Regression Function Depending on Income and Expenses and Depending on the Legal Form
The above analyses showed different results in the characteristics of the relationship between the RCR index and its input variables for cooperatives and non-cooperatives. From the point of view of correlation analysis, the relationship with income was more significant in the case of cooperatives, continuously changing from negative to positive over the course of 16 evaluated years. The results of non-cooperatives could only be characterized as uniform since 2014, while a positive relationship was always associated with trivial strength.
The regression analysis pointed to higher homogeneity in the case of cooperatives, where the shape of the regression function could be captured uniformly in the majority of the evaluated years (
Figure 7).
In the case of cooperatives, the strength of the regressor was equally high in the case of the relationship of the RCR index with income and expenses, while the same nature of the regression function was also confirmed in the same years. In the case of non-cooperatives, the relationship of income and expenses with the RCR index was not uniform from the point of view of the regression function, but the absolute value of the regressor remained similar (
Figure 8).
4. Discussion and Conclusions
As a result of globalization and a wide range of transformative elements such as new technologies, changes in consumption patterns, and greater awareness of the preservation of natural resources, a reconceptualization of the term competitiveness has emerged, where comparative advantages as pillars of development move toward competitive advantages. These are created on the basis of product differentiation and cost reduction; technology, innovation capacity, and specialized factors are also vital [
4].
In the case of non-cooperatives, the value of the regressor was higher in each comparison with the results of cooperatives. However, the nature of the relationship in the case of entities operating on agricultural land in the Slovak Republic with the legal form of a cooperative was significantly more homogeneous across the evaluated period. Based on the achieved results, the proposed variant B should be analyzed further. The different characteristics of the correlation coefficient applied to incomes and expenditures indicate supporting this assumption of increasing RCR. The level of these coefficients is too low, so in further research, the structure of both indicators should be realized. In the case of cooperatives, the achieved results are similar with some exceptions. The characteristics of the correlation indices were the same, and therefore, we cannot indicate variant B for deeper analysis. The RCR index is increasing, but the reasons are unclear due to the above-mentioned correlation character.
The competitiveness of agricultural enterprises using the RCR coefficient was also used by Bielik and Rajčániová [
28]. The results of their research confirmed that the common feature of all competitive enterprises was the type of production focused on plant production or both plant and animal production (in no case did a company focused exclusively on animal production achieve the optimal value of the RCR coefficient), most of which were trading companies located in better Slovak natural conditions.
The theoretical introduction of the paper indicated several ways to increase competitiveness of a company and gain competitive advantages. We know of various alternatives that support these ideas. For example, a study by Holgado et al. [
29] confirmed the growth of innovation performance as a form of increasing competitiveness in the case of agricultural cooperatives. From the view of the economic–financial dimension, the result was that cooperatives increased the offer/variety of products and gained new markets.
Every company is influenced by a number of diverse factors. Lalinský et al. [
1] assumed that wealth is created at the microlevel, where human, capital, and natural resources are transformed into products and services. This depends on the ability of companies to produce valuable products and services using effective methods and on the quality of the business environment. The productivity of the country is determined by the productivity of the companies operating in it. In this sense, more productive corporate strategies and processes also require more educated and experienced people, better information, better quality infrastructure, good suppliers, better research, etc. In connection with economic development, companies and countries must improve their capabilities and forms of competition. It is important to realize the shift from competing in terms of resources and inherited advantages (comparative advantages) to the creation of competitive advantages based on the difference and efficiency of products and services.
A condition for increasing the competitiveness of agricultural enterprises is an increase in the number of farms that will receive modern buildings, machines, and technological equipment. It follows from the justification of the Slovak Rural Development Plan [
13] that it is necessary to adapt to the legislative, phytosanitary, veterinary, and hygiene standards of the EU. The primary objective is to build a strong and viable agricultural sector through efficient market-oriented production that will meet the demands of consumers by offering a wide range of high-quality food that meets all necessary health and hygiene regulations. At the level of agriculture, these goals can be achieved through investments in production equipment (farm buildings, storage capacities, machines and equipment, and technologies with an emphasis on innovative approach), which will be co-financed within the given program. Providing such financial assistance to farmers to modernize their businesses would lead to improved farming practices, better production conditions, higher product quality, higher yields, and increased efficiency of traditional agricultural production. The strategic goal is to increase the competitiveness and innovation potential of Slovak farmers, the quality of primary production, the degree of its processing, innovations, and the added value of industry-specific products, taking into account sustainability and care for the environment and climate.
According to Jarosz-Angowska et al. [
21], the 2004, 2007, and 2013 enlargement of the EU opened up free trade opportunities, increasing trade flows and demand for products of agriculture. On the one hand, the integration processes have intensified competition between countries; on the other hand, they have created new opportunities. Results of this study confirmed that the overall competitive position of all EU-13 countries in agricultural trade on the common EU market has improved; however, individual analysis revealed disparities between respective member states.
The correlation analysis in the study of Matija [
30] confirmed that there is a relatively small relationship between the main resource-based factors and competitiveness of agricultural enterprises. This observation indicates that other factors have a stronger impact on a company’s competitiveness. These probably refer to intangible resources (such as relational capital, know-how, managerial competencies, and technological resources) and external conditions (such as climate and legal issues) of agricultural enterprises.
The organizational type of the farm is commonly included as an explanatory variable in studies about transition economies. Legal status is also used to explain the efficiency and competitiveness of farms in Western countries by comparing sole proprietorship with partnerships and corporations [
31].
An important issue is to find out what can affect the competitiveness of agricultural enterprises. Identifying the factors that influence competitiveness is imperative in order to appreciate the position of the firm in relation to its environment and to propose appropriate measures and strategies for increasing competitiveness of agribusiness firms [
30,
32]. Improvements in technology and information systems, as well as changes in climate and economies, have resulted in an increasingly competitive environment for the agribusiness sector. A better understanding of the firm-level competitiveness of this sector, hence, provides the necessary framework for agribusiness firms to compete in domestic and global markets [
7]. We can discuss whether it is the legal form that so greatly determines the diversity of the competitiveness of the subjects. The higher competitiveness of agricultural non-cooperatives can be determined not only by different approaches to the form of management and risk management, but also by the creation of decision-making structures. On the other hand, it may also be due to a better starting position in the past (compared with the cooperatives), training and educational programs, or a potentially poorly chosen basis for the comparison of competitiveness [
33].
The above results must be seen in the context of the study’s limitations. The primary limitation is the aggregated value of the incomes and expenses of the individually assessed subjects. In further research, it will be possible to identify the structure of these variables with the aim of quantifying their influence.


