Article

Describing Behavior Sequences of Fattening Pigs Using Process Mining on Video Data and Automated Pig Behavior Recognition

1
Institute of Agricultural Engineering, Faculty of Agricultural and Nutritional Sciences, Kiel University, 24118 Kiel, Germany
2
Department of Computer Science, Faculty of Engineering, Kiel University, 24118 Kiel, Germany
3
Business & Information Systems Engineering, Faculty of Law, Business and Economics, University of Bayreuth, 95447 Bayreuth, Germany
4
Fraunhofer FIT, 95444 Bayreuth, Germany
*
Author to whom correspondence should be addressed.
Agriculture 2023, 13(8), 1639; https://doi.org/10.3390/agriculture13081639
Submission received: 15 July 2023 / Revised: 9 August 2023 / Accepted: 16 August 2023 / Published: 21 August 2023
(This article belongs to the Special Issue Artificial Intelligence in Livestock Farming)

Abstract

:
This study aimed to demonstrate the application of process mining on video data of pigs, facilitating the analysis of behavioral patterns. Video data were collected over a period of 5 days from a pig pen in a mechanically ventilated barn and used for analysis. The approach in this study relies on a series of individual steps to allow process mining on this data set. These steps include object detection and tracking, spatiotemporal activity recognition in video data, and process model analysis. Each step gives insights into pig behavior at different time points and locations within the pen, offering increasing levels of detail to describe typical pig behavior up to process models reflecting different behavior sequences for clustered datasets. Our data-driven approach proves suitable for the comprehensive analysis of behavioral sequences in conventional pig farming.

1. Introduction

Process mining is a well-established method for gaining insight into data by structuring it into a sequence of activities, known as a process model [1]. The method has been successfully applied to various domains, including healthcare, finance, and manufacturing and is mainly used to identify bottlenecks or compliance issues within processes. Although process mining has been primarily used in the business context, it can also provide benefits for disciplines dealing with high volumes and veracity of data, such as life or natural science. These disciplines, however, often require a structured approach to answering process-related questions, like in our scenario, to identify behavior patterns for groups of animals.
Observing alterations in the behavior processes of pigs can be a helpful tool for analyzing and evaluating animal behavior, animal health and environmental impact. However, most approaches on identifying pig behavior based on video data so far mostly focus on single specific activities e.g., feeding/drinking recognition, tail biting, playing behavior, or aggression recognition [2].
Different lying patterns of pigs can be identified with computer vision-based monitoring to give an indication of animal health, welfare and thermal comfort state of group-housed pigs indicating climate conditions in mechanically ventilated barns. Likewise observations of activity and feed intake, which vary depending on different climate conditions, support the control of the above [3].
Analyzing the feeding behavior of pigs supports the indication of health issues and can play an important role in the breeding process. Methods of identifying feeding behavior based on video data have been published with a good success rate [4].
Behavior changes, like slowdown and weakening, can be used as an early warning indicator of pathological infections. Detecting these behavioral changes as part of surveillance in real-time supports farms in their monitoring tasks [5]. Studies of Bergamini et al., 2021 [6] have shown that general behavioral changes can also be extracted from large computer-vision datasets and mark long-term changes in five fundamental individual behavior patterns. Those effects on general behavior such as lying, moving, feeding, drinking and eliminating, are also relevant in terms of, environmental impact. Pigs are known to have the ability to structure their pens into functional areas for elimination, feeding, and sleeping if certain conditions in terms of, e.g., space allowance are met. This behavior is influenced by their innate need for hygiene and comfort, as well as their social hierarchies and patterns of use. Studies have shown that pigs tend to establish clear boundaries between elimination and sleeping areas, with the former being located at a distance from the latter [7]. Feeding areas, on the other hand, are often located near both elimination and sleeping areas, reflecting their importance in the daily routine of pigs [8]. Self-structured pig pens consist of a defined soiling area in which normal eliminatory behavior takes place [7]. In case of deviating elimination behavior due to changes in pig density, partition type or changes in climate conditions [8,9] potentially increased ammonia emissions that will negatively influence the environmental impact related to the size of the soiled area corresponds to the released ammonia emissions [10].
Also, the early detection of health and welfare compromises such as the identification of clinical and subclinical illnesses can be observed based on recognized general behavioral changes in pigs with results from video data [11,12]. Similar reports exist for the analysis of social interactions such as agonistic behavior after regrouping as an early indicator of mismatches within the group [13,14,15].
This paper proposes to use process mining as a method to identify behavioral patterns of fattening pigs and the related processes from video data. The goal is to demonstrate that process mining can be a valuable tool for understanding the behavior of pigs in their behavior sequences and gaining additional information in a temporal, spatial resolution about the division of the pen in functional areas compared to the state-of-the art method. This publication explains the step-by-step approach leading to the evaluation through the method of process mining. It systematically demonstrates the procedure by which the analysis unfolds. The individual stages include: (1) identification of process activities, (2) identification of distinct behavioral patterns and assessment of their accuracy, (3) depiction of behavioral patterns in temporal and spatial resolution, and (4) transformation of behavioral patterns into process models.
The methodology in this paper is generally based on the approach presented in [16] and extends it in terms of adapting the methodology to a real-life use case, an improved evaluation, and an in-depth discussion of the analysis results. In [16], the identical video dataset was used to evaluate the proposed methods, with brief analysis results related to their capability to produce meaningful outcomes. This paper demonstrates the adapted approach for analyzing video recordings of fattening pigs in subsequent steps of the data-driven approach to extract valuable information about their overall behavior and behavior sequences. The data-driven approach’s results can aid in improving decision-making regarding pig behavior sequences.

2. Materials and Methods

2.1. Animals and Housing

Video recordings of fattening pigs were recorded at the Teaching and Research Facility Futterkamp of the Schleswig-Holstein Chamber of Agriculture. In total, 1400 Pigs were housed in 14 compartments in the experimental barn on site. Each compartment was mechanically ventilated and subdivided into ten pens (five per side—one behind another, divided by an inspection walkway) each 4.08 m wide × 2.74 m long, each consisting of 11 pigs. Thus, each pig had 1.02 m2 of space at its disposal.
All fattening pigs were reared in conventional pig pens with mechanical ventilation. The space allowance in this investigation was clearly above the minimum set by the European or German legislation based on live weight [17,18]. Insufficient space can cause negative social behavior toward penmates, resulting in skin lesions, lameness, tail biting, or reduced growth [19]. In addition to the space allowance the behavior of fattening pigs can be influenced by various factors, such as diurnal rhythms, feeding, social interactions, and environmental conditions. All conditions were kept unchanged during the testing period to minimize external interferences.
The barn climate in the study period was not influenced by the study, but followed the parameters of the study barn used in practice.
The white fluorescent tube lights were switched on during the daytime (06:00–16:00 o’clock). All pens were equipped with fully-slatted concrete floors and an under-floor slurry pit. Pigs were fed up to seven times per day (feeding times: 07:33, 09:25, 10:50, 12:31, 14:52, 16:52 on all days and additionally at 17:44 on the first two days) with a predefined amount of liquid feed in a long trough system, giving enough feeding space for all pigs to simultaneously have access to the trough. In general, the feeding ratio was adjusted in three phases according to the weight of the animals (early 25 kg, middle 40 kg, late 70 kg). During the investigations all pigs were fed with the first feed. As enrichment material sisal ropes were attached to one wall of the pen.
A sketch of the pen design with details like position of feeding trough as well as the position of the cameras within the compartment can be seen in Figure 1.
The 11 boars of Topigs, PIC and DK genetic in pen #68 were on average 107.6 d (SD 4.3 d) and weighed 56.06 kg (SD 5.25 kg). All pigs were randomly distributed evenly among the compartments according to genetics and weight.

2.2. Video Recordings

To monitor the behavior of pigs, a video recording setup was used consisting of a camera and an HDD receiver unit ANNKE H500 (ANNKE Security Technology Inc., Rowland Heights, CA, USA). The camera was positioned facing the pigs This placement allowed for a comprehensive view of almost the entire pigpen and captured the movements of the pigs. Due to the low ceiling level the cameras were positioned at a height of approximately 2.9 m above the floor and angled downward at 45° to ensure that almost the entire pen was captured in the field of view. The cameras were set to a resolution of 1080 p and a frame rate of 12.5 frames per second. This setting allowed for clear and detailed recordings of the pigs’ behavior. The cameras were also set to infrared mode to capture the recordings in low-light conditions which was the case as soon as the lights were turned off. All video recordings were stored in the HDD receiver unit in a format that was compatible with the software used for data analysis.
The video recordings were taken in the time period from 12 November 2021 to 10 December 2021 between 06:00 am and 06:00 pm. This time period was chosen because it covered the majority of the pigs’ active hours as activity level significantly decreases during night hours [20]. The recordings were taken continuously without interruption to ensure that no behavior was missed.

2.3. Preprocessing of Video Data

First, the video recordings were prepared by (1) selecting the video segments relevant to the analysis being conducted and (2) organizing the selected video segments into a structured dataset according to a uniform format. Since the purpose of the analysis does not impose any restrictions on the time of day or location of the behaviors to be monitored, all recordings were in principle relevant. However, final recordings from five consecutive days (13 November 2021–17 November 2021) were selected and all other recordings were excluded from the analysis, as processing resources were limited and these selected days were sufficient to capture representative behaviors.
The selected video recordings, which were split into multiple video files per day due to the recording setup, were consolidated into a single file per selected day. To reduce processing time, the 1080 px resolution of the video data was reduced to 854 × 480 px. While downscaling video data significantly reduces processing time for video analysis, excessive downscaling can result in loss of information (e.g., due to small objects becoming blurred in the images). For the analysis in this study, small details were negligible, because the analysis of broad behavioral classes did not require fine-grained details to distinguish different variants of the same class, and therefore the downscaling to 854 × 480 px promised to be an appropriate solution. Since the models used later for activity recognition required a frame rate of 30 fps as input, videos were resampled to that framerate using FFmpeg (FFmpeg project). The recordings also captured some behavior in neighboring pig pens. To reduce noise in processing and the analysis, a static mask was overlaid over the video files, so that only the targeted pig pen was visible.
To quantify the amount of activity visible in a video sequence without having to actually detect the movement and execute activities of the pigs, a custom activity score based on pixel changes between frames were used [21]. To calculate the activity score during a given video, frames are sampled at a fixed rate and compared to the previously sampled frame. Each frame was divided into a 20 × 20 grid and the mean values for each grid were calculated at a fixed sampling rate of one frame every 30 s. Due to the different lighting conditions during the day, each frame was converted to a grayscale image before performing the calculations. The activity score was then calculated as the sum of the absolute differences of the pixel values of each corresponding grid between two sampled frames. The values were smoothed using a moving average with a window size of 60 samples, which means that the final activity score at a given point in time takes into account values from its past and future 15 min. Depending on the goal of the analysis, the activity score could be used to filter out irrelevant segments of the video recordings (e.g., segments where generally a low amount of activity is observed).

2.4. Detection and Tracking

The next step of the analysis involved detecting the positions of pigs in the video and tracking pigs throughout the video recordings. For pig detection, a dataset of 614 annotated images was created by randomly sampling frames from the full set of video recordings and manually labeling the pigs visible in these frames with bounding boxes.
This data set was randomly split into training and validation sets at an 80:20 split. The training data set was used to finetune a YOLOv7 classifier [22], which was pre-trained on ImageNet [23]. By using the parameters of a network pretrained on ImageNet and fine-tuning for the custom task (in our case the pig detection), the amount of required training images was significantly reduced compared to training from scratch [24].
For multiple object tracking, a ByteTrack tracker [25] was used. ByteTrack is a tracking-by-detection method, i.e., it uses detections provided by a separate object detector and correlates the detections across frames through internal motion models. This provides the flexibility to easily adapt the tracker to new settings and use cases, which can be implemented by simply adapting the object detector to the new setting (e.g., a different camera perspective, architecture, or species) [26].

2.5. Activity Recognition (Labeling of Animal Behavior)

The next step after localizing and tracking the pigs is the detection of their activities. To support the transferability of our approach to other settings and analysis goals, a generic activity recognition was required allowing to detect multiple concurrent behaviors occurring in a video. Most existing methods, however, for pig behavior recognition either allow the detection of single activities or specific groups of activities [2]. Of those solutions that are able to detect multiple different activity classes, most still use activity-specific assumptions and algorithms (e.g., a pig with its head positioned at a known position of a drinker is classified as drinking in [6]). To reduce the need to explicitly impose any assumptions into the activity recognition, we selected a deep learning method based on CNNs (Convolutional Neural Networks) that learns to detect activities based on labeled training examples of activities occurring in a video. In particular, SlowFast [27] was used for spatio-temporal action detection, which is a task from computer vision concerned with detecting the activities concurrently performed by multiple objects in a video.
Li et al., 2020 [28] showed that spatio-temporal CNNs can successfully be applied to pig behavior recognition. They specifically optimized the design of a SlowFast-based CNN for pig behavior recognition. In their evaluation, this design significantly improved accuracy for unseen settings (e.g., a camera perspective different from those observed in the training set), but the accuracy was comparable to more generic network designs (if the setting is similar in training and inference). Generally, networks pre-trained on Kinetics [29], which is a video dataset of activities performed by humans, performed better than the non-pre-trained networks, with the exception of the network specially designed for pig behavior recognition.
As for the analysis in this study, the setting of the training and analysis videos was identical, we chose to use a generic SlowFast 4 × 16 network pre-trained on Kinetics. A custom training dataset was prepared by sampling short video sequences from the full set of video recordings, containing both RGB and infrared segments as well as segments with high and low general activity. The behavior observed in these training sequences was manually annotated by a trained observer according to the behavior classes defined in Table 1, resulting in a total of 9240 annotated samples of activities. This dataset was divided into 70:30 training/validation splits, and used to fine-tune the pre-trained SlowFast 4 × 16 model. Pre-training using the dataset provided by Bergamini et al., 2021 [6] was also evaluated, but did not yield any significant improvements in training convergence speed or quality.
The trained model was then used to detect the activities executed by the pigs in the complete five days of video recordings selected for analysis. The results of activity recognition indicate the location and time of each detected activity, and can be used in combination with the previously extracted tracking information to reconstruct sequences of activities performed by specific pigs.

2.6. Process Mining

The final part of the analysis is the application of process mining to the extracted activities. Process mining algorithms typically require structured event data at a high level of abstraction, i.e., a log of events describing when each actor starts and ends with the execution of specific activities, which in turn refers to specific instances of a process (cases). Albeit already referring to the abstract activities relevant to the conducted process mining analysis, the results from activity recognition are at a much lower level of abstraction, because they simply list the activities detected for each pig at regular time intervals, and are not organized into cases. To transform the activity recognition results into a structure complying with process mining, the method presented in [16] was used. Specifically, Event Abstraction and Case Correlation were used to prepare the input for the process mining algorithms. For Event Abstraction, multiple subsequently followed detections of the same activity for the same pig are aggregated to a single instance of this activity using the temporal aggregation technique with smoothing from [16]. In typical process mining applications, where the underlying process is a well-structured business process, cases can typically be defined by the start- and endpoints of the process executions (e.g., a business process could start when an order for a product is received and finish when the product has been shipped). In the daily behavior of pigs, however, no such natural notion of a case exists. To construct cases in a way that each case represents an instance of the same process, Case Correlation is performed using defined start and end activities using the technique from [16]. For this, lying was defined as both the start and end activity of each process instance. This means each instance of the analyzed process starts when a pig stands up and ends when this same pig lies back down, and therefore captures “active” phases of the pigs.
As the behavior of pigs is unstructured and chaotic, trace clustering [30] is then applied to the event data. Trace clustering methods divide the event data of an unstructured process into multiple, separate clusters referring to similar behavior. With trace clustering, process mining methods are applied to each cluster separately, which typically yields more structured results. For our analysis, features such as the occurrence and frequency of events, and the directly-follows relationships (i.e., if moving occurs directly after lying in a case, moving directly follows lying) in a case were extracted, scaled by first targeting a mean around zero and then scaling to unit variance, reduced with PCA set to 99% variance, and organized into 15 clusters using the k-means algorithm. Finally, the clustered event data were exported into a representation processed by process mining tools and process models were discovered for each of the clusters with the process mining software Disco (Fluxicon BV, Eindhoven, The Netherlands).

3. Results

The results cover the quantification of activities in spatial and temporal resolution with a focus on the development of a process mining analysis for behavior recognition in pigs. For process mining analysis, first a purpose needs to be defined [31]. This purpose guides the analysis with respect to how the data are prepared, how events are extracted and processed, and which process mining algorithms are applied to the extracted event data.
For the analysis in this study, the daily behavior of pigs was monitored with the purpose of extracting patterns describing the behavior of pigs in active phases, with the goal of enabling automatic monitoring of the activity of pigs. The stepwise approach including general activity quantification, identification of distinct behavioral patterns, and finally transforming the behavioral patterns into process models, was performed to achieve this goal. The results of these steps are presented in the following chapter.

3.1. General Activity in the Pen—Quantification of Activities in Spatial and Temporal Resolution

Figure 2 shows average activity scores for the whole pen over time during recording times (06:00–18:00) for different observation days. Clearly recognized activity patterns appear at specific times during the day that correspond with feeding times and the general barn routine. Fixed time periods can be identified according to an increase in activity occurrence, e.g., similar increases in activity at all observation days are noted around 07:30–08:15, 09:15–10:15, 10:45–11:30, 12:45–13:30, 14:45–15:30, 16:45–17:15 and additionally at 17:45 until observation end. Furthermore, a link can be set to the feeding which takes place together with the control walk between 07:10 and 07:30.
Activity patterns during the day may also be influenced by artificial lighting in the barn. Lighting was activated from 06:00 until the last control walk (between 15:00 and 16:00). Outside of these times, an orientation light was used for the animals. In addition to the more semantically abstract activities, uniform periods of rest were observed between the first observation visit of the staff and the first feeding and between the first two feeding events respectively, during which the activity score was significantly reduced on all days. In contrast, activities after the third and fourth feeding phases showed a highly heterogeneous distribution. However, no significant conclusion can be made about the specific activities (e.g., feeding, lying, defecating, etc.) or where these activities took place.
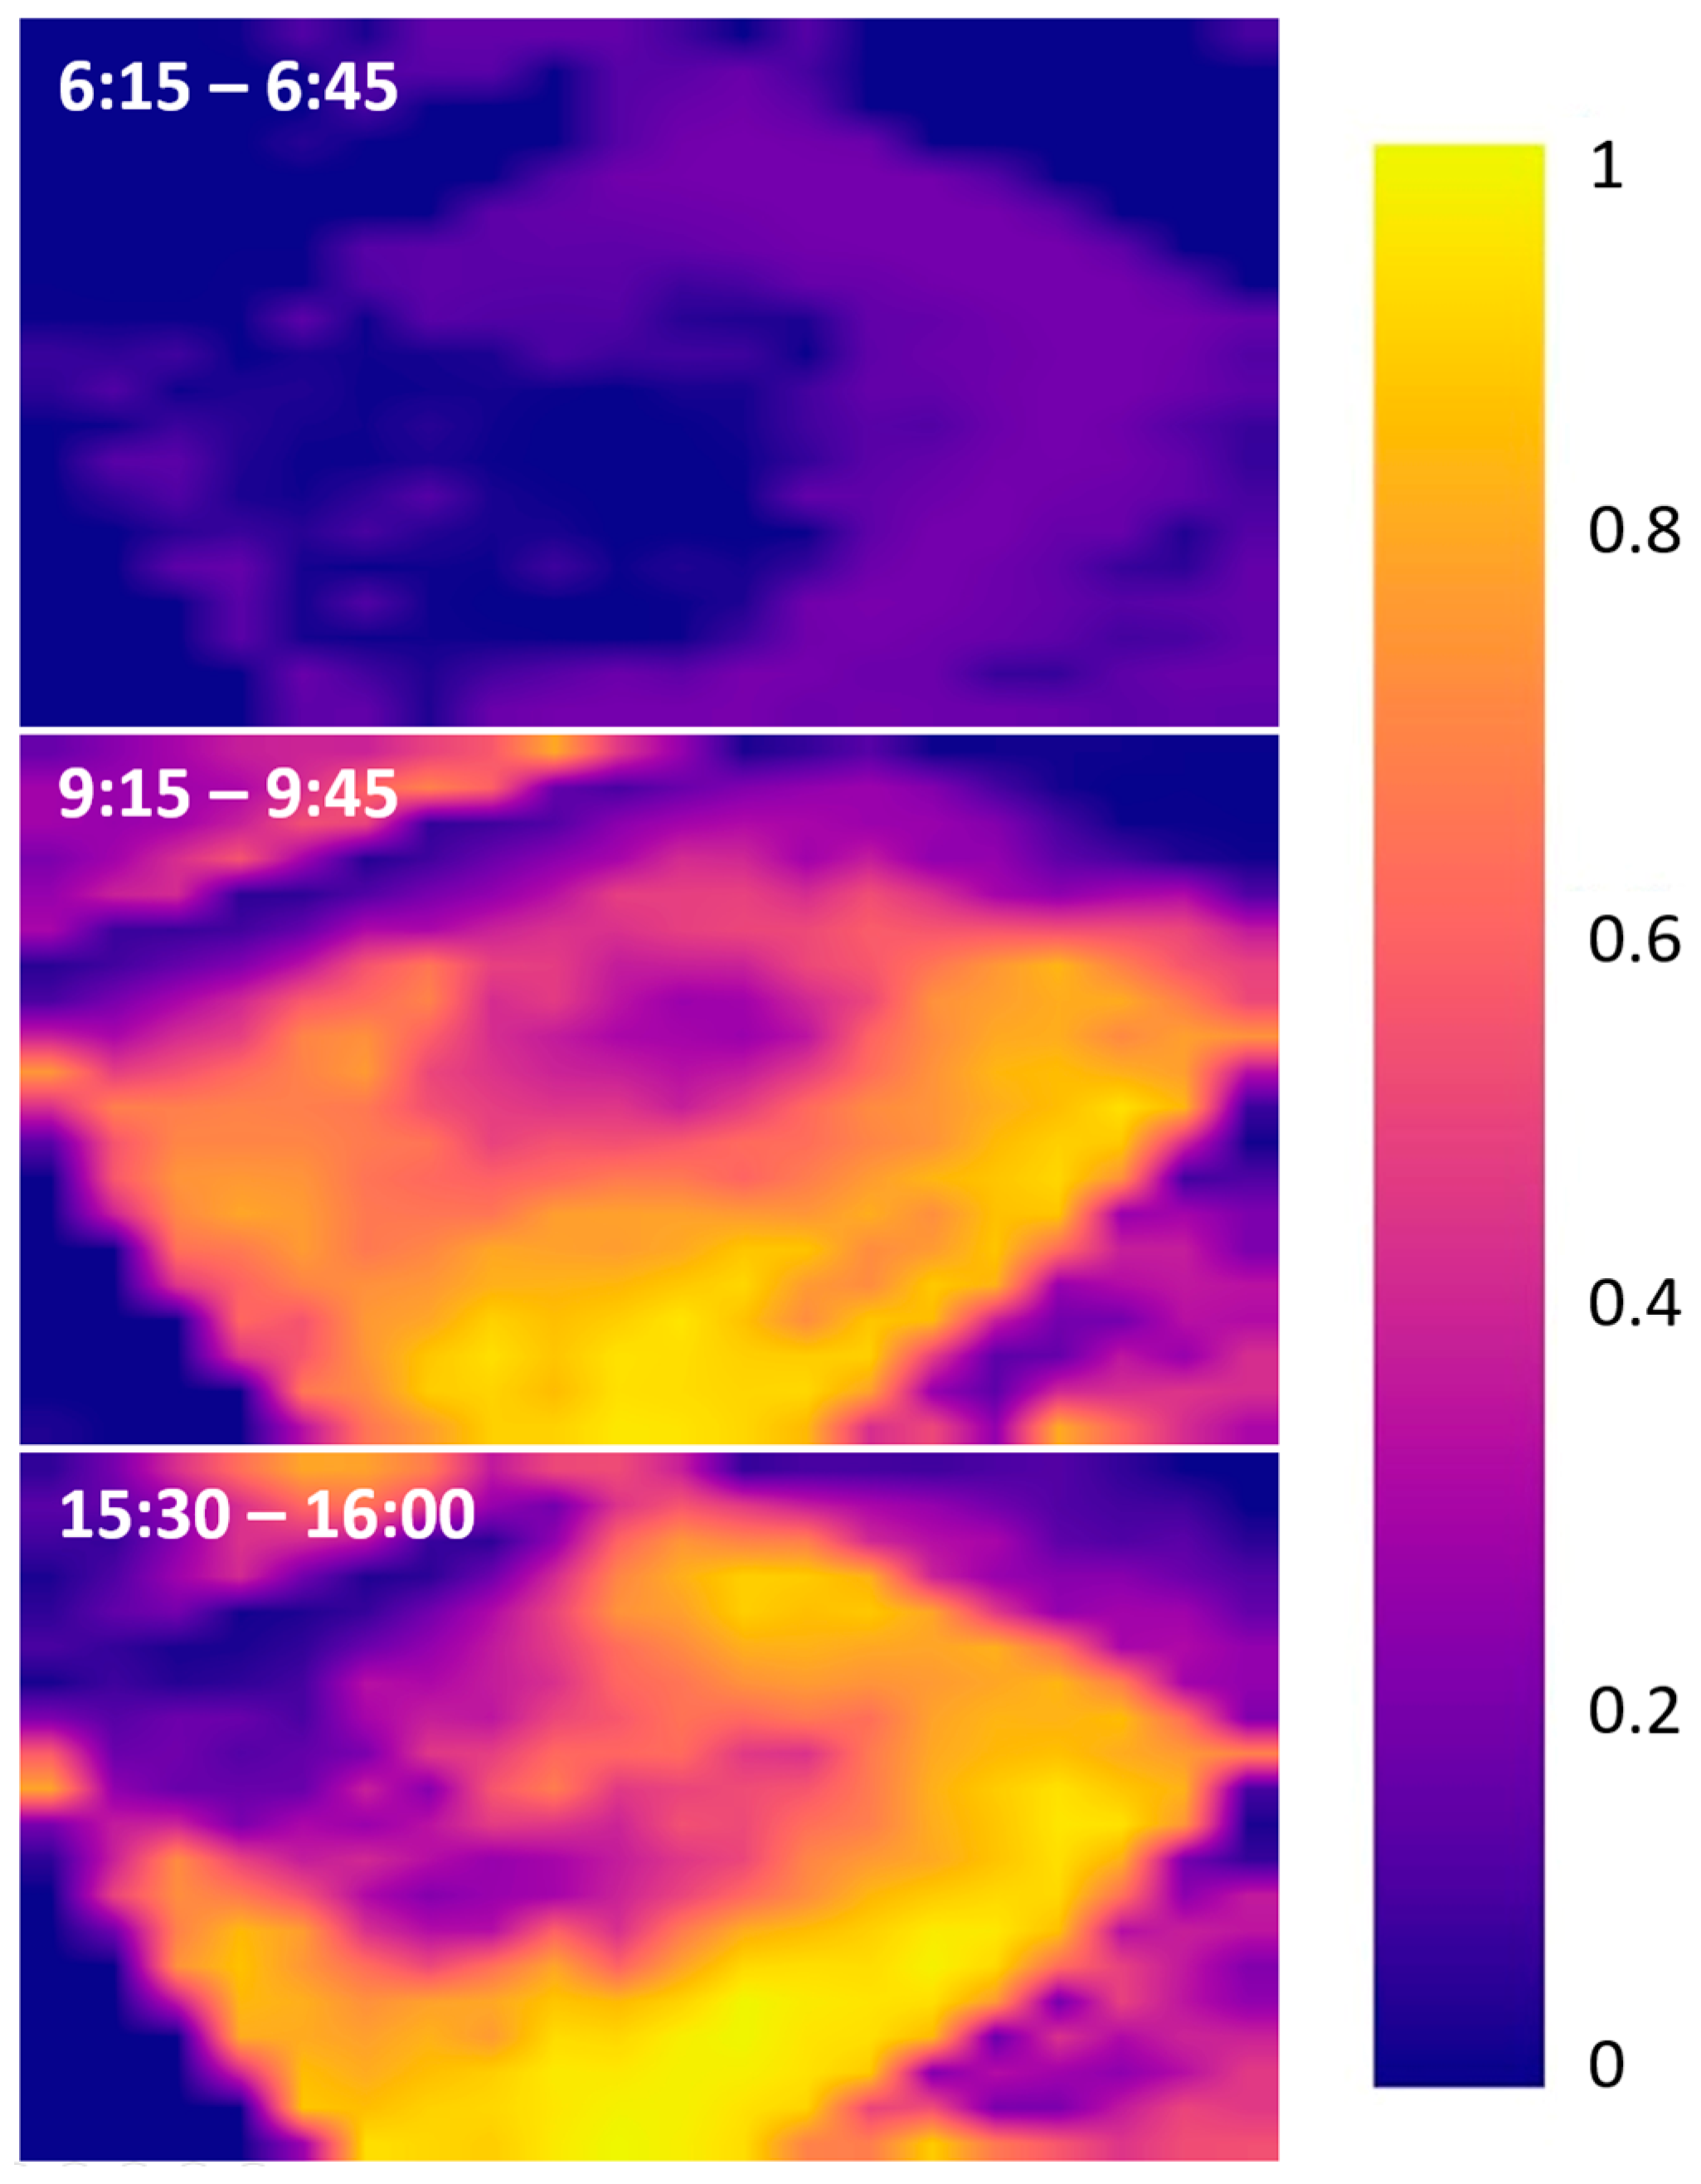
Figure 3 illustrates the spatial distribution of relative activity scores within the pen at different time points for one specific day (13 November 2021). Different activity patterns can be observed before the first feeding phase in the morning between 06:15–06:45, during the second feeding phase between 09:15–09:45 and during a heterogeneous activity phase between 15:30–16:00.
The spatial distribution of the relative activity score shows clear differences of activity foci within the bay at different times of the day, with a very low number of activities in the early morning hours before the first feeding and a higher number of activities at feeding times, as well as in the later afternoon hours between individual feeding periods.
During the second feeding phase, activity increased in the area of the feeding trough, which indicates its link with feeding behavior but also in the lying area of the pen. Heterogeneous distributions of activity (activity score), distributed throughout the pen with no focal point of activity, can be observed in the heatmap (shown in Figure 3) from the period of the later afternoon, which also shows higher activity in the fecal area in the top right corner. However, the activity score is not sufficient to conclude what type of behavior is being undertaken in each area of the pen.

3.2. Accuracy Object, Tracking and Behavior Recognition

The object detector was evaluated using the validation split of the pig detection dataset, resulting in a [email protected]:0.95 of 0.864. In the selected videos, on average 10.6 of 11 pigs (with a standard deviation of 0.64) were detected per frame. The main challenge for the object detector was visual occlusion, i.e., when a pig was hidden from the view of the camera by other pigs’ bodies. When more than 11 pigs were detected in a frame, the bounding boxes with the lowest detection confidence were discarded such that 11 detections remained.
To evaluate object tracking performance, an evaluation dataset of 14 1-minute video sequences was sampled from the recordings and manually annotated with ground-truth tracking information. The tracking performance metrics calculated by comparing the tracking results on these videos to the ground-truth annotations are reported in Table 2. When applied to the selected videos, the tracklets reached an average length of 18 min before an ID switch or tracklet fragmentation, and the longest tracklets spanned over multiple hours. While this is not optimal (which would produce one 12-h tracklet per pig per day), the average tracklet length was sufficient to capture behavioral patterns consisting of multiple, sequentially executed activities.
A [email protected] (mean average precision) of 0.7365 was achieved on the activity recognition validation set by the trained activity recognition model. The average precision for each activity class is listed in Table 3. Sitting and standing showed the lowest average precision values by a large margin. Visual inspection of results has shown that these actions are occasionally confused with lying by the model, due to similarity in visual appearance and lack of movement. Good average precision values were achieved for common activities like lying (0.997), feeding (0.994), defecating (0.960) and playing (0.969).

3.3. Behavior Patterns and Utilization of the Pen

All the aforementioned behaviors were tracked throughout the entire observation period. Video data based behavior recognition resulted in predictions for different behavior patterns. In Table 4, the descriptive statistics of behavior grouped into 10-min blocks can be observed. These 10-min blocks provided a quantifying overview of the diverse behavioral patterns observed. The use of these 10-min blocks allowed for a sufficiently detailed representation of behavioral changes, and facilitated a clear depiction of variations over the course of the day. All behavior categories (except for lying) within the observation period showed observations where none of the respective behaviors were exhibited. Conversely, there were instances, particularly with lying behavior, where only one behavior was exhibited by all animals, namely lying. On average lying was the most dominant observed behavior with only little variation, followed by feeding and investigating.
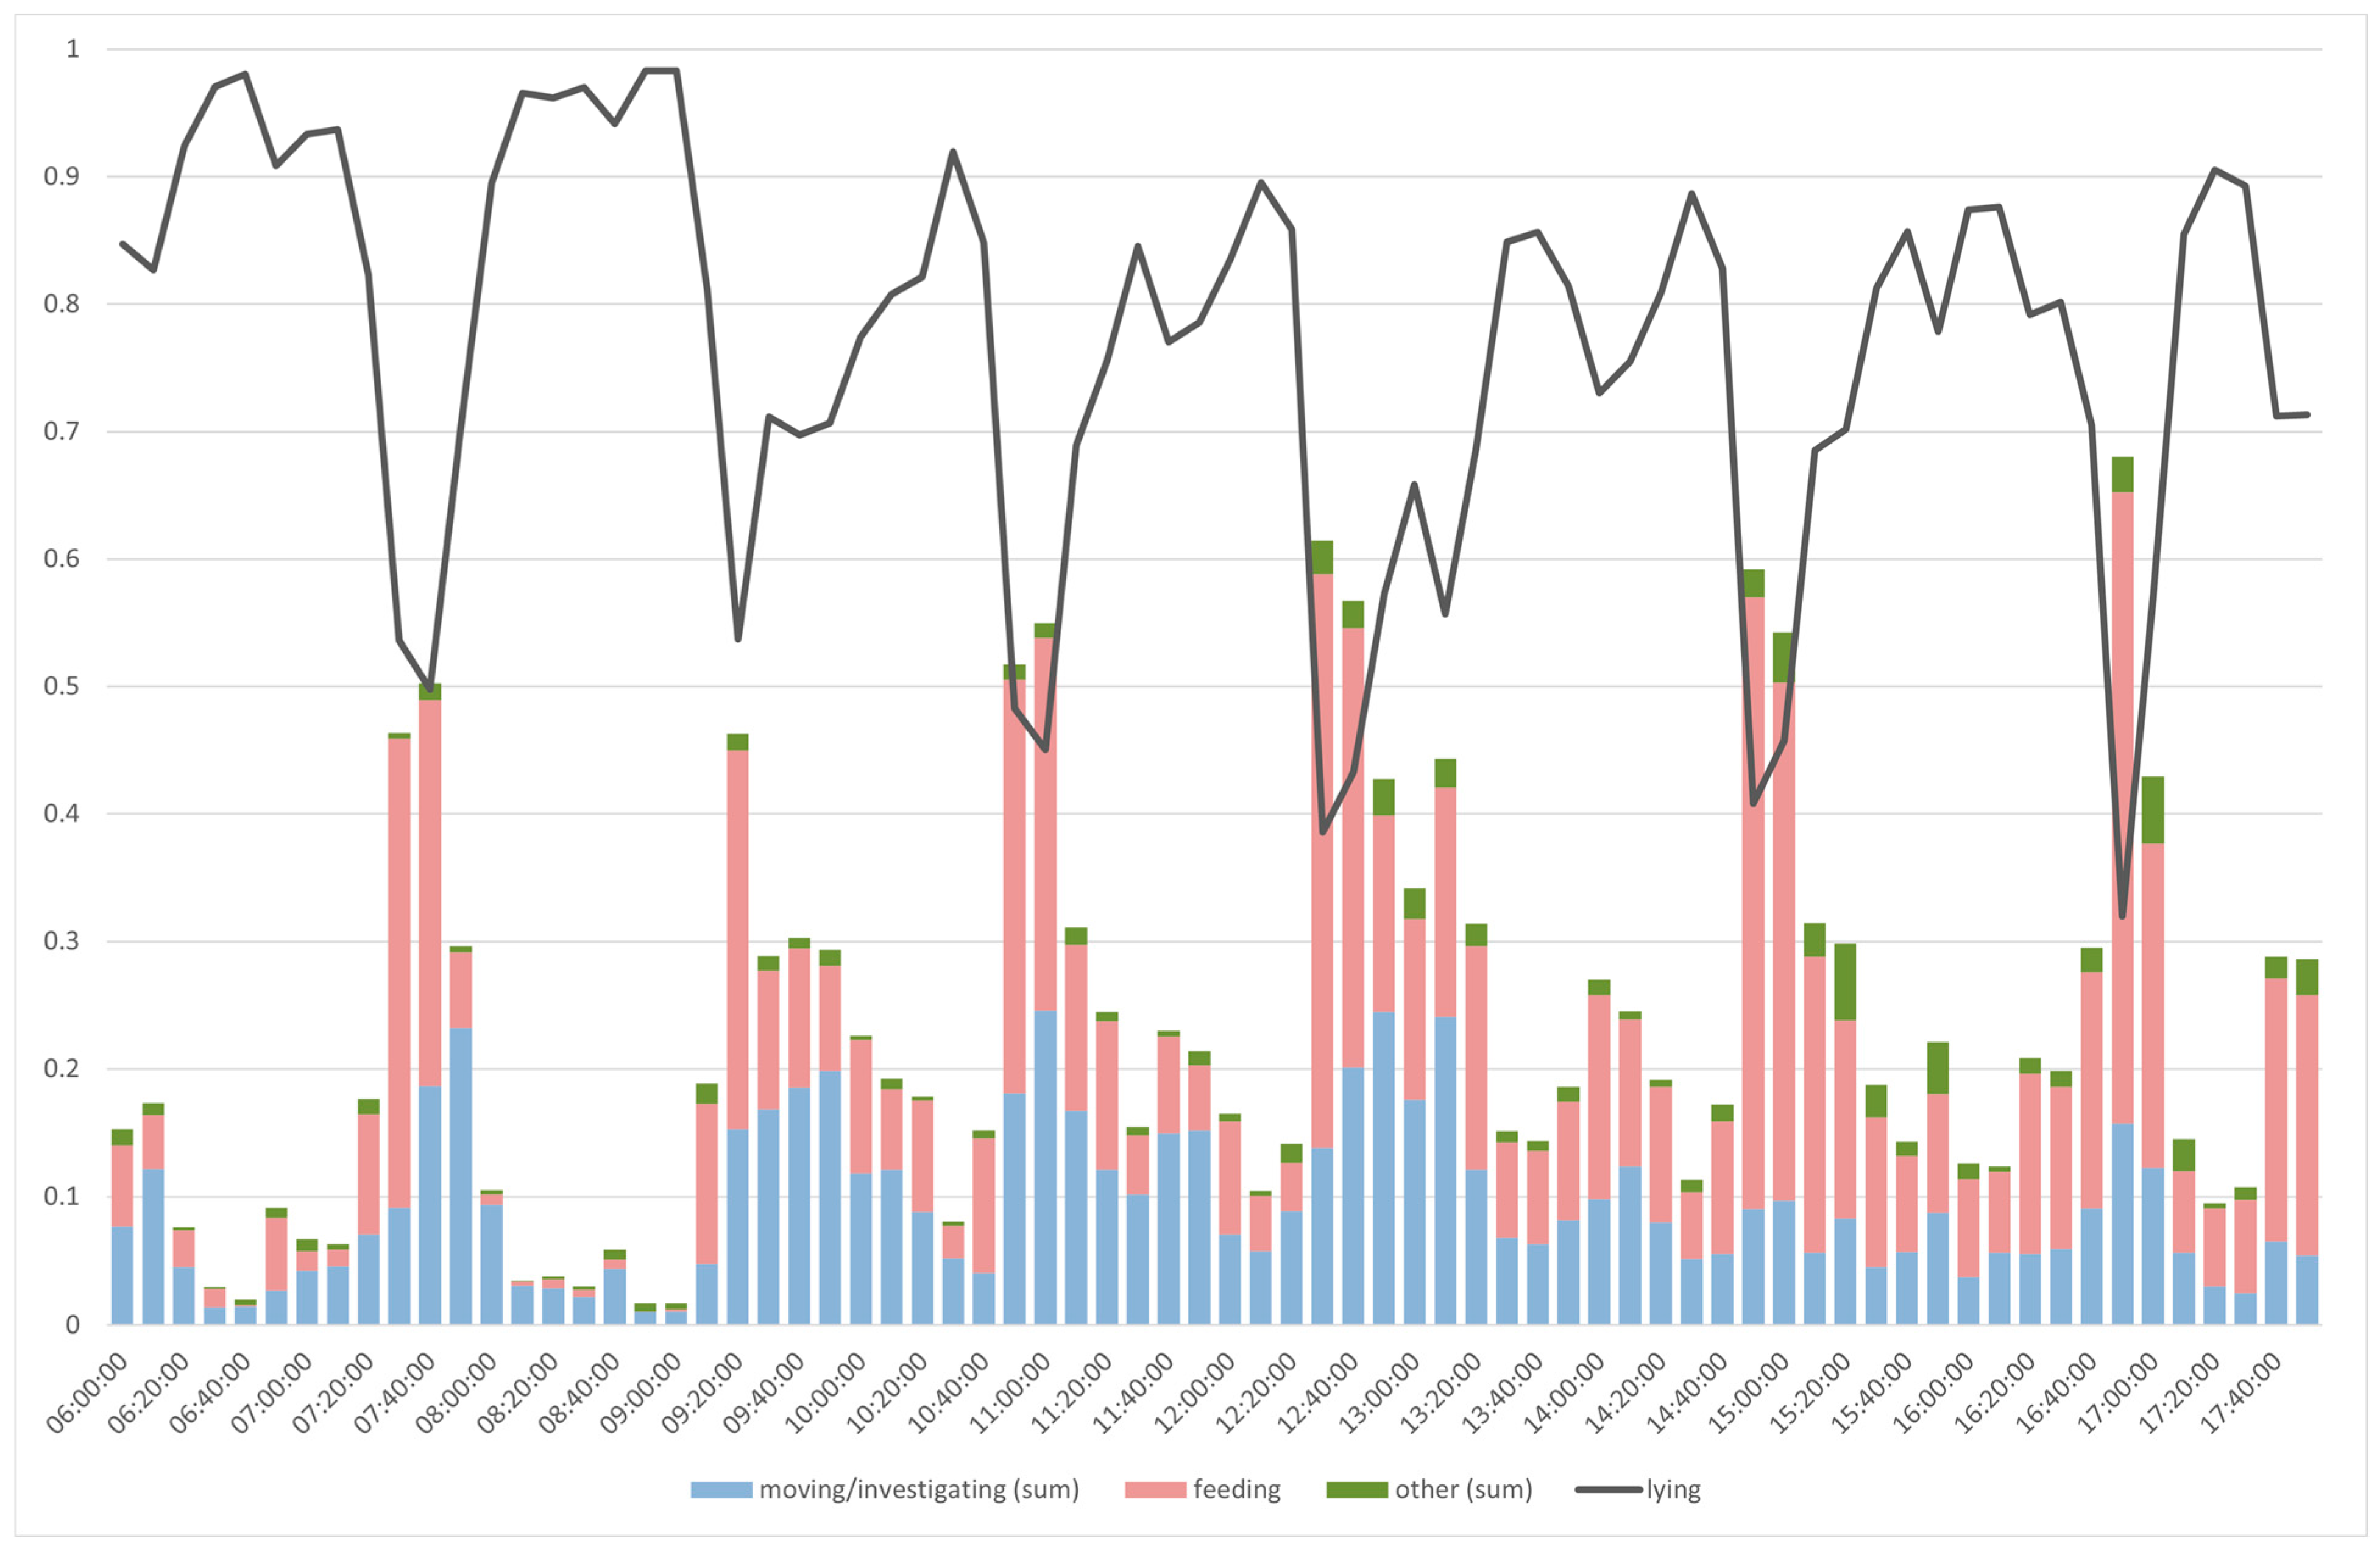
The relative distribution of each behavior across the general daily cycle within the experimental timeframe is summarized in Figure 4. In this analysis, lying and feeding behaviors were grouped together with the combined behavior of moving and investigating, while all other behaviors were categorized as “other”.
The most prominent behavior observed was lying, which accounted for up to 98.25% of the total behaviors in the 10-min time blocks averaged over all observation days. Other important behaviors included feeding (0.0–48.6%) and movement behaviors such as investigating (1.1–22.3%) or moving (0.1–11.1%). Other behaviors, such as defecating, had only brief occurrences, representing a small proportion of the overall time (0.0–1.3%).
The results confirm the hypothesis derived from the activity scores, indicating that the most pronounced changes in behavior occur during the seven feeding times. Lying behavior significantly decreased during the feeding episodes, while both movement behavior and feeding behavior increased. Although lying behavior almost returned to baseline levels between the morning feeding episodes, its proportion steadily declined throughout the day between feedings. Conversely, the proportions of behaviors associated with feeding during the feeding times increased (lowest proportion of feeding behavior during the second feeding: 29.3%, highest proportion during the sixth feeding: 48.6%).
The movement behaviors of moving and investigating were particularly pronounced after the feeding times and continued to increase between the feeding episodes throughout the day. Figure 5 illustrates the differentiated analysis between investigating and moving behaviors, showing that investigating behavior was more prevalent in the morning, while the movement behavior of moving increased toward the afternoon. Overall, a more heterogeneous distribution of different behaviors seemed to occur in the afternoon, even outside the feeding times.
The playing and defecating behaviors occurred proportionally for a shorter duration of time. The playing behavior exhibited an increase toward later times of the day, whereas the defecating behavior occurred at irregular intervals throughout the day. It can be observed that individual defecation events took a relatively short duration, thus, as shown here accounting for a minor portion of the overall time budget. However, of greater importance than the average duration of defecation was the frequency of individual defecation behaviors and their specific locations. On average, each pig exhibited defecation behavior approximately 5.31 (SD 1.2) times per day.
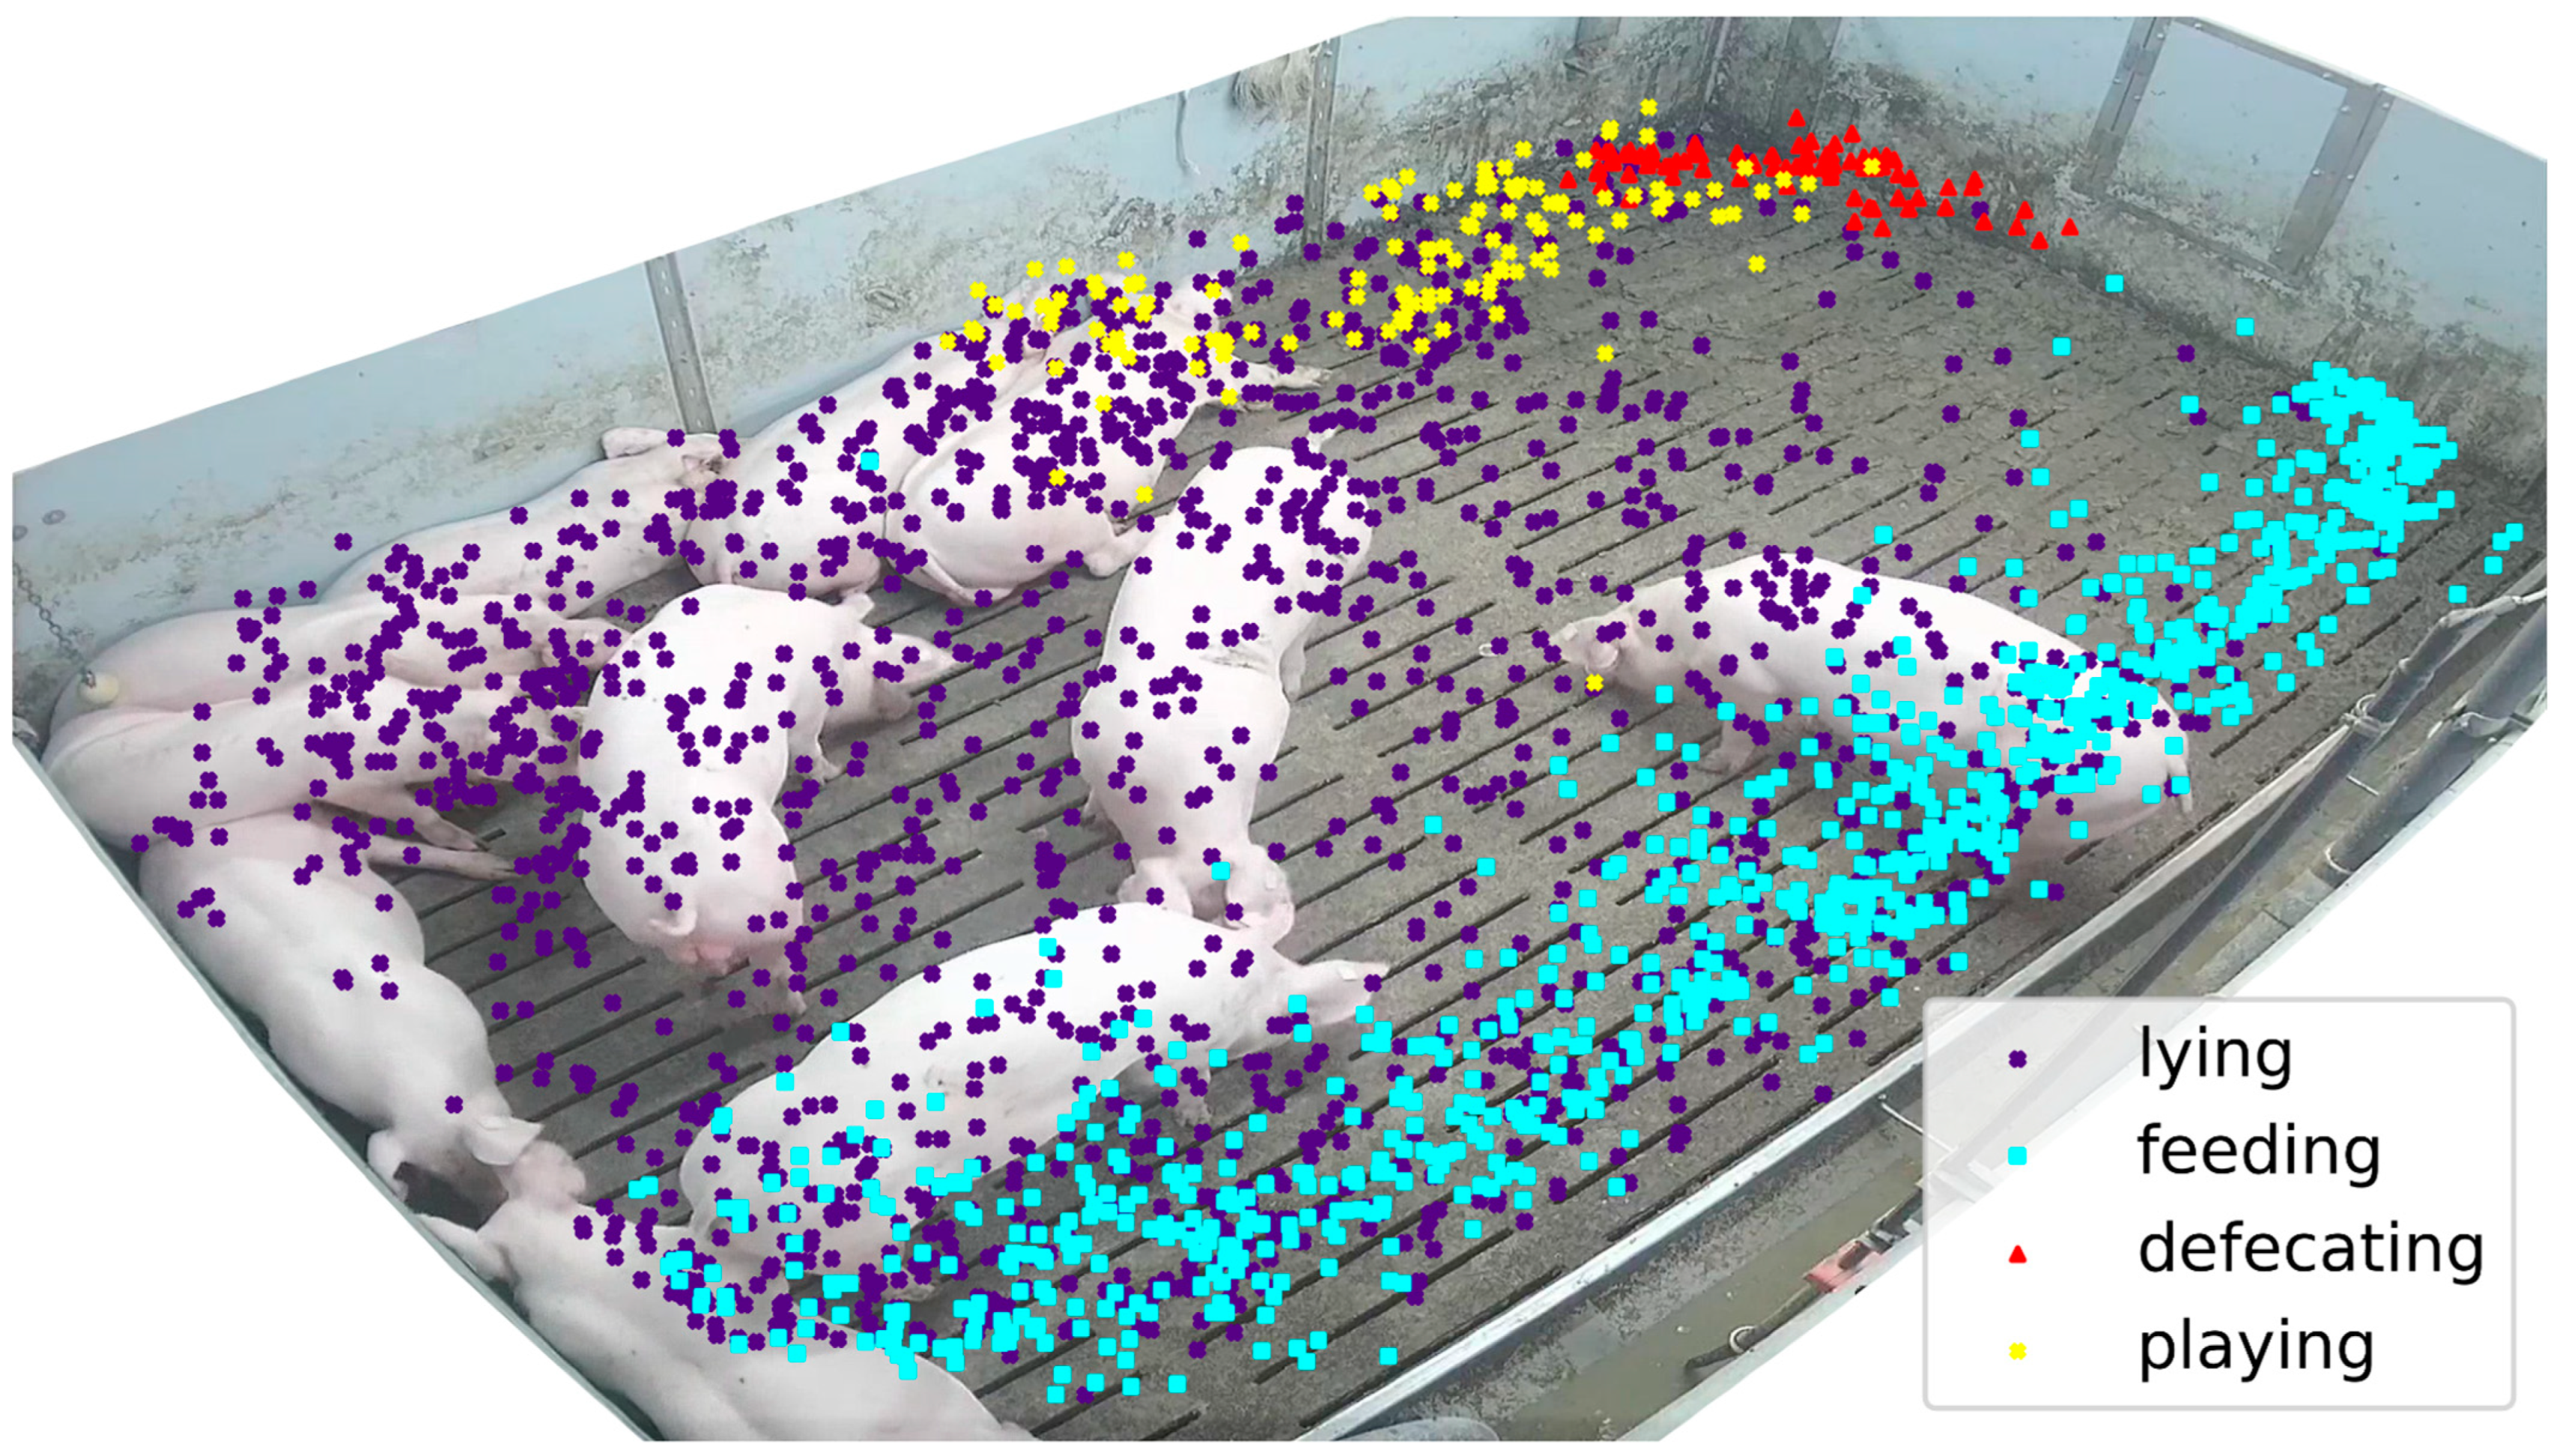
In addition to the temporal distribution of different behaviors, Figure 6 depicts the spatial occurrence of selected behaviors (lying, feeding, defecating, playing) for one day (13 November 2021). All recorded instances of lying, feeding, defecating and playing behaviors were assigned to the spatial coordinates of the pig pen, as extracted from the video footage. Evidently, there was a clustering of certain behaviors in specific areas of the pen. Feeding behavior appeared to be frequent near the feeding trough, while defecating behavior was more prevalent in one corner of the pig enclosure. In contrast, lying behavior was observed more frequently on the opposite side. Playing behavior was mainly detected close to the sisal rope. Only a few incidents appeared where specific behavior (e.g., lying, feeding, defecating, playing) was not detected in the specific spatial area.

3.4. Behavior Sequences/Process Mining

For process mining analysis, the event log extracted with the abstraction methods described in Section 2 was analyzed. This event log contains events that each indicate a pig performing an activity at a specific point in time. For each pig, the corresponding sequence of events lists the sequence of activities performed by this pig through time. The process mining analysis looked at behaviorally active phases (i.e., the behaviors between a pig standing up and lying back down). In the event log, each active phase of a pig is defined as a separate instance of the general underlying process (case). As lying is used as the activity indicating both the start and end of a process, this definition does not include behavioral patterns that are centered around lying. However, for the purpose of the analysis, it is sufficient to capture the lying frequency “statically” without a process mining analysis.
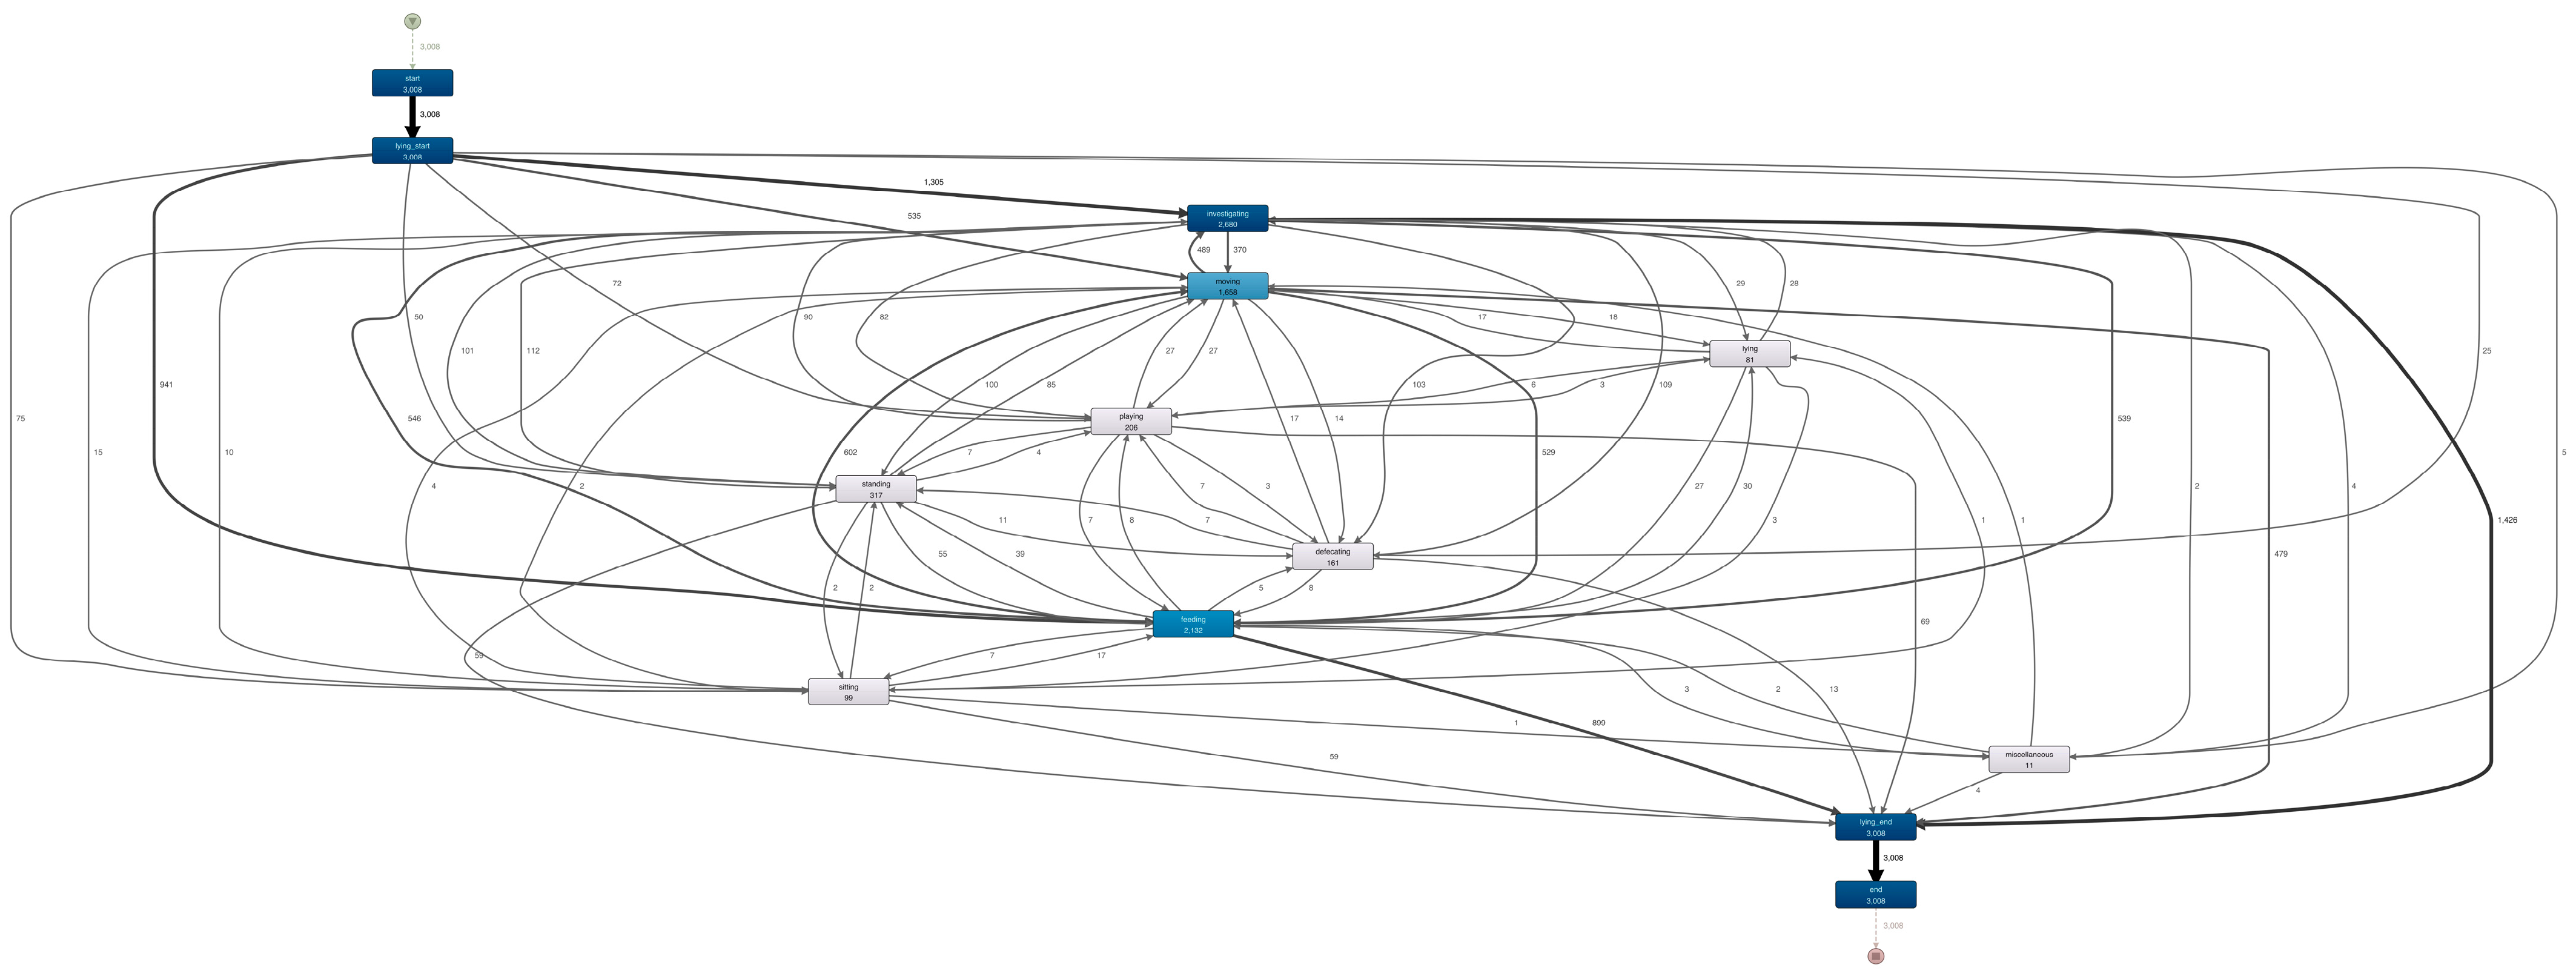
To extract process models from the event log, Disco was used for process discovery. In Disco, the process models, which are represented as vector models, are visualized as directed graphs where the nodes (boxes) represent an activity type and the edges (arrows) represent the discovered relationships between different activity types. These process models depict the sequences in which individual activities can unfold in the process, with paths connecting activities that follow each other. In the visualized process models, activity types are annotated with the frequency in which they occur in the extracted event data. Similarly, the arrows are annotated with the frequency in which the linked activities were observed following each other. Disco provides two filtering options, namely the Activities and Paths filters, which can be used to exclude rarely occurring activities and paths (i.e., sequences of activities) from the process model, and reduce the process models to visualize only the more common and significant paths.
The process model encompassing all activities extracted reveals a multitude of paths between and among activities, irrespective of their significance and occurrence (Figure 7). It becomes apparent that the vectors exhibit significant variations, owing to the fact that some paths are supported by only a small number of instances (e.g., only a few pigs transition from Activity A to Activity B via this particular path), while other activity sequences occur much more frequently.
Because it combines a multitude of different behavioral patterns, this model does not show any obvious apparent structure. Models like this, with a high degree of connection between activities, are known as “spaghetti models” to process analysts, and typically provide little to no analytical value. Process models become particularly interesting when certain behavioral patterns emerge, revealing recurring sequences of individual behaviors.
For a detailed analysis of specific sequences of behavioral patterns, it is advisable to filter out insignificant vectors to enhance clarity and comprehensibility. In order to identify and present such characteristic behavioral sequences in a clear manner, individual clusters were formed from the entire process data, and less prominent paths were filtered out.
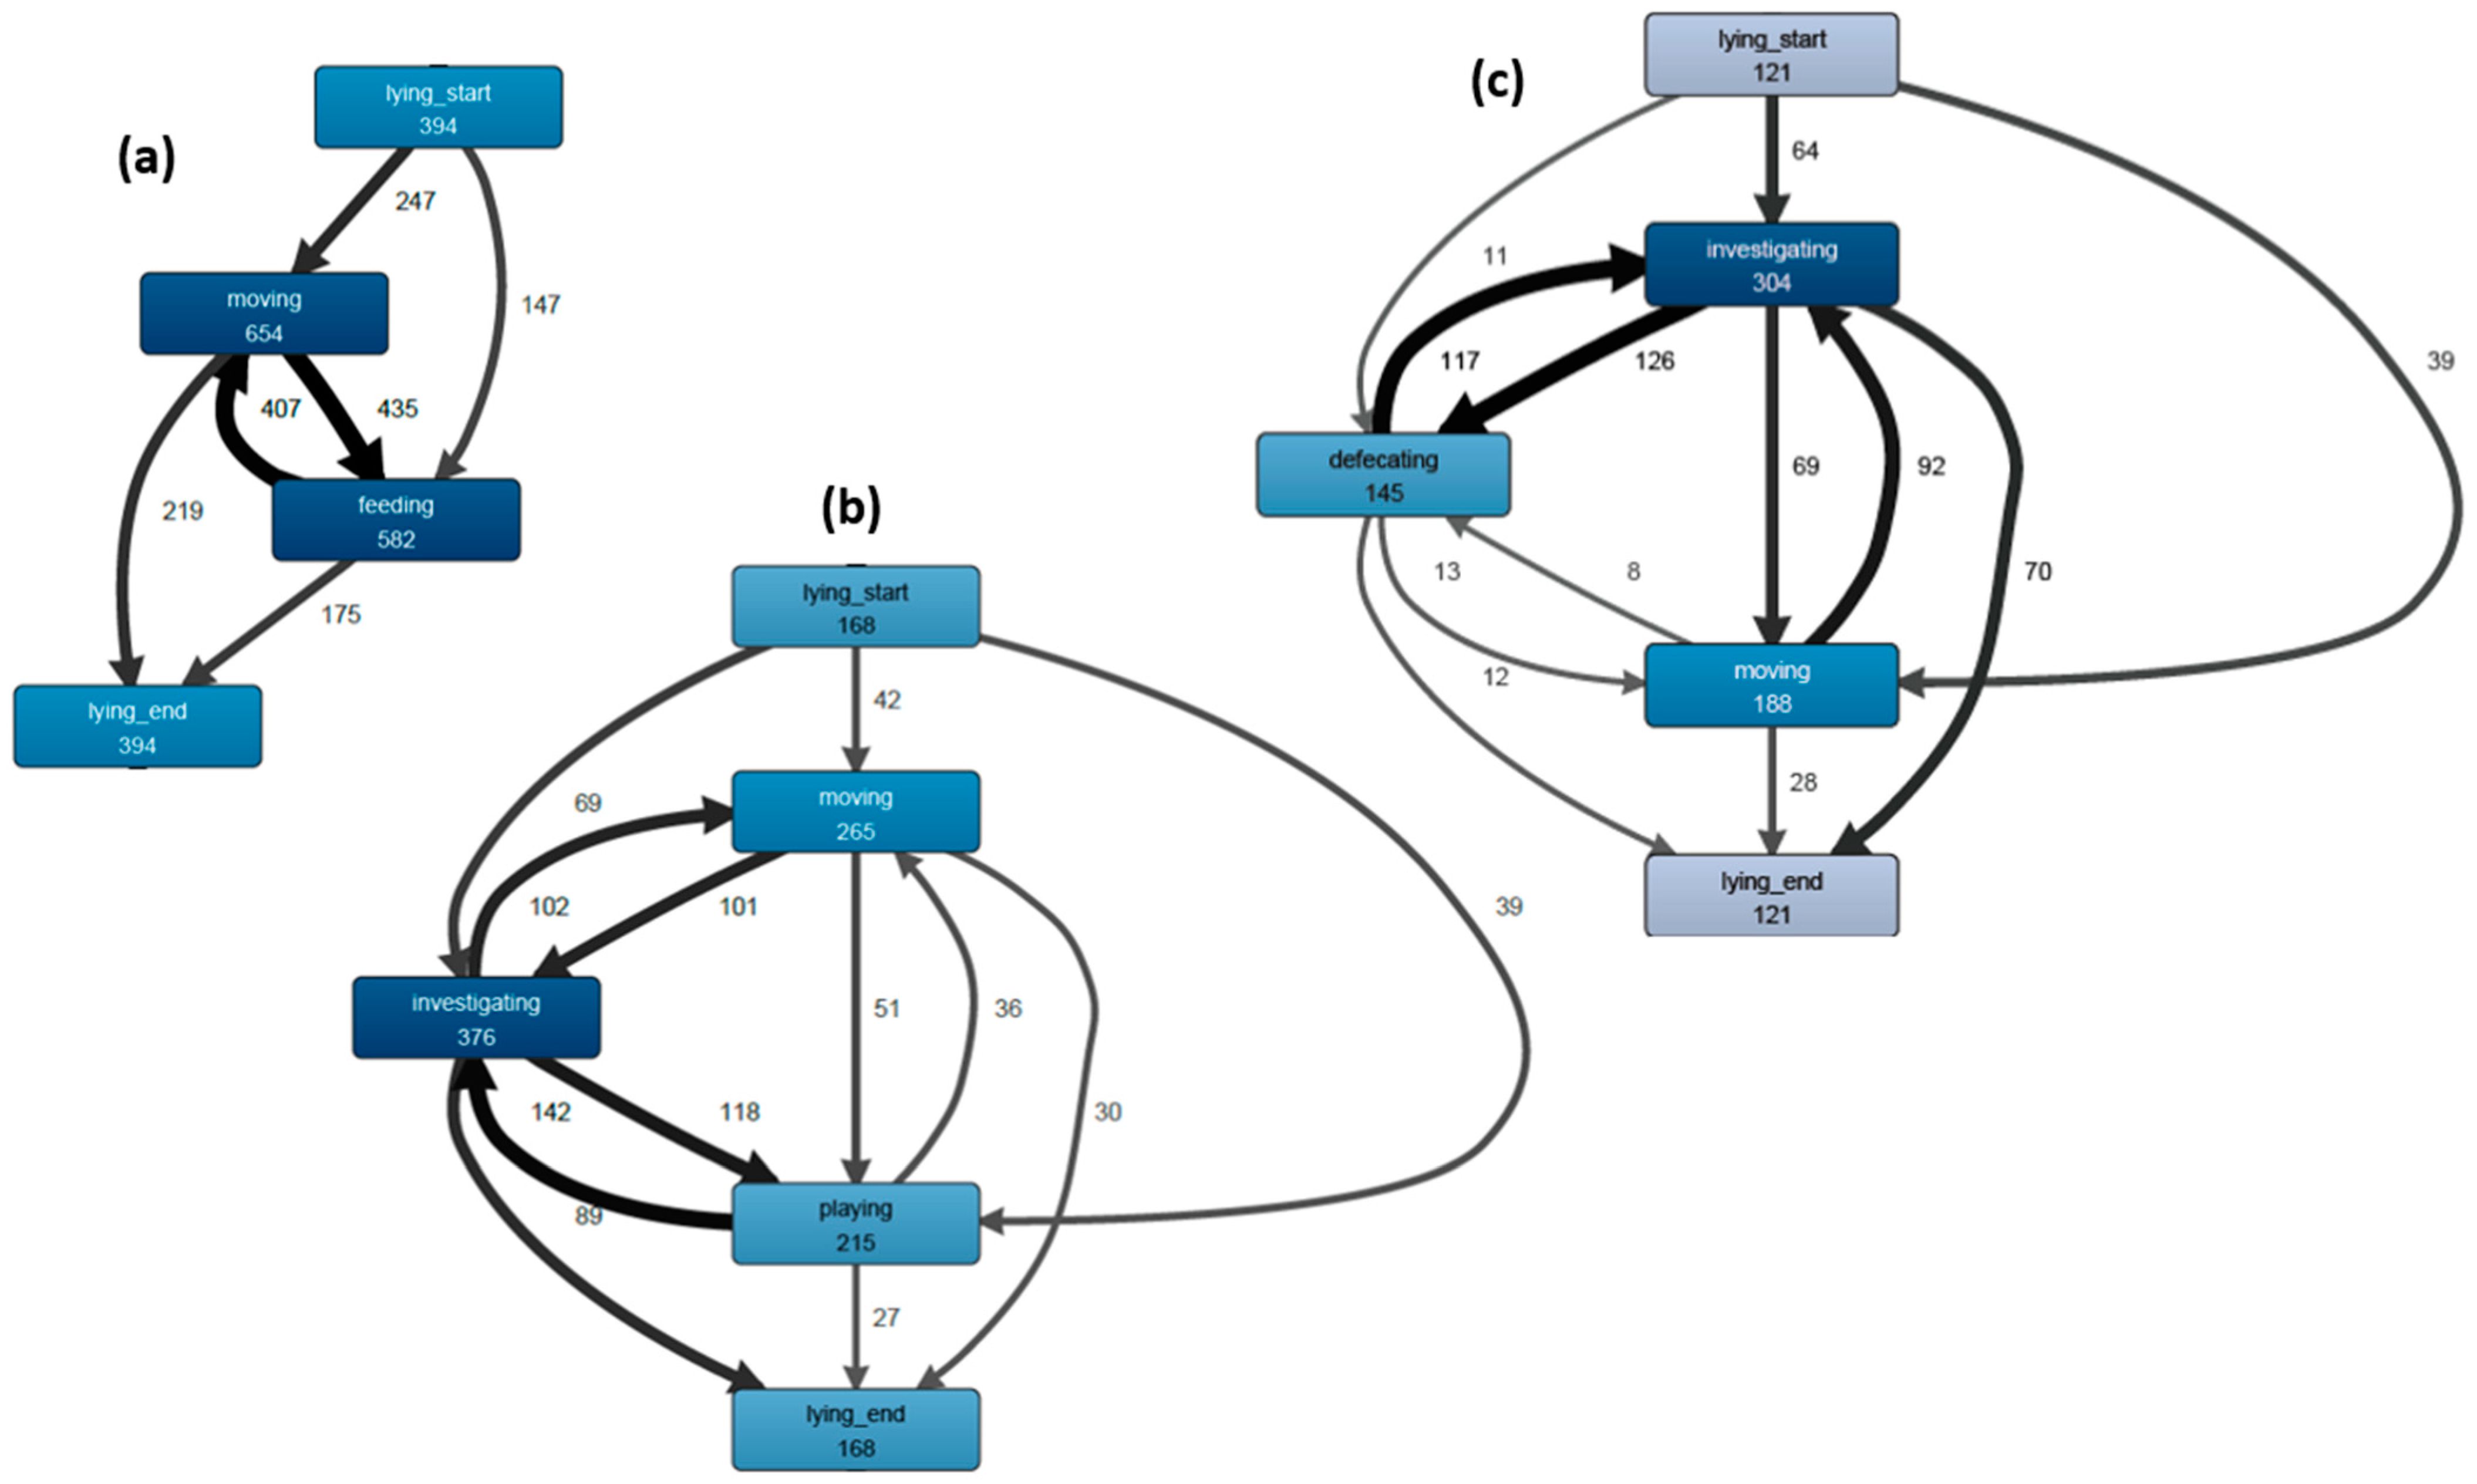
In Figure 8, 3 out of all 15 clustered event datasets are depicted as process models of behavioral sequences (Figure 8a–c) each having end of lying as a starting point (lying_start) and lying down again as static end points (lying_end) of the models. These clustered behavioral models—with a focus on (a) feeding, (b) investigating and playing and (c) defecating—demonstrate that investigating, along with moving, represents a significant behavior immediately following lying. However, these two behaviors, particularly moving, are typically intermediate steps toward the ultimate goal behavior, such as feeding, playing, or further investigating. The example of feeding behavior (Figure 8a) shows moving as an intermediate step before and during feeding.
Investigating on the other hand can also be identified as a key role before, after or in between different activities as in the examples of playing behavior (Figure 8b) or defecating behavior (Figure 8c). The latter cluster highlights the activity and behavioral sequences before, during and after the defecation process. As an example, out of 129 selected lying events, 64 transitioned into investigating behavior, while 39 lead to moving behavior, and 11 directly exhibited defecating behavior (missing branches to the total sum have been filtered out due to insignificant occurrence). Different process loops emerged with switches between defecating and investigating behaviors as well as moving and investigating behavior, ultimately resulting in lying down again, either directly or indirectly.

4. Discussion

This study described the steps necessary to apply process mining on video data with the purpose of identifying behaviors of fattening pigs. In detail the different steps from raw video data to automated process analyses, were described.

4.1. General Activity in the Pen

Video analysis is a widely used non-intrusive method in pig activity studies. This study identified distinct activity patterns, with high activity during feeding and the early afternoon, and low activity between morning feedings. This contrasts with other findings where pigs were more active in the morning [32,33,34,35]. Previous studies have also reported activity variations due to management and feeding [36,37]. Active phases during feeding times are linked to restricted feed access, as evidenced by studies with ad libitum feed distribution not showing similar daily activity peaks [6,38].

4.2. Behavior Patterns and Utilization of the Pen

4.2.1. Feeding

The feeding frequency of conventionally housed fattening pigs is 2–3 times daily, with feed consumed within 15 min after feeding [39,40] while it is suggested that offering feed more often may not be valuable considering short and active eating times [39]. In competitive situations, pigs’ diurnal patterns in feeding become less pronounced, and they will eat throughout the day rather than in two distinct peaks and will shift part of their feeding behavior into the night [41]. In this study the “feeding” behavior was increasingly detected directly after feed distribution which happened up to seven times per day. However, feeding activities were also detected as behavior patterns even when no feed was distributed. This was particularly evident later in the day, where up to 15% of all behaviors were still classified as feeding even 1.5 h after the last feeding dosage. It is highly likely that these behaviors do not represent actual feeding but rather other activities or visits to the feeding trough mistakenly attributed to feeding behavior. Furthermore, the association of specific movement patterns with particular behaviors also depends on the duration for which individual movement patterns need to be exhibited before being assigned to a specific behavioral category. Short visits to the feeding trough that do not indicate sustained feeding behavior should ideally be classified as investigating rather than feeding. Therefore, the duration of movement patterns plays a crucial role in determining their association with specific behaviors.
Regarding spatial distribution, the predominant occurrence of feeding behavior was observed in close proximity to the feeding trough, while a limited number of exceptions exhibited feeding behavior in alternative regions of the enclosure. However, in the case of feeding behavior these errors can easily be identified as the real feeding behavior pattern is directly linked to the feeding trough.

4.2.2. Defecating

Pigs tend to defecate multiple times throughout the day, while the actual time spent defecating is relatively short. The defecation frequency of grouped housed pigs varies depending on their diet and housing conditions. Pigs fed commercial diets with low fiber content generally have a decreased number of defecations, while pigs with higher fiber intake or on pasture may have an increased number of defecations [42]. According to Guo et al., 2015 [43] a total of 17.9 eliminative events per animal per day can happen among grouped housed pigs including urinations and defecations. Most eliminations in growing pigs occur during the daytime with the peak between 13:00 and 14:00 h, indicating a diurnal variation in elimination patterns [42,43]. Additionally, there is a positive correlation between pigs’ elimination and drinking behavior, as well as a relationship between urination frequency and activity level. In this study, only defecation behavior was classified as elimination behavior, confirming a peak in defecation during the early afternoon hours. The frequency of defecation events aligns with plausible results from other studies with four to seveen defecation events per pig per day [10,44]. Spatially, the identified defecation events were concentrated in a corner of the pen. This corresponds to the intrinsic behavior of pigs to create designated defecation areas away from resting areas and in protected locations, such as in this case, against the pen walls. The study by Guo et al., (2015) found that the pigs preferred corners as dunging areas intending to prevent them from being disturbed during elimination. Adhering to designated defecation areas is crucial for pen hygiene and the mitigation of emissions. Deviations from this behavior can quickly lead to contamination in other areas of the pen, such as the resting area resulting in unsolicited hygienic issues and potential emission sources for ammonia and other gasses. In this study, deviations in accessing the defecation area for defecation purposes were scarcely observed, as due to the consistent climatic conditions and the relatively short duration of the experiment, deviations were unlikely.

4.2.3. Lying/Resting

Comparable to Ekkel et al., (2003) and Ruckebush et al., (1972) [38,45], the findings in this study highlight lying behavior as the dominant activity, accounting for up to 80% of the total time budget, while the percentage of lying decreased during the latter half of the day. No conclusions can be drawn regarding nocturnal lying activities, as the evaluation period did not encompass nighttime observations. Lying behavior predominantly occurred within the clustered lying area, indicating a preference for specific lying zones. Additional spatial distribution analysis could quantify space requirements for all lying pigs, taking into account their tendency to lie down simultaneously for a substantial portion of the day. Notably, this study did not consider the lying posture of the pigs. Differentiating between lying postures which are known to vary throughout the day [38] could provide additional insights into climate conditions.

4.3. Behavior Sequences/Process Mining

The focus of this study was to investigate general patterns of behavior occurrence and succession rather than tracking individual animals and their complete behavior sequence. There are various approaches available for individual tracking, including those based on video data [46], as well as the utilization of RFID (Radio Frequency Identification) technology. RFID chips offer an alternative means to track animal encounters and interactions with objects [47,48,49], which could present an interesting avenue as ID verification in combination with tracking based on video data.

4.3.1. Defecating

Pigs tend to show specific behavior sequences like eating, drinking, urinating, and defecating as normal behavior. The general defecation behavior of grouped housed pigs involves sniffing before elimination in 50–70% of observations and followed by moving away immediately after elimination [42]. Typical elimination sequences are exploring-elimination-moving and moving-elimination-moving [43] or as described by Wechsler and Bachmann (1998) [50] in detail: enter the dunging area, sniff, posture, defecate/urinate. Similar behavioral sequences can be observed in this study using process mining of video data. Clustered process models identified the sequence investigating-defecating-investigating together with investigating-moving-investigating as major behavior sequences for the defecation process which is consistent with the literature.
The analyses of defecation behavior and its integration into behavior sequences can serve as crucial early warning tools for detecting anomalies in management practices [9,43]. Deviations from the designated defecation area or alterations in defecation behavior within behavior sequences due to external disruptions or specific environmental conditions (e.g., climatic factors) can be utilized as valuable management indicators. Monitoring and recognizing such changes in defecation patterns may aid in identifying potential issues in pig husbandry and provide valuable insights for optimizing management strategies to ensure animal welfare and overall system efficiency.

4.3.2. Feeding

The feeding behavior of fattening pigs is highly dependent on the management system. In feeding managements comparable to this study (with restricted access to feed and fixed feeding times) pigs tend to demonstrate movement towards the feeding trough in close temporal proximity to their regular feeding schedule. Additionally, pigs are stimulated by the group in movement and feeding [51]. Behavior sequences identified in the clustered process models in this study highlight the behavior sequence of moving-feeding, direct link to feeding (Figure 8a) or looped behavior of moving-feeding-moving (or investigating-feeding-investigating data not shown here) in between two lying periods. A severe amount of feeding activities could be identified between two lying periods without additional moving or investigating behavior. These different findings generally comply with the assumptions from Signoret et al., (1975) [51]. This indicates that the process mining approach can identify relevant behavioral sequences. Deviations are noticeable in cases where feeding behavior directly follows lying behavior and then transitions back into lying behavior. It is highly likely that this pattern is influenced by the duration of time a specific behavior needs to be performed before it can be attributed to a particular category. Fine-tuning the threshold settings for this duration could be one possibility to enhance the accuracy and robustness of the models.
The application of process mining on video data enables the identification of behavior sequences and holds potential for behavioral analysis under various influencing factors. Moreover, it can be considered as an early warning tool, capable of detecting deviations from established and typical behavior sequences, facilitating timely intervention and improved management practices.

5. Conclusions

The steps of the path from activity recognition in image data to the new approach of identification of behavioral sequences using process mining for describing behavioral patterns in pigs exhibit similar approaches to what happens in the pig pen, albeit with increasing levels of detail. All results from the steps of the path demonstrate plausible conclusions and can be measured with comparable approaches. The process models for describing behavioral sequences in pig behavior represent a novel approach that successfully identifies individual behavioral patterns and clusters them into distinct sequences. Future in-depth analyses could depict additional behavioral sequences with different start and end behaviors or consider further behavioral differentiations. Overall, this method presents a promising approach for the automated assessment of pig behavior and behavioral sequences based on video data. The identification of such behavioral sequences is crucial for understanding the natural flow of activities and the underlying patterns in pig behavior. This knowledge can inform management decisions and shed light on potential deviations or anomalies that require attention. The recognition and spatial assignment of defecation behavior can be a valuable tool in reducing workload and minimizing environmental impact by ensuring adherence to designated defecation areas, particularly in freely ventilated barns with structured functional areas. Further investigations are needed to transfer this method to structured multi-area pens with or without freely ventilated conditions. Also additional efforts should focus on refining the process mining approach by exploring different threshold settings and incorporating additional variables to improve the models.

Author Contributions

Conceptualization, A.M. and A.L.; methodology, A.L. and J.B.; software, A.L. and J.B.; validation, A.M., A.K. and E.H.; formal analysis, A.M.; investigation, A.M.; resources, A.M.; data curation, A.M, A.L. and J.B.; writing—original draft preparation, A.M. and A.L.; writing—review and editing, A.M., A.L. and A.K.; visualization, A.L. and J.B.; supervision, A.K. and E.H.; project administration, A.M.; funding acquisition, A.M. and A.K. All authors have read and agreed to the published version of the manuscript.

Funding

This project has received funding from the State of Schleswig-Holstein under the Datencampus project grant no. 220 21 016.

Institutional Review Board Statement

Ethical review and approval were waived for this study due to the nature of the data collection process. The video data recording was conducted in normal farm conditions, and no alterations or interventions were made as part of the study. As a result, there were no potential risks or harms to human or animal subjects, and the study strictly adhered to ethical guidelines and regulations. Consequently, the animal welfare officer deemed that an ethical review and approval process was unnecessary for this particular study.

Data Availability Statement

The raw video materials are not publicly available due to copyright restrictions. Data including the results of object detection, object tracking, and activity recognition is available under the following reference: [52]. The code can be downloaded under the following link: https://github.com/arvidle/video-process-mining-public (accessed on 18 August 2023).

Acknowledgments

We would like to thank the Schleswig-Holstein Chamber of Agriculture, especially the Futterkamp experimental barn, for the opportunity to record the videos and for providing the accompanying parameters.

Conflicts of Interest

The authors declare no conflict of interest.

References

  1. Van Zelst, S.J.; Mannhardt, F.; de Leoni, M.; Koschmider, A. Event Abstraction in Process Mining: Literature Review and Taxonomy. Granul. Comput. 2021, 6, 719–736. [Google Scholar] [CrossRef]
  2. Chen, C.; Zhu, W.; Norton, T. Behaviour Recognition of Pigs and Cattle: Journey from Computer Vision to Deep Learning. Comput. Electron. Agric. 2021, 187, 106255. [Google Scholar] [CrossRef]
  3. Nasirahmadi, A.; Hensel, O.; Edwards, S.A.; Sturm, B. A New Approach for Categorizing Pig Lying Behaviour Based on a Delaunay Triangulation Method. Anim. Int. J. Anim. Biosci. 2017, 11, 131–139. [Google Scholar] [CrossRef]
  4. Yang, Q.; Xiao, D.; Lin, S. Feeding Behavior Recognition for Group-Housed Pigs with the Faster R-CNN. Comput. Electron. Agric. 2018, 155, 453–460. [Google Scholar] [CrossRef]
  5. Fernández-Carrión, E.; Martínez-Avilés, M.; Ivorra, B.; Martínez-López, B.; Ramos, Á.M.; Sánchez-Vizcaíno, J.M. Motion-Based Video Monitoring for Early Detection of Livestock Diseases: The Case of African Swine Fever. PLoS ONE 2017, 12, e0183793. [Google Scholar] [CrossRef]
  6. Bergamini, L.; Pini, S.; Simoni, A.; Vezzani, R.; Calderara, S.; D’Eath, R.; Fisher, R. Extracting Accurate Long-Term Behavior Changes from a Large Pig Dataset. In Proceedings of the 16th International Joint Conference on Computer Vision, Imaging and Computer Graphics Theory and Applications, Virtual, 8–10 February 2021; SCITEPRESS—Science and Technology Publications: Setúbal, Portugal, 2021; pp. 524–533. [Google Scholar]
  7. Nannoni, E.; Aarnink, A.J.A.; Vermeer, H.M.; Reimert, I.; Fels, M.; Bracke, M.B.M. Soiling of Pig Pens: A Review of Eliminative Behaviour. Anim. 2020, 10, 2025. [Google Scholar] [CrossRef]
  8. Hacker, R.R.; Ogilvie, J.R.; Morrison, W.D.; Kains, F. Factors Affecting Excretory Behavior of Pigs. J. Anim. Sci. 1994, 72, 1455–1460. [Google Scholar] [CrossRef]
  9. Höne, U.; Krause, E.T.; Bussemas, R.; Traulsen, I.; Schrader, L. Usage of Outdoor Runs and Defaecation Behaviour of Fattening Pigs. Appl. Anim. Behav. Sci. 2023, 258, 105821. [Google Scholar] [CrossRef]
  10. Aarnink, A.J.A.; van den Berg, A.J.; Keen, A.; Hoeksma, P.; Verstegen, M.W.A. Effect of Slatted Floor Area on Ammonia Emission and on the Excretory and Lying Behaviour of Growing Pigs. J. Agric. Eng. Res. 1996, 64, 299–310. [Google Scholar] [CrossRef]
  11. Matthews, S.G.; Miller, A.L.; Clapp, J.; Plötz, T.; Kyriazakis, I. Early Detection of Health and Welfare Compromises through Automated Detection of Behavioural Changes in Pigs. Vet. J. Lond. Engl. 1997 2016, 217, 43–51. [Google Scholar] [CrossRef]
  12. Matthews, S.G.; Miller, A.L.; Plötz, T.; Kyriazakis, I. Automated Tracking to Measure Behavioural Changes in Pigs for Health and Welfare Monitoring. Sci. Rep. 2017, 7, 17582. [Google Scholar] [CrossRef]
  13. D’Eath, R.B.; Jack, M.; Futro, A.; Talbot, D.; Zhu, Q.; Barclay, D.; Baxter, E.M. Automatic Early Warning of Tail Biting in Pigs: 3D Cameras Can Detect Lowered Tail Posture before an Outbreak. PLoS ONE 2018, 13, e0194524. [Google Scholar] [CrossRef]
  14. Oczak, M.; Viazzi, S.; Ismayilova, G.; Sonoda, L.T.; Roulston, N.; Fels, M.; Bahr, C.; Hartung, J.; Guarino, M.; Berckmans, D.; et al. Classification of Aggressive Behaviour in Pigs by Activity Index and Multilayer Feed Forward Neural Network. Biosyst. Eng. 2014, 119, 89–97. [Google Scholar] [CrossRef]
  15. Chen, C.; Zhu, W.; Steibel, J.; Siegford, J.; Wurtz, K.; Han, J.; Norton, T. Recognition of Aggressive Episodes of Pigs Based on Convolutional Neural Network and Long Short-Term Memory. Comput. Electron. Agric. 2020, 169, 105166. [Google Scholar] [CrossRef]
  16. Lepsien, A.; Koschmider, A.; Kratsch, W. Analytics Pipeline for Process Mining on Video Data. In Proceedings of the BPM 2023 Forum; Springer: Cham, Switzerland, 2023; Volume 490. [Google Scholar]
  17. Bundesministerium für Ernährung und Landwirtschaft Verordnung Zum Schutz Landwirtschaftlicher Nutztiere Und Anderer Zur Erzeugung Tierischer Produkte Gehaltener Tiere Bei Ihrer Haltung (Tierschutz-Nutztierhaltungsverordnung—TierSchNutztV): TierSchNutztV. Bundesgesetzblatt 2021, 2021, 142–145.
  18. The European Parliament Council Directive 2008/120/EC of 18 December 2008 Laying down Minimum Standards for the Protection of Pigs. Regul. EU 2017625 Eur. Parliam. Counc. 15 March 2017. 2019. Available online: https://eur-lex.europa.eu/legal-content/EN/ALL/?uri=CELEX%3A32008L0120 (accessed on 18 August 2023).
  19. Vermeer, H.; Dirx-Kuijken, N.; Bracke, M. Exploration Feeding and Higher Space Allocation Improve Welfare of Growing-Finishing Pigs. Animals 2017, 7, 36. [Google Scholar] [CrossRef]
  20. Spoolder, H.A.M.; Aarnink, A.A.J.; Vermeer, H.M.; van Riel, J.; Edwards, S.A. Effect of Increasing Temperature on Space Requirements of Group Housed Finishing Pigs. Appl. Anim. Behav. Sci. 2012, 138, 229–239. [Google Scholar] [CrossRef]
  21. Lepsien, A.; Bosselmann, J.; Melfsen, A.; Koschmider, A. Process Mining on Video Data. In Proceedings of the ZEUS 2022, Virtual, 24–25 February 2022; Manner, J., Lübke, D., Haarmann, S., Kolb, S., Herzberg, N., Kopp, O., Eds.; CEUR-WS.org: Bamberg, Germany, 2022; Volume 3113, pp. 56–62. [Google Scholar]
  22. Wang, C.-Y.; Bochkovskiy, A.; Liao, H.-Y.M. YOLOv7: Trainable Bag-of-Freebies Sets New State-of-the-Art for Real-Time Object Detectors. arXiv 2022, arXiv:2207.02696v1. [Google Scholar]
  23. Deng, J.; Dong, W.; Socher, R.; Li, L.-J.; Li, K.; Fei-Fei, L. ImageNet: A Large-Scale Hierarchical Image Database. In Proceedings of the 2009 IEEE Conference on Computer Vision and Pattern Recognition, Miami, FL, USA, 20–25 June 2009; pp. 248–255. [Google Scholar]
  24. Shermin, T.; Teng, S.W.; Murshed, M.; Lu, G.; Sohel, F.; Paul, M. Enhanced Transfer Learning with ImageNet Trained Classification Layer. In Proceedings of the PSVIT 2019, Proceedings 9, Sydney, NSW, Australia, 18–22 November 2019; Lee, C., Su, Z., Sugimoto, A., Eds.; Springer: Cham, Switzerland, 2019; Volume 11854, pp. 142–155. [Google Scholar]
  25. Zhang, Y.; Sun, P.; Jiang, Y.; Yu, D.; Weng, F.; Yuan, Z.; Luo, P.; Liu, W.; Wang, X. ByteTrack: Multi-Object Tracking by Associating Every Detection Box. In Proceedings of the ECCV 2022, Tel Aviv, Israel, 23–27 October 2022; Avidan, S., Brostow, G., Cissé, M., Farinella, G.M., Hassner, T., Eds.; Springer: Cham, Switzerland, 2022; pp. 1–21. [Google Scholar]
  26. Luo, W.; Xing, J.; Milan, A.; Zhang, X.; Liu, W.; Kim, T.-K. Multiple Object Tracking: A Literature Review. Artif. Intell. 2021, 293, 103448. [Google Scholar] [CrossRef]
  27. Feichtenhofer, C.; Fan, H.; Malik, J.; He, K. SlowFast Networks for Video Recognition. In Proceedings of the ICCV 2019, Seoul, Republic of Korea, 27 October–2 November 2019; pp. 6201–6210. [Google Scholar]
  28. Li, D.; Zhang, K.; Li, Z.; Chen, Y. A Spatiotemporal Convolutional Network for Multi-Behavior Recognition of Pigs. Sensors 2020, 20, 2381. [Google Scholar] [CrossRef]
  29. Kay, W.; Carreira, J.; Simonyan, K.; Zhang, B.; Hillier, C.; Vijayanarasimhan, S.; Viola, F.; Green, T.; Back, T.; Natsev, P.; et al. The Kinetics Human Action Video Dataset. arXiv 2017, arXiv:1705.06950. [Google Scholar]
  30. Zandkarimi, F.; Rehse, J.-R.; Soudmand, P.; Hoehle, H. A Generic Framework for Trace Clustering in Process Mining. In Proceedings of the ICPM 2020, Padua, Italy, 5–8 October 2020; pp. 177–184. [Google Scholar]
  31. Van der Aalst, W.; Adriansyah, A.; de Medeiros, A.K.A.; Arcieri, F.; Baier, T.; Blickle, T.; Bose, J.C.; van den Brand, P.; Brandtjen, R.; Buijs, J.; et al. Process Mining Manifesto. In Proceedings of the BPM 2011 Workshops, Clermont-Ferrand, France, 29 August 2011; Daniel, F., Barkaoui, K., Dustdar, S., Eds.; Springer: Berlin/Heidelberg, Germany, 2012; Volume 99, pp. 169–194. [Google Scholar]
  32. Shao, B.; Xin, H. A Real-Time Computer Vision Assessment and Control of Thermal Comfort for Group-Housed Pigs. Comput. Electron. Agric. 2008, 62, 15–21. [Google Scholar] [CrossRef]
  33. Chung, Y.; Kim, H.; Lee, H.; Park, D.; Jeon, T.; Chang, H.-H. A Cost-Effective Pigsty Monitoring System Based on a Video Sensor. KSII Trans. Internet Inf. Syst. 2014, 8, 1481–1498. [Google Scholar] [CrossRef]
  34. Costa, A.; Ismayilova, G.; Borgonovo, F.; Viazzi, S.; Berckmans, D.; Guarino, M. Image-Processing Technique to Measure Pig Activity in Response to Climatic Variation in a Pig Barn. Anim. Prod. Sci. 2014, 54, 1075. [Google Scholar] [CrossRef]
  35. Bloemen, H.; Aerts, J.M.; Berckmans, D.; Goedseels, V. Image Analysis to Measure Activity Index of Animals. Equine Vet. J. Suppl. 1997, 29, 16–19. [Google Scholar] [CrossRef] [PubMed]
  36. Ni, J.-Q.; Liu, S.; Radcliffe, J.S.; Vonderohe, C. Evaluation and Characterisation of Passive Infrared Detectors to Monitor Pig Activities in an Environmental Research Building. Biosyst. Eng. 2017, 158, 86–94. [Google Scholar] [CrossRef]
  37. Costa, A.; Ismayilova, G.; Borgonovo, F.; Leroy, T.; Berckmans, D.; Guarino, M. The Use of Image Analysis as a New Approach to Assess Behaviour Classification in a Pig Barn. Acta Vet. Brno 2013, 82, 25–30. [Google Scholar] [CrossRef]
  38. Ekkel, E.D.; Spoolder, H.A.M.; Hulsegge, I.; Hopster, H. Lying Characteristics as Determinants for Space Requirements in Pigs. Appl. Anim. Behav. Sci. 2003, 80, 19–30. [Google Scholar] [CrossRef]
  39. Zoric, M.; Johansson, S.-E.; Wallgren, P. Behaviour of Fattening Pigs Fed with Liquid Feed and Dry Feed. Porc. Health Manag. 2015, 1, 14. [Google Scholar] [CrossRef]
  40. Persson, E.; Wülbers-Mindermann, M.; Berg, C.; Algers, B. Increasing Daily Feeding Occasions in Restricted Feeding Strategies Does Not Improve Performance or Well Being of Fattening Pigs. Acta Vet. Scand. 2008, 50, 24. [Google Scholar] [CrossRef]
  41. Bus, J.D.; Boumans, I.J.M.M.; Webb, L.E.; Bokkers, E.A.M. The Potential of Feeding Patterns to Assess Generic Welfare in Growing-Finishing Pigs. Appl. Anim. Behav. Sci. 2021, 241, 105383. [Google Scholar] [CrossRef]
  42. Andersen, H.M.-L.; Kongsted, A.G.; Jakobsen, M. Pig Elimination Behavior—A Review. Appl. Anim. Behav. Sci. 2020, 222, 104888. [Google Scholar] [CrossRef]
  43. Guo, Y.; Lian, X.; Yan, P. Diurnal Rhythms, Locations and Behavioural Sequences Associated with Eliminative Behaviours in Fattening Pigs. Appl. Anim. Behav. Sci. 2015, 168, 18–23. [Google Scholar] [CrossRef]
  44. Tillmanns, M.; Scheepens, K.; Stolte, M.; Herbrandt, S.; Kemper, N.; Fels, M. Implementation of a Pig Toilet in a Nursery Pen with a Straw-Littered Lying Area. Animals 2022, 12, 113. [Google Scholar] [CrossRef] [PubMed]
  45. Ruckebusch, Y. The Relevance of Drowsiness in the Circadian Cycle of Farm Animals. Anim. Behav. 1972, 20, 637–643. [Google Scholar] [CrossRef]
  46. Van Der Zande, L.E.; Guzhva, O.; Rodenburg, T.B. Individual Detection and Tracking of Group Housed Pigs in Their Home Pen Using Computer Vision. Front. Anim. Sci. 2021, 2, 669312. [Google Scholar] [CrossRef]
  47. Maselyne, J.; Adriaens, I.; Huybrechts, T.; De Ketelaere, B.; Millet, S.; Vangeyte, J.; Van Nuffel, A.; Saeys, W. Measuring the Drinking Behaviour of Individual Pigs Housed in Group Using Radio Frequency Identification (RFID). Animal 2016, 10, 1557–1566. [Google Scholar] [CrossRef] [PubMed]
  48. Gómez, Y.; Stygar, A.H.; Boumans, I.J.M.M.; Bokkers, E.A.M.; Pedersen, L.J.; Niemi, J.K.; Pastell, M.; Manteca, X.; Llonch, P. A Systematic Review on Validated Precision Livestock Farming Technologies for Pig Production and Its Potential to Assess Animal Welfare. Front. Vet. Sci. 2021, 8, 660565. [Google Scholar] [CrossRef]
  49. Cappai, M.G.; Rubiu, N.G.; Pinna, W. Economic Assessment of a Smart Traceability System (RFID+DNA) for Origin and Brand Protection of the Pork Product Labelled “Suinetto Di Sardegna”. Comput. Electron. Agric. 2018, 145, 248–252. [Google Scholar] [CrossRef]
  50. Wechsler, B.; Bachmann, I. A Sequential Analysis of Eliminative Behaviour in Domestic Pigs. Appl. Anim. Behav. Sci. 1998, 56, 29–36. [Google Scholar] [CrossRef]
  51. Signoret, J.P.; Baldwin, B.A.; Fraser, D.; Hafez, E.S.E. The Behaviour of Swine. In Behaviour of Domestic Animals; Baillière Tindall: London, UK, 1975; pp. 295–329. [Google Scholar]
  52. Lepsien, A.; Koschmider, A.; Kratsch, W. Video Process Mining Evaluation Data. Zenodo 2023. [Google Scholar] [CrossRef]
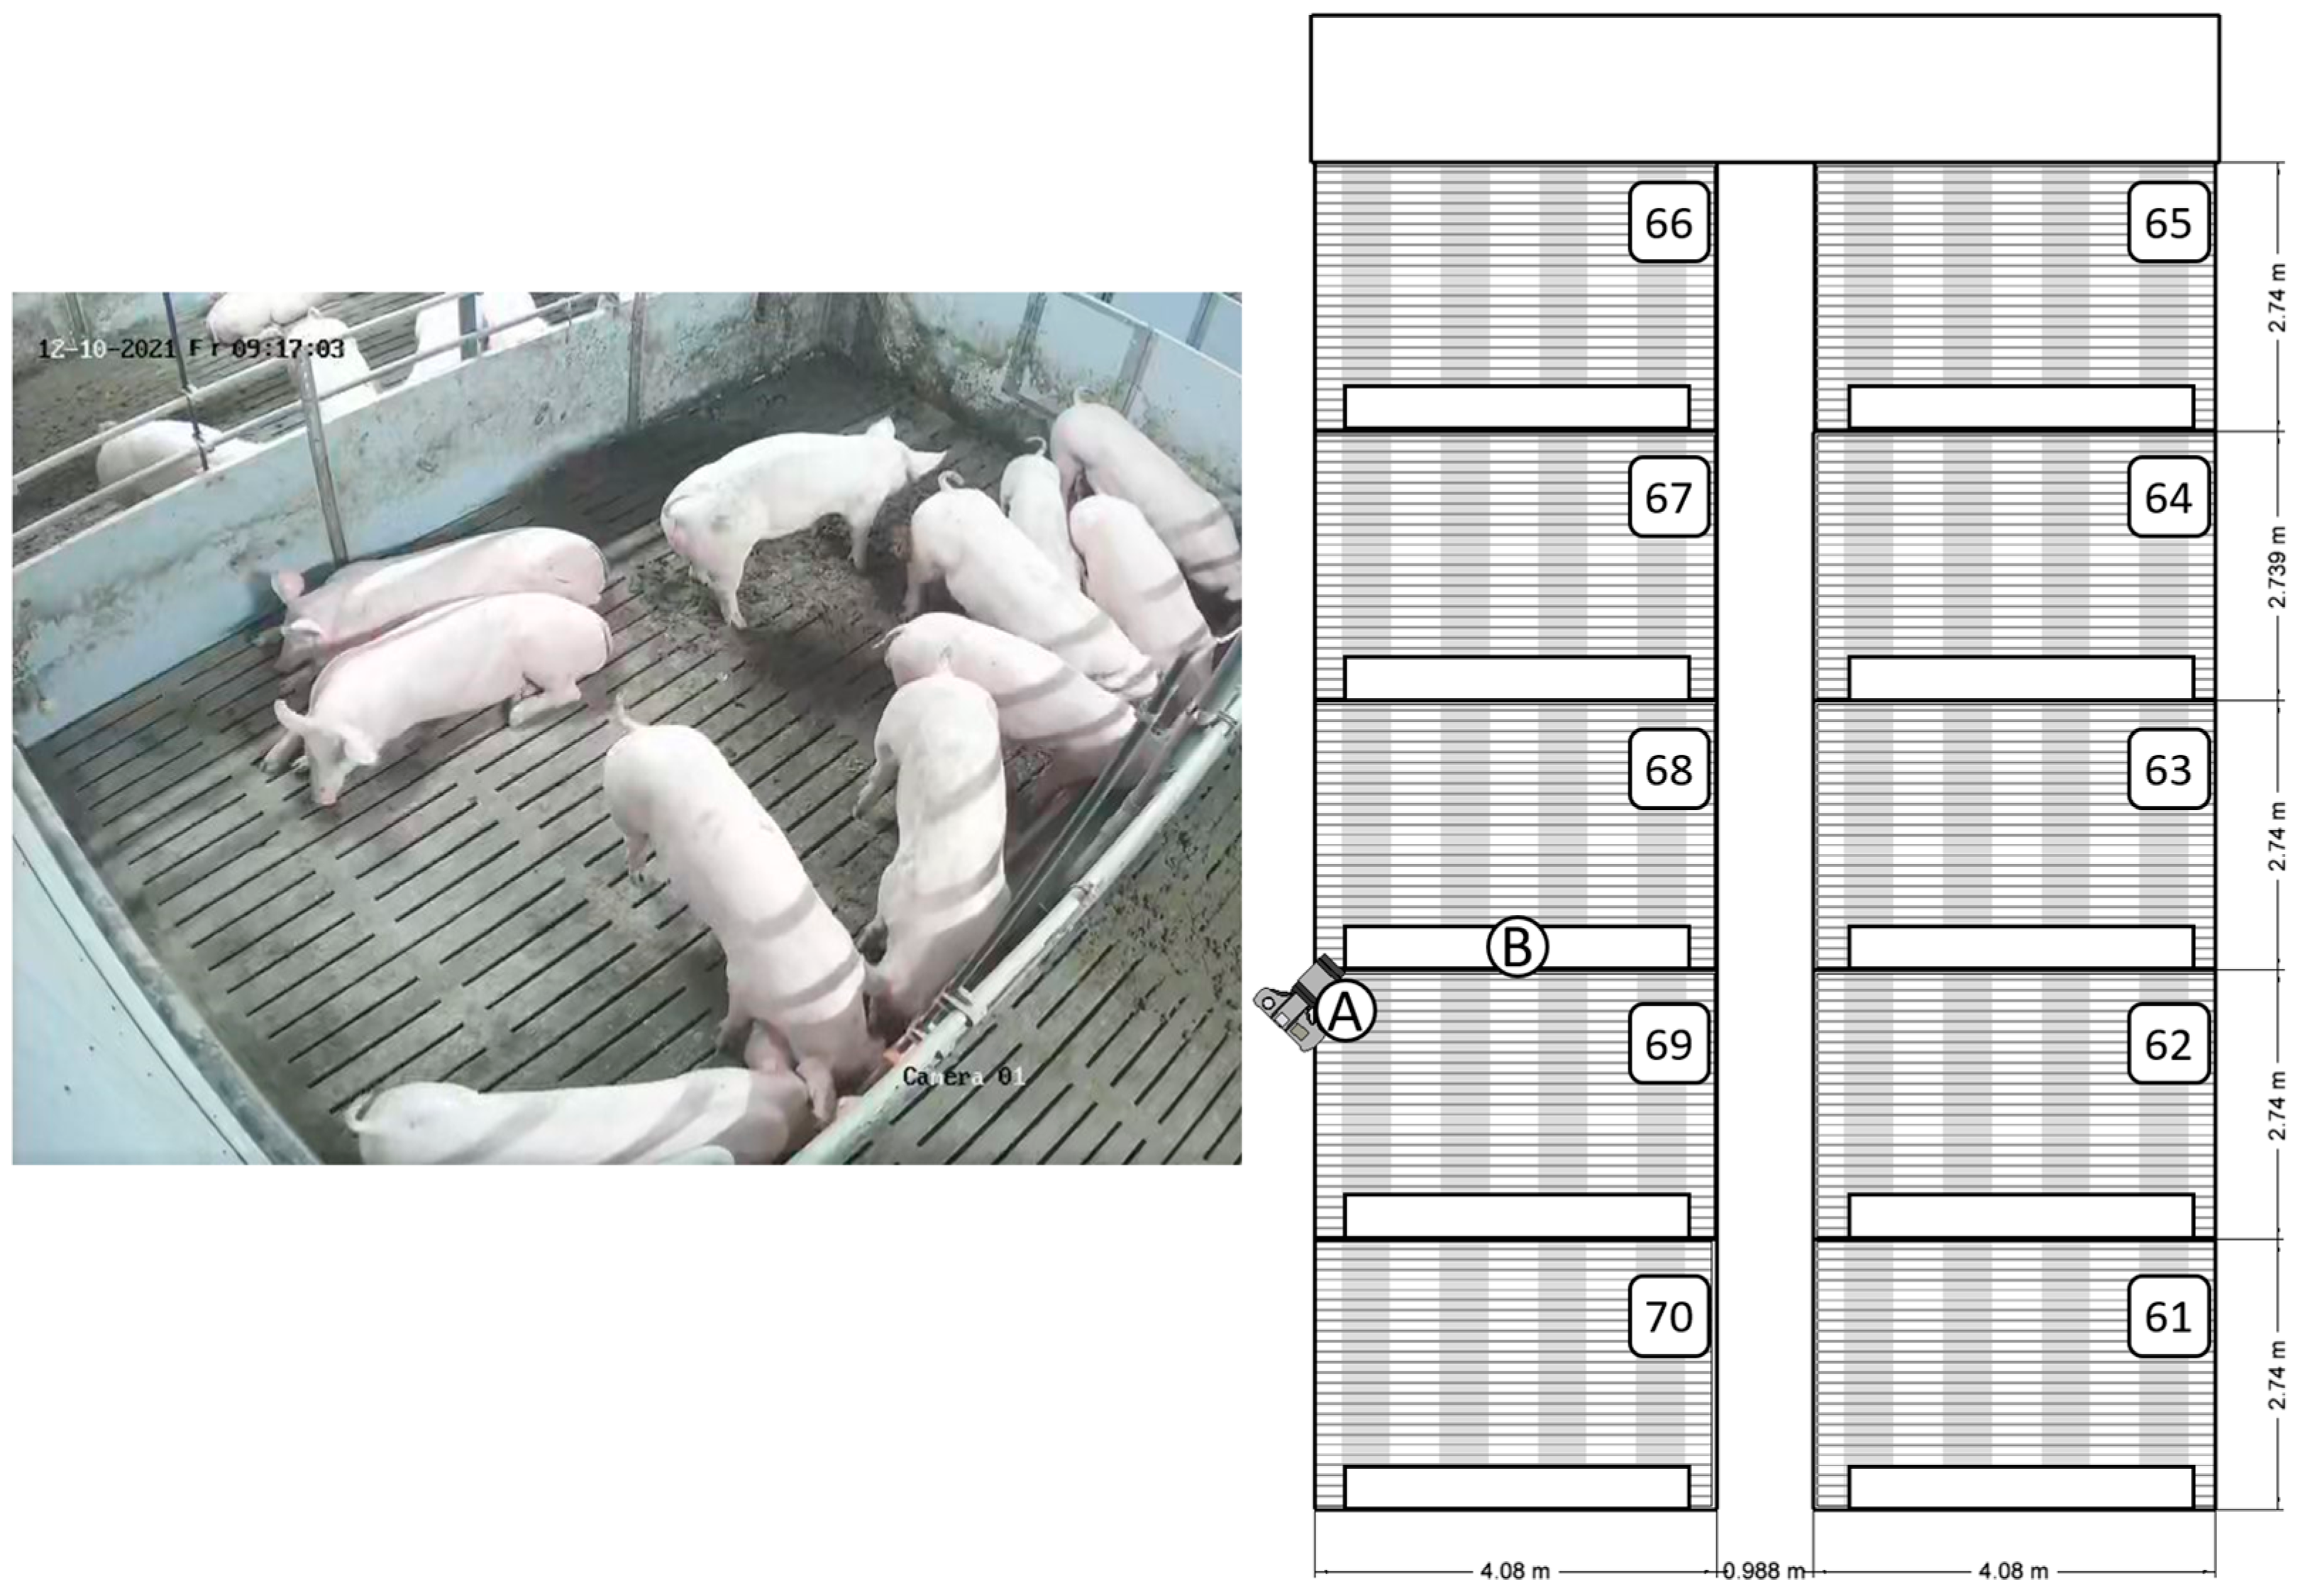
Figure 1. Floor plan of compartment 6 with the camera (A) facing pen 68 which was used for video recording. (B) Position of the feeding trough.
Agriculture 13 01639 g001
Figure 2. Activity scores over time during recording times (06:00–18:00) for five consecutive observation days (13 November 2021–17 November 2021).
Agriculture 13 01639 g002
Figure 3. Spatial distribution of relative activity scores within the pen at different time points on one specific day (13 November 2021).
Agriculture 13 01639 g003
Figure 4. Proportions of the most temporally significant activities such as lying (line chart), feeding, moving and investigating as well as all other recorded activities summarized (stacked bar chart) over the selected daily period in 10 min segments.
Agriculture 13 01639 g004
Figure 5. Proportions of the estimated activities such as investigating, moving, playing and defecating over the selected daily period in 10 min segments.
Agriculture 13 01639 g005
Figure 6. Spatial distribution of selected behavior events (lying, feeding, defecating, playing) within the pen over a one-day time period (13 November 2021) positioned on a screenshot from the video camera.
Agriculture 13 01639 g006
Figure 7. Process model discovered from all extracted activities with end of lying as a starting point (lying_start) and lying down again as static end points (lying_end) and nodes (boxes) representing an activity type and edges (arrows) representing the discovered relationships between different activity types.
Agriculture 13 01639 g007
Figure 8. Process models from clustered data focusing on dominant behavior sequences like behavior patterns around (a) feeding, (b) investigating and playing as well as (c) defecating.
Agriculture 13 01639 g008
Table 1. Behaviors of pigs and the respective definitions as used in the dataset.
BehaviorDefinition
lyingPig in a resting position, typically lying down on the side of the trunk or chest/sternum, with minimal movement and its body supported by the floor.
sittingContact to the floor with the feet of the front legs and the posterior portion of the pig’s body.
standingContact to the floor with all feet without changing position.
movingPig in motion, displaying walking or running behavior, with all four legs actively moving their body forward.
investigatingPig using its snout to search and dig into the ground or other surfaces, often in a repetitive manner, as part of its natural behavior to find food or explore the surroundings.
feedingFocused engagement with a food source, characterized by repeated chewing, swallowing, and rooting behavior.
defecatingAct of elimination, seen as a standing position, followed by the expulsion of feces from the body.
playing Active engagement with occupation material for pigs like ropes.
miscellaneousAll other activities that cannot be allocated to any of the above activities.
Table 2. Calculated tracking performance metrics averaged over all evaluation sequences (MOTA: multiple object tracking accuracy, IDF1: global min-cost F1 score for ID associations, # Switches: total number of track switches, # Fragmentations: total number of switches from tracked to not tracked).
MOTAIDF1# Switches# Fragmentations
Average0.9820.9850.51.286
Standard Deviation0.0320.0170.761.541
Table 3. Average precision per activity class as observed in model validation.
Activity[email protected]
lying0.997
sitting0.374
standing0.296
moving0.807
investigating0.793
feeding0.994
defecating0.960
playing0.969
miscellaneous0.439
Table 4. Exemplary overview of the distribution of the individual behaviors summarized in the exemplary 10-min blocks for the entire data set.
NMinMaxMeanSDCV (%)
lying3600.0941.0000.7660.23330%
sitting3600.0000.0340.0020.004229%
standing3600.0000.0680.0040.007163%
moving3600.0000.1880.0200.029145%
investigating3600.0000.5770.0740.107144%
feeding3600.0000.6510.1270.149118%
defecating3600.0000.0390.0030.005198%
playing3600.0000.1530.0040.015346%
miscellaneous3600.0000.0120.0000.001473%
Disclaimer/Publisher’s Note: The statements, opinions and data contained in all publications are solely those of the individual author(s) and contributor(s) and not of MDPI and/or the editor(s). MDPI and/or the editor(s) disclaim responsibility for any injury to people or property resulting from any ideas, methods, instructions or products referred to in the content.