Multi-Year Cereal Crop Classification Model in a Semi-Arid Region Using Sentinel-2 and Landsat 7–8 Data
Abstract
:1. Introduction
2. Materials and Methods
2.1. Study Area
2.2. Datasets
2.2.1. Landsat 7–8
2.2.2. Sentinel 2
2.2.3. Field Data
2.3. Methods
2.3.1. Vegetation Indexes
2.3.2. Land Cover Classification Model
2.3.3. Metrics
3. Results
3.1. Models
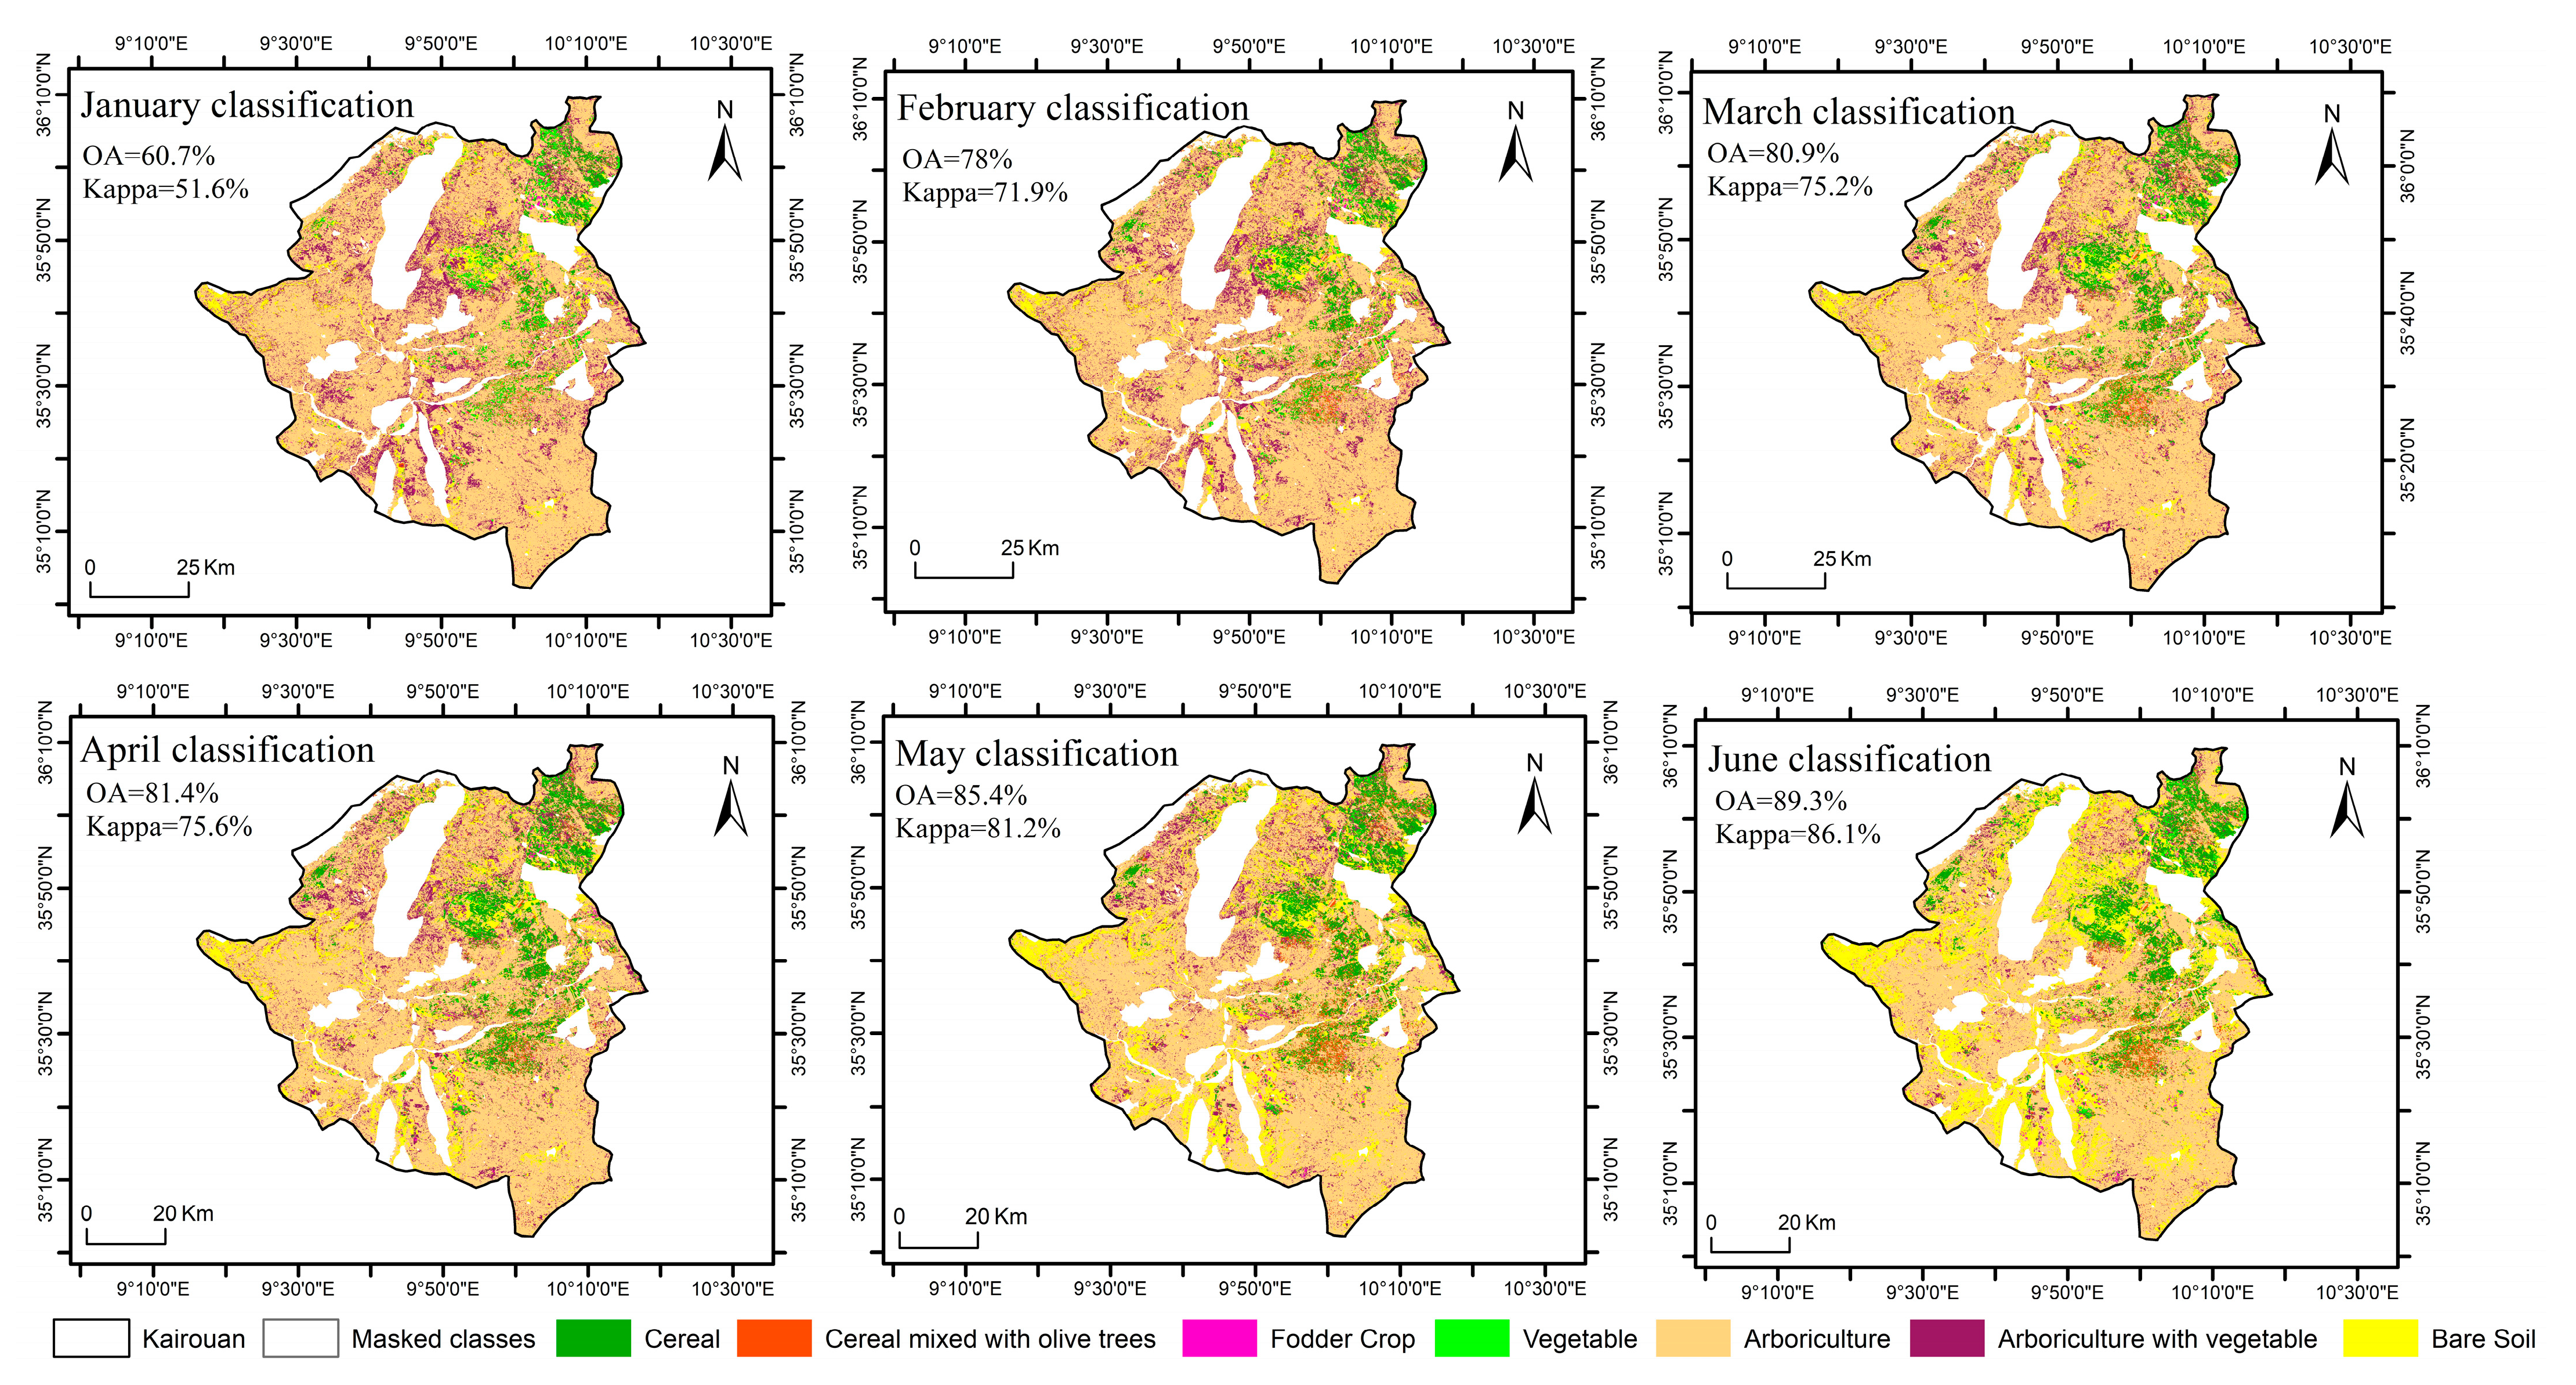
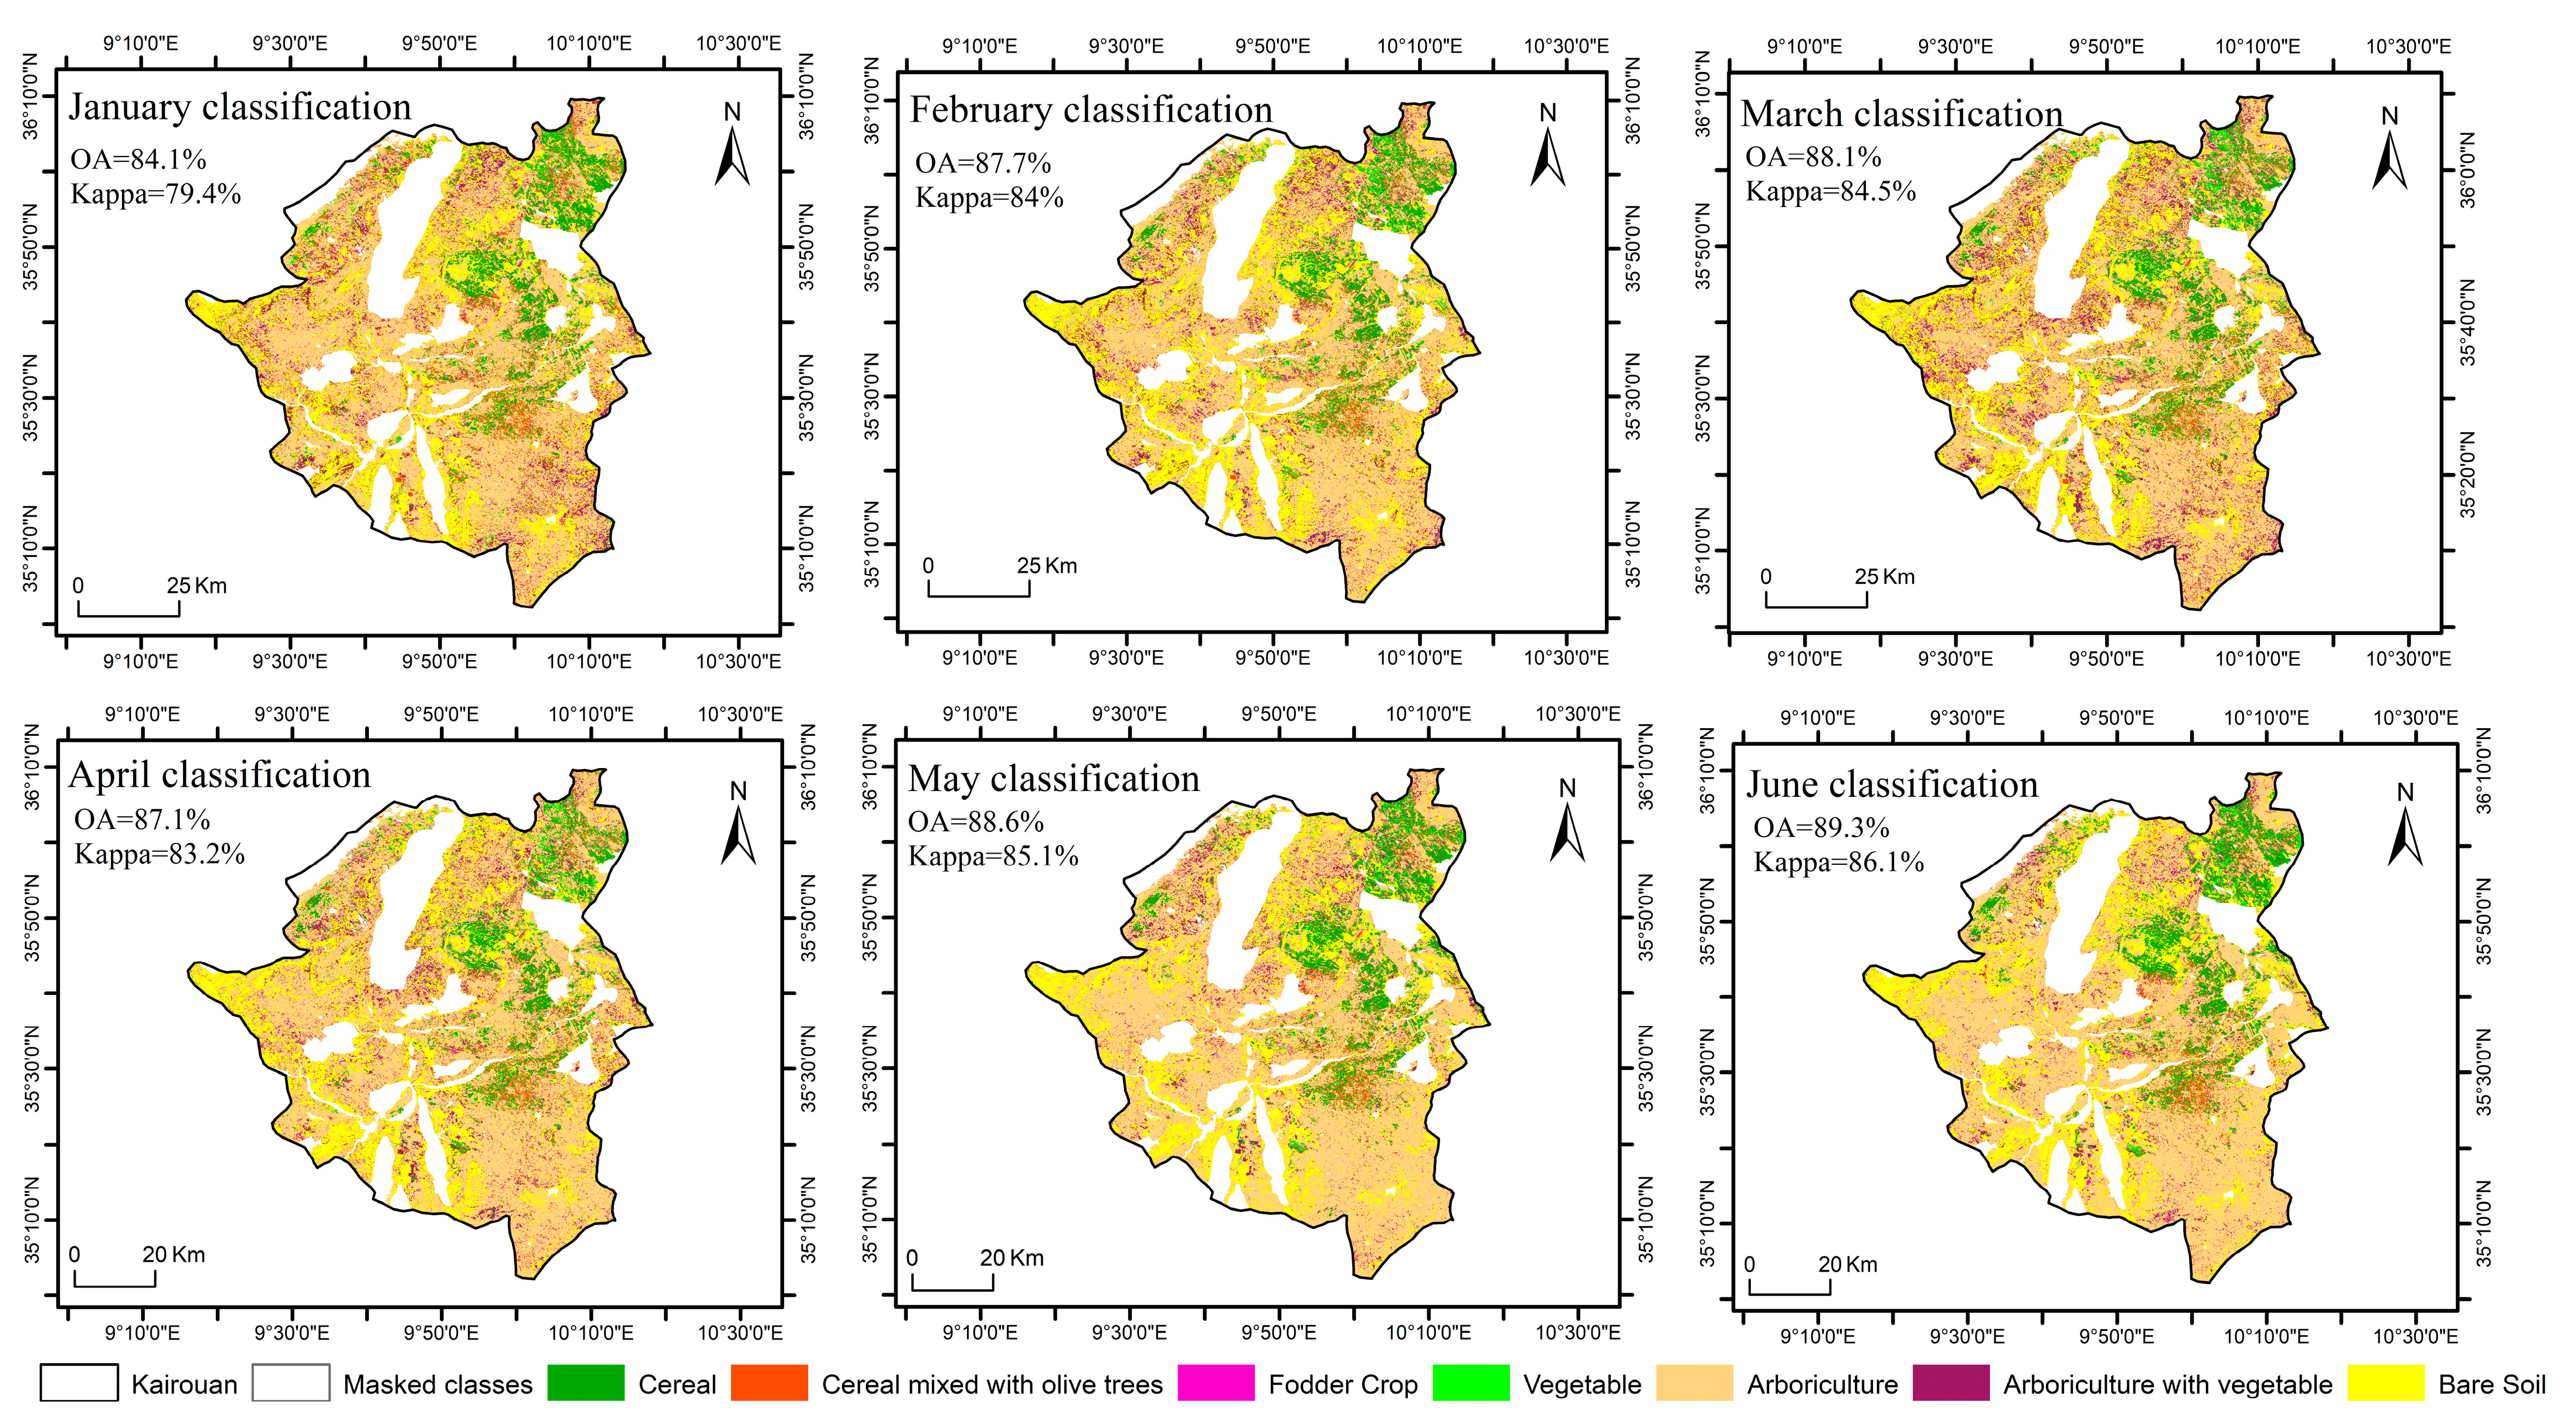
3.1.1. Land Cover Classification Model M1
3.1.2. Early Land Cover Classification M1 Model
3.1.3. Early Land Cover Classification M2 Model
3.2. Validation
3.2.1. Land Cover Classification
3.2.2. Validation of the M1 Early Classification Model
3.2.3. Validation of the M2 Early Classification Model
4. Discussion
5. Conclusions
Author Contributions
Funding
Institutional Review Board Statement
Data Availability Statement
Acknowledgments
Conflicts of Interest
Appendix A
| Vegetation Index | Band | Expression | Reference | |
|---|---|---|---|---|
| NDVI | Normalized Difference Vegetation Index | NIR, Red | (NIR − Red)/(NIR + Red) | [39] |
| GNDVI | Green Normalized Difference Vegetation Index | Green, NIR | (NIR − Green)/(NIR + Green) | [58] |
| NDRE | Normalized Difference Red Edge | NIR, Red Edge | (NIR − Red Edge)/(NIR + Red Edge) | [59] |
| EVI | Enhanced Vegetation Index | NIR, Red, Blue | 2.5 (NIR − Red)/(1 + NIR + 6 Red − 7.5 Blue) | [60] |
| EVI2 | Enhanced Vegetation Index 2 | NIR, Red | 2.5 (NIR − Red)/(NIR + 2.4 Red + 1) | [40] |
| IPVI | Infrared Percentage Vegetation Index | NIR, Red | NIR/(NIR + Red) | [61] |
| OSAVI | Optimized SAVI | NIR, Red | 1.16 ((NIR − Red)/(NIR+ Red + 0.16)) | [62] |
| MSI | Moisture stress index | NIR, SWIR1 | SWIR1/NIR | [63] |
| NDMI | Normalized Difference Moisture Index | NIR, SWIR1 | (NIR − SWIR1)/(NIR + SWIR1) | [41] |
| NGRDI | Normalized Green–Red Difference Index | Green, Red | (Green − Red)/(Green + Red) | [64] |
| SRI | Simple Ratio Index | NIR, Red | NIR/Red | [65] |
| GRVI | Green Ratio Vegetation Index | Green, Red | Green/Red | [66] |
| RGI | Red–Green Index | Green, Red | Red/Green | [66] |
| TVI | Triangular Vegetation Index | NIR, Green, Red | 0.5 (120 (NIR − Green) − 200 (Red − Green)) | [67] |
| DVI | Difference Vegetation Index | NIR, Red | NIR − Red | [39] |
Appendix B
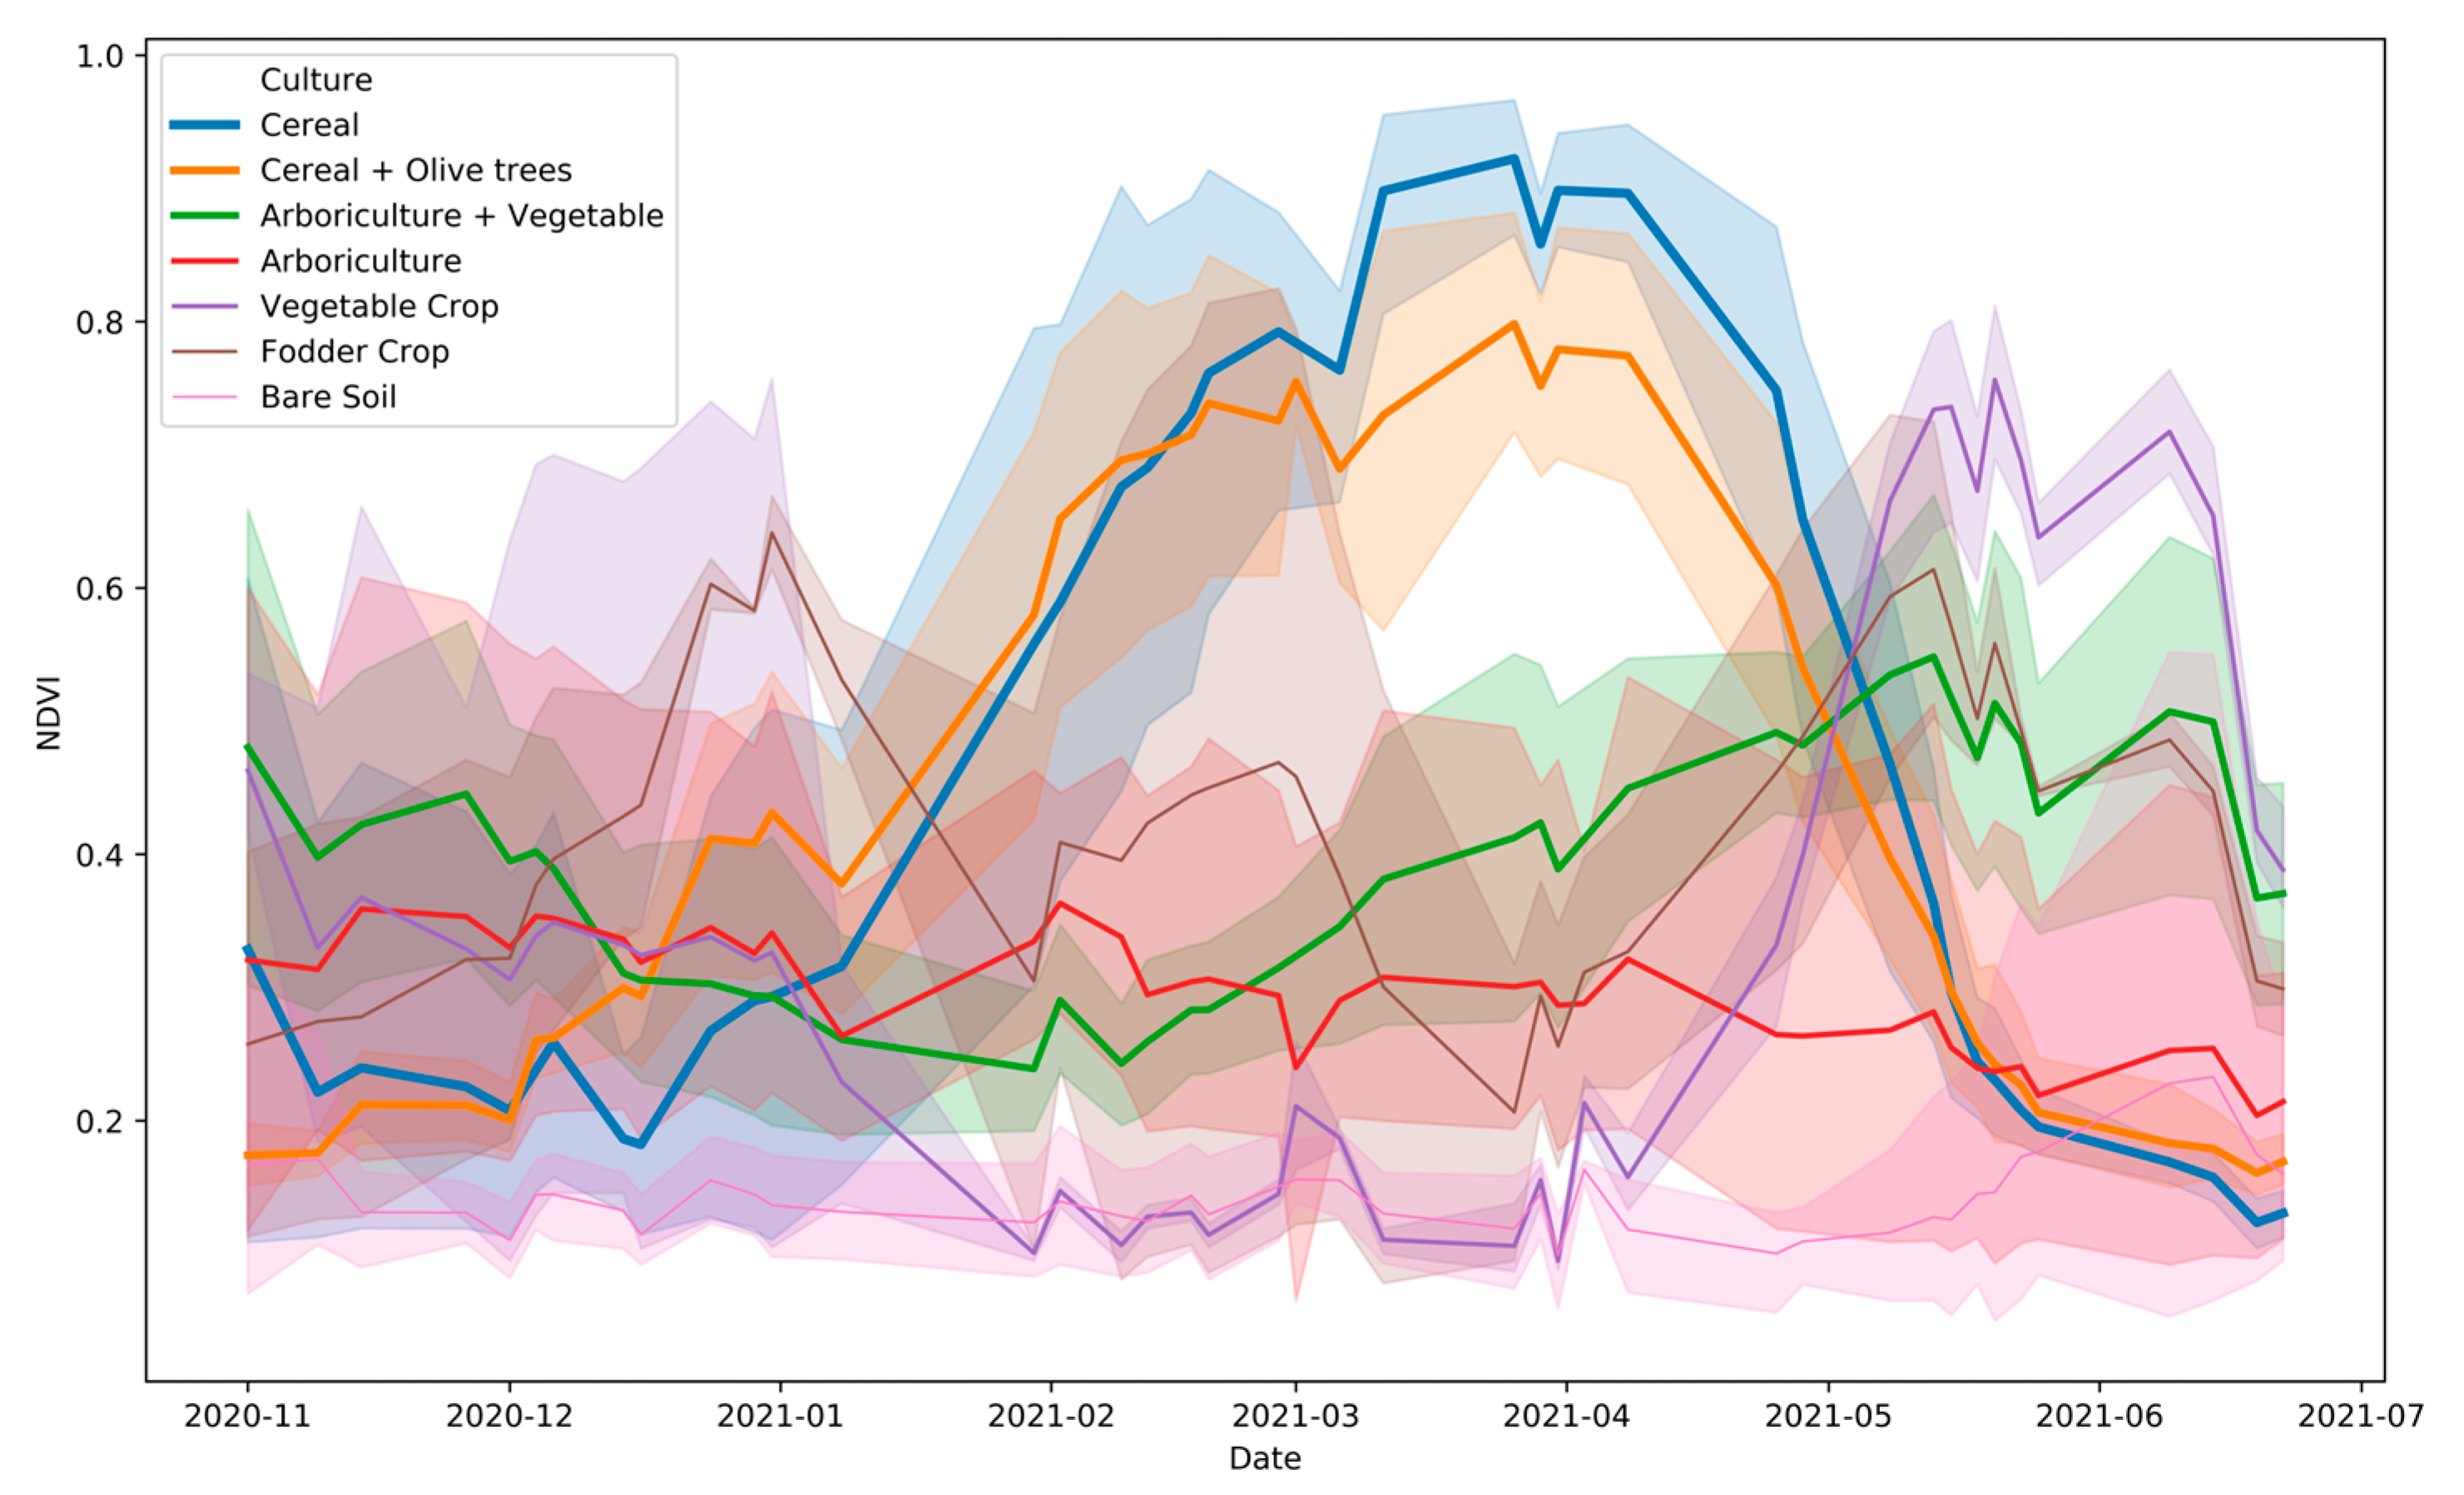
References
- Guan, R.; Li, Z.; Li, T.; Li, X.; Yang, J.; Chen, W. Classification of Heterogeneous Mining Areas Based on ResCapsNet and Gaofen-5 Imagery. Remote Sens. 2022, 14, 3216. [Google Scholar] [CrossRef]
- Cassidy, L.; Binford, M.; Southworth, J.; Barnes, G. Social and ecological factors and land-use land-cover diversity in two provinces in southeast Asia. J. Land Use Sci. 2010, 5, 277–306. [Google Scholar] [CrossRef]
- Yang, R.; Zhou, Q.; Fan, B.; Wang, Y.; Li, Z. Land Cover Classification from Hyperspectral Images via Weighted Spatial–Spectral Joint Kernel Collaborative Representation Classifier. Agriculture 2023, 13, 304. [Google Scholar] [CrossRef]
- Zhi, F.; Dong, Z.; Guga, S.; Bao, Y.; Han, A.; Zhang, J.; Bao, Y. Rapid and Automated Mapping of Crop Type in Jilin Province Using Historical Crop Labels and the Google Earth Engine. Remote Sens. 2022, 14, 4028. [Google Scholar] [CrossRef]
- Han, J.; Zhang, Z.; Cao, J.; Luo, Y. Mapping rapeseed planting areas using an automatic phenology- and pixel-based algorithm (APPA) in Google Earth Engine. Crop J. 2022, 10, 1483–1495. [Google Scholar] [CrossRef]
- Verner, D.; Treguer, D.; Redwood, J.; Christensen, J.; McDonnell, R.; Elbert, C.; Konishi, Y. Climate Variability, Drought, and Drought Management in Tunisia’s Agricultural Sector; World Bank: Washington, DC, USA, 2018. [Google Scholar]
- Mougou, R.; Mansour, M.; Iglesias, A.; Chebbi, R.Z.; Battaglini, A. Climate change and agricultural vulnerability: A case study of rain-fed wheat in Kairouan, Central Tunisia. Reg. Env. Chang. 2011, 11, 137–142. [Google Scholar] [CrossRef]
- Van Tilburg, A.J.; Hudson, P.F. Extreme weather events and farmer adaptation in Zeeland, the Netherlands: A European climate change case study from the Rhine delta. Sci. Total Environ. 2022, 844, 157212. [Google Scholar] [CrossRef] [PubMed]
- You, N.; Dong, J. Examining earliest identifiable timing of crops using all available Sentinel 1/2 imagery and Google Earth Engine. ISPRS J. Photogramm. Remote Sens. 2020, 161, 109–123. [Google Scholar] [CrossRef]
- Mirmazloumi, S.M.; Kakooei, M.; Mohseni, F.; Ghorbanian, A.; Amani, M.; Crosetto, M.; Monserrat, O. ELULC-10, a 10 m European Land Use and Land Cover Map Using Sentinel and Landsat Data in Google Earth Engine. Remote Sens. 2022, 14, 3041. [Google Scholar] [CrossRef]
- Nasiri, V.; Deljouei, A.; Moradi, F.; Sadeghi, S.M.M.; Borz, S.A. Land Use and Land Cover Mapping Using Sentinel-2, Landsat-8 Satellite Images, and Google Earth Engine: A Comparison of Two Composition Methods. Remote Sens. 2022, 14, 1977. [Google Scholar] [CrossRef]
- Friedl, M.A.; Sulla-Menashe, D.; Tan, B.; Schneider, A.; Ramankutty, N.; Sibley, A.; Huang, X. MODIS Collection 5 global land cover: Algorithm refinements and characterization of new datasets. Remote Sens. Environ. 2010, 114, 168–182. [Google Scholar] [CrossRef]
- Poulter, B.; MacBean, N.; Hartley, A.; Khlystova, I.; Arino, O.; Betts, R.; Bontemps, S.; Boettcher, M.; Brockmann, C.; Defourny, P.; et al. Plant functional type classification for earth system models: Results from the European Space Agency’s Land Cover Climate Change Initiative. Geosci. Model Dev. 2015, 8, 2315–2328. [Google Scholar] [CrossRef]
- Buchhorn, M.; Smets, B.; Bertels, L.; Roo, B.D.; Lesiv, M.; Tsendbazar, N.-E.; Herold, M.; Fritz, S. Copernicus Global Land Service: Land Cover 100 m: Collection 3: Epoch 2019: Globe; Laboratory of Geo-Information Science and Remote Sensing: Wageningen, The Netherlands, 2020. [Google Scholar]
- Gong, P.; Liu, H.; Zhang, M.; Li, C.; Wang, J.; Huang, H.; Clinton, N.; Ji, L.; Li, W.; Bai, Y.; et al. Stable classification with limited sample: Transferring a 30-m resolution sample set collected in 2015 to mapping 10-m resolution global land cover in 2017. Sci. Bull. 2019, 64, 370–373. [Google Scholar] [CrossRef] [PubMed]
- Malinowski, R.; Lewiński, S.; Rybicki, M.; Gromny, E.; Jenerowicz, M.; Krupiński, M.; Nowakowski, A.; Wojtkowski, C.; Krupiński, M.; Krätzschmar, E.; et al. Automated Production of a Land Cover/Use Map of Europe Based on Sentinel-2 Imagery. Remote Sens. 2020, 12, 3523. [Google Scholar] [CrossRef]
- Venter, Z.S.; Sydenham, M.A.K. Continental-Scale Land Cover Mapping at 10 m Resolution Over Europe (ELC10). Remote Sens. 2021, 13, 2301. [Google Scholar] [CrossRef]
- Li, Q.; Qiu, C.; Ma, L.; Schmitt, M.; Zhu, X. Mapping the Land Cover of Africa at 10 m Resolution from Multi-Source Remote Sensing Data with Google Earth Engine. Remote Sens. 2020, 12, 602. [Google Scholar] [CrossRef]
- Yang, L.; Driscol, J.; Sarigai, S.; Wu, Q.; Chen, H.; Lippitt, C.D. Google Earth Engine and Artificial Intelligence (AI): A Comprehensive Review. Remote Sens. 2022, 14, 3253. [Google Scholar] [CrossRef]
- Random Forests|SpringerLink. Available online: https://link.springer.com/article/10.1023/A:1010933404324 (accessed on 11 October 2022).
- Xie, S.; Liu, L.; Zhang, X.; Yang, J.; Chen, X.; Gao, Y. Automatic Land-Cover Mapping using Landsat Time-Series Data based on Google Earth Engine. Remote Sens. 2019, 11, 3023. [Google Scholar] [CrossRef]
- Monsalve-Tellez, J.M.; Torres-León, J.L.; Garcés-Gómez, Y.A. Evaluation of SAR and Optical Image Fusion Methods in Oil Palm Crop Cover Classification Using the Random Forest Algorithm. Agriculture 2022, 12, 955. [Google Scholar] [CrossRef]
- Teluguntla, P.; Thenkabail, P.S.; Oliphant, A.; Xiong, J.; Gumma, M.K.; Congalton, R.G.; Yadav, K.; Huete, A. A 30-m landsat-derived cropland extent product of Australia and China using random forest machine learning algorithm on Google Earth Engine cloud computing platform. ISPRS J. Photogramm. Remote Sens. 2018, 144, 325–340. [Google Scholar] [CrossRef]
- Kelley, L.C.; Pitcher, L.; Bacon, C. Using Google Earth Engine to Map Complex Shade-Grown Coffee Landscapes in Northern Nicaragua. Remote Sens. 2018, 10, 952. [Google Scholar] [CrossRef]
- Oliphant, A.J.; Thenkabail, P.S.; Teluguntla, P.; Xiong, J.; Gumma, M.K.; Congalton, R.G.; Yadav, K. Mapping cropland extent of Southeast and Northeast Asia using multi-year time-series Landsat 30-m data using a random forest classifier on the Google Earth Engine Cloud. Int. J. Appl. Earth Obs. Geoinf. 2019, 81, 110–124. [Google Scholar] [CrossRef]
- Gumma, M.K.; Thenkabail, P.S.; Teluguntla, P.G.; Oliphant, A.; Xiong, J.; Giri, C.; Pyla, V.; Dixit, S.; Whitbread, A.M. Agricultural cropland extent and areas of South Asia derived using Landsat satellite 30-m time-series big-data using random forest machine learning algorithms on the Google Earth Engine cloud. GIScience Remote Sens. 2020, 57, 302–322. [Google Scholar] [CrossRef]
- Ibrahim, S. Improving Land Use/Cover Classification Accuracy from Random Forest Feature Importance Selection Based on Synergistic Use of Sentinel Data and Digital Elevation Model in Agriculturally Dominated Landscape. Agriculture 2022, 13, 98. [Google Scholar] [CrossRef]
- Zeng, J.; Tan, M.L.; Tew, Y.L.; Zhang, F.; Wang, T.; Samat, N.; Tangang, F.; Yusop, Z. Optimization of Open-Access Optical and Radar Satellite Data in Google Earth Engine for Oil Palm Mapping in the Muda River Basin, Malaysia. Agriculture 2022, 12, 1435. [Google Scholar] [CrossRef]
- Abida, K.; Barbouchi, M.; Boudabbous, K.; Toukabri, W.; Saad, K.; Bousnina, H.; Sahli Chahed, T. Sentinel-2 Data for Land Use Mapping: Comparing Different Supervised Classifications in Semi-Arid Areas. Agriculture 2022, 12, 1429. [Google Scholar] [CrossRef]
- The Nature of Statistical Learning Theory|SpringerLink. Available online: https://link.springer.com/book/10.1007/978-1-4757-3264-1 (accessed on 12 October 2022).
- Ni, R.; Tian, J.; Li, X.; Yin, D.; Li, J.; Gong, H.; Zhang, J.; Zhu, L.; Wu, D. An enhanced pixel-based phenological feature for accurate paddy rice mapping with Sentinel-2 imagery in Google Earth Engine. ISPRS J. Photogramm. Remote Sens. 2021, 178, 282–296. [Google Scholar] [CrossRef]
- Piiroinen, R.; Heiskanen, J.; Mõttus, M.; Pellikka, P. Classification of crops across heterogeneous agricultural landscape in Kenya using AisaEAGLE imaging spectroscopy data. Int. J. Appl. Earth Obs. Geoinf. 2015, 39, 1–8. [Google Scholar] [CrossRef]
- Huang, C.; Davis, L.S.; Townshend, J.R.G. An assessment of support vector machines for land cover classification. Int. J. Remote Sens. 2002, 23, 725–749. [Google Scholar] [CrossRef]
- Yousefi, S.; Mirzaee, S.; Almohamad, H.; Al Dughairi, A.A.; Gomez, C.; Siamian, N.; Alrasheedi, M.; Abdo, H.G. Image Classification and Land Cover Mapping Using Sentinel-2 Imagery: Optimization of SVM Parameters. Land 2022, 11, 993. [Google Scholar] [CrossRef]
- Paneque-Gálvez, J.; Mas, J.-F.; Moré, G.; Cristóbal, J.; Orta-Martínez, M.; Luz, A.C.; Guèze, M.; Macía, M.J.; Reyes-García, V. Enhanced land use/cover classification of heterogeneous tropical landscapes using support vector machines and textural homogeneity. Int. J. Appl. Earth Obs. Geoinf. 2013, 23, 372–383. [Google Scholar] [CrossRef]
- Li, X.; Chen, W.; Cheng, X.; Wang, L. A Comparison of Machine Learning Algorithms for Mapping of Complex Surface-Mined and Agricultural Landscapes Using ZiYuan-3 Stereo Satellite Imagery. Remote Sens. 2016, 8, 514. [Google Scholar] [CrossRef]
- Praticò, S.; Solano, F.; Di Fazio, S.; Modica, G. Machine Learning Classification of Mediterranean Forest Habitats in Google Earth Engine Based on Seasonal Sentinel-2 Time-Series and Input Image Composition Optimisation. Remote Sens. 2021, 13, 586. [Google Scholar] [CrossRef]
- Breiman, L. Classification and Regression Trees; Routledge: New York, NY, USA, 2017; ISBN 978-1-315-13947-0. [Google Scholar]
- Tucker, C.J. Red and photographic infrared linear combinations for monitoring vegetation. Remote Sens. Environ. 1979, 8, 127–150. [Google Scholar] [CrossRef]
- Jiang, Z.; Huete, A.; Didan, K.; Miura, T. Development of a two-band enhanced vegetation index without a blue band. Remote Sens. Environ. 2008, 112, 3833–3845. [Google Scholar] [CrossRef]
- Jin, S.; Sader, S.A. Comparison of time series tasseled cap wetness and the normalized difference moisture index in detecting forest disturbances. Remote Sens. Environ. 2005, 94, 364–372. [Google Scholar] [CrossRef]
- Phan, T.N.; Kuch, V.; Lehnert, L.W. Land Cover Classification using Google Earth Engine and Random Forest Classifier—The Role of Image Composition. Remote Sens. 2020, 12, 2411. [Google Scholar] [CrossRef]
- Amini, S.; Saber, M.; Rabiei-Dastjerdi, H.; Homayouni, S. Urban Land Use and Land Cover Change Analysis Using Random Forest Classification of Landsat Time Series. Remote Sens. 2022, 14, 2654. [Google Scholar] [CrossRef]
- Chahbi, A.; Zribi, M.; Lili-Chabaane, Z.; Duchemin, B.; Shabou, M.; Mougenot, B.; Boulet, G. Estimation of the dynamics and yields of cereals in a semi-arid area using remote sensing and the SAFY growth model. Int. J. Remote Sens. 2014, 35, 1004–1028. [Google Scholar] [CrossRef]
- Bousbih, S.; Zribi, M.; Lili-Chabaane, Z.; Baghdadi, N.; El Hajj, M.; Gao, Q.; Mougenot, B. Potential of Sentinel-1 Radar Data for the Assessment of Soil and Cereal Cover Parameters. Sensors 2017, 17, 2617. [Google Scholar] [CrossRef]
- Chahbi Bellakanji, A.; Zribi, M.; Lili-Chabaane, Z.; Mougenot, B. Forecasting of Cereal Yields in a Semi-arid Area Using the Simple Algorithm for Yield Estimation (SAFY) Agro-Meteorological Model Combined with Optical SPOT/HRV Images. Sensors 2018, 18, 2138. [Google Scholar] [CrossRef] [PubMed]
- Zribi, M.; Chahbi, A.; Shabou, M.; Lili-Chabaane, Z.; Duchemin, B.; Baghdadi, N.; Amri, R.; Chehbouni, A. Soil surface moisture estimation over a semi-arid region using ENVISAT ASAR radar data for soil evaporation evaluation. Hydrol. Earth Syst. Sci. 2011, 15, 345–358. [Google Scholar] [CrossRef]
- Wei, M.; Wang, H.; Zhang, Y.; Li, Q.; Du, X.; Shi, G.; Ren, Y. Investigating the Potential of Crop Discrimination in Early Growing Stage of Change Analysis in Remote Sensing Crop Profiles. Remote Sens. 2023, 15, 853. [Google Scholar] [CrossRef]
- You, N.; Dong, J.; Li, J.; Huang, J.; Jin, Z. Rapid early-season maize mapping without crop labels. Remote Sens. Environ. 2023, 290, 113496. [Google Scholar] [CrossRef]
- Weilandt, F.; Behling, R.; Goncalves, R.; Madadi, A.; Richter, L.; Sanona, T.; Spengler, D.; Welsch, J. Early Crop Classification via Multi-Modal Satellite Data Fusion and Temporal Attention. Remote Sens. 2023, 15, 799. [Google Scholar] [CrossRef]
- Kairouan Governorate in Figures 2020. Available online: http://www.odco.nat.tn/en/publishing/governorates-in-figures/kairouan-governorate-in-figures-2020/ (accessed on 19 November 2022).
- Evolution de la collecte des céréales à l’échelle nationale à la date du 28 Juin 2022. Office des Céréales—Tunis. 2022. Available online: https://www.oc.com.tn/fr/evolution-de-la-collecte-des-cereales-a-lechelle-nationale-a-la-date-du-28-juin-2022/ (accessed on 20 November 2022).
- Congalton, R.G. A review of assessing the accuracy of classifications of remotely sensed data. Remote Sens. Environ. 1991, 37, 35–46. [Google Scholar] [CrossRef]
- Cohen, J. A Coefficient of Agreement for Nominal Scales. Educ. Psychol. Meas. 1960, 20, 37–46. [Google Scholar] [CrossRef]
- Chahed, Y.; Hassan, F.A. 2012 Grain and Feed Update Tunisia. Global Agricultural Information Network. 2012; TS1204. Available online: https://apps.fas.usda.gov/newgainapi/api/report/downloadreportbyfilename?filename=2012%20Grain%20and%20Feed%20Update_Tunis_Tunisia_5-18-2012.pdf (accessed on 20 November 2022).
- Forkuor, G.; Dimobe, K.; Serme, I.; Tondoh, J.E. Landsat-8 vs. Sentinel-2: Examining the added value of sentinel-2’s red-edge bands to land-use and land-cover mapping in Burkina Faso. GIScience Remote Sens. 2018, 55, 331–354. [Google Scholar] [CrossRef]
- Zribi, M.; Nativel, S.; Le Page, M. Analysis of Agronomic Drought in a Highly Anthropogenic Context Based on Satellite Monitoring of Vegetation and Soil Moisture. Remote Sens. 2021, 13, 2698. [Google Scholar] [CrossRef]
- Gitelson, A.A.; Kaufman, Y.J.; Merzlyak, M.N. Use of a green channel in remote sensing of global vegetation from EOS-MODIS. Remote Sens. Environ. 1996, 58, 289–298. [Google Scholar] [CrossRef]
- Gitelson, A.; Merzlyak, M.N. Spectral Reflectance Changes Associated with Autumn Senescence of Aesculus hippocastanum L. and Acer platanoides L. Leaves. Spectral Features and Relation to Chlorophyll Estimation. J. Plant Physiol. 1994, 143, 286–292. [Google Scholar] [CrossRef]
- Huete, A.; Didan, K.; Miura, T.; Rodriguez, E.P.; Gao, X.; Ferreira, L.G. Overview of the radiometric and biophysical performance of the MODIS vegetation indices. Remote Sens. Environ. 2002, 83, 195–213. [Google Scholar] [CrossRef]
- Crippen, R.E. Calculating the vegetation index faster. Remote Sens. Environ. 1990, 34, 71–73. [Google Scholar] [CrossRef]
- Rondeaux, G.; Steven, M.; Baret, F. Optimization of soil-adjusted vegetation indices. Remote Sens. Environ. 1996, 55, 95–107. [Google Scholar] [CrossRef]
- Huntjr, E.; Rock, B. Detection of changes in leaf water content using Near- and Middle-Infrared reflectances. Remote Sens. Environ. 1989, 30, 43–54. [Google Scholar] [CrossRef]
- Gitelson, A.A.; Kaufman, Y.J.; Stark, R.; Rundquist, D. Novel algorithms for remote estimation of vegetation fraction. Remote Sens. Environ. 2002, 80, 76–87. [Google Scholar] [CrossRef]
- Pearson, R.L.; Miller, L.D. Remote Mapping of Standing Crop Biomass for Estimation of the Productivity of the Shortgrass Prairie; Willow Run Laboratories, Environmental Research Institute of Michigan: Ann Arbor, MI, USA, 1972; p. 1355. [Google Scholar]
- Gamon, J.A.; Surfus, J.S. Assessing leaf pigment content and activity with a reflectometer. New Phytol. 1999, 143, 105–117. [Google Scholar] [CrossRef]
- Broge, N.H.; Leblanc, E. Comparing prediction power and stability of broadband and hyperspectral vegetation indices for estimation of green leaf area index and canopy chlorophyll density. Remote Sens. Environ. 2001, 76, 156–172. [Google Scholar] [CrossRef]
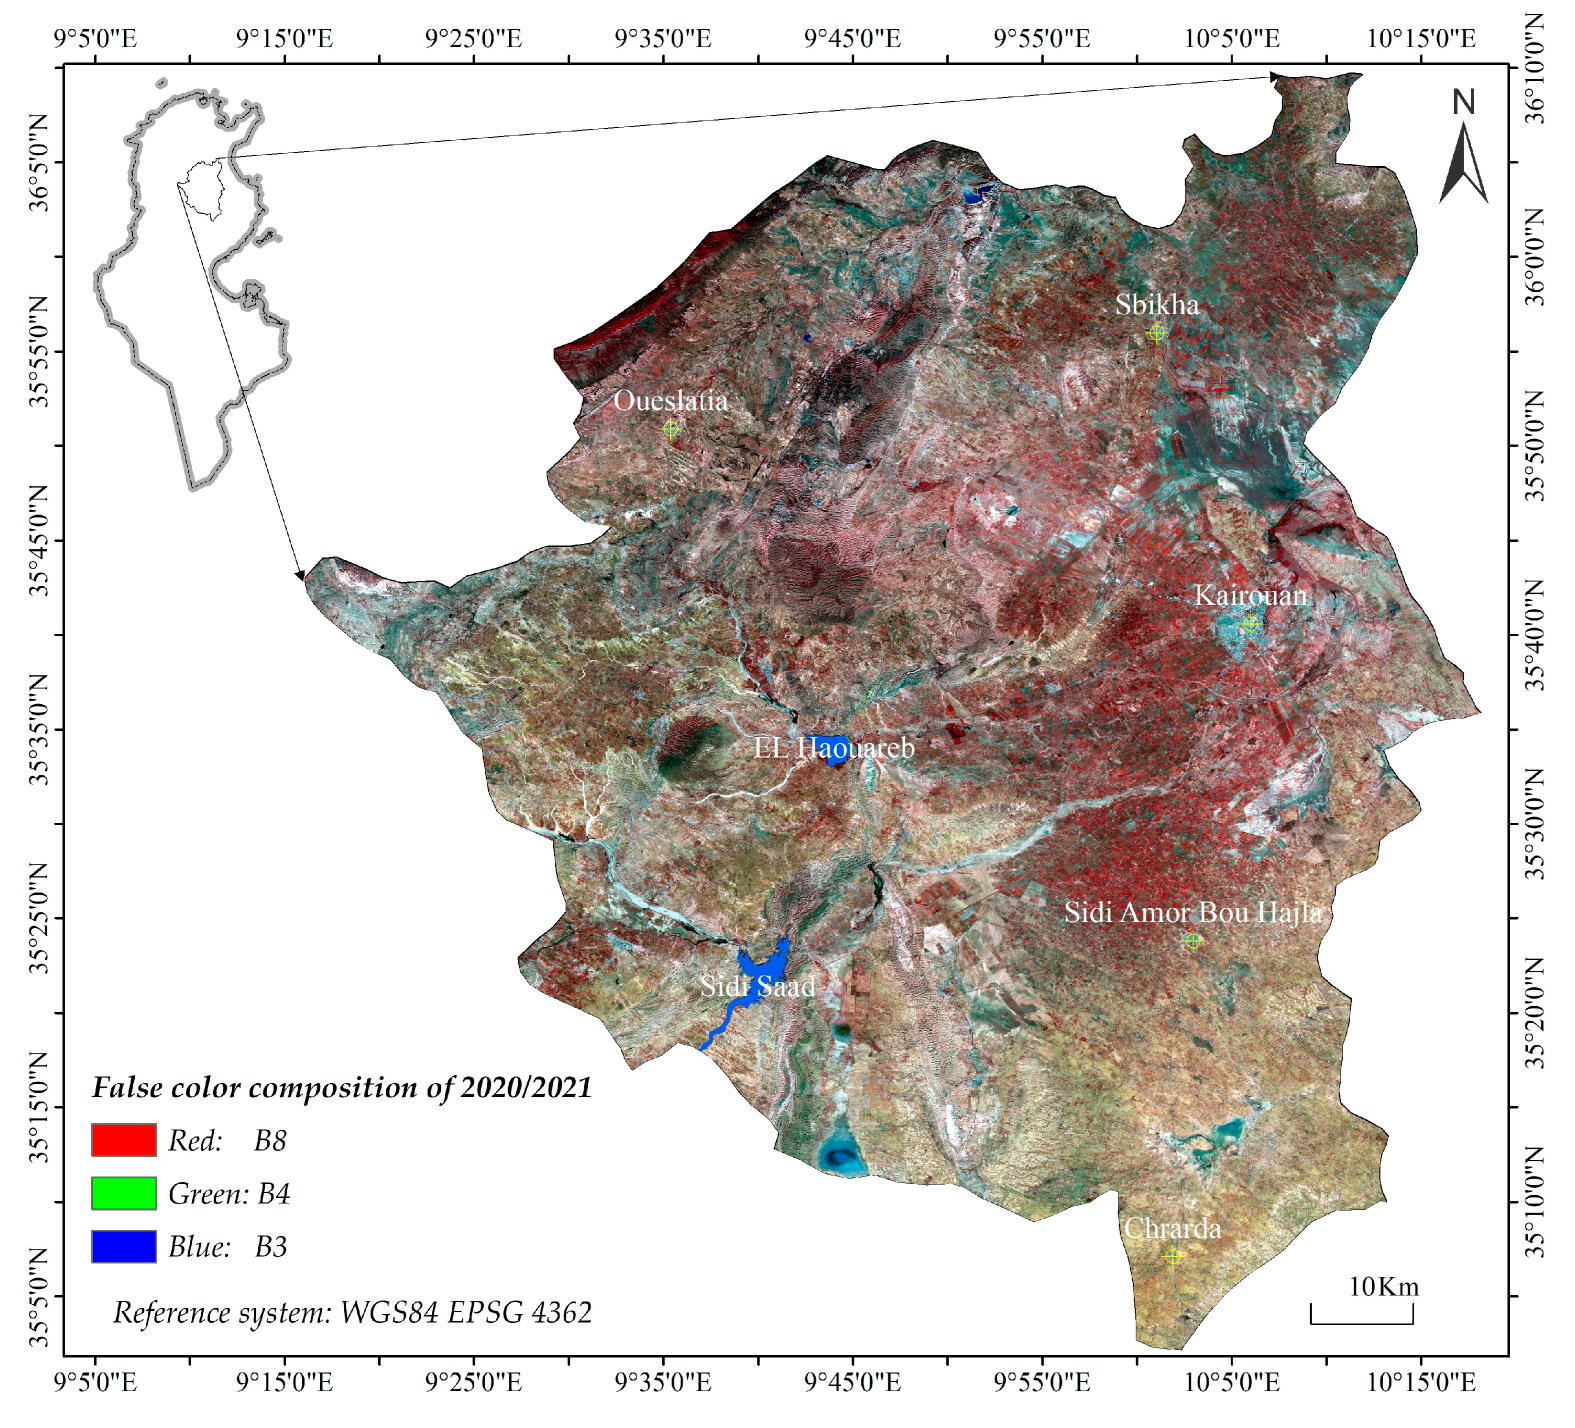
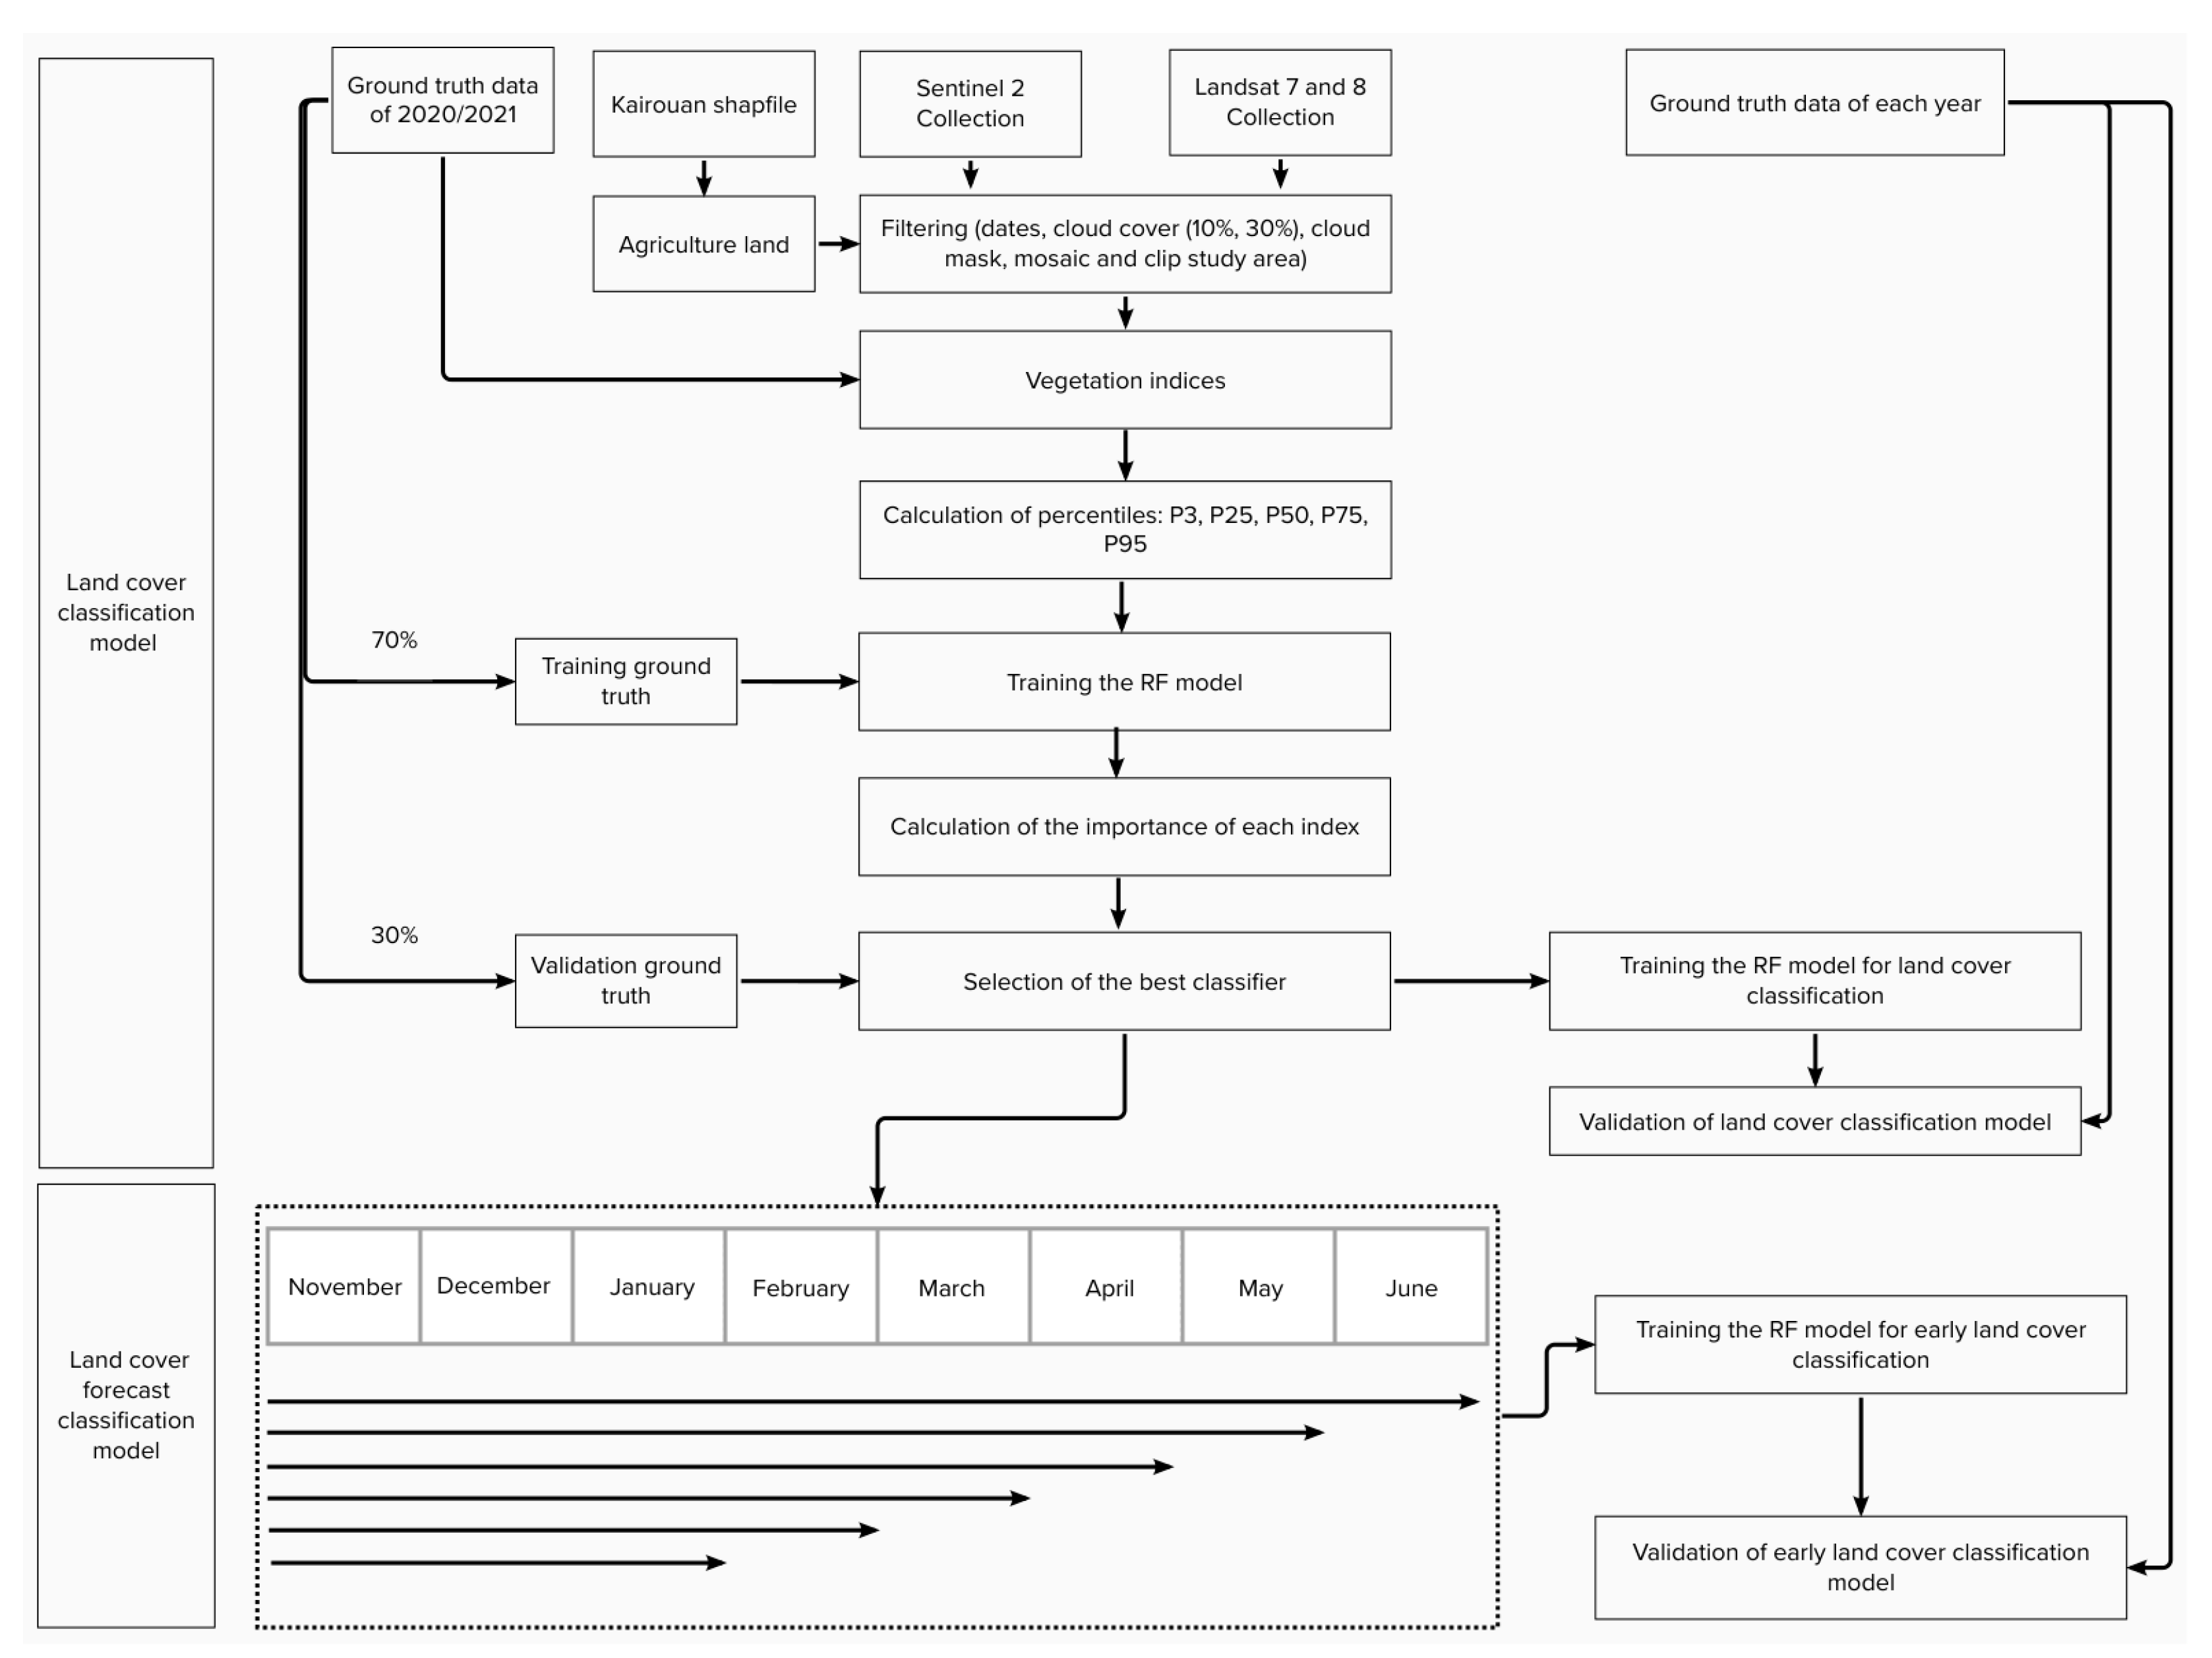

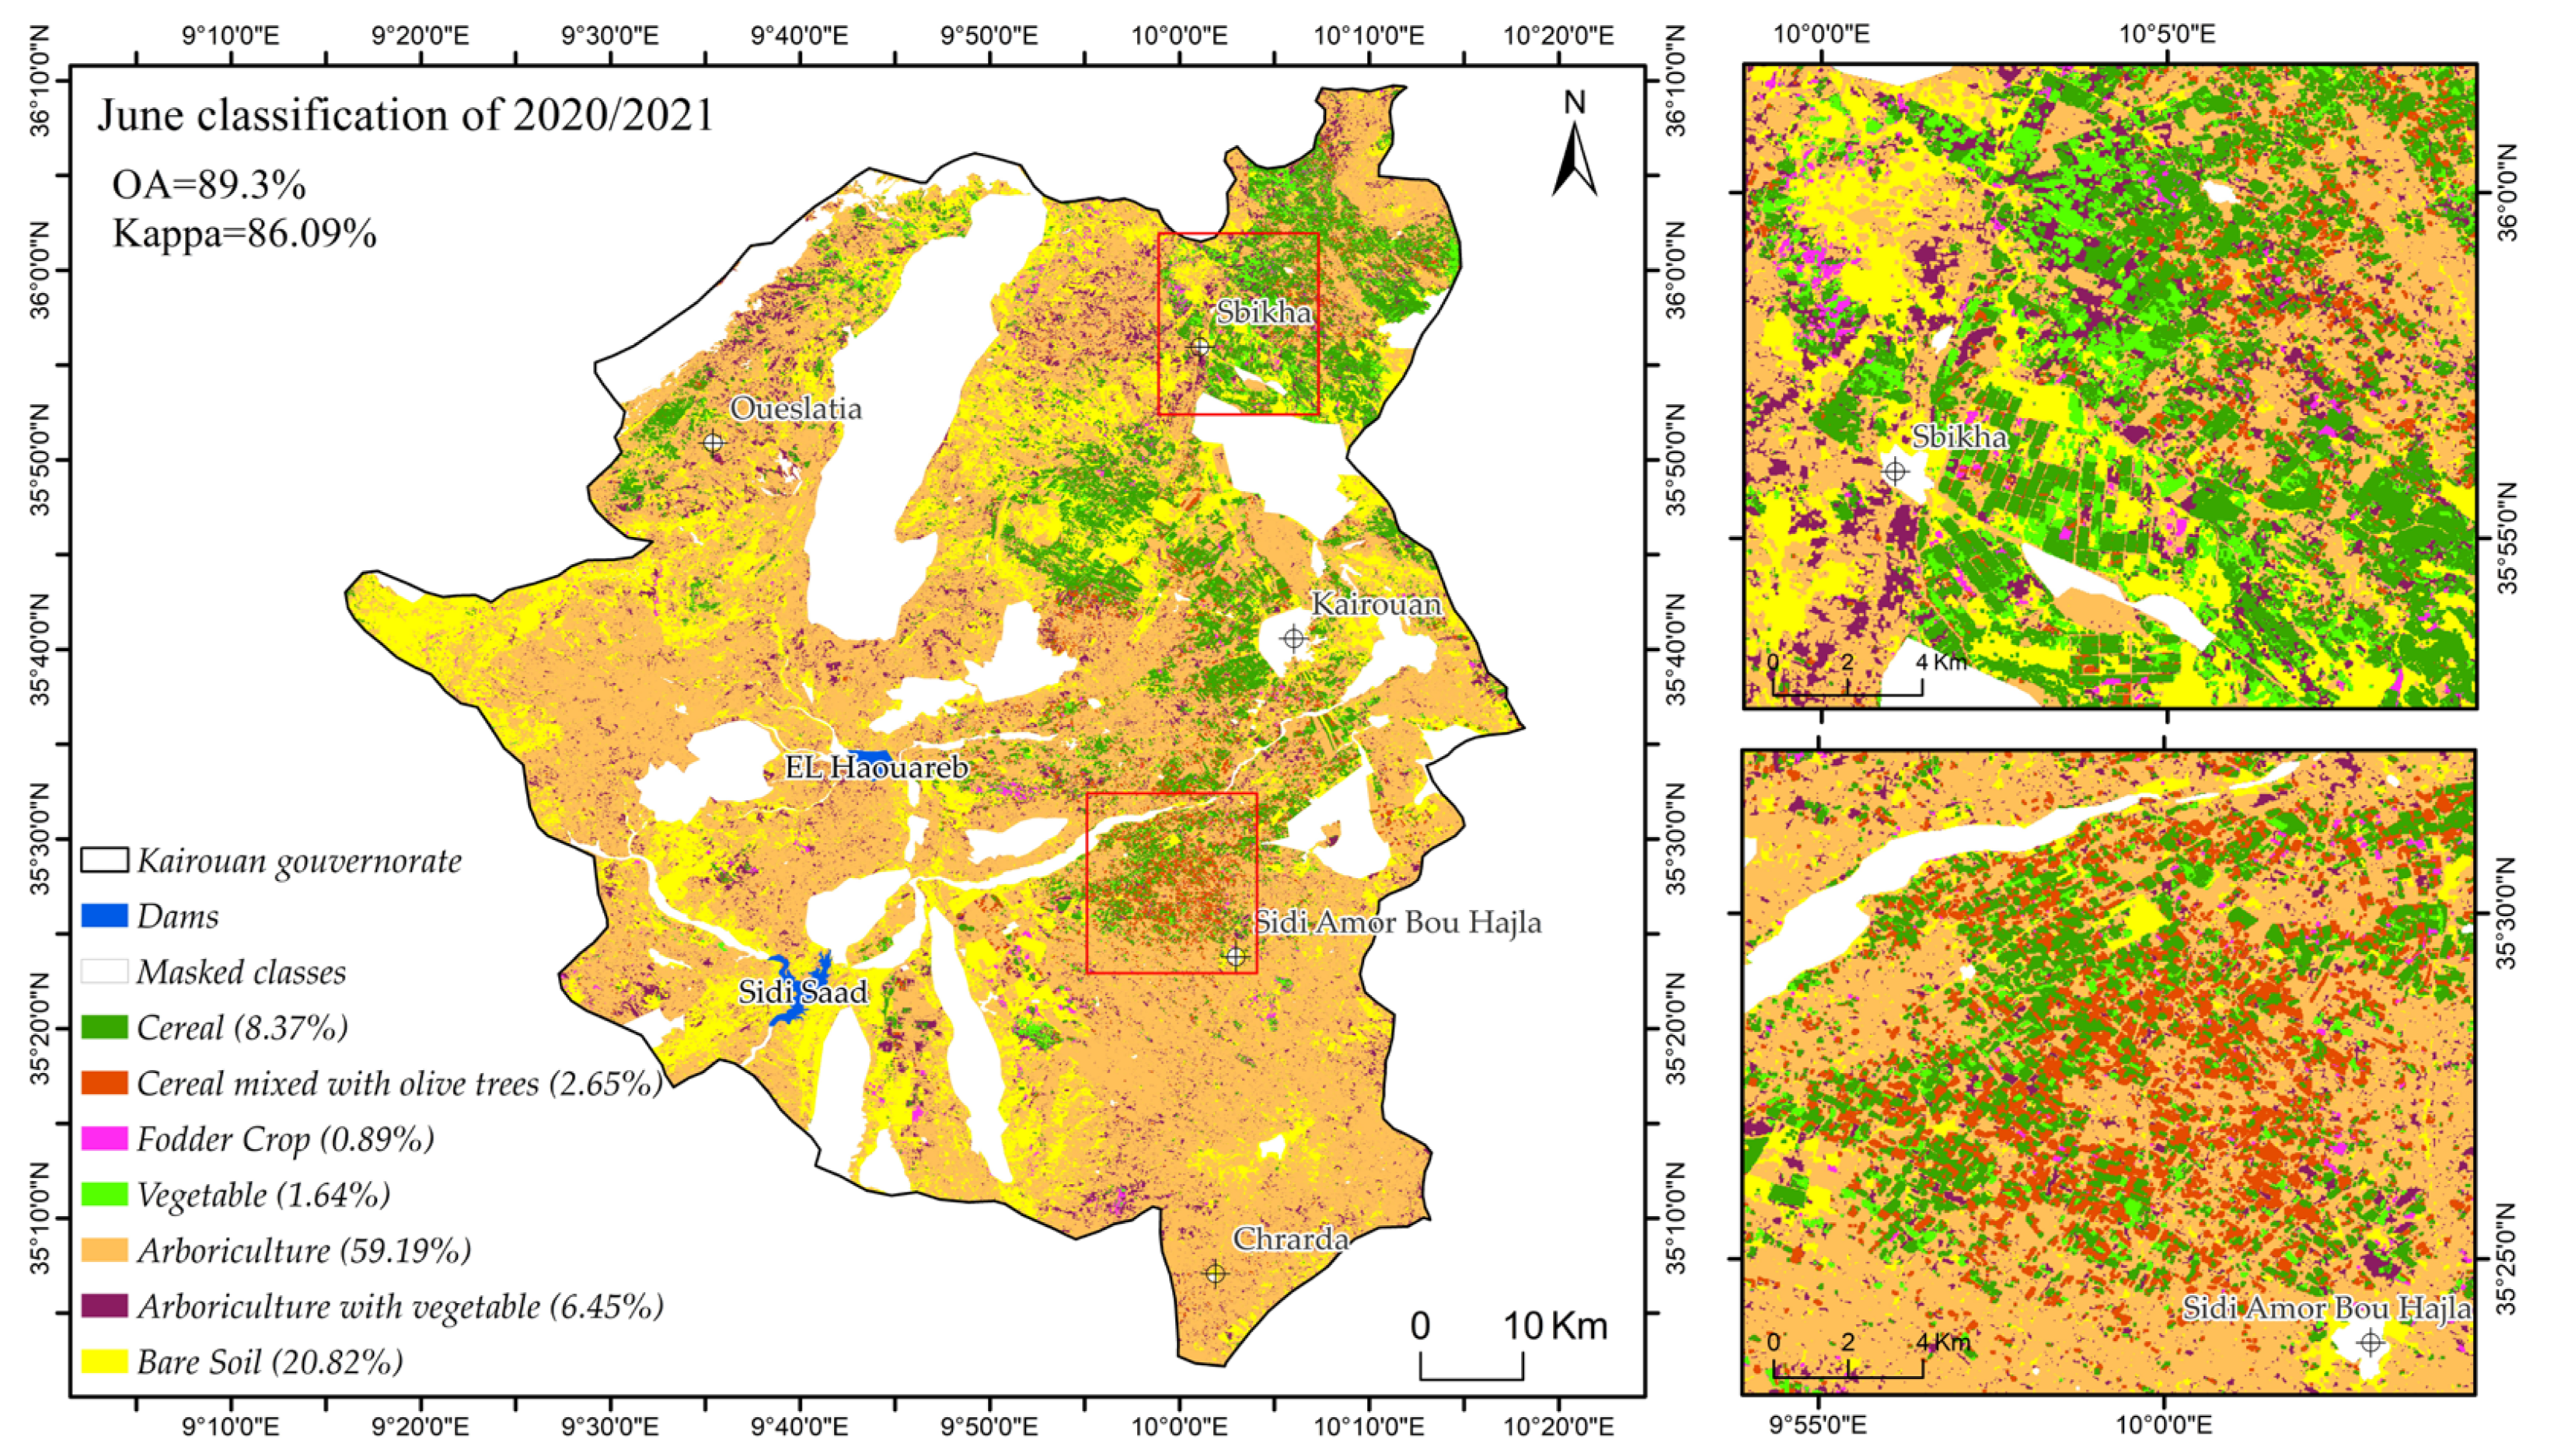

| Year/Class | 2011/ 2012 | 2012/ 2013 | 2013/ 2014 | 2014/ 2015 | 2015/ 2016 | 2016/ 2017 | 2017/ 2018 | 2018/ 2019 | 2019/ 2020 | 2020/ 2021 | 2021/ 2022 |
|---|---|---|---|---|---|---|---|---|---|---|---|
| Cereal | 57 | 76 | 76 | 26 | - | 99 | 188 | 171 | 117 | 261 | 419 |
| Cereal with olive trees | - | 1 | 2 | - | - | 41 | 43 | 40 | 30 | 109 | 69 |
| Fodder crop | - | 28 | - | 4 | - | - | - | - | - | 32 | 35 |
| Vegetable | 69 | 96 | 96 | 93 | - | 23 | 21 | 22 | 17 | 71 | 12 |
| Arboriculture | 11 | 3 | 3 | 54 | - | 11 | 10 | 18 | 45 | 215 | 164 |
| Arboriculture with vegetable | 42 | 33 | 33 | 32 | - | 25 | 35 | 35 | 49 | 35 | 44 |
| Bare soil | 14 | 15 | 3 | 60 | - | 35 | 6 | 11 | 26 | 53 | 129 |
| Total | 193 | 252 | 213 | 269 | - | 234 | 303 | 297 | 284 | 776 | 868 |
| Cereal | Cereal with Olive Trees | Fodder Crop | Vegetable | Arboriculture | Arboriculture with Vegetable | Bare Soil | Row Total | |
|---|---|---|---|---|---|---|---|---|
| Cereal | 12,680 | 385 | 0 | 140 | 112 | 9 | 3 | 13,329 |
| Cereal with olive trees | 347 | 3984 | 1 | 1 | 419 | 122 | 0 | 4874 |
| Fodder crop | 443 | 28 | 696 | 19 | 3 | 4 | 0 | 1193 |
| Vegetable | 46 | 1 | 0 | 1286 | 2 | 178 | 0 | 1513 |
| Arboriculture | 24 | 232 | 16 | 0 | 7298 | 53 | 45 | 7668 |
| Arboriculture with vegetable | 41 | 45 | 171 | 74 | 346 | 820 | 16 | 1513 |
| Bare soil | 6 | 0 | 5 | 19 | 819 | 8 | 8133 | 8990 |
| Column total | 13,587 | 4675 | 889 | 1539 | 8999 | 1194 | 8197 | 39,080 |
| P (%) | 95.1 | 81.7 | 58.3 | 85 | 95.2 | 54.2 | 90.5 | |
| R (%) | 93.3 | 85.2 | 78.3 | 83.6 | 81.1 | 68.7 | 99.2 | |
| F1 | 94.2 | 83.4 | 66.9 | 84.3 | 87.6 | 60.6 | 94.6 |
| Cereal | Cereal with Olive Tree | Fodder Crop | Vegetable | Arboriculture | Arboriculture with Vegetable | Bare Soil | Row Total | |
|---|---|---|---|---|---|---|---|---|
| Cereal | 10,994 | 395 | 5 | 1611 | 163 | 109 | 52 | 13,329 |
| Cereal with olive trees | 378 | 3372 | 114 | 70 | 762 | 178 | 0 | 4874 |
| Fodder crop | 322 | 13 | 627 | 197 | 2 | 32 | 0 | 1193 |
| Vegetable | 164 | 0 | 0 | 1145 | 7 | 183 | 14 | 1513 |
| Arboriculture | 11 | 111 | 4 | 1 | 7419 | 100 | 22 | 7668 |
| Arboriculture with vegetable | 27 | 35 | 2 | 68 | 529 | 844 | 8 | 1513 |
| Bare soil | 392 | 1 | 1 | 30 | 2232 | 203 | 6131 | 8990 |
| Column total | 12,288 | 3927 | 753 | 3122 | 11,114 | 1649 | 6227 | 39,080 |
| P (%) | 82.5 | 69.2 | 52.6 | 75.7 | 96.8 | 55.8 | 68.2 | |
| R (%) | 89.5 | 85.9 | 83.3 | 36.7 | 66.8 | 51.2 | 98.5 | |
| F1 | 85.8 | 76.6 | 64.4 | 49.4 | 79 | 53.4 | 80.6 |
| Cereal | Cereal with Olive Tree | Fodder Crop | Vegetable | Arboriculture | Arboriculture with Vegetable | Bare Soil | Row Total | |
|---|---|---|---|---|---|---|---|---|
| Cereal | 12,689 | 299 | 1 | 124 | 156 | 5 | 55 | 13,329 |
| Cereal with olive trees | 375 | 3903 | 0 | 14 | 451 | 131 | 0 | 4874 |
| Fodder crop | 459 | 10 | 693 | 28 | 2 | 1 | 0 | 1193 |
| Vegetable | 143 | 1 | 69 | 1086 | 8 | 132 | 74 | 1513 |
| Arboriculture | 8 | 92 | 0 | 3 | 7046 | 229 | 290 | 7668 |
| Arboriculture with vegetable | 5 | 117 | 31 | 81 | 293 | 862 | 124 | 1513 |
| Bare soil | 136 | 4 | 1 | 49 | 766 | 95 | 7939 | 8990 |
| Column total | 13,815 | 4426 | 795 | 1385 | 8722 | 1455 | 8482 | 39,080 |
| P (%) | 95.2 | 80.1 | 58.1 | 71.8 | 91.9 | 57 | 88.3 | |
| R (%) | 91.8 | 88.2 | 87.2 | 78.4 | 80.8 | 59.2 | 93.6 | |
| F1 | 93.5 | 83.9 | 69.7 | 74.9 | 86 | 58.1 | 91.9 |
| Data | Year | Cereal | Cereal with Olive Trees | Land Cover | |||||
|---|---|---|---|---|---|---|---|---|---|
| P | R | F1 | P | R | F1 | OA | Kappa | ||
| Reference year S2 | 2020/2021 | 95.1 | 93.3 | 94.2 | 81.7 | 85.2 | 83.4 | 89.3 | 86.1 |
| S2 | 2021/2022 | 95.1 | 75.3 | 84 | 27.4 | 84.7 | 41.3 | 73.5 | 61.9 |
| 2019/2020 | 86.9 | 83.1 | 85 | 60.4 | 76.9 | 67.6 | 73.2 | 62.4 | |
| 2018/2019 | 90.8 | 69.6 | 78.8 | 36.1 | 74.4 | 48.6 | 67.3 | 44.1 | |
| 2017/2018 | 85.8 | 87.8 | 86.8 | 40.9 | 52.2 | 45.9 | 75 | 45.2 | |
| L8 | 2021/2022 | 91.8 | 30.8 | 46.1 | 9.1 | 42.1 | 14.9 | 47.6 | 34.3 |
| 2019/2020 | 69.1 | 58.5 | 63.3 | 33 | 66.7 | 44.2 | 49.9 | 32.1 | |
| 2018/2019 | 82.8 | 43.5 | 57 | 20.7 | 86.7 | 33.4 | 42.2 | 16.2 | |
| 2017/2018 | 89.3 | 71.7 | 79.6 | 21.9 | 60.2 | 32.1 | 59.5 | 27.7 | |
| 2016/2017 | 70.5 | 27.8 | 39.8 | 17.8 | 56.6 | 27.1 | 44.3 | 33.1 | |
| 2014/2015 | 41 | 80.2 | 54.2 | - | - | - | 38.3 | 22.9 | |
| 2013/2014 | 50.1 | 65.5 | 56.8 | - | - | - | 30.7 | 7 | |
| L7 | 2012/2013 | 57.4 | 48.2 | 52.4 | - | - | - | 25.3 | 6.3 |
| 2011/2012 | 48.8 | 62.8 | 62.8 | - | - | - | 36.7 | 7.1 | |
| Data | Year | Cereal | Cereal with Olive Trees | Land Cover | |||||
|---|---|---|---|---|---|---|---|---|---|
| P | R | F1 | P | R | F1 | OA | Kappa | ||
| Reference year S2 | 2020/2021 | 82.5 | 89.5 | 85.8 | 69.2 | 85.9 | 76.6 | 74.8 | 68.2 |
| S2 | 2021/2022 | 95.6 | 55.8 | 70.5 | 40.5 | 45.2 | 42.7 | 63.7 | 51.8 |
| 2019/2020 | 84.2 | 68.5 | 75.5 | 51.9 | 58 | 54.8 | 54.6 | 39.4 | |
| 2018/2019 | 95.2 | 58.3 | 72.3 | 37.2 | 43.5 | 40.1 | 53.9 | 31.1 | |
| 2017/2018 | 95 | 34 | 50.1 | 13.7 | 48.3 | 21.3 | 33.5 | 14.5 | |
| L8 | 2021/2022 | 95.5 | 54.4 | 69.3 | 22.4 | 49.8 | 30.9 | 65 | 52.1 |
| 2019/2020 | 88.1 | 45.3 | 59.8 | 37.5 | 58.1 | 45.6 | 41.6 | 27.3 | |
| 2018/2019 | 78.2 | 20.8 | 32.9 | 11.1 | 21.7 | 14.7 | 19.6 | 3.5 | |
| 2017/2018 | 98.8 | 13.1 | 23.1 | 9.2 | 26.4 | 13.6 | 15.8 | 4.7 | |
| 2016/2017 | 93.6 | 6.8 | 12.7 | 4.2 | 6.1 | 5 | 32.9 | 21.4 | |
| 2014/2015 | 43 | 61.2 | 50.5 | - | - | - | 34 | 17.9 | |
| 2013/2014 | 91.2 | 10.5 | 53.7 | - | - | - | 22.9 | 13.1 | |
| L7 | 2012/2013 | 50.2 | 21.6 | 30.2 | - | - | - | 14.3 | 0.5 |
| 2011/2012 | 24.8 | 10.5 | 14.8 | - | - | - | 15.5 | 1.8 | |
| Data | Year | Cereal | Cereal with Olive Trees | Land Cover | |||||
|---|---|---|---|---|---|---|---|---|---|
| P | R | F1 | P | R | F1 | OA | Kappa | ||
| Reference year S2 | 2020/2021 | 95.2 | 91.8 | 93.5 | 80.1 | 88.2 | 83.9 | 87.7 | 84 |
| S2 | 2021/2022 | 94.2 | 78.1 | 85.4 | 42.9 | 55.8 | 48.5 | 75.2 | 63.8 |
| 2019/2020 | 85.1 | 78.1 | 81.5 | 42.9 | 61.9 | 50.7 | 60.6 | 45.8 | |
| 2018/2019 | 91.6 | 64.6 | 75.8 | 30.3 | 48.4 | 37.3 | 57 | 30.9 | |
| 2017/2018 | 92.2 | 57.9 | 71.1 | 16.9 | 47.3 | 24.9 | 51.3 | 24.9 | |
| L8 | 2021/2022 | 95.4 | 54.2 | 69.1 | 23.7 | 50.4 | 32.3 | 67.9 | 55.3 |
| 2019/2020 | 84.6 | 52.2 | 64.6 | 40.7 | 72.3 | 52.1 | 49.1 | 35.2 | |
| 2018/2019 | 83.5 | 27 | 40.8 | 10.1 | 17.8 | 12.9 | 22.9 | 4.6 | |
| 2017/2018 | 93.7 | 34.8 | 50.7 | 12.9 | 34.5 | 18.8 | 32.5 | 12.4 | |
| 2016/2017 | 69 | 36 | 47 | 7.1 | 7 | 7 | 43.6 | 30.2 | |
| 2014/2015 | 42.6 | 69.4 | 52.8 | - | - | - | 43.2 | 27.8 | |
| 2013/2014 | 72.6 | 38.1 | 49.9 | - | - | - | 20.9 | 10.4 | |
| L7 | 2012/2013 | 47 | 25.8 | 33.4 | - | - | - | 14.7 | 0.6 |
| 2011/2012 | 44.1 | 23.2 | 30.4 | - | - | - | 22.1 | 3.2 | |
Disclaimer/Publisher’s Note: The statements, opinions and data contained in all publications are solely those of the individual author(s) and contributor(s) and not of MDPI and/or the editor(s). MDPI and/or the editor(s) disclaim responsibility for any injury to people or property resulting from any ideas, methods, instructions or products referred to in the content. |
© 2023 by the authors. Licensee MDPI, Basel, Switzerland. This article is an open access article distributed under the terms and conditions of the Creative Commons Attribution (CC BY) license (https://creativecommons.org/licenses/by/4.0/).
Share and Cite
Khlif, M.; Escorihuela, M.J.; Chahbi Bellakanji, A.; Paolini, G.; Kassouk, Z.; Lili Chabaane, Z. Multi-Year Cereal Crop Classification Model in a Semi-Arid Region Using Sentinel-2 and Landsat 7–8 Data. Agriculture 2023, 13, 1633. https://doi.org/10.3390/agriculture13081633
Khlif M, Escorihuela MJ, Chahbi Bellakanji A, Paolini G, Kassouk Z, Lili Chabaane Z. Multi-Year Cereal Crop Classification Model in a Semi-Arid Region Using Sentinel-2 and Landsat 7–8 Data. Agriculture. 2023; 13(8):1633. https://doi.org/10.3390/agriculture13081633
Chicago/Turabian StyleKhlif, Manel, Maria José Escorihuela, Aicha Chahbi Bellakanji, Giovanni Paolini, Zeineb Kassouk, and Zohra Lili Chabaane. 2023. "Multi-Year Cereal Crop Classification Model in a Semi-Arid Region Using Sentinel-2 and Landsat 7–8 Data" Agriculture 13, no. 8: 1633. https://doi.org/10.3390/agriculture13081633
APA StyleKhlif, M., Escorihuela, M. J., Chahbi Bellakanji, A., Paolini, G., Kassouk, Z., & Lili Chabaane, Z. (2023). Multi-Year Cereal Crop Classification Model in a Semi-Arid Region Using Sentinel-2 and Landsat 7–8 Data. Agriculture, 13(8), 1633. https://doi.org/10.3390/agriculture13081633


