Article

Morpho-Physiological and Antioxidative Responses of Wheat Seedlings to Different Forms of Selenium

by
Ana Vuković Popović
1,
Ivna Štolfa Čamagajevac
1,*,
Rosemary Vuković
1,
Magdalena Matić
2,
Dharmendra K. Gupta
3 and
Zdenko Lončarić
2
1
Department of Biology, University of Osijek, 31000 Osijek, Croatia
2
Faculty of Agrobiotechnical Sciences Osijek, University of Osijek, 31000 Osijek, Croatia
3
Ministry of Environment, Forest and Climate Change, New Delhi 110003, India
*
Author to whom correspondence should be addressed.
Agriculture 2023, 13(8), 1632; https://doi.org/10.3390/agriculture13081632
Submission received: 26 July 2023 / Revised: 16 August 2023 / Accepted: 17 August 2023 / Published: 19 August 2023
(This article belongs to the Special Issue Impact of Agricultural Practices on the Environment)

Abstract

:
Selenium (Se) deficiency in human and animal nutrition is primarily due to low levels of Se in soils. It can be prevented by enriching crops, such as wheat, with Se through agronomic biofortification. Although Se is not essential for plants, it shows a dual effect on their metabolism depending on its concentration. This study aimed to elucidate the impact of five different concentrations (0.4, 4, 20, 40, and 400 mg/kg) of selenate and selenite on the oxidative status and antioxidative response of wheat (Triticum aestivum L., cv. Kraljica) shoots and roots. According to morpho-physiological analyses, selenite was found to have a lower toxicity threshold than selenate. The measurement of oxidative stress biomarkers showed that Se did not cause oxidative damage to wheat seedlings due to the activation of detoxification mechanisms at the biochemical level, which depended on the type of tissue, concentration, and form of applied Se. Treatment with 20 mg/kg of selenate can be recommended for wheat seedling biofortification due to a sufficient increase in Se accumulation in shoots without signs of toxicity. These results contribute to a better understanding of wheat seedlings’ physiological and biochemical responses to Se and the development of more effective biofortification strategies.

1. Introduction

As a result of anthropogenic actions and climate changes, the composition and quality of the soil have been disturbed [1,2]. There are various techniques to improve the condition and health of the soil [3,4], including agronomic biofortification. This technique is an effective strategy for enhancing the concentration and bioavailability of micronutrients in soils and the edible parts of plants through fertilization [5]. Selenium (Se) is one of the most important biologically active micronutrients necessary for the proper functioning of many organisms, including humans and animals [6,7]. Plants are the primary source of dietary Se [8,9]. Since staple crops, like wheat, are consumed by a large portion of the population due to their nutritional value, they represent an obvious target for biofortification strategies that will increase the dietary Se intake in Se-deficient areas [10,11]. Moreover, wheat can concentrate sufficient levels of Se without causing any damage to its growth or yield [12]. Since biofortification increases the concentration of Se in plants and soil, it is necessary to investigate how the increased concentration and different forms of Se affect the plant itself.
Selenate and selenite are mainly used in agronomic biofortification as they are the most readily available forms of Se in soils and waters [13,14,15,16,17,18,19]. It is known that plants uptake selenate and selenite by different mechanisms [20,21,22,23]. However, due to the similar chemical properties to sulfur (S), both forms are metabolized by the S assimilation pathway to SeCys and SeMet. The nonspecific incorporation of Se instead of S into cysteine and methionine, and finally the incorporation of SeCys and SeMet in proteins, is one of the main mechanisms of Se toxicity [24,25].
The role of Se in plants depends primarily on its chemical form and concentration but also on the plant species, developmental stage, and plant organ. Although it is not essential for higher plants, Se shows a dual effect on their metabolism. Low concentrations benefit overall growth and development, while at higher concentrations, it becomes toxic [26,27,28]. Selenium interferes with numerous metabolic pathways, and its effect is visible at the morpho-physiological and biochemical levels [28]. Although Se in lower concentrations has a positive effect on plant growth, Ramos et al. [18] emphasized that selenate and selenite did not affect the shoot and root growth equally and that the influence depended on the form of Se. Some studies showed that increased biomass due to exposure to Se resulted from increased mineral intake and increased photosynthetic efficiency, which includes, among other things, an increase in concentrations of photosynthetic pigments [28]. At higher concentrations, regardless of the chemical form, Se has the opposite effect on most of the parameters mentioned above and can decrease overall plant growth and development [29]. Morpho-physiological toxic symptoms of Se in plants include reduced biomass [28], photosynthetic efficiency [30,31], and germination rate [32]. Toxicity can also manifest through symptoms such as chlorosis, necrosis, various other leaf damages, and drying [30].
Morpho-physiological changes due to the presence of Se are accompanied by changes at the biochemical level [33]. These changes are related to the formation of reactive oxygen species (ROS), such as hydrogen peroxide (H2O2), and changes in the antioxidative defense system. Excessive accumulation of ROS leads to oxidative damage of biologically important molecules such as DNA, proteins, and lipids [34]. To protect themselves from the negative consequences of ROS accumulation, plants have developed an antioxidant defense system that can be enzymatic or non-enzymatic [35]. Examining the influence of selenate and selenite on the antioxidant capacity of lettuce leaves, Rios et al. [36] determined that selenate is less toxic than selenite as selenite caused a higher accumulation of H2O2 and increased lipid peroxidation (LPO); these values were significantly lower after exposure to selenate, followed by higher antioxidative enzyme activities [36]. It is also known that increased antioxidative capacity, in the form of increased activities of antioxidant enzymes, improves Se tolerance in some plant species [37]. Contrary to lower Se concentrations, higher concentrations promote the formation of ROS, whose excessive accumulation causes oxidative damage [38]. An increase in ROS concentration due to exposure to higher concentrations of Se has been recorded in species such as beans [39], cucumber [40], quinoa [41], and rice [30]. The accumulation of ROS promotes LPO, thereby impairing cell integrity, which can lead to cell death [29]. Therefore, the level of LPO is often monitored as a biomarker of oxidative damage [17,26,28,42]. Increased LPO levels may be accompanied by a decrease in antioxidative enzyme activities [26], but also by an increase in the activity of enzymes such as catalase (CAT) [43,44] and guaiacol peroxidase (GPOD) [39], which are important for H2O2 detoxification.
Despite numerous studies on the influence of Se on the oxidative and antioxidant status of plants, the mechanism of its action still needs to be further elucidated. It should be emphasized that there is a lack of investigations about the effect of Se on the plant’s metabolism without previously exposing the plant to stress. The aim of this study was primarily to investigate the effect of different concentrations (environmentally relevant and sublethal concentrations) and chemical forms of Se (selenate and selenite) on the oxidative status and antioxidative response of wheat seedlings and observe how they will reflect on their morpho-physiological characteristics. We hypothesize that selenate and selenite will increase the concentration of Se in wheat seedlings depending on the applied concentration and the chemical form of Se followed by a tissue-specific response. Additionally, we assume that different forms of Se will activate different antioxidative mechanisms in shoots and roots.

2. Materials and Methods

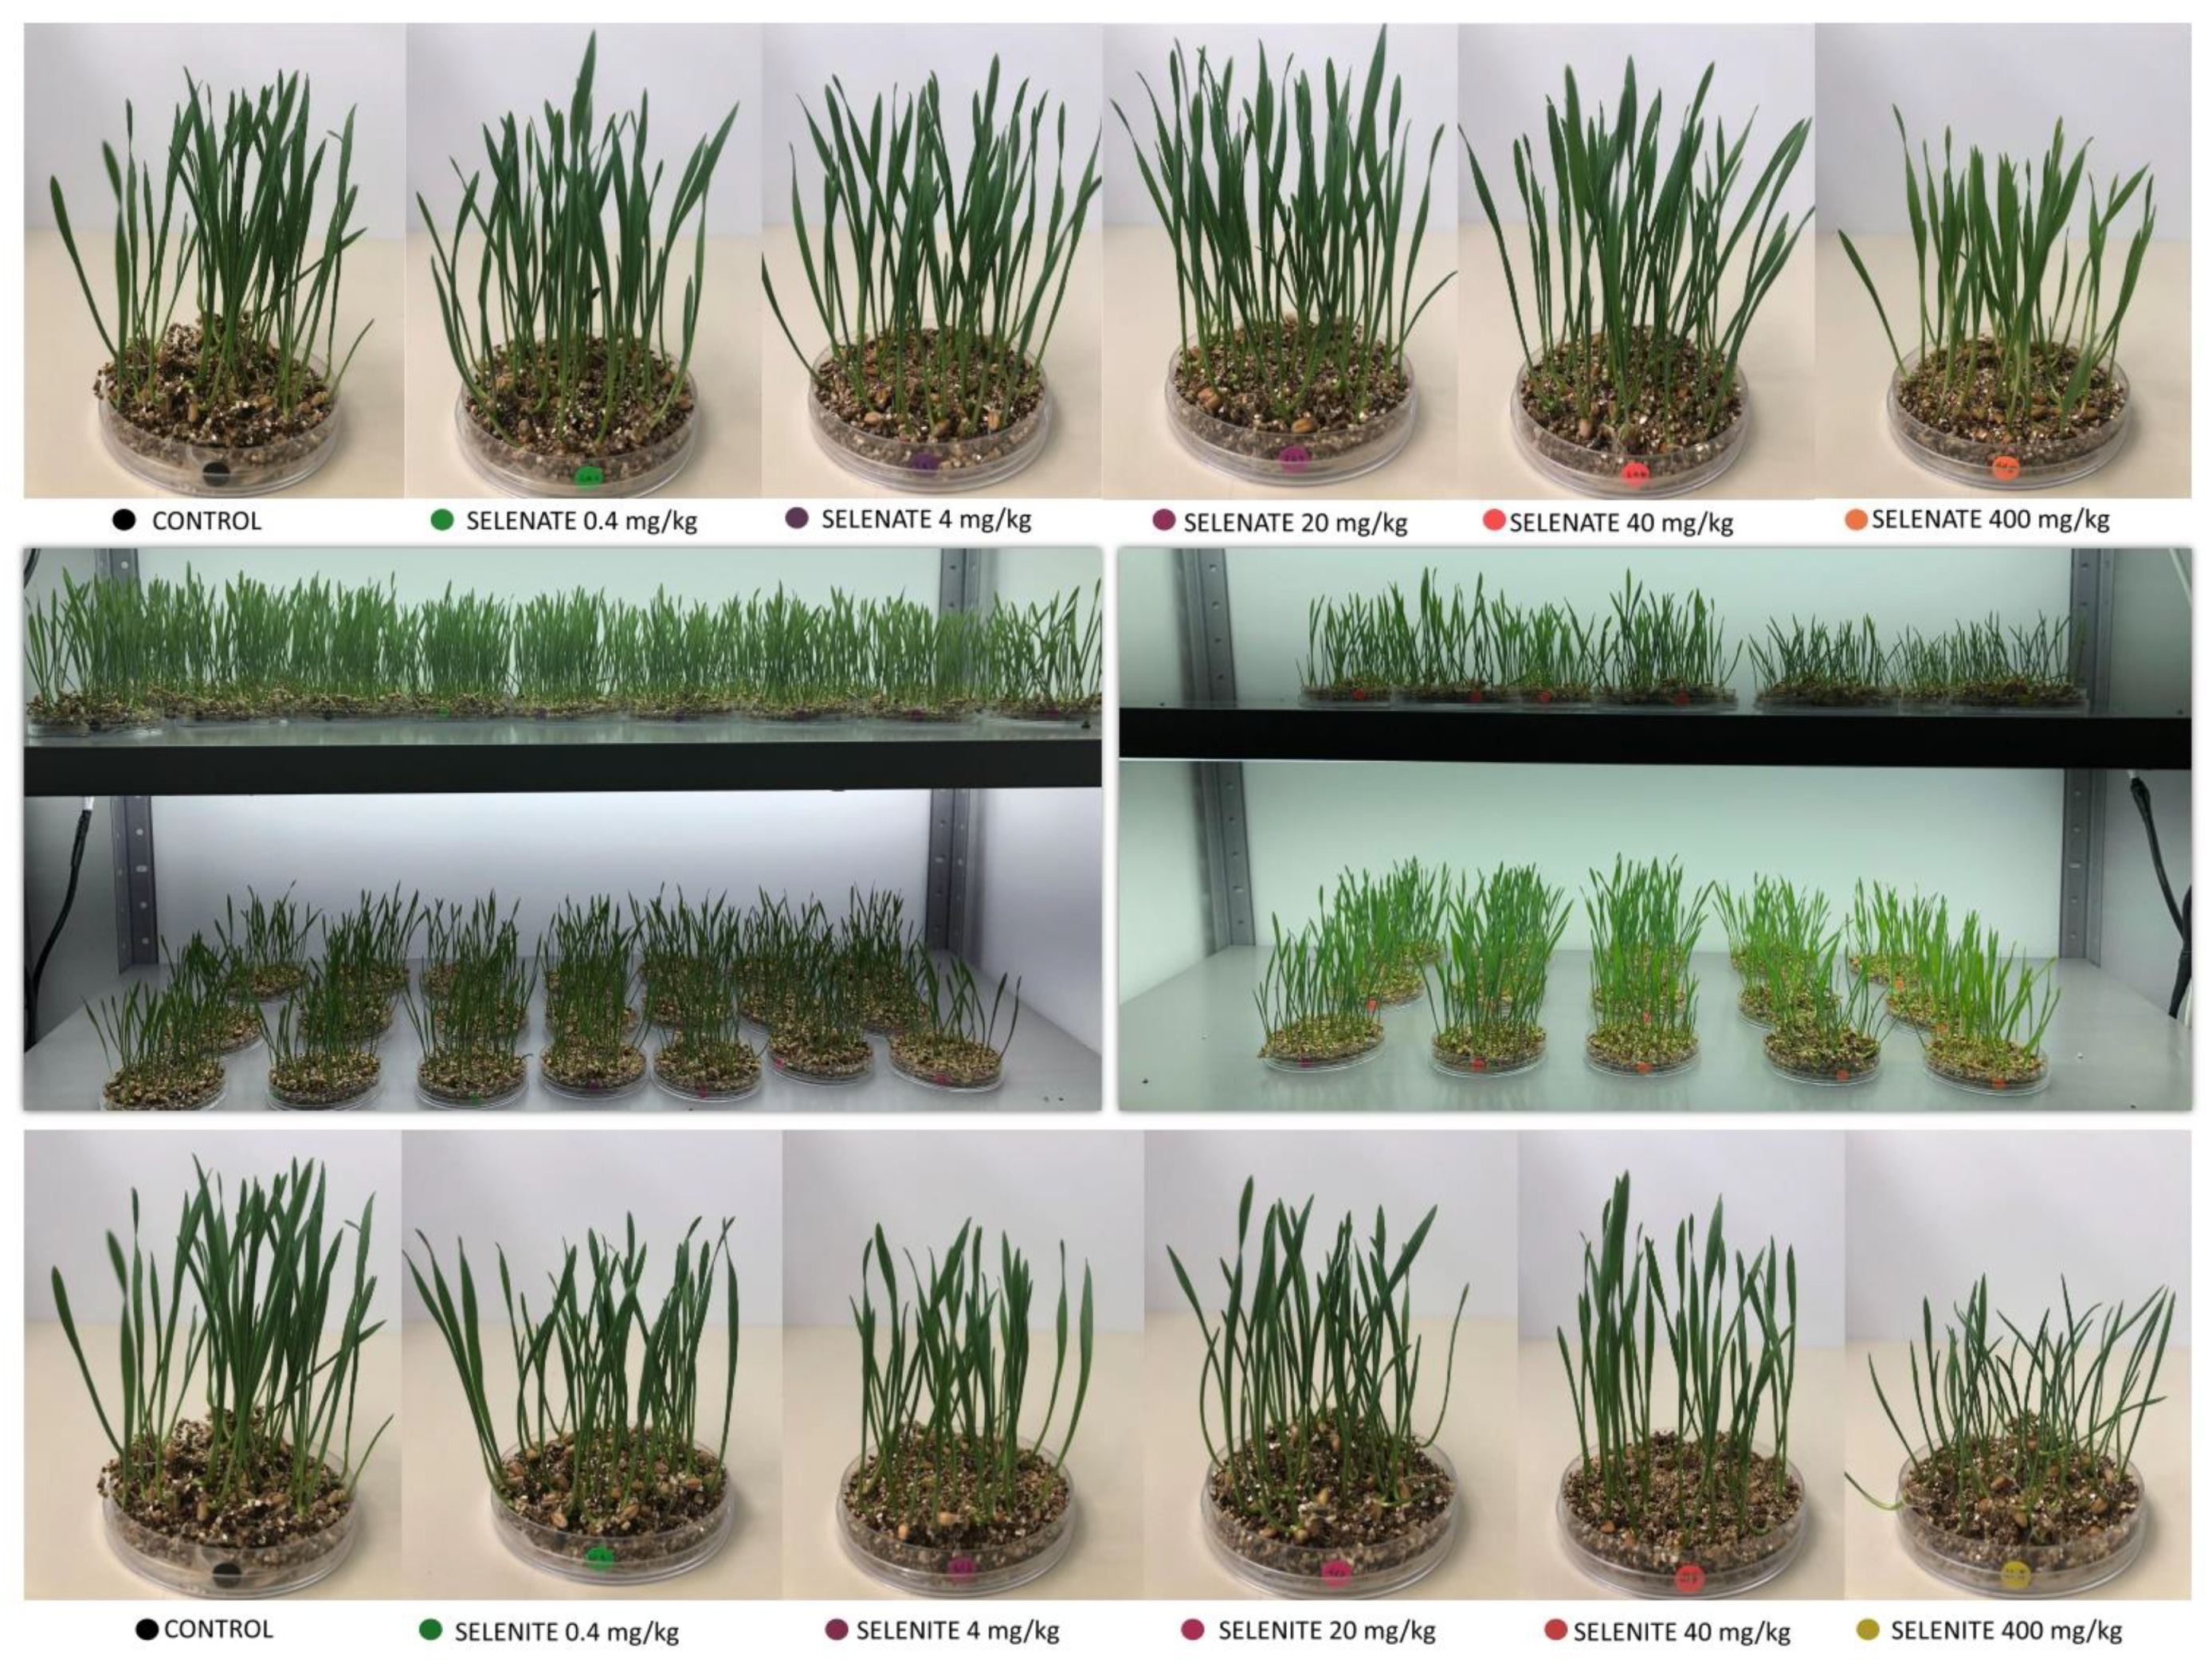
2.1. Plant Material, Growth Condition, and Treatment

In this research, seeds of the Croatian winter wheat variety (Triticum aestivum L., cv. Kraljica) originated from the Agricultural Institute Osijek were selected and subjected to different concentrations and forms of Se in the germination stage. The Variety Kraljica was used as the most widespread and high-yielding variety in production in the Republic of Croatia. It belongs to the A2 quality group and shows good resistance to lodging [45,46].
Before germination, wheat seeds were sterilized with 96% ethanol and washed a few times in dH2O. Additional sterilization was done with a sodium dichloroisocynurate solution (Izosan-G, PLIVA, Zagreb, Croatia) containing 0.001% Tween for 8 min. Seeds were rewashed a few times in dH2O and left overnight at 4 °C. The next day, 50 seeds were planted on vermiculite in Petri dishes (Ø 90 mm). Seeds were planted in seven biological replicates for control and seven for each Se treatment (Figure 1). Vermiculite was previously soaked with 20 mL of Hoagland’s solution [47] with the addition of Se. Selenium was applied as selenate (Na2SeO4) and selenite (Na2SeO3) to final environmentally relevant and sublethal concentrations of 0.4, 4, 20, 40, and 400 mg/kg. The average Se concentration in soils worldwide is 0.4 mg/kg [48], which is within the range of normal Se levels, while toxicity in soils occurs between 30 and 324 mg/kg [49].
Control plants were grown on vermiculite without Se, only with the addition of Hoagland’s solution. Wheat seedlings were grown under a 16/8 h light/dark photoperiod at 25/20 °C day/night temperature with regular watering. After seven days of growth, seedlings were sampled for morpho-physiological and biochemical analyses. For biochemical and most morpho-physiological analysis, wheat shoot and root tissue were frozen in liquid nitrogen and macerated in 10 mL stainless steel jars containing a grinding ball (Ø 20 mm) for 1 min at 30 Hz using a Tissue-LyserII bead mill (Qiagen, Hilden, Germany). Proteins and metabolites were extracted from the tissue powder aliquots using an appropriate extraction solution.

2.2. Total Se Determination

For the Se concentration estimation, wheat shoots and roots were dried in an oven at 105 °C for 24 h. The dry wheat tissue was ground to a fine powder using a metal laboratory ultracentrifugal mill (Retsch ZM 200, Haan, Germany). To an aliquot of the milled powder, 10 mL of the mixture HNO3:H2O2 (5:1) was added, and the homogenates were then heated in a microwave oven (CEM Mars 6, Charlotte, NC, USA) at 180 °C for 60 min. After cooling, 5 mL of concentrated HCl was added to the reaction mixture to reduce Se6+ to Se4+. Se concentration in shoots and roots was determined using optical emission spectrometry with inductively coupled plasma (ICP-OES, model Perkin Elmer Optima 2100 DV, Waltham, MA, USA), where rice flour IRMM-804 was used as a reference material.

2.3. Morpho-Physiological Analyses

2.3.1. Seed Germination

On the seventh day of germination, the germination percentage was calculated as an indicator of wheat seed viability and potential to emerge. The germination percentage was determined by the number of germinated seeds divided by the total number of planted seeds. The obtained number was multiplied by 100, and germination was expressed as a percentage.

2.3.2. Determination of Shoot and Root Biomass

After determining the germination percentage, the shoots and roots of wheat seedlings were separated to evaluate the morphological characteristics, i.e., biomass. For the biomass estimation, a fresh mass of the shoots and roots was measured immediately after sampling. The fresh weight (FW) of wheat shoots and roots was expressed in grams (g).

2.3.3. Determination of Photosynthetic Pigment Concentration

A fine frozen powder (100 mg) obtained after grinding was homogenized with the cold 80% acetone. Pigments were extracted on ice for 15 min and then centrifuged. The extraction procedure with cold acetone was repeated three more times until the precipitate became colorless. After the reextracted supernatants were collected, their exact volume was measured and diluted to a final volume of 10 mL. This was followed by spectrophotometric measurements of the absorbance at 470 nm, 645 nm, and 662 nm [50]. The concentrations of photosynthetic pigments, chlorophyll a (Chl a), chlorophyll b (Chl b), and carotenoids were expressed as mg/g of fresh weight.

2.4. Indicators of Oxidative Stress

2.4.1. Determination of Lipid Peroxidation Level

The level of lipid peroxidation (LPO) in wheat shoots and roots was determined according to the method described by Verma and Dubey [51]. This method is based on spectrophotometric measurements of the concentration of reactive substances in thiobarbituric acid (TBARS), mostly malondialdehyde (MDA).
About 200 mg of frozen wheat tissue was extracted with 0.1% (w/v) trichloroacetic acid (TCA) solution. After a short extraction on ice, homogenates were centrifuged, and the resulting supernatant was mixed with 0.5% (w/v) thiobarbituric acid (TBA) in a 20% (w/v) TCA solution. The reaction mixture was incubated in the water bath at 95 °C for 30 min. The intensity of red coloration, which was a result of this reaction, was measured spectrophotometrically at 532 nm and 600 nm. The amount of MDA was calculated using the extinction coefficient (ε = 155 1/mM/cm) and expressed in nmol per g of FW.

2.4.2. Determination of Hydrogen Peroxide

The H2O2 content in wheat shoots and roots was measured using the method described by Mukherjee and Choudhuri [52]. Frozen tissue powder (about 100 mg) was extracted with 1 mL of cold absolute acetone. After 15 min of extraction on ice, homogenates were centrifuged, and the supernatant was mixed with titanium oxysulphate and ammonium hydroxide solution to form a titanium-peroxide complex. The resulting white precipitate was dissolved in 2 M H2SO4 and centrifuged before measuring the absorbance of the supernatant at 415 nm. The total H2O2 content was determined using the standard curve of known H2O2 concentrations, and it was expressed as nmol H2O2 per g of FW.

2.5. Extraction and Assays of Enzymes

Proteins from the frozen shoot and root powder (approximately 300 mg) were extracted on ice with 1.5 mL of cold potassium phosphate buffer (1/5, w/v). The homogenates were kept on ice for 15 min and then centrifuged at 20,000× g for 15 min at 4 °C for protein extraction. Supernatants were stored at −80 °C and used for spectrophotometric determination of catalase (CAT), guaiacol peroxidase (GPOD), and protein estimation. The enzymes’ activities were measured at 25 °C using a LAMBDA 25 UV-Vis spectrophotometer equipped with the UV WinLab v6.0.4 software package (PerkinElmer, Waltham, MA, USA).
CAT (EC 1.11.1.6) activity was determined spectrophotometrically using H2O2 as a substrate [53]. The reaction mixture (1.5 mL) consisted of 0.036% H2O2 in 50 mM phosphate buffer (pH 7.0) and enzyme extract. The decrease in absorbance was monitored spectrophotometrically at 240 nm for 3 min every 10 s. CAT activity was calculated using the molar extinction coefficient (ε = 0.04 mM/cm) and expressed as U/mg protein.
GPOD (EC 1.11.1.7) activity was estimated by the method described by Siegel and Galston [54] and modified for analysis in a microplate assay. The method is based on the oxidation of guaiacol to tetraguaiacol due to the presence of H2O2. The reaction mixture consisted of 18 mM guaiacol solution and 5 mM H2O2 in 50 mM phosphate buffer (pH 7.0). The reaction was started by adding the diluted sample, and the increase in absorbance was monitored at 470 nm for 2.5 min every 10 s. GPOD activity was calculated using the molar extinction coefficient (ε = 15.83 mM/cm) and expressed as U/mg protein.
Total protein concentration in wheat protein extracts was determined by the Bradford method [55], modified for microplate assay analysis. The protein extract was incubated in the microtiter plate for 5 min at 25 °C with a Bradford reagent (Sigma-Aldrich, Steinheim, Germany). After a short incubation, the intensity of the resulting blue color was measured at 595 nm. Bovine serum albumin was used as a standard, ranging from 0.1 to 1.4 mg/mL.

2.6. Statistical Analyses

The obtained data from this research were analyzed using Statistica 14.0.0.15 (TIBCO Inc., Palo Alto, CA, USA). The data were presented as the mean of seven replicas ± standard deviation (SD). Considering the normal distribution tested by the Shapiro–Wilks test, differences between treatments were assessed using a one-way analysis of variance (ANOVA), followed by Duncan’s test. All tests were performed at a significance level of 5% (p < 0.05).

3. Results

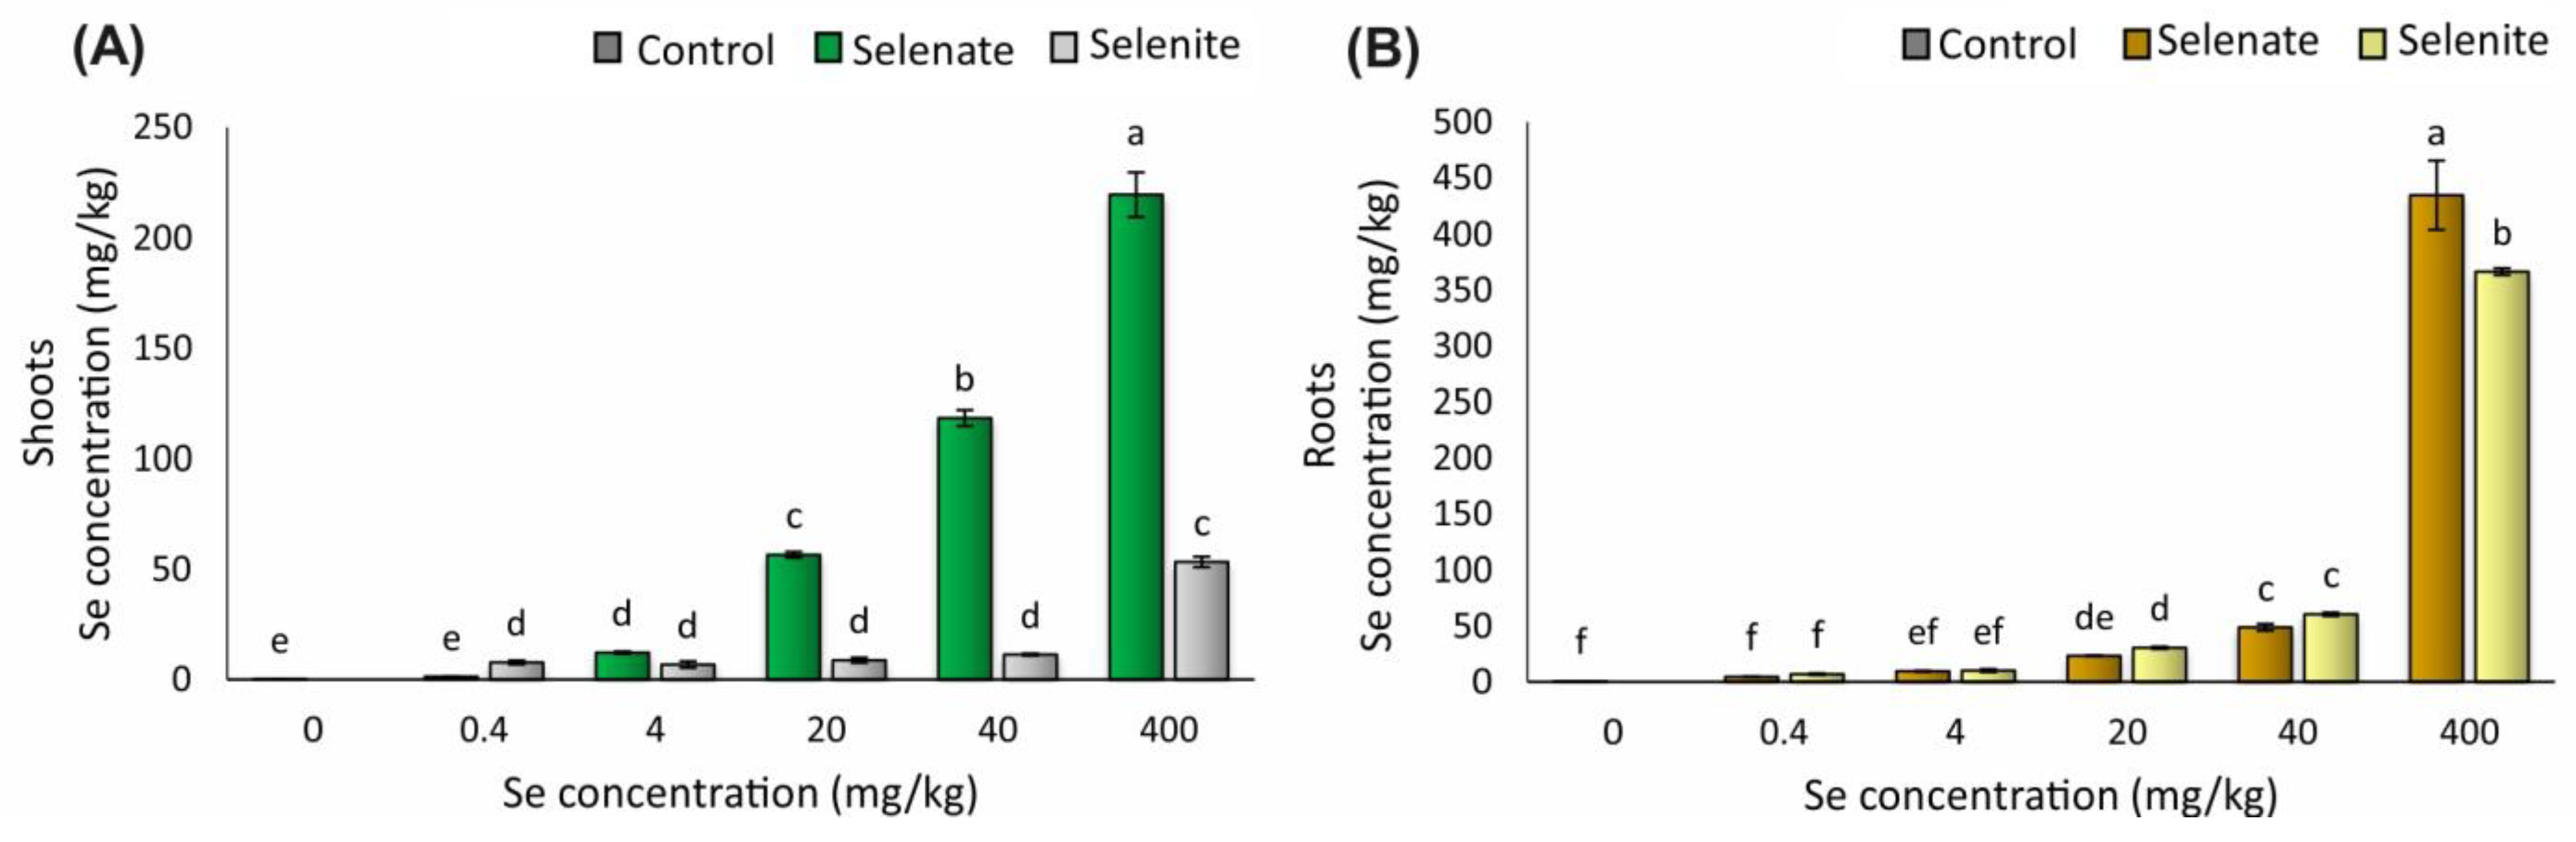
3.1. Se Concentration in Shoots and Roots

Selenium concentrations in wheat seedlings changed depending on the applied concentrations and the form of Se (Figure 2A). In wheat shoots, an increase in Se concentration was correlated with applied Se concentrations. Se concentrations in shoots treated with selenate ranged from 1.3 mg/kg to 219.5 mg/kg, which was recorded after exposure to the highest concentration (400 mg/kg). All selenate treatments, except for the lowest applied concentration (0.4 mg/kg), significantly influenced Se accumulation in the shoots compared to the control. Exposure to selenite also increased Se concentrations in shoots compared to the control. However, the range of concentrations was significantly lower than due to exposure to selenite, ranging from 7.7 mg/kg to 53.2 mg/kg.
In the roots, the Se concentration also increased as the applied concentrations of selenate and selenite were higher (Figure 2B). In most treatments, it was evident that the roots accumulated more Se after exposure to selenite than to selenate, except with the highest applied concentration. The noted range in roots treated with selenate was from 4.4 mg/kg to 434.4 mg/kg, and in roots treated with selenite, from 6.8 mg/kg to 366.3 mg/kg.

3.2. Morpho-Physiological Traits

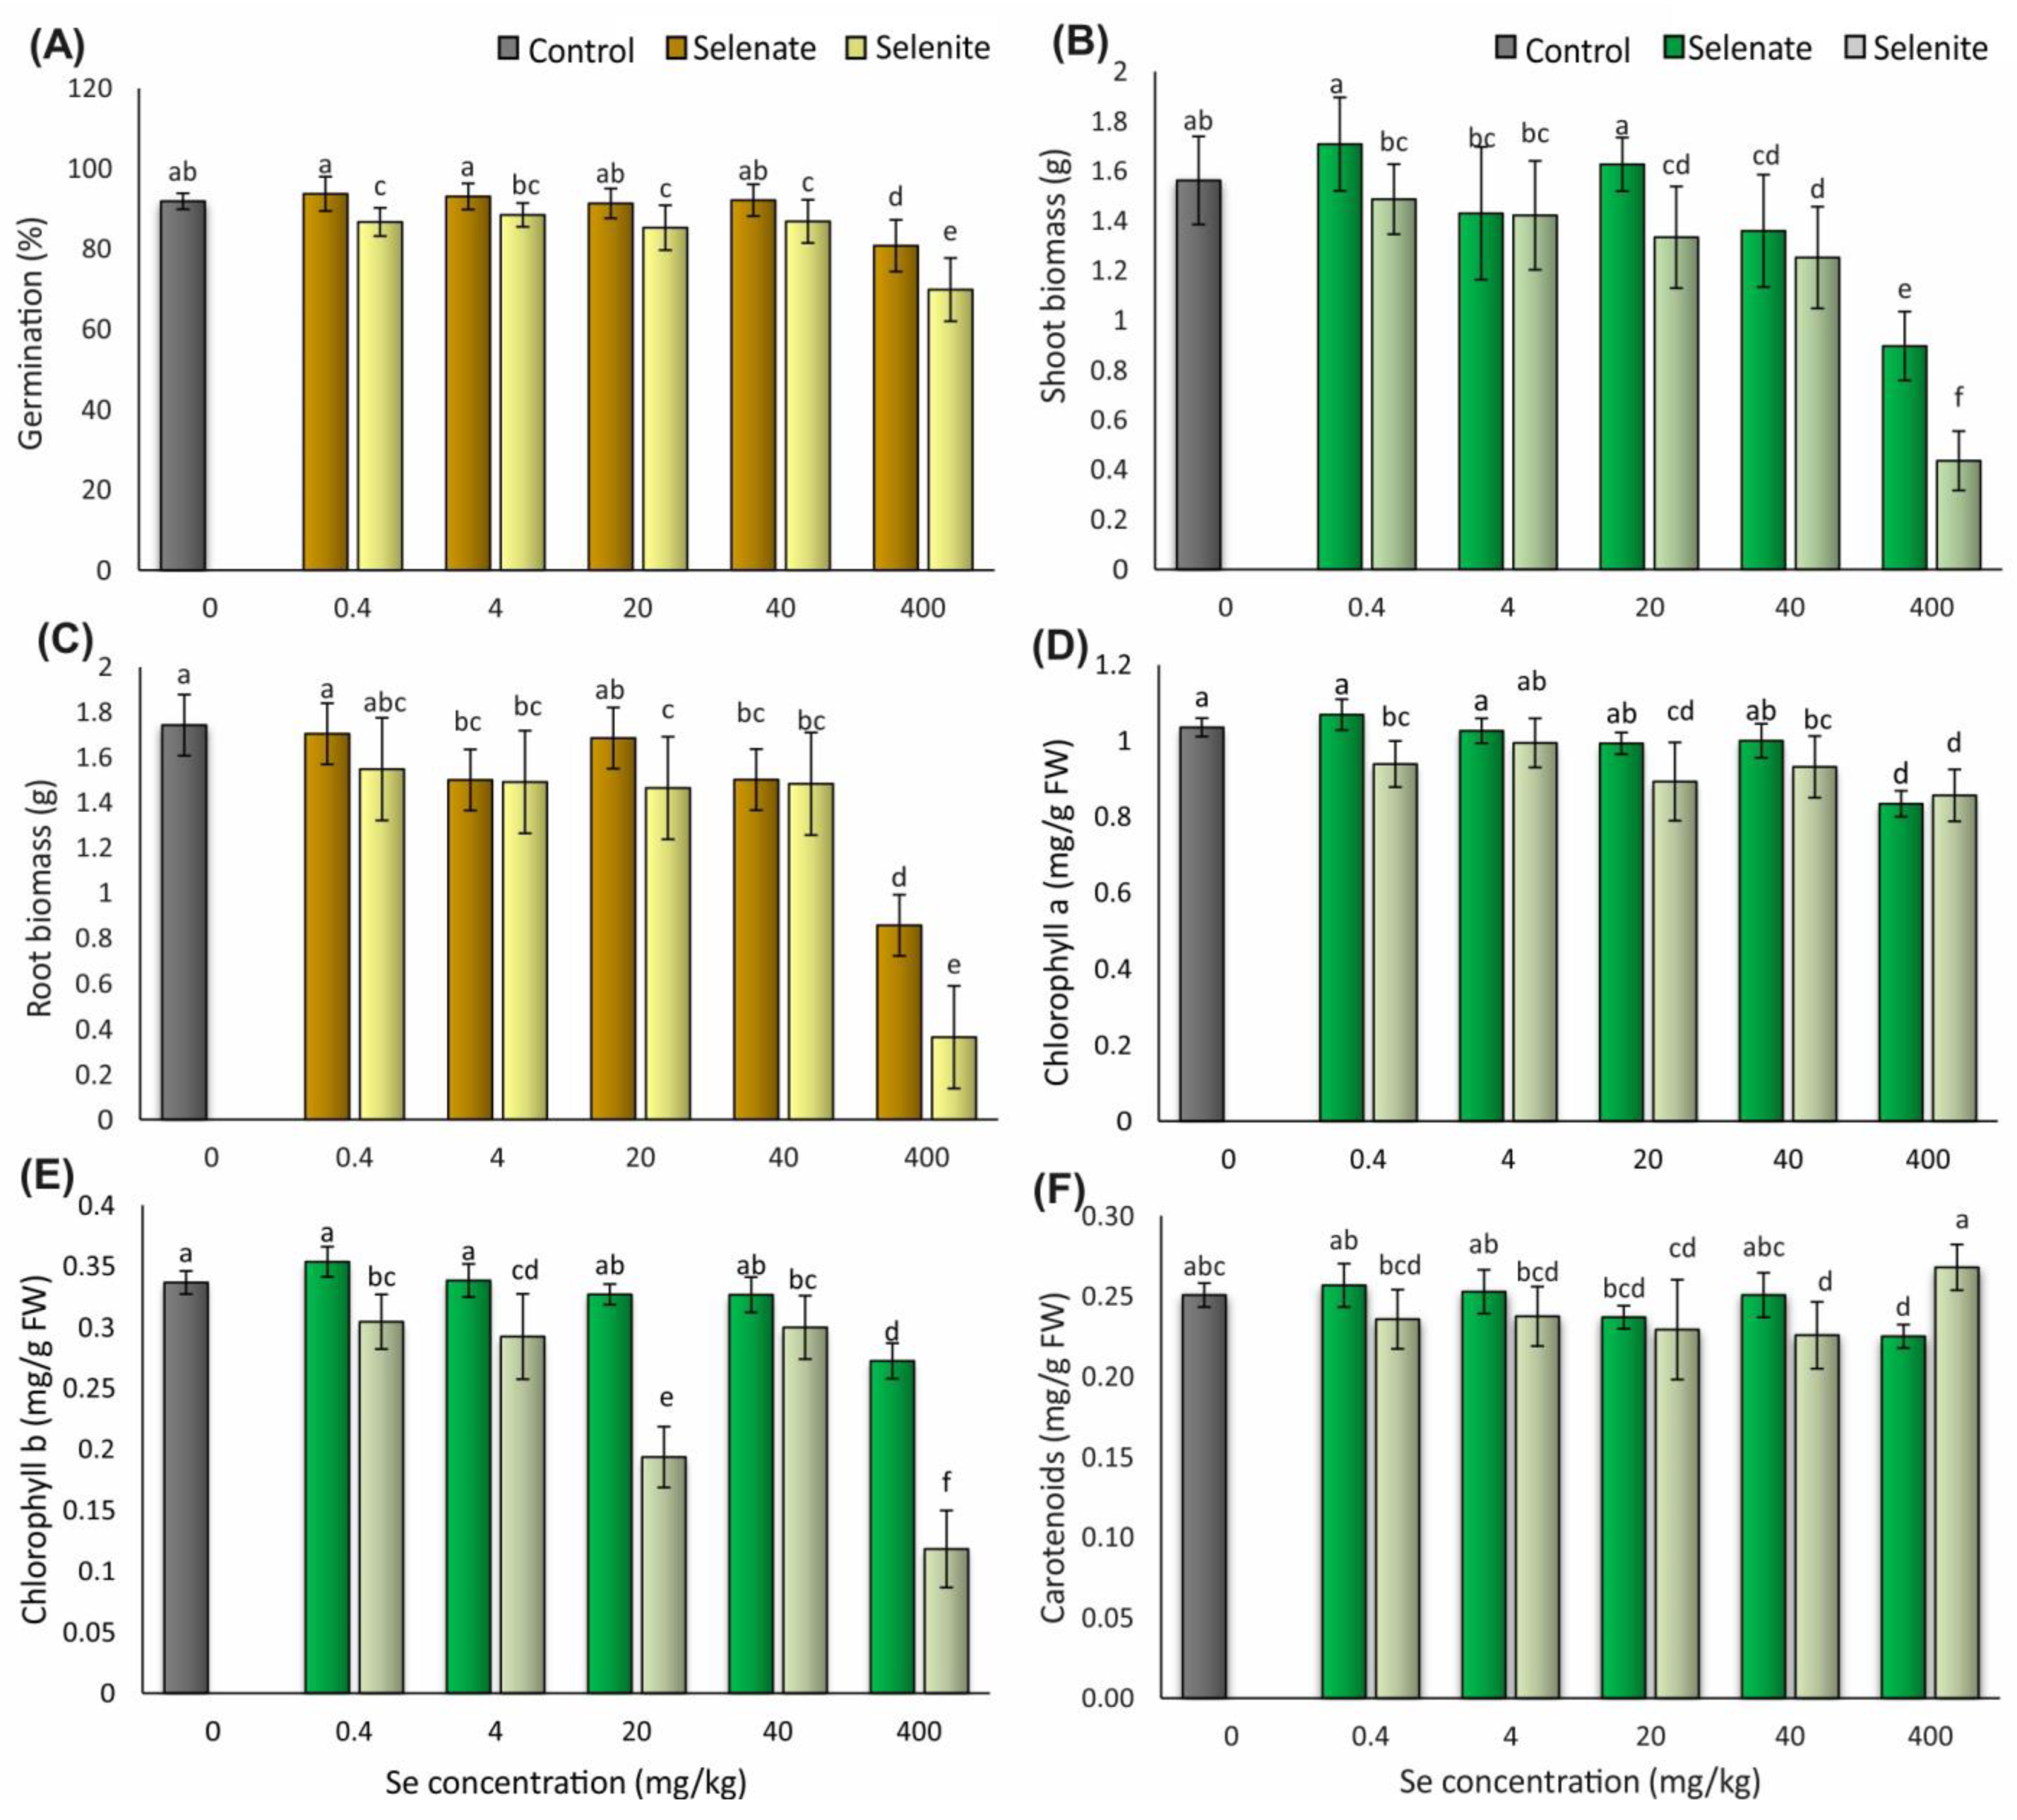
3.2.1. Grain Germination

The presence of Se affected the wheat germination rate, mainly when it was applied as selenite (Figure 3A). Moreover, in most treatments, selenite caused a significant reduction in germination compared to both control and selenate treatments. On the other hand, selenate in most treatments did not affect germination compared to the control. The exception was the highest concentration of selenate (400 mg/kg), which reduced germination by 12%. Although both forms of Se applied in the highest concentrations reduced germination compared to the control, the germination rate was 14% lower in the selenite treatment than in the selenate treatment.

3.2.2. Shoot and Root Biomass

Both applied forms of Se affected shoot and root biomass. Compared to the control, the two highest concentrations of selenate, 40 and 400 mg/kg, decreased shoot biomass by 13% and 43%, respectively (Figure 3B). Selenite applied in three concentrations, 20, 40, and 400 mg/kg, also decreased shoot biomass by 15%, 20%, and 72%, respectively.
The roots responded similarly to Se presence, where 4, 40, and 400 mg/kg of selenate and 4, 20, 40, and 400 mg/kg of selenite also reduced biomass (Figure 3C). Comparing selenate and selenite treatments, shoot biomass was lower after exposure to selenite compared to the same treatments with selenate. Selenite also caused a greater reduction in biomass in roots compared to selenate, after exposure to concentrations of 20 and 400 mg/kg.

3.2.3. Concentrations of Photosynthetic Pigments

Most selenate treatments (0.4, 4, 20, and 40 mg/kg) did not influence the concentration of Chl a and Chl b in wheat seedlings compared to the control, while the highest concentration (400 mg/kg) reduced Chl a by 17% and Chl b by 19% (Figure 3D,E). Unlike selenate, four concentrations of selenite (0.4, 20, 40, and 400 mg/kg) reduced Chl a concentration by 9%, 14%, 10%, and 17%, respectively. Furthermore, all selenite treatments (0.4, 4, 20, 40, and 400 mg/kg) reduced Chl b concentration by 10%, 13%, 43%, 11%, and 65%, respectively. Comparing the influence of the two forms of Se on the chlorophyll content, higher values were recorded in most selenate treatments compared with selenite, especially in Chl b concentration.
Selenate applied in concentrations of 0.4, 4, 20, and 40 mg/kg did not affect carotenoids, while the highest treatment reduced the concentration by 10% compared to the control (Figure 3F). A decrease in the concentration of carotenoids was also recorded due to exposure to selenite in a concentration of 40 mg/kg, where carotenoids were 10% lower compared to the control. Other selenite treatments did not significantly affect carotenoid concentrations.

3.3. Indicators of Oxidative Stress

3.3.1. Lipid Peroxidation Levels in Wheat Shoots and Roots

The oxidative status of wheat seedlings was evaluated by the determination of the LPO level, which was monitored by measuring the content of TBARS. All applied concentrations of both forms of Se significantly decreased TBARS content in the shoots compared to the control (Figure 4A). While selenate reduced LPO levels by 13%, 16%, 23%, 15%, and 16%, respectively, selenite reduced them by 25%, 26%, 36%, 20%, and 10% with increasing applied concentrations.
TBARS content in wheat roots decreased after exposure to the three highest concentrations of selenate (20, 40, and 400 mg/kg) by 23%, 17%, and 16%, respectively, as compared to the control (Figure 4B). Selenite also reduced the amount of TBARS, in four treatments (0.4, 4, 40, and 400 mg/kg) by 27%, 28%, 37%, and 29%, respectively.

3.3.2. The Concentration of H2O2 in Wheat Shoots and Roots

In addition to the LPO level, another indicator of oxidative stress measured in wheat seedlings was the concentration of H2O2. In wheat shoots, Se did not cause a significant change in the H2O2 concentration (Figure 4C).
Similar to the shoots, in roots, Se did not significantly affect the H2O2 concentration in most treatments (Figure 4D). Only treatments with 40 and 400 mg/kg of selenate caused an increase in the H2O2 concentration by 43% and 42%, respectively, compared to the control.

3.4. Antioxidative Enzyme Activities

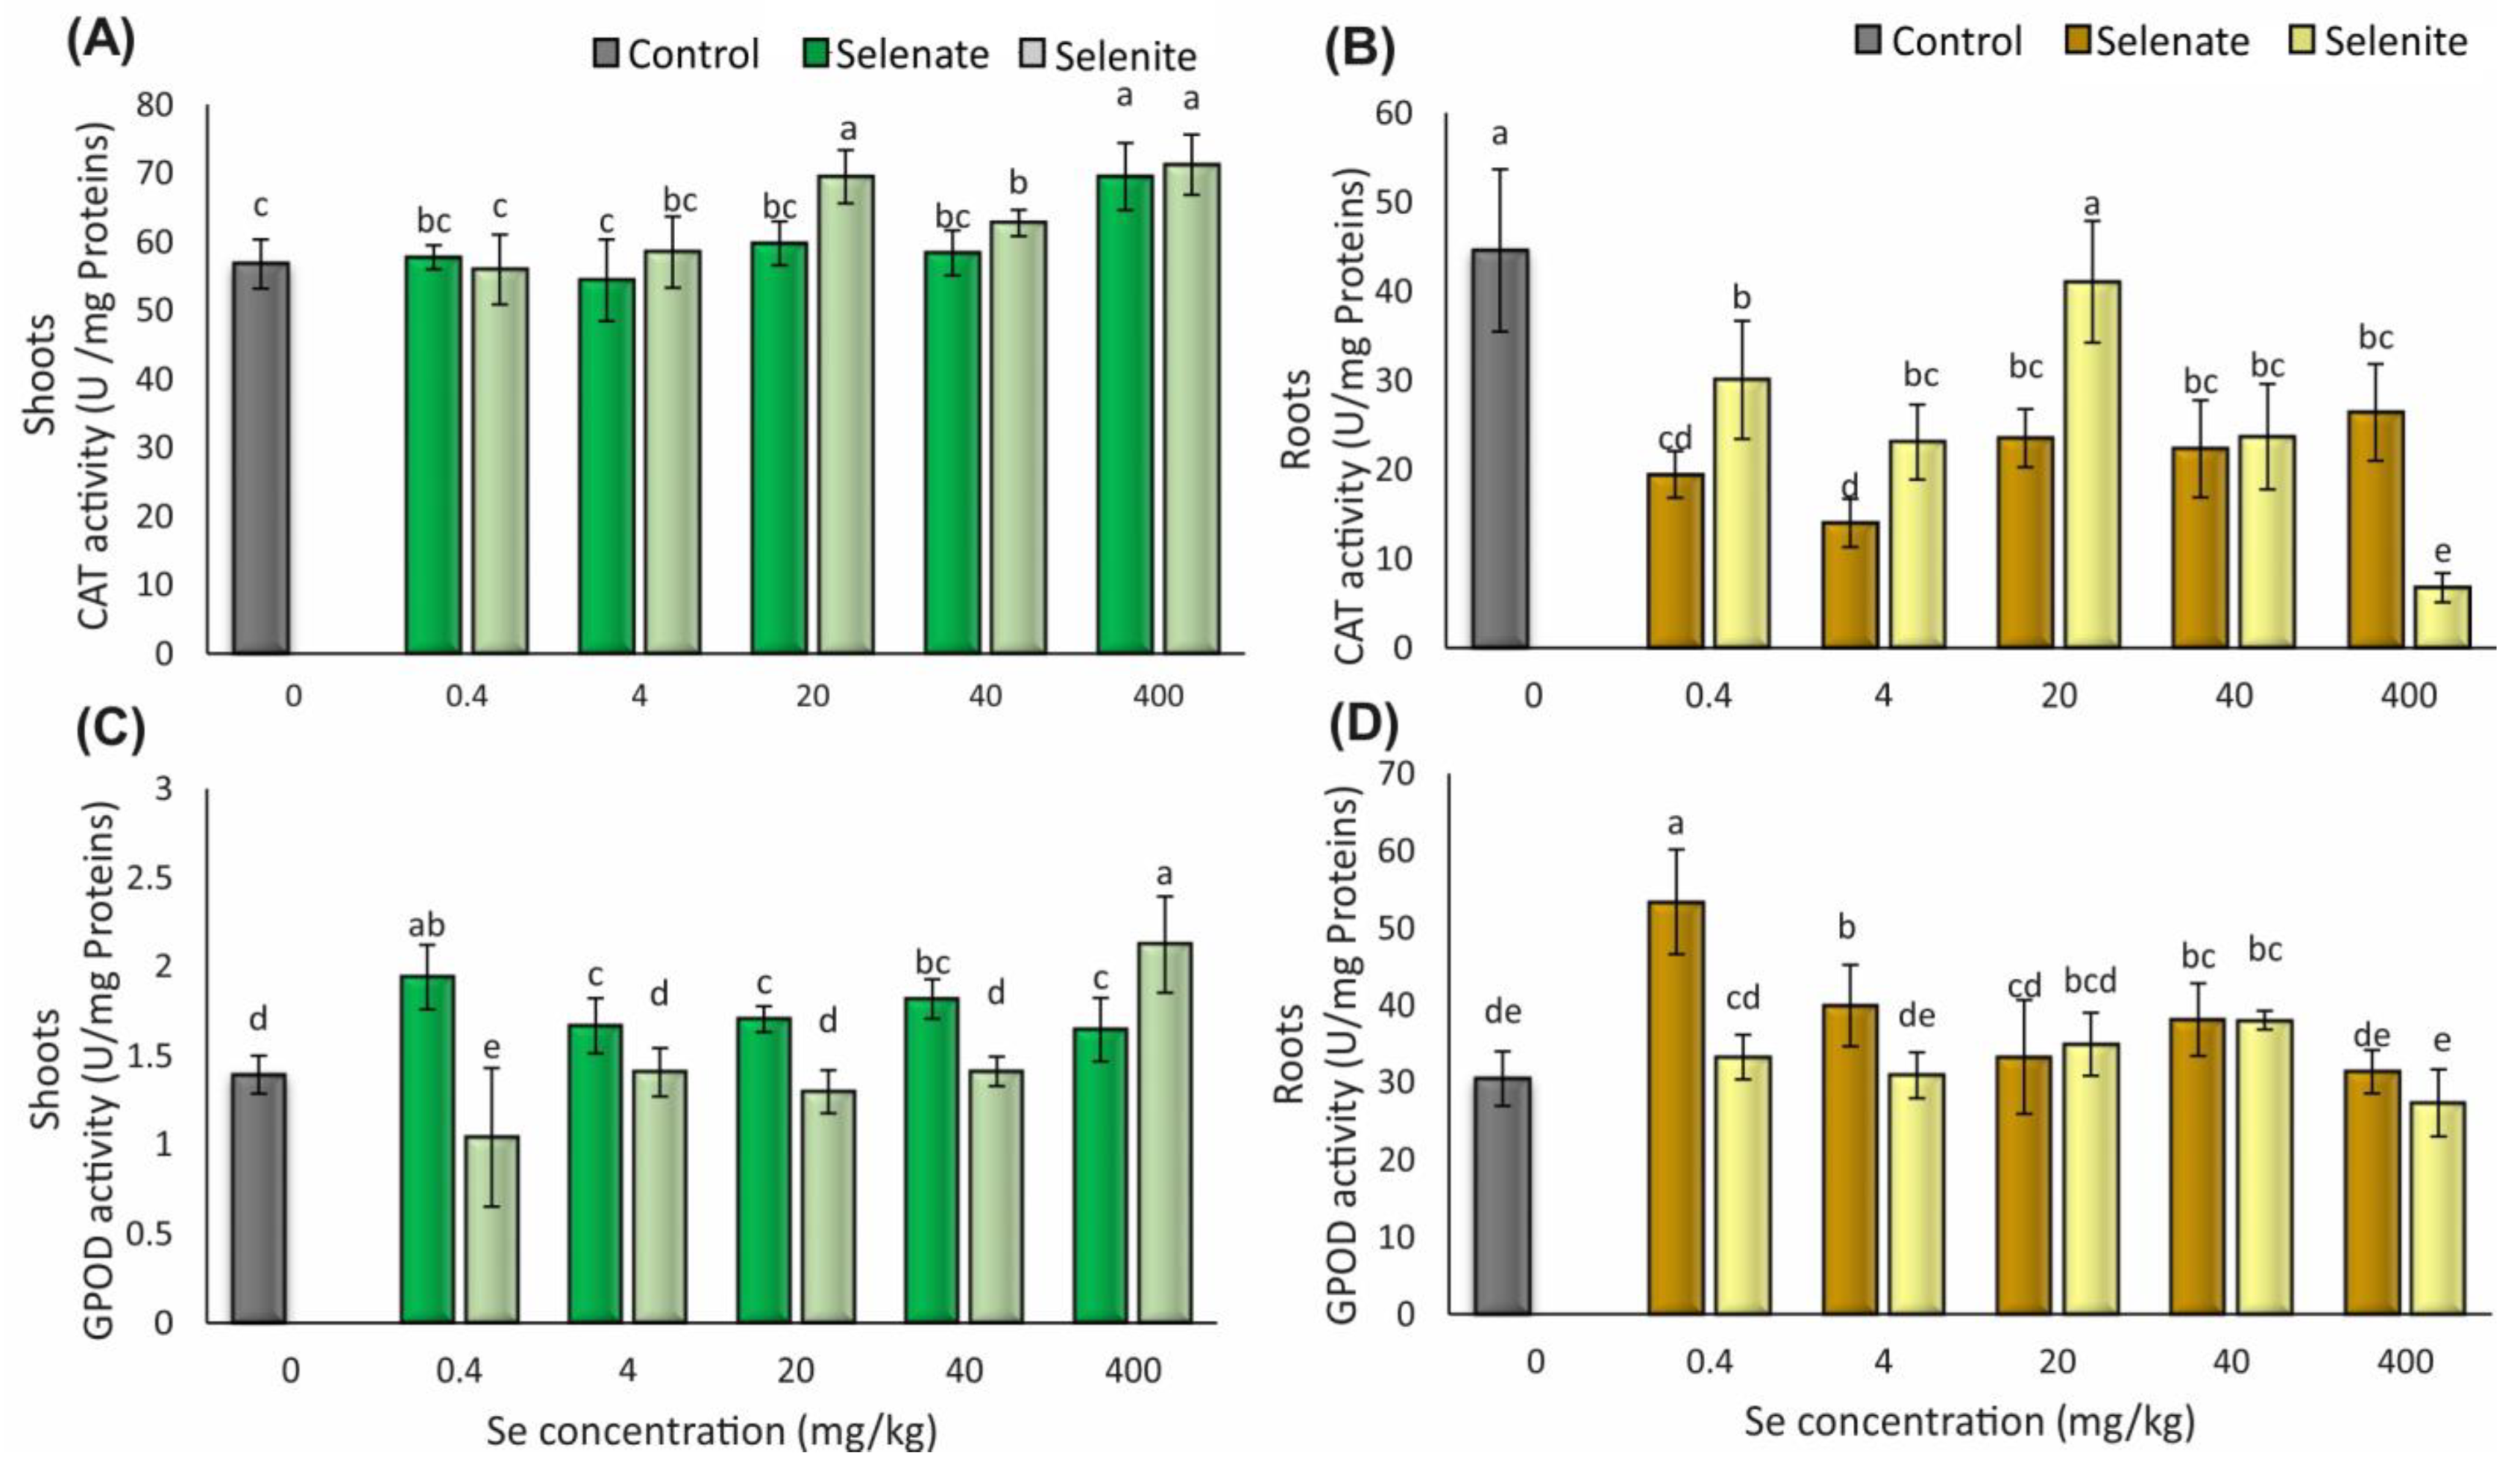
3.4.1. Catalase Activity in Wheat Shoots and Roots

The specific CAT activity in the wheat shoots and roots is shown in Figure 5. In shoots, CAT activity was unchanged at most of the applied selenate concentrations, except for the highest (400 mg/kg), which increased its activity by 18%, compared to the control (Figure 5A). On the other hand, selenite applied in the three largest concentrations (20, 40, and 400 mg/kg) increased the activity compared to the control by 18%, 10%, and 20%, respectively.
The CAT activity in roots greatly differed from shoots. All treatments, except 20 mg/kg of selenite, caused a statistically significant decrease in specific CAT activity compared to the control (Figure 5B). Thus, selenate decreased the activity by 56%, 69%, 47%, 50%, and 41% as the applied concentrations increased. After exposure to four concentrations of selenite (0.4, 4, 40, and 400 mg/kg), the activity decreased by 33%, 48%, 47%, and 85%.

3.4.2. Guaiacol Peroxidase Activity in Wheat Shoots and Roots

The specific activity of GPOD in wheat shoots increased due to all selenate treatments compared to the control (Figure 5C). The increase in the concentration of selenate (0.4, 4, 20, 40, and 400 mg/kg) was followed by increased GPOD activities by 28%, 16%, 18%, 23%, and 15%, respectively. Compared to the control, the lowest concentration of selenite (0.4 mg/kg) reduced GPOD activity by 25%, 4, 20, and 40 mg/kg of selenite had no effect; and the highest applied concentration increased the activity by 34%.
Selenate treatment also increased GPOD activity in roots, but only in three applied concentrations, 0.4, 4, and 40 mg/kg, by 43%, 24%, and 20%, respectively (Figure 5D). Other concentrations (20 and 400 mg/kg), like most selenite treatments (0.4, 4, 20, and 400 mg/kg), did not affect GPOD activity compared to the control. Regarding selenite, only 40 mg/kg of selenite affected the GPOD activity in the roots, and it was 20% higher than in the control.

4. Discussion

4.1. Se Effect on Its Accumulation in Wheat

Se uptake, distribution, and effect in wheat depend on the growth stage [43] and the form and concentration of applied Se. In this research, the increase in applied concentrations of selenate and selenite caused a linear increase in Se concentration in shoots and roots (Figure 2A,B), which correlates with the results of previous studies [12,18,56,57]. Although there was a linear increase in Se concentration in all treatments, when treated with selenite, 2-fold to 10-fold lower Se concentrations were found in the shoots compared to Se concentrations after selenate treatments. After uptake via sulfate transporters in the roots [58], selenate is translocated through the xylem to the chloroplast, where it begins its reduction to selenite. In contrast, selenite is taken up by passive diffusion [59], via phosphate [22] or silicon transporters [23], after which it is reduced and converted to organic Se forms, which causes less mobility to the shoots [58]. Li et al. [58] detected selenite and organic forms such as MeSeCys in the root extracts and xylem sap from selenite-treated plants. Differences in Se accumulation were determined by Kaur and Sharma [60] in wheat leaves, whereby after exposure to selenate, up to 60-fold higher concentrations of Se were obtained compared with selenite, and they concluded that selenate is a more mobile form. It is important to emphasize that, in our experiment, selenate caused a more significant increase in Se concentration in the shoots than in the roots, except after the application of the highest concentration, where selenate was less translocated into the shoots. Namely, in the treatments with lower selenate concentrations up to 72% of the total uptake Se was translocated to the shoots. In contrast, at the highest concentration of selenate, only 35% was translocated. It can be due to a lack or dysfunction of sulfate transporters. This is supported by the research of Boldrin et al. [61], who found a decrease in Sultr1 gene expression in several wheat varieties after treatment with 13 µM of sodium selenate.

4.2. Se Effect on Wheat Morpho-Physiological Characteristics

Selenium can influence numerous plant morpho-physiological characteristics, and its response depends primarily on its concentration. Although it is recorded that lower Se concentrations can have a positive effect on germination and the physiological quality of seeds [27,62,63], it has also been reported that the application of lower concentrations has no significant impact on germination [64,65], as in our study after exposure to lower concentrations of selenate (0.4, 4, 20, and 40 mg/kg) (Figure 3A). On the contrary, lower concentrations of selenite (0.4, 20, and 40 mg/kg) inhibited seed germination, leading to the conclusion that germination mainly depends on the chemical form of applied Se and that lower concentrations of selenite are more toxic than selenate. The highest concentrations of selenate and selenite caused the greatest inhibition of seed germination compared to the control, emphasizing that the lowest germination was recorded at the highest concentration of selenite. Accordingly, numerous previous studies have established that germination is most often inhibited by increased concentrations of Se [27,65,66,67]. Lapaz et al. [65] investigated the influence of eleven different Se concentrations ranging from 0.1 to 800 mg/L on germination and other morphological characteristics of the Vigna ungiculata species. They found that only the highest concentration of Se inhibited germination, while the others did not affect it. El Mehdawi et al. [66] noted that Arabidopsis thaliana germination rate decreased at concentrations of Se that are higher than 5 mg/kg DW, while 50% of inhibition was recorded at 10 mg/kg DW, i.e., 125 µM of Na2SeO4. The inhibitory effect of Se on wheat seeds may be related to enzyme inhibition, which hydrolyzes metabolites necessary for the development of the plant embryo, as concluded in research by Sreekala and Lalitha [68]. They determined that 0.5 ppm of Na2SO3 increased β-galactosidase and β-glucosidase activities in Trigonella foenumgraecum species, but concentrations above 1 ppm drastically reduced their activities, which also reduced germination.
In addition to wheat germination rate, treatments with different concentrations of Se affect growth and seedling biomass. Seed germination and biomass are related because lower germination can reduce the total biomass, as shown by the results of this research. Although numerous studies have established a positive influence of lower concentrations of Se on wheat growth and biomass [69,70,71,72], this research showed that lower concentrations did not significantly affect the shoot and root biomass. On the contrary, higher concentrations of both forms of Se significantly reduced biomass, where the greatest decline was recorded in treatments with 400 mg/kg of Se (Figure 3B,C). The influence of higher concentrations of Se on biomass reduction has been recorded in numerous plant species, including Lactuca sativa L. [18,73], Sinapis alba L. [74], Oryza sativa [30], T. aestivum L. [75,76], Zea mays L. [77] and Brassica napus L. [28]. Cartes et al. [78] investigated the influence of selenate and selenite (0.1, 0.25, 0.50, 0.75, 1, 1.5, 2, 4, 6, 8, and 10 mg/kg) on the dry biomass of 55-day-old Lolium perenne shoots. They defined that only selenate causes a decrease in biomass when the concentration of Se in shoots exceeds 150 mg/kg. Lapaz et al. [65] determined a reduction in the fresh biomass of shoots and roots of V. ungiculata after exposure to 40 mg/kg of selenate or more, which correlates with the results of this study. It is important to emphasize that selenite at lower concentrations compared to selenate decreased both shoot and root biomass, indicating a lower toxicity threshold for selenite in wheat seedlings. As the toxicity threshold can be defined as the lowest concentration of Se that causes a significant reduction in the biomass compared to the control, in the shoots and roots of wheat seedlings, the threshold toxicity for selenate was 40 mg/kg. In comparison, for selenite seedlings, the threshold toxicity in the shoots was 20 mg/kg, and in the roots was 4 mg/kg. These results indicate a more toxic effect of selenite on wheat biomass when compared to selenate, where this effect is more pronounced in the roots. The results of this research are correlated with the results of research conducted by Hawrylak-Nowak et al. [29], who noted a reduction in the biomass of shoots and roots of Cucumis sativus L. at 80 µM of selenate and 20 µM of selenite, but also with the results of other studies that concluded that selenite is a more toxic form than selenate [36,73,79]. Tian et al. [80] emphasized that higher Se toxicity was associated with low S levels, during which the proportion of Se in proteins increases compared to S. From previous studies [80,81,82,83,84,85], it is evident that there was less S uptake in selenite treatments, which can cause and explain the higher selenite toxicity in wheat seedlings. In addition to the mentioned mechanism, Se toxicity can be associated with a reduced concentration of photosynthetic pigments and increased oxidative damage, such as increased LPO [30,86].
Although previous studies highlighted the positive influence of lower Se concentrations on the concentration of chlorophyll and carotenoids [87,88], in this study, lower Se concentrations did not significantly affect the content of photosynthetic pigments (Chl a and carotenoids) in wheat seedlings. Haghighi et al. [89] also concluded that Se did not affect chlorophyll concentration in Cucumis sativus L. after exposure to 2, 4, and 6 mg/L of selenite. Moreover, in our study, chlorophyll concentration significantly decreased due to exposure to the highest concentration of selenate, while selenite caused a decrease at a concentration of 0.4 mg/kg. It should be emphasized that selenite had a much more negative effect on Chl b than on Chl a. Together with the germination and biomass reduction, these results confirm the higher toxicity of selenite compared to selenate. High Se concentrations can impair the uptake and content of micro and macronutrients, which can be reflected in photosynthesis [28,29]. This especially applies to nutrients such as Fe and Mg, which are essential components of chlorophyll and Fe-S proteins or participate in their synthesis [90]. Additionally, Se can interfere with enzymes that contain a sulfhydryl group in the active site, such as porphobilinogen synthase, which is involved in chlorophyll biosynthesis [91].
Reducing the chlorophyll concentration in wheat seedlings can cause a decrease in the light energy absorption that will be converted into chemical energy, which can result in reduced production of starch and reduced biomass [42]. Ulhassan et al. [28] also found that in several cultivars of B. napus L. treated with 100 µM selenite, higher concentrations of Se minimize the amount of total soluble sugars, which affects biomass reduction.

4.3. Se Effect on Wheat Oxidative Status and Antioxidative Response

The effect of Se on plants, which is visible at the morpho-physiological or biochemical level, is mediated by redox state changes, the formation of ROS, and the activation of antioxidative mechanisms. Our results showed that Se application had no impact on cellular H2O2 content in shoots, while root H2O2 content was affected only by the two highest concentrations of selenate (Figure 4C,D). The TBARS results show that the increase in H2O2 did not cause negative consequences in the wheat roots, contributing to its role in cell signaling. The LPO level is one of the most important biomarkers of oxidative stress that can determine the degree of oxidative damage in cells. It is known that lower Se concentrations can reduce LPO levels, while higher concentrations have a negative effect and increase peroxidation [18,38]. In addition, Se can protect various plant species from abiotic stress-mediated oxidative damage, as seen through a reduction in LPO followed by enhanced regulation of detoxification defense systems [92,93,94]. Both applied forms of Se reduced LPO levels in all treatments in wheat shoots (Figure 4A). The reduction was also recorded in the roots after exposure to selenite and the two highest concentrations of selenate (Figure 4B). Se ions are assumed to protect membranes and play a key role in reducing LPO levels. Filek et al. [95] investigated wheat plastid membrane properties and concluded that Se ions can induce changes in fatty acid composition by increasing its unsaturation. They connected those changes with decreased LPO levels and concluded that Se ions can protect cell membranes from oxidative damage. Many studies involving lipid monolayer research confirm that Se ions can bind to specific membrane domains and thus affect their properties [96,97,98]. In addition, an active antioxidative defense system contributes to maintaining low LPO levels.
Hydrogen peroxide can be directly or indirectly converted to O2 and H2O by several enzymes, such as CAT and GPOD, and thus prevent its accumulation and negative consequences. The increased activities of these enzymes in the shoots and roots kept the concentration of H2O2 unchanged in most treatments. CAT is an enzyme with a low affinity for H2O2 and is active at very high concentrations of H2O2 [99], while lower concentrations of H2O2 are removed by enzymes such as GPOD [100]. Unchanged CAT activity in wheat shoots due to exposure to the four lowest concentrations of selenate and lower concentrations of selenite may be related to the lower concentrations of H2O2 produced preferentially removed by other enzymes. As in this research, Lara et al. [12] also observed an unchanged amount of H2O2 and CAT activity in wheat after treatments with 0, 12, 21, 38, 68, and 120 g/ha of Na2SeO4. On the other hand, the increased activity of CAT in the shoots after exposure to higher concentrations of Se is a critical H2O2 detoxification mechanism. This is supported by the research of Kaur and Sharma [60], which determined the presence of several new CAT isoenzymes in the wheat leaf after exposure to higher doses of selenate and selenite. Silva et al. [101] noticed that both selenate and selenite increased CAT activity in leaves of Vigna unguiculata (L.) Walp., but not equally in all treatments. While selenate increased CAT activities only at higher applied concentrations (20, 40, and 60 g/ha), selenite increased CAT activities in all treatments (2.5, 5, 10, 20, 40, and 60 g/ha) [101]. Similarly, in this research, selenite in wheat shoots increased CAT activity in most treatments, while the increase due to exposure to selenate was recorded only at the highest concentration (Figure 5A). In addition, the results of this study showed that CAT activity is also tissue specific. Contrary to the CAT activity in shoots, where it was increased or unchanged, Se inhibited its activity in roots (Figure 5B). Chioti and Zervoudakis [102] reported differences in CAT sensitivity between shoots and roots of different plant species. Concerning sensitivity to the inhibitor, they concluded that CAT is monofunctional in the shoots of the investigated species, while in the roots, it is a bifunctional enzyme. Monofunctional CAT has a common action that converts H2O2 into H2O and O2 in two steps, while bifunctional, in addition to the usual CAT activity, also exhibits peroxidase activity with an electron donor present [103]. The different response of CAT between shoots and roots is also discussed in the research conducted by Gayatridevi et al. [104]. After exposure to salicylic acid and Fusarium sp., they observed a different number of CAT isoforms in shoots and roots in different genotypes of Cicer arientum L. In addition, they determined a significant difference between shoots and roots in sensitivity to salicylic acid, as well as the activities of individual isoforms were completely inhibited by individual treatment.
In addition to CAT, an important role in H2O2 detoxification is also played by the enzyme GPOD, which is activated at much lower concentrations of H2O2 compared to CAT [105]. Numerous previous studies have established that CAT and GPOD react similarly to Se, and an increase in the activity of one enzyme is often accompanied by an increase in the activity of the other, regardless of the form of applied Se [41,62,87,106,107]. However, in wheat seedlings, we found different results. While selenate increased GPOD activity in the shoots and partly in the roots, in most treatments, selenite did not change it (Figure 5C,D). Different ways of selenate and selenite uptake, translocation, and assimilation in plants may be the cause of ROS production in different cellular compartments. So, different detoxification mechanisms are activated depending on the location of ROS accumulation. In wheat, GPOD was found in the cytosol, cell wall, and vacuole [108]. Given the localization of GPOD in cells, active transport of selenate could result in the formation of H2O2 in the cell wall but also in the vacuole, where selenate can be accumulated [109]. At the same selenate treatments, CAT activities were unchanged or significantly reduced, and the opposite response of CAT and GPOD activity was also recorded in the research of Saidi et al. [110]. They determined that pretreatments with 5 and 10 µM of selenate reduced GPOD activity and increased CAT activity in Helianthus anuus leaves exposed to Cd. Furthermore, Jóźwiak and Politycka [40] noticed an increase in GPOD activity and a decrease in CAT activity in the roots of Cucumis sativus L. after treatment with 5 and 10 µM of selenite. As the concentration of H2O2 in cucumber roots did not change, they concluded that GPOD was responsible for maintaining its low concentrations. Therefore, the GPOD activity would be one of the key H2O2 detoxification mechanisms in wheat after exposure to selenate in shoots and to lower selenate concentrations also in the roots.

5. Conclusions

Wheat responses to different chemical forms of Se were monitored at the morpho-physiological and biochemical levels. Morpho-physiological analyses such as seed germination, shoot and root biomass, and chlorophyll and carotenoid concentrations revealed that selenite has a lower toxicity threshold than selenate. Measurement of oxidative stress indicators, LPO and H2O2, showed that Se did not cause oxidative stress in wheat seedlings. Thus, the removal of H2O2 from the shoots and roots was performed by different mechanisms depending on the chemical form and concentration of the applied Se. H2O2 originated from selenate treatment that primarily removes GPOD both in shoots and roots. Shoot H2O2 originated from selenite treatment that primarily removes CAT, which is evident from the increased activities in most treatments.
This research contributes to a better understanding of wheat seedlings’ biochemical and morpho-physiological responses to Se. It also contributes to the development of new insights into the mechanisms of toxicity depending on concentration, chemical form, and type of plant organ. Treatment with 20 mg/kg of selenate can be recommended for wheat seedling biofortification due to a sufficient increase in Se accumulation in shoots without signs of toxicity. The insight into the biochemical mechanisms of Se tolerance obtained by this research contributes to the development of more effective biofortification strategies.

Author Contributions

Conceptualization, A.V.P., I.Š.Č. and R.V.; methodology, A.V.P. and R.V.; formal analysis, A.V.P., D.K.G. and M.M.; investigation, A.V.P., M.M. and Z.L.; resources, Z.L., R.V. and I.Š.Č.; writing—original draft preparation, A.V.P.; writing—review and editing, A.V.P., I.Š.Č., R.V. and D.K.G.; visualization, A.V.P.; supervision, I.Š.Č., R.V. and Z.L.; project administration, R.V. and I.Š.Č.; funding acquisition, R.V. and I.Š.Č. All authors have read and agreed to the published version of the manuscript.

Funding

The paper is the result of research within the institutional projects “Effect of selenium on glutathione metabolism and ascorbate-glutathione cycle in wheat seedlings-biochemical and molecular response” (Department of Biology, University in Osijek, 3105-8-22) and “Nutritional value of wheat seedlings biofortified with selenium”(Department of Biology, University in Osijek, 3105-27).

Institutional Review Board Statement

Not applicable.

Data Availability Statement

The data presented in the current work are available.

Conflicts of Interest

The authors declare no conflict of interest.

References

  1. Jones, G.D.; Droz, B.; Greve, P.; Gottschalk, P.; Poffet, D.; McGrath, S.P.; Seneviratne, S.I.; Smith, P.; Winkel, L.H.E. Selenium deficiency risk predicted to increase under future climate change. Proc. Natl. Acad. Sci. USA 2017, 114, 2848–2853. [Google Scholar] [CrossRef] [PubMed]
  2. El-Ramady, H.; Abdalla, N.; Alshaal, T.; Sztrik, A.; Elhawat, N.; El-Marsafawy, S.; Shams, M.S. Selenium in soils under climate change, implication for human health. Environ. Chem. Lett. 2015, 13, 1–19. [Google Scholar] [CrossRef]
  3. Li, W.; Shi, Y.; Zhu, D.; Wang, W.; Liu, H.; Li, J.; Shi, N.; Ma, L.; Fu, S. Fine root biomass and morphology in a temperate forest are influenced more by the nitrogen treatment approach than the rate. Ecol. Indic. 2021, 130, 108031. [Google Scholar] [CrossRef]
  4. Zhang, G.; Zhao, Z.; Yin, X.A.; Zhu, Y. Impacts of biochars on bacterial community shifts and biodegradation of antibiotics in an agricultural soil during short-term incubation. Sci. Total Environ. 2021, 771, 144751. [Google Scholar] [CrossRef] [PubMed]
  5. Izydorczyk, G.; Ligas, B.; Mikula, K.; Witek-Krowiak, A.; Moustakas, K.; Chojnacka, K. Biofortification of edible plants with selenium and iodine—A systematic literature review. Sci. Total Environ. 2021, 754, 141983. [Google Scholar] [CrossRef]
  6. Arshad, M.A.; Ebeid, H.M.; Hassan, F.U. Revisiting the Effects of Different Dietary Sources of Selenium on the Health and Performance of Dairy Animals: A Review. Biol. Trace Elem. Res. 2021, 199, 3319–3337. [Google Scholar] [CrossRef]
  7. Pecoraro, B.M.; Leal, D.F.; Frias-De-Diego, A.; Browning, M.; Odle, J.; Crisci, E. The health benefits of selenium in food animals: A review. J. Anim. Sci. Biotechnol. 2022, 13, 58. [Google Scholar] [CrossRef] [PubMed]
  8. Dumont, E.; Vanhaecke, F.; Cornelis, R. Selenium speciation from food source to metabolites: A critical review. Anal. Bioanal. Chem. 2006, 385, 1304–1323. [Google Scholar] [CrossRef] [PubMed]
  9. Yang, X.; Xiaoli, L.; Li, Y.; Shen, R.; Qiangwen, C.; Zhenzhou, Z.; Xin, C.; Weiwei, Z.; Jibao, Y.; Shuiyuan, C.; et al. Combined metabolome and transcriptome analysis reveal the mechanism of selenate influence on the growth and quality of cabbage (Brassica oleracea var. capitata L.). Food Res. Int. 2022, 156, 111135. [Google Scholar]
  10. Chen, L.; Yang, F.; Xu, J.; Hu, Y.; Hu, Q.; Zhang, Y.; Pan, G. Determination of selenium concentration of rice in China and effect of fertilization of selenite and selenate on selenium content of rice. J. Agric. Food Chem. 2002, 50, 5128–5130. [Google Scholar] [CrossRef] [PubMed]
  11. Khan, M.K.; Pandey, A.; Akkaya, M.S.; Gezgin, S.; Hamurcu, M.; Hakki, E.E. Wheat biofortification—A potential key to human malnutrition. J. Elem. 2017, 22, 937–944. [Google Scholar] [CrossRef]
  12. Lara, T.S.; Lessa, J.H.D.L.; de Souza, K.R.D.; Corguinha, A.P.B.; Martins, F.A.D.; Lopes, G.; Guilherme, L.R.G. Selenium biofortification of wheat grain via foliar application and its effect on plant metabolism. J. Food Compos. Anal. 2019, 81, 10–18. [Google Scholar] [CrossRef]
  13. Galinha, C.; Sánchez-Martínez, M.; Pacheco, A.M.G.; Freitas, M.D.C.; Coutinho, J.; Maçãs, B.; Almeida, A.S.; Pérez-Corona, M.T.; Madrid, Y.; Wolterbeek, H.T. Characterization of selenium-enriched wheat by agronomic biofortification. J. Food Sci. Technol. 2014, 52, 4236–4245. [Google Scholar] [CrossRef] [PubMed]
  14. Broadley, M.R.; Alcock, J.; Alford, J.; Cartwright, P.; Foot, I.; Fairweather-Tait, S.J.; Hart, D.J.; Hurst, R.; Knott, P.; McGrath, S.P.; et al. Selenium biofortification of high-yielding winter wheat (Triticum aestivum L.) by liquid or granular Se fertilisation. Plant Soil 2010, 332, 5–18. [Google Scholar] [CrossRef]
  15. Chilimba, A.D.C.; Young, S.D.; Black, C.R.; Meacham, M.C.; Lammel, J.; Broadley, M.R. Agronomic biofortification of maize with selenium (Se) in Malawi. Field Crops Res. 2012, 125, 118–128. [Google Scholar] [CrossRef]
  16. De Lima Lessa, J.H.; Araujo, A.M.; Ferreira, L.A.; da Silva Júnior, E.C.; de Oliveira, C.; Corguinha, A.P.B.; Martins, F.A.D.; de Carvalho, H.W.P.; Guilherme, L.R.G.; Lopes, G. Agronomic biofortification of rice (Oryza sativa L.) with selenium and its effect on element distributions in biofortified grains. Plant Soil 2019, 444, 331–342. [Google Scholar] [CrossRef]
  17. Štolfa, I.; Velki, M.; Vuković, R.; Ečimović, S.; Katanić, Z.; Lončarić, Z. Effect of different forms of selenium on the plant-soil-earthworm system. J. Plant Nutr. Soil Sci. 2017, 180, 231–240. [Google Scholar] [CrossRef]
  18. Ramos, S.J.; Faquin, V.; Guilherme, L.R.G.; Castro, E.M.; Ávila, F.W.; Carvalho, G.S.; Bastos, C.E.A.; Oliveira, C. Selenium biofortification and antioxidant activity in lettuce plants fed with selenate and selenite. Plant Soil Environ. 2010, 56, 584–588. [Google Scholar] [CrossRef]
  19. Ximénez-Embún, P.; Alonso, I.; Madrid-Albarrán, Y.; Cámara, C. Establishment of Selenium Uptake and Species Distribution in Lupine, Indian Mustard, and Sunflower Plants. J. Agric. Food Chem. 2004, 52, 832–838. [Google Scholar] [CrossRef]
  20. Cabannes, E.; Buchner, P.; Hawkesford, M.J. Identification and Sequence Analysis of Sulfate/Selenate Transporters in Selenium Hyper- and Non-accumulating Astragalus Plant Species. In Sulfur Metabolism in Plants; De Kok, L.J., Tabe, L., Tausz, M., Hawkesford, M., Hoefgen, R., McManus, M., Schnug, E., Eds.; Springer: Dordrecht, The Netherlands, 2012; pp. 155–162. [Google Scholar] [CrossRef]
  21. Schiavon, M.; Pilon, M.; Malagoli, M.; Pilon-Smits, E.A.H. Exploring the importance of sulfate transporters and ATP sulphurylases for selenium hyperaccumulation—A comparison of Stanleya pinnata and Brassica juncea (Brassicaceae). Front. Plant Sci. 2015, 6, 2. [Google Scholar] [CrossRef] [PubMed]
  22. Zhang, L.; Hu, B.; Li, W.; Che, R.; Deng, K.; Li, H.; Yu, F.; Ling, H.; Li, Y.; Chu, C. OsPT2, a phosphate transporter, is involved in the active uptake of selenite in rice. New Phytol. 2014, 201, 1183–1191. [Google Scholar] [CrossRef] [PubMed]
  23. Zhao, X.Q.; Mitani, N.; Yamaji, N.; Shen, R.F.; Ma, J.F. Involvement of silicon influx transporter OsNIP2;1 in selenite uptake in rice. Plant Physiol. 2010, 153, 1871–1877. [Google Scholar] [CrossRef] [PubMed]
  24. Brown, T.A.; Shrift, A. Exclusion of Selenium from Proteins of Selenium-Tolerant Astragalus Species. Plant Physiol. 1981, 67, 1051–1053. [Google Scholar] [CrossRef]
  25. Terry, N.; Zayed, A.M.; De Souza, M.P.; Tarun, A. Selenium in higher plants. Annu. Rev. Plant Physiol. Plant Mol. Biol. 2000, 51, 401–432. [Google Scholar] [CrossRef]
  26. Mostofa, M.G.; Hossain, M.A.; Siddiqui, M.N.; Fujita, M.; Tran, L.S.P. Phenotypical, physiological and biochemical analyses provide insight into selenium-induced phytotoxicity in rice plants. Chemosphere 2017, 178, 212–223. [Google Scholar] [CrossRef] [PubMed]
  27. Du, B.; Luo, H.; He, L.; Zhang, L.; Liu, Y.; Mo, Z.; Pan, S.; Tian, H.; Duan, M.; Tang, X. Rice seed priming with sodium selenate: Effects on germination, seedling growth, and biochemical attributes. Sci. Rep. 2019, 9, 4311. [Google Scholar] [CrossRef] [PubMed]
  28. Ulhassan, Z.; Gill, R.A.; Ali, S.; Mwamba, T.M.; Ali, B.; Wang, J.; Huang, Q.; Aziz, R.; Zhou, W. Dual behavior of selenium: Insights into physio-biochemical, anatomical and molecular analyses of four Brassica napus cultivars. Chemosphere 2019, 225, 329–341. [Google Scholar] [CrossRef] [PubMed]
  29. Hawrylak-Nowak, B.; Matraszek, R.; Pogorzelec, M. The dual effects of two inorganic selenium forms on the growth, selected physiological parameters and macronutrients accumulation in cucumber plants. Acta Physiol. Plant. 2015, 37, 41. [Google Scholar] [CrossRef]
  30. Cabral Gouveia, G.C.; Galindo, F.S.; Dantas Bereta Lanza, M.G.; Caroline da Rocha Silva, A.; Pereira de Brito Mateus, M.; Souza da Silva, M.; Rimoldi Tavanti, R.F.; Tavanti, T.R.; Lavres, J.; dos Reis, A.R. Selenium toxicity stress-induced phenotypical, biochemical and physiological responses in rice plants: Characterization of symptoms and plant metabolic adjustment. Ecotoxicol. Environ. Saf. 2020, 202, 110916. [Google Scholar] [CrossRef]
  31. Van Hoewyk, D. A tale of two toxicities: Malformed selenoproteins and oxidative stress both contribute to selenium stress in plants. Ann. Bot. 2013, 112, 965–972. [Google Scholar] [CrossRef]
  32. Prins, C.N.; Hantzis, L.J.; Quinn, C.F.; Pilon-smits, E.A.H. Effects of selenium accumulation on reproductive functions in Brassica juncea and Stanleya pinnata. J. Exp. Bot. 2011, 62, 5633–5640. [Google Scholar] [CrossRef] [PubMed]
  33. Silva, V.M.; Boleta, E.H.M.; Lanza, M.G.D.B.; Lavres, J.; Martins, J.T.; Santos, E.F.; dos Santos, F.L.M.; Putti, F.F.; Furlani, E., Jr.; White, P.J.; et al. Physiological, biochemical, and ultrastructural characterization of selenium toxicity in cowpea plants. Environ. Exp. Bot. 2018, 150, 172–182. [Google Scholar] [CrossRef]
  34. Dumanović, J.; Nepovimova, E.; Natić, M.; Kuča, K.; Jaćević, V. The Significance of Reactive Oxygen Species and Antioxidant Defense System in Plants: A Concise Overview. Front. Plant Sci. 2021, 11, 552969. [Google Scholar] [CrossRef]
  35. Ahmad, P.; Jaleel, C.A.; Salem, M.A.; Nabi, G.; Sharma, S. Roles of enzymatic and nonenzymatic antioxidants in plants during abiotic stress. Crit. Rev. Biotechnol. 2010, 30, 161–175. [Google Scholar] [CrossRef] [PubMed]
  36. Ríos, J.J.; Blasco, B.; Cervilla, L.M.; Rosales, M.A.; Sanchez-Rodriguez, E.; Romero, L.; Ruiz, J.M. Production and detoxification of H2O2 in lettuce plants exposed to selenium. Ann. Appl. Biol. 2009, 154, 107–116. [Google Scholar] [CrossRef]
  37. Cao, D.; Liu, Y.; Ma, L.; Jin, X.; Guo, G.; Tan, R.; Liu, Z.; Zheng, L.; Ye, F.; Liu, W. Transcriptome analysis of differentially expressed genes involved in selenium accumulation in tea plant (Camellia sinensis). PLoS ONE 2018, 13, e0197506. [Google Scholar] [CrossRef] [PubMed]
  38. Hartikainen, H.; Xue, T.; Piironen, V. Selenium as an anti-oxidant and pro-oxidant in ryegrass. Plant Soil 2000, 225, 193–200. [Google Scholar] [CrossRef]
  39. Mroczek-Zdyrska, M.; Wójcik, M. The influence of selenium on root growth and oxidative stress induced by lead in Vicia faba L. minor plants. Biol. Trace Elem. Res. 2012, 147, 320–328. [Google Scholar] [CrossRef] [PubMed]
  40. Jóźwiak, W.; Politycka, B. Effect of selenium on alleviating oxidative stress caused by a water deficit in cucumber roots. Plants 2019, 8, 217. [Google Scholar] [CrossRef] [PubMed]
  41. Khalofah, A.; Migdadi, H.; El-Harty, E. Antioxidant Enzymatic Activities and Growth Response of Quinoa (Chenopodium quinoa Willd) to Exogenous Selenium Application. Plants 2021, 10, 719. [Google Scholar] [CrossRef]
  42. Łabanowska, M.; Filek, M.; Kościelniak, J.; Kurdziel, M.; Kuliś, E.; Hartikainen, H. The effects of short-term selenium stress on Polish and Finnish wheat seedlings-EPR, enzymatic and fluorescence studies. J. Plant Physiol. 2012, 169, 275–284. [Google Scholar] [CrossRef]
  43. Akbulut, M.; Çakir, S. The effects of Se phytotoxicity on the antioxidant systems of leaf tissues in barley (Hordeum vulgare L.) seedlings. Plant Physiol. Biochem. 2010, 48, 160–166. [Google Scholar] [CrossRef] [PubMed]
  44. Sun, X.; Han, G.; Ye, S.; Luo, Y.; Zhou, X. Effects of Selenium on Serotonin Synthesis and the Glutathione Redox Cycle in Plum Leaves. J. Soil Sci. Plant Nutr. 2020, 20, 2212–2221. [Google Scholar] [CrossRef]
  45. Katanić, Z.; Mlinarić, S.; Katanić, N.; Ćosić, J.; Španić, V. Photosynthetic efficiency in flag leaves and ears of winter wheat during fusarium head blight infection. Agronomy 2021, 11, 2415. [Google Scholar] [CrossRef]
  46. Spanic, V.; Sunic, K.; Duvnjak, J.; Babic, J.; Drezner, G. Winter wheat grain yield response to fungicide application at different stages and fusarium head blight is rather influenced by variety and year. Rom. Agric. Res. 2023, 40, 1–13. [Google Scholar] [CrossRef]
  47. Hoagland, D.R.; Arnon, D.I. The Water-Culture Method for Growing Plants without Soil; California Agriculture Experimental Station: Berkeley, CA, USA, 1950. [Google Scholar]
  48. Gupta, M.; Gupta, S. An overview of selenium uptake, metabolism, and toxicity in plants. Front. Plant Sci. 2017, 7, 2074. [Google Scholar] [CrossRef]
  49. Galić, L.; Galić, V.; Ivezić, V.; Zebec, V.; Jović, J.; Đikić, M.; Filipović, A.; Manojlović, M.; Almås, Å.R.; Lončarić, Z. Modelling Leverage of Different Soil Properties on Selenium Water-Solubility in Soils of Southeast Europe. Agronomy 2023, 13, 824. [Google Scholar] [CrossRef]
  50. Lichtenthaler, H.K. Chlorophylls and carotenoids: Pigments of photosynthetic biomembranes. Methods Enzymol. 1987, 148, 350–382. [Google Scholar] [CrossRef]
  51. Verma, S.; Dubey, R.S. Lead toxicity induces lipid peroxidation and alters the activities of antioxidant enzymes in growing rice plants. Plant Sci. 2003, 164, 645–655. [Google Scholar] [CrossRef]
  52. Mukherjee, S.P.; Choudhuri, M.A. Implications of water stress-induced changes in the levels of endogenous ascorbic acid and hydrogen peroxide in Vigna seedlings. Physiol. Plant. 1983, 58, 166–170. [Google Scholar] [CrossRef]
  53. Aebi, H. Catalase in vitro. Methods Enzymol. 1984, 105, 121–126. [Google Scholar] [CrossRef]
  54. Siegel, B.Z. The Isoperoxidases of Pisum sativum. Plant Physiol. 1967, 42, 221–226. [Google Scholar] [CrossRef]
  55. Bradford, M.M. A rapid and sensitive method for the quantitation of microgram quantities of protein utilizing the principle of protein-dye binding. Anal. Biochem. 1976, 72, 248–254. [Google Scholar] [CrossRef] [PubMed]
  56. Ríos, J.J.; Rosales, M.A.; Blasco, B.; Cervilla, L.M.; Romero, L.; Ruiz, J.M. Biofortification of Se and induction of the antioxidant capacity in lettuce plants. Sci. Hortic. 2008, 116, 248–255. [Google Scholar] [CrossRef]
  57. Zhao, W.; Wang, W.; Weihong, X.; Chai, Y.; Xie, W.; Chi, S. Effects of selenium on activity of glutathione peroxidase and expression of selenium metabolism-related genes in Brassica. Toxicol. Environ. Chem. 2018, 100, 191–204. [Google Scholar] [CrossRef]
  58. Li, H.F.; McGrath, S.P.; Zhao, F.J. Selenium uptake, translocation and speciation in wheat supplied with selenate or selenite. New Phytol. 2008, 178, 92–102. [Google Scholar] [CrossRef] [PubMed]
  59. Arvy, M.P. Some factors influencing the uptake and distribution of selenite in the bean plant (Phaseolus vulgaris). Plant Soil 1989, 117, 129–133. [Google Scholar] [CrossRef]
  60. Kaur, M.; Sharma, S. Influence of selenite and selenate on growth, leaf physiology and antioxidant defense system in wheat (Triticum aestivum L.). J. Sci. Food Agric. 2018, 98, 5700–5710. [Google Scholar] [CrossRef] [PubMed]
  61. Boldrin, P.F.; Faquin, V.; Clemente, A.D.C.S.; de Andrade, T.; Guilherme, L.R.G. Genotypic Variation and Biofortification with Selenium in Brazilian Wheat Cultivars. J. Environ. Qual. 2018, 47, 1371–1379. [Google Scholar] [CrossRef]
  62. Khaliq, A.; Aslam, F.; Matloob, A.; Hussain, S.; Geng, M.; Wahid, A.; Ur Rehman, H. Seed priming with selenium: Consequences for emergence, seedling growth, and biochemical attributes of rice. Biol. Trace Elem. Res. 2015, 166, 236–244. [Google Scholar] [CrossRef]
  63. Moulick, D.; Ghosh, D.; Chandra Santra, S. Evaluation of effectiveness of seed priming with selenium in rice during germination under arsenic stress. Plant Physiol. Biochem. 2016, 109, 571–578. [Google Scholar] [CrossRef]
  64. Molnárová, M.; Fargašová, A. Se(IV) phytotoxicity for monocotyledonae cereals (Hordeum vulgare L., Triticum aestivum L.) and dicotyledonae crops (Sinapis alba L., Brassica napus L.). J. Hazard. Mater. 2009, 172, 854–861. [Google Scholar] [CrossRef] [PubMed]
  65. Lapaz, A.D.M.; Santos, L.F.D.M.; Yoshida, C.H.P.; Heinrichs, R.; Campos, M.; Reis, A.R.D. Physiological and toxic effects of selenium on seed germination of cowpea seedlings. Bragantia 2019, 78, 498–508. [Google Scholar] [CrossRef]
  66. El Mehdawi, A.F.; Quinn, C.F.; Pilon-Smits, E.A.H. Effects of selenium hyperaccumulation on plant-plant interactions: Evidence for elemental allelopathy? New Phytol. 2011, 191, 120–131. [Google Scholar] [CrossRef] [PubMed]
  67. Nithyananthan, S.; Somenath, S.; Sreenadh, B.; Thirunavukkarasu, C.; Othman Bahakim, N.; Shahid, M.; Hassan Abdelzaher, M.; Peer Mohideen, A.; Ramesh, T.; Lokanatha, V. Selenium conditioning decreases antioxidant enzyme activity and delays germination potency of Macrotyloma uniflorum and Vigna radiate. J. King Saud Univ. Sci. 2023, 35, 102501. [Google Scholar] [CrossRef]
  68. Sreekala, M.; Lalitha, K. Selenium-Mediated Differential Response of 13-Glucosidase and 13-Galactosidase of Germinating Trigonella foenum-graecum. Biol. Trace Elem. Res. 1998, 64, 247–258. [Google Scholar] [CrossRef]
  69. Chu, J.; Yao, X.; Zhang, Z. Responses of Wheat Seedlings to Exogenous Selenium Supply Under Cold Stress. Biol. Trace Elem. Res. 2010, 136, 355–363. [Google Scholar] [CrossRef]
  70. Guerrero, B.; Llugany, M.; Palacios, O.; Valiente, M. Dual effects of different selenium species on wheat. Plant Physiol. Biochem. 2014, 83, 300–307. [Google Scholar] [CrossRef] [PubMed]
  71. Idrees, M.; Cheema, S.A.; Farooq, M.; Wakeel, A. Selenium nutrition for yield enhancement and grain biofortification of wheat through different application methods. Int. J. Agric. Biol. 2018, 20, 1701–1709. [Google Scholar] [CrossRef]
  72. Wang, M.; Zhou, F.; Cheng, N.; Chen, P.; Ma, Y.; Zhai, H.; Qi, M.; Liu, N.; Liu, Y. Soil and foliar selenium application: Impact on accumulation, speciation, and bioaccessibility of selenium in wheat (Triticum aestivum L.). Front. Plant Sci. 2022, 13, 988627. [Google Scholar] [CrossRef]
  73. Hawrylak-Nowak, B. Comparative effects of selenite and selenate on growth and selenium accumulation in lettuce plants under hydroponic conditions. Plant Growth Regul. 2013, 70, 149–157. [Google Scholar] [CrossRef]
  74. Fargašová, A. Toxicity comparison of some possible toxic metals (Cd, Cu, Pb, Se, Zn)on young seedlings of Sinapis alba L. Plant Soil Environ. 2004, 50, 33–38. [Google Scholar] [CrossRef]
  75. Zhao, W.; Xu, W.; Chai, Y.; Zhou, X.; Zhang, M.; Xie, W. Differences in selenium uptake, distribution and expression of selenium metabolism genes in Tomatoes. Int. J. Agric. Biol. 2017, 19, 528–534. [Google Scholar] [CrossRef]
  76. Wang, M.; Ali, F.; Qi, M.; Peng, Q.; Wang, M.; Ba, G.S.; Miao, S.; Li, Z.; Toan, Q.; Liang, D. Ecotoxicology and Environmental Safety Insights into uptake, accumulation, and subcellular distribution of selenium among eight wheat (Triticum aestivum L.) cultivars supplied with selenite and selenate. Ecotoxicol. Environ. Saf. 2021, 207, 111544. [Google Scholar] [CrossRef] [PubMed]
  77. Sali, A.; Zeka, D.; Fetahu, S.; Rusinovci, I.; Kaul, H.-P. Selenium supply affects chlorophyll concentration and biomass production of maize (Zea mays L.). J. Land Manag. Food Environ. 2018, 69, 249–255. [Google Scholar] [CrossRef]
  78. Cartes, P.; Gianfreda, L.; Mora, M.L. Uptake of selenium and its antioxidant activity in ryegrass when applied as selenate and selenite forms. Plant Soil 2005, 276, 359–367. [Google Scholar] [CrossRef]
  79. Sindireva, A.; Golubkina, N.; Bezuglova, H.; Fedotov, M.; Alpatov, A.; Erdenotsogt, E.; Agnieszka, S. Effects of High Doses of Selenate, Selenite and Nano-Selenium on Biometrical Characteristics, Yield and Biofortification Levels of Vicia faba L. Cultivars. Plants 2023, 12, 2847. [Google Scholar] [CrossRef]
  80. Tian, M.; Hui, M.; Thannhauser, T.W.; Pan, S.; Li, L. Selenium-induced toxicity is counteracted by sulfur in broccoli (Brassica oleracea L. var. italica). Front. Plant Sci. 2017, 8, 1425. [Google Scholar] [CrossRef]
  81. Hurd-Karrer, A.M. Comparative Toxicity of Selenates and Selenites to Wheat. Am. J. Bot. 1937, 24, 720. [Google Scholar] [CrossRef]
  82. White, P.J.; Bowen, H.C.; Parmaguru, P.; Fritz, M.; Spracklen, W.P.; Spiby, R.E.; Meacham, M.C.; Mead, A.; Harriman, M.; Trueman, L.J.; et al. Interactions between selenium and sulphur nutrition in Arabidopsis thaliana. J. Exp. Bot. 2004, 55, 1927–1937. [Google Scholar] [CrossRef]
  83. Coppa, E.; Celletti, S.; Sestili, F.; Mimmo, T.; Dolores, M.; Molina, G.; Cesco, S.; Astolfi, S. Interaction between Sulfate and Selenate in Tetraploid Wheat (Triticum turgidum L.) Genotypes. Int. J. Mol. Sci. 2023, 24, 5443. [Google Scholar] [CrossRef]
  84. Lyi, S.M.; Heller, L.I.; Rutzke, M.; Welch, R.M.; Kochian, L.V.; Li, L. Molecular and biochemical characterization of the selenocysteine Se-methyltransferase gene and Se-methylselenocysteine synthesis in broccoli. Plant Physiol. 2005, 138, 409–420. [Google Scholar] [CrossRef]
  85. Boldrin, P.F.; de Figueiredo, M.A.; Yang, Y.; Luo, H.; Giri, S.; Hart, J.J.; Faquin, V.; Guilherme, L.R.G.; Thannhauser, T.W.; Li, L. Selenium promotes sulfur accumulation and plant growth in wheat (Triticum aestivum). Physiol. Plant. 2016, 158, 80–91. [Google Scholar] [CrossRef]
  86. Dalla Vecchia, F.; Nardi, S.; Santoro, V.; Pilon-Smits, E.; Schiavon, M. Brassica juncea and the Se-hyperaccumulator Stanleya pinnata exhibit a different pattern of chromium and selenium accumulation and distribution while activating distinct oxidative stress-response signatures. Environ. Pollut. 2023, 320, 121048. [Google Scholar] [CrossRef]
  87. Handa, N.; Kohli, S.K.; Sharma, A.; Thukral, A.K.; Bhardwaj, R.; Abd_Allah, E.F.; Alqarawi, A.A.; Ahmad, P. Selenium modulates dynamics of antioxidative defence expression, photosynthetic attributes and secondary metabolites to mitigate chromium toxicity in Brassica juncea L. plants. Environ. Exp. Bot. 2019, 161, 180–192. [Google Scholar] [CrossRef]
  88. Azizi, I.; Esmaielpour, B.; Fatemi, H. Effect of foliar application of selenium on morphological and physiological indices of savory (Satureja hortensis) under cadmium stress. Food Sci. Nutr. 2020, 8, 6539–6549. [Google Scholar] [CrossRef]
  89. Haghighi, M.; Sheibanirad, A.; Pessarakli, M. Effects of selenium as a beneficial element on growth and photosynthetic attributes of greenhouse cucumber. J. Plant Nutr. 2016, 39, 1493–1498. [Google Scholar] [CrossRef]
  90. Kroh, G.E.; Pilon, M. Regulation of iron homeostasis and use in chloroplasts. Int. J. Mol. Sci. 2020, 21, 3395. [Google Scholar] [CrossRef] [PubMed]
  91. Padmaja, K.; Prasad, D.D.K.; Prasad, A.R.K. Effect of selenium on chlorophyll biosynthesis in mung bean seedlings. Phytochemistry 1989, 28, 3321–3324. [Google Scholar] [CrossRef]
  92. Elkelish, A.A.; Soliman, M.H.; Alhaithloul, H.A.; El-Esawi, M.A. Selenium protects wheat seedlings against salt stress-mediated oxidative damage by up-regulating antioxidants and osmolytes metabolism. Plant Physiol. Biochem. 2019, 137, 144–153. [Google Scholar] [CrossRef] [PubMed]
  93. Xue, T.; Hartikainen, H. Association of antioxidative enzymes with the synergistic effect of selenium and UV irradiation in enhancing plant growth. Agric. Food Sci. 2000, 9, 177–186. [Google Scholar] [CrossRef]
  94. Wang, C.Q.; Xu, H.J.; Liu, T. Effect of Selenium on Ascorbate-Glutathione Metabolism During PEG-induced Water Deficit in Trifolium repens L. J. Plant Growth Regul. 2011, 30, 436–444. [Google Scholar] [CrossRef]
  95. Filek, M.; Zembala, M.; Hartikainen, H.; Miszalski, Z.; Kornaś, A.; Wietecka-Posłuszny, R.; Walas, P. Changes in wheat plastid membrane properties induced by cadmium and selenium in presence/absence of 2,4-dichlorophenoxyacetic acid. Plant Cell Tissue Organ Cult. 2009, 96, 19–28. [Google Scholar] [CrossRef]
  96. Gzyl-Malcher, B.; Filek, M.; Brezesinski, G. Mixed DPPC/DPTAP monolayers at the air/water interface: Influence of indolilo-3-acetic acid and selenate ions on the monolayer morphology. Langmuir 2011, 27, 10886–10893. [Google Scholar] [CrossRef]
  97. Gzyl-Malcher, B.; Filek, M.; Rudolphi-Skórska, E.; Sieprawska, A. Studies of Lipid Monolayers Prepared from Native and Model Plant Membranes in Their Interaction with Zearalenone and Its Mixture with Selenium Ions. J. Membr. Biol. 2017, 250, 273–284. [Google Scholar] [CrossRef]
  98. Gzyl-Malcher, B.; Filek, M.; Brezesinski, G. Influence of cadmium and selenate on the interactions between hormones and phospholipids. Langmuir 2009, 25, 13071–13076. [Google Scholar] [CrossRef] [PubMed]
  99. Gechev, T.S.; Van Breusegem, F.; Stone, J.M.; Denev, I.; Laloi, C. Reactive oxygen species as signals that modulate plant stress responses and programmed cell death. Bioessays 2006, 28, 1091–1101. [Google Scholar] [CrossRef]
  100. El-Hadary, A.A. Kinetic Studies of Catalase And Peroxidase Enzymes Extracted From Garlic Cloves (Allium sativum L.). Ann. Agric. Sci. Moshtohor 2021, 59, 331–338. [Google Scholar] [CrossRef]
  101. Silva, V.M.; Rimoldi Tavanti, R.F.; Gratão, P.L.; Alcock, T.D.; Reis, A.R. dos Selenate and selenite affect photosynthetic pigments and ROS scavenging through distinct mechanisms in cowpea (Vigna unguiculata (L.) walp) plants. Ecotoxicol. Environ. Saf. 2020, 201, 110777. [Google Scholar] [CrossRef]
  102. Chioti, V.; Zervoudakis, G. Is root catalase a bifunctional catalase-peroxidase? Antioxidants 2017, 6, 39. [Google Scholar] [CrossRef]
  103. Nicholls, P.; Fita, I.; Loewen, P.C. Enzymology and structure of catalases. Adv. Inorg. Chem. 2001, 51, 51–106. [Google Scholar] [CrossRef]
  104. Gayatridevi, S.; Jayalakshmi, S.K.; Mulimani, V.H.; Sreeramulu, K. Salicylic acid and salicylic acid sensitive and insensitive catalases in different genotypes of chickpea against Fusarium oxysporum f. sp. ciceri. Physiol. Mol. Biol. Plants 2013, 19, 529–536. [Google Scholar] [CrossRef]
  105. Gadjev, I.; Stone, J.M.; Gechev, T.S. Programmed Cell Death in Plants. New Insights into Redox Regulation and the Role of Hydrogen Peroxide. Int. Rev. Cell Mol. Biol. 2008, 270, 87–144. [Google Scholar] [CrossRef] [PubMed]
  106. Yao, X.; Chu, J.; Wang, G. Effects of selenium on wheat seedlings under drought stress. Biol. Trace Elem. Res. 2009, 130, 283–290. [Google Scholar] [CrossRef] [PubMed]
  107. Huang, C.; Qin, N.; Sun, L.; Yu, M.; Hu, W.; Qi, Z. Selenium improves physiological parameters and alleviates oxidative stress in strawberry seedlings under low-temperature stress. Int. J. Mol. Sci. 2018, 19, 1913. [Google Scholar] [CrossRef] [PubMed]
  108. Dey, S.K.; Dey, J.; Patra, S.; Pothal, D. Changes in the antioxidative enzyme activities and lipid peroxidation in wheat seedlings exposed to cadmium and lead stress. Braz. J. Plant Physiol. 2007, 19, 53–60. [Google Scholar] [CrossRef]
  109. Mazej, D.; Osvald, J.; Stibilj, V. Selenium species in leaves of chicory, dandelion, lamb’s lettuce and parsley. Food Chem. 2008, 107, 75–83. [Google Scholar] [CrossRef]
  110. Saidi, I.; Chtourou, Y.; Djebali, W. Selenium alleviates cadmium toxicity by preventing oxidative stress in sunflower (Helianthus annuus) seedlings. J. Plant Physiol. 2014, 171, 85–91. [Google Scholar] [CrossRef]
Figure 1. Wheat seedlings on vermiculite seven days after treatment with different concentrations of selenate and selenite. Control plants were grown without selenium.
Agriculture 13 01632 g001
Figure 2. Selenium (Se) concentration in wheat shoots (A) and roots (B) after treatments with five different concentrations of selenate and selenite (0.4, 4, 20, 40, and 400 mg/kg). Control plants were grown without selenium (Se) (0 mg/kg). Results are presented as means ± standard deviation. Differences between treatments were assessed by a one-way analysis of variance (ANOVA), followed by Duncan’s test. Different letters indicate significant differences between treatments (p < 0.05).
Agriculture 13 01632 g002
Figure 3. Morpho-physiological traits: germination rate (A); shoot and root biomass (B,C); chlorophyll a (D); chlorophyll b (E); and carotenoids (F) in wheat after treatments with five different concentrations of selenate and selenite (0.4, 4, 20, 40, and 400 mg/kg). Control plants were grown without selenium (Se) (0 mg/kg). Results are presented as means ± standard deviation. Differences between treatments were assessed by a one-way analysis of variance (ANOVA), followed by Duncan’s test. Different letters indicate significant differences between treatments (p < 0.05).
Agriculture 13 01632 g003
Figure 4. The content of thiobarbituric reactive substances (TBARS) (A,B); and hydrogen peroxide (H2O2) (C,D) in wheat shoots and roots after treatments with five different concentrations of selenate and selenite (0.4, 4, 20, 40 and 400 mg/kg). Control plants were grown without selenium (Se) (0 mg/kg). Results are presented as means ± standard deviation. Differences between treatments were assessed by a one-way analysis of variance (ANOVA), followed by Duncan’s test. Different letters indicate significant differences between treatments (p < 0.05).
Agriculture 13 01632 g004
Figure 5. The activity of catalase (CAT) (A,B); and guaiacol peroxidase (GPOD) (C,D) in wheat shoots and roots after treatments with five different concentrations of selenate and selenite (0.4, 4, 20, 40, and 400 mg/kg). Control plants were grown without selenium (Se) (0 mg/kg). Results are presented as means ± standard deviation. Differences between treatments were assessed by a one-way analysis of variance (ANOVA), followed by Duncan’s test. Different letters indicate significant differences between treatments (p < 0.05).
Agriculture 13 01632 g005
Disclaimer/Publisher’s Note: The statements, opinions and data contained in all publications are solely those of the individual author(s) and contributor(s) and not of MDPI and/or the editor(s). MDPI and/or the editor(s) disclaim responsibility for any injury to people or property resulting from any ideas, methods, instructions or products referred to in the content.

