Abstract
Evaluating the effectiveness of fertilizers on crops without traditional yield is difficult, as clipping collection is time-consuming and not indicative of the desired response to the fertilizer. Remote sensing techniques, like the normalized difference vegetation index (NDVI), have emerged as an effective tool to combat these issues. Canopy reflectance, measured by NDVI, is commonly used to differentiate turfgrass response to nitrogen (N) fertilization treatments; however, advancements in data processing are needed for greater differentiation between treatments and better testing of the effects of fertilizer responses. Presented here is an advancement in the processing of NDVI data by applying a compound exponential (pulse peak) function to changes in NDVI over time, relative to a control. This method’s effectiveness in differentiating between fertilizers was evaluated by applying polymer-coated urea (PCU), an enhanced efficiency fertilizer (EEF), and urea on turfgrass to show the usefulness of the novel curve fitting in highlighting differences in fertilizer response. The field study was carried out on an established Kentucky bluegrass (Poa pratensis L.) blend on a sandy loam soil rootzone maintained with a typical home lawn maintenance regime. Ratios of PCU to urea ranging from 100% urea to 100% PCU with increments of 20% of PCU were used to observe a continuum of response between the two fertilizer types. The N rate for all blends was 73 kg ha−1, with unfertilized plots used as a control to set baseline measurements for the curve fitting. Turfgrass response to N fertilization treatments was assessed through visual turfgrass quality ratings, dry matter yield, and canopy reflectance, where higher urea content resulted in the shortest time to maximum ∆NDVI (24 days), while 100% EEF reached maximum ∆NDVI at 56 days. The novel curve fitting analysis of the NDVI data allowed for differentiation between treatments, provided a measure of fertilizer effects, and differentiated between urea and enhanced efficiency fertilizers.
1. Introduction
To optimize nitrogen (N) fertilization for turfgrass, it is necessary to differentiate between treatments. Visual quality ratings are used to assess the health and aesthetics of turfgrass. The visual turfgrass quality rating method uses the National Turfgrass Evaluation Program (NTEP) guidelines to assign a value to turfgrass colour, quality, shoot density, and uniformity [1]. Visual ratings depend on personnel with extensive experience in turfgrass evaluation. The subjective nature of visual ratings is vulnerable to inconsistencies between raters and rater fatigue [2,3,4]. Also, ratings can be influenced by mowing patterns, raking direction, cloudiness, and shadows [5]. Clipping yield has been another primary method to quantify response since growth is an indicator of plant response to fertilizer. However, we have found that clipping yields can be inconsistent and difficult to collect accurately, resulting in difficulty in determining the difference in growth rate using dry matter yield (DMY).
The normalized difference vegetation index (NDVI) is used to monitor plant performance in response to fertilizer application [3,6,7]. The gathering of spectral reflectance data is objective, quick, and non-destructive. NDVI relies on chlorophyll content’s relationship to visible light absorbance and near-infrared light reflection [8]. NDVI is useful for estimating chlorophyll content [6], and as N is a significant component of chlorophyll [9], it provides an indirect measure of N content. Measurements of NDVI are used to assess turfgrass response to N rates objectively and are correlated to tissue N concentrations [4,6,10,11,12,13,14,15,16,17,18,19,20,21]. Further, turfgrass breeding programs have incorporated the use of NDVI to compare the performance of drought-tolerant selections under optimal, irrigated, and water-limited regimes [22,23]. Higher NDVI values generally indicate better overall plant health and are often correlated to greater growth. The positive correlation between NDVI and visual turfgrass quality ratings for colour, quality, and uniformity is well established [3,4,7,11,24]. Wavelength bands of 780 nm in the near-infrared and 680 nm in the red correlate to turf visual quality ratings [24]. The collection of NDVI data is simple and requires less time than turfgrass visual ratings but is not useful for specific evaluations, such as colour, texture, or density, which require human assessment [25]. NDVI is influenced by differences in fertilization and differences in species, cultivars, environmental stresses, and pest injuries [14,26,27]. Despite this, canopy reflectance data provide useful information for describing turfgrass response to fertilizer and allow for differentiation amongst fertilizer treatments [27]. NDVI data do not provide information on the maximum plant response to fertilizer, nor the time required to attain that maximum response.
Enhanced efficiency fertilizers (EEFs) were developed to improve plant quality and yield through a controlled and sustained release of nutrients into the soil to better align with plant demands. EEFs can deliver similar or better yields at relatively lower quantities than traditional fertilizers. Instead of a sizeable episodic pulse of nutrients, EEFs provide a small constant fertilizer supply, reducing the likelihood of excessive or deficient nutrient availability [28,29]. A steady supply of nutrients is thought to improve plant health, enabling the plant to better withstand biotic and abiotic stresses and weed encroachment.
Also, EEF use has environmental benefits. Nitrogen’s slow release decreases the amount available for uptake due to losses through runoff, leaching, and volatilization [30]. However, with EEFs, the delivery of nutrients is theorized to match plant demand more closely, reducing air, water, and land pollution due to nutrient runoff, leaching, and volatilization [29]. In turfgrass, there is a greater loss of N to the environment when fertilizing with urea due to ammonia’s volatilization, compared to turfgrass fertilized with polymer-coated urea (PCU) EEF [31]. Turfgrass health and appearance can be maintained utilizing PCU EEF while mitigating environmental losses of N as N2O and NH3 [32].
This research aims to illustrate a novel method for analysing the NDVI with a known response to EEF, relative to untreated control. Subtracting the untreated control from treatments removes inconsistencies in the data due to environmental influences, allowing for curve fitting with a high goodness-of-fit. The strong fit gives confidence that important characteristics extracted from the curve are accurate, including maximum greenness and time to maximum greenness. The method is illustrated using six fertilizer treatments of urea PCU EEF blends, ranging from 100% urea to 100% EEF, to measure a continuum of response on a stand of Kentucky bluegrass turfgrass. Although this paper focuses on measuring NDVI in turfgrass, the methodology can be applied to various measurements and crop types.
2. Materials and Methods
2.1. Study Site
The study was carried out on 28 plots (1.5 m2) of Kentucky bluegrass (Poa pratensis L.) blend (27.7% Mercury, 22.2% America, 16.6% Moonshadow, 16.6% Royal, and 16.6% Touchdown) on a sandy loam soil root zone at the Guelph Turfgrass Institute, Guelph, ON (43°32′54.8″ N, 80°13′00.8″ W). The Kentucky bluegrass was seeded four years before the study was performed at a seeding rate of 8.3 g m−2 and maintained with a typical home lawn maintenance regime: mowed at 40 mm and irrigated as needed to prevent stress. In May, three weeks before N fertilization treatments, the plots were treated with 5.5 mL 100 m−2 of a 3-way mix of phenoxy herbicides (Par III) containing 25.38% 2,4-dichlorophenoxyacetic acid (2,4-D), 13.50% 2-(2-methyl-4-chlorophenoxy) propionic acid, and 2.30% 3,6-dichloro-o-anisic acid for broadleaf weed control (United Agri Products, Dorchester, Ontario). Fungicide treatments and irrigation were not necessary during the trial. Plots were mowed with a Gardena 380 AC electric reel mower (Gardena GmbH, Ulm, Germany). Environmental conditions were noted at the treatment application and during the trial. Daily climatological data (temperature and precipitation) were collected before and throughout the trial using the WeatherHawk Signature Series weather station (Logan, Utah).
2.2. Fertilizer Treatments
Comparisons were made between the EEF Duration CR® 90 (Koch Agronomic Services, Wichita, KS, USA), a controlled-release PCU fertilizer, and urea. The six fertilizer treatments consisted of ratios of EEF to urea ranging from 100% urea to 100% EEF. The EEF:urea treatments (0:100, 20:80, 40:60, 60:40, 80:20, and 100:0) were applied at a rate of 73 kg of N ha−1 by hand using shakers, in early June, to four replicates of plots in a randomized complete block design. An unfertilized control was included to allow for corrections for environmental variations in the NDVI.
2.3. Measurements of Response to Treatment
Turfgrass response to treatment was measured quantitatively using both canopy reflectance (NDVI) and clippings biomass. Spectral reflectance of the canopy was measured on average every other day (82 sets of measurements over the 139 days of the trial) from 12 May 2015 (19 days before treatment) to 28 September 2015 with a multispectral radiometer GreenSeeker HandheldTM Optical Sensor Unit Model 505 (NTech Industries, Inc., Ukiah, CA, USA) at two wavelengths, visible red (R, 660 nm) and infra-red (NIR, 770 nm). Measurements were taken at a height of approximately 75 cm above the canopy. NDVI was calculated using the standard equation (NDVI = (NIR − R)/(NIR + R)). As a measure of biomass accumulation, clippings were collected at 1, 3, 5, 7, 9, 11, 13, and 16 weeks after treatment from a 0.5 m2 strip, dried at 60 °C for 24 h, and weighed.
In addition, all plots were assessed visually for colour, quality, and uniformity by a single researcher with extensive experience in turf evaluation following the NTEP guidelines [1]. These ratings reflect the turf’s aesthetic and functional aspects. They range from 1 to 9, where 1 represents poor turf with no live grass and 9 represents green, dense, uniform turf. A rating of 6 or better is considered acceptable. All plots were in the acceptable range of 6 or better and were free of both abiotic and biotic stresses, including weeds, throughout the experiment.
2.4. Statistical Design and Data Analysis
The EEF:urea and control treatments were arranged in a randomized complete block design with four replications. Turfgrass response was estimated by changes in individual NDVI values by replicate throughout the experiment and the data were analysed according to the novel curve fitting method described here. First, NDVI values were adjusted by subtracting the untreated controls’ average value to remove background variation not attributable to N fertilization treatment. This value is named ∆NDVI. To relate the change in ∆NDVI to N treatment as a function of time, linear regression curves were fit to estimate the parameters of maximum ∆NDVI (K) and days to maximum ∆NDVI (C), originally using a web-based program [33] that is no longer functional and later confirmed using base R. Variable B shifts the curves along the y-axis to force a fit through zero. This is necessary due to the variability in initial NDVI readings among plots. The compound exponential (pulse peak) function presented in Equation (1) for the response to fertilizer treatment fits well with the collected dataset:
where
- ∆NDVI = change in the normalized difference vegetation index;
- K = maximum ∆NDVI; K is a function of %EEF;
- DAT = days after treatment;
- C = days to maximum ∆NDVI; C is a function of %EEF;
- B = variable to adjust curve fit through zero.
The ∆NDVI values from each treatment were fitted to the curve using a nonlinear least squares (NLS) fitting procedure. The estimates of K and C for each treatment were compared using analyses of variance (ANOVAs) and, where applicable, Tukey’s honestly significant difference (HSD) test, where α = 0.05. Statistical calculations were performed using GraphPad InStat version 3.10, GraphPad Software, San Diego, CA, USA [34].
3. Results
Weather conditions throughout the experiment were sufficient for the release of N from the controlled-release PCU fertilizer. Duration CR® 90 is an EEF that provides a steady release of urea for up to 14 weeks at temperatures of 20 °C when water is not limiting. There was adequate rainfall, so supplemental irrigation was not required, and daily temperatures were sufficiently high to meet the temperature requirement for nutrient release (Figure 1).
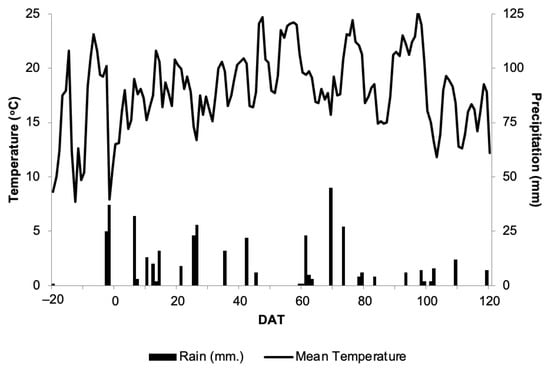
Figure 1.
Daily precipitation and daily mean temperatures at the Guelph Turfgrass Institute (GTI) field site in Guelph, ON, Canada in 2015. Nitrogen fertilization treatments were applied on Day 0 (4 June 2015).
A continuum of response was observed based on the urea percentage to the EEF:PCU (Figure 2). The treatment with urea alone achieved the most significant increase in ∆NDVI (Figure 2A). Higher urea content generally resulted in a shorter time to maximum ∆NDVI (Figure 2A–F). The method was able to show differences between treatments as the 100% urea had a maximum ∆NDVI at 24 days, while the 100% EEF had a maximum ∆NDVI at 56 days (Table 1). The curves fitted for 40% EEF (40:60), 60% EEF (60:40), and 80% EEF (80:20) were not as successful at estimating the maximum (Figure 2C–E); however, this did not significantly impact the results. The treatment without urea (100:0) was not significantly different from the control plots until 20 DAT, although there was a detectable increase in ∆NDVI earlier. The maximum differences among the treatments appeared between two and three weeks after treatment. By six weeks (41 DAT), differences among the treatments had disappeared, though all remained significantly higher than the control until 12 weeks (84 DAT).
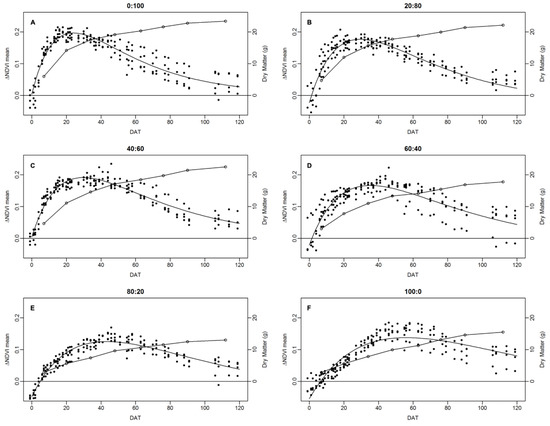
Figure 2.
Curves fitted to fertilizer response as measured by ∆NDVI with plot means shown. Curves were fitted to the data using four replicates. Cumulative dry yield curves for each treatment ( ) are superimposed on each panel. Treatments represent a range of EEF:urea ratios including (A) 100% urea, (B) 20% EEF to 80% urea, (C) 40% EEF to 60% urea, (D) 60% EEF to 40% urea, (E) 80% EEF to 20% urea, and (F) 100% EEF.

Table 1.
Multiple comparisons of estimated parameters for fitted curves of ∆NDVI. Treatments are a range of EEF:urea ratios from 100% urea to 100% EEF.
The cumulative DMY from each treatment is superimposed on its corresponding pulse-peak curves (Figure 2A–F). DMY data show a similar pattern to the NDVI data, in that greater proportions of urea in the blend led to more growth. The statistical analysis of DMY for specific DATs showed that greater shoot growth was associated with greater amounts of urea in the treatment up to at least 20 DAT; by 34 DAT, that trend had lessened, and by 48 DAT it disappeared completely (Table 2).
Table 2.
Least significant means for dry matter yield (DMY) for each treatment in grams (g) for a specific day after treatment (DAT). Treatments are a range of EEF:urea ratios from 100% urea to 100% EEF.
Visual quality ratings followed the same trend as the NDVI data, but the DMY data did not reveal as much information as the NDVI data. As early as 7 DAT, the turf’s visual quality for all treatments was considered acceptable, with ratings of 6 or better [35]. Differences in response between treatments measured by visual ratings were lost early, at 7 DAT, while treatment differences were still measurable through canopy reflectance through 84 DAT.
The six fertilizer treatments consisted of ratios of EEF to urea ranging from 100% urea to 100% EEF. Figure 3 shows that the parameter “K” linearly decreased by roughly 1.5% per 10% increase in %EEF in the treatment mix, and Figure 4 shows that the parameter “C” non-linearly increased from 25 to 55 days with an increase in %EEF in the treatment mix from zero to 100%. The above results make sense because the use of EEF can significantly delay the peak NDVI, and slower growth would also slightly reduce max. NDVI.
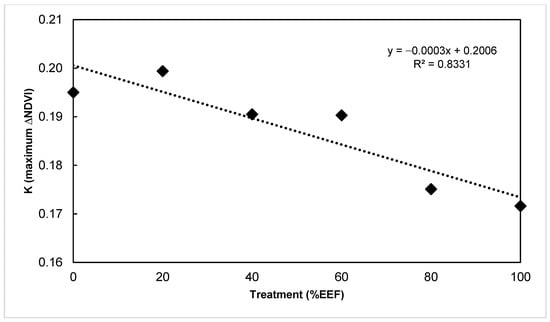
Figure 3.
Line fitted to fertilizer response as measured by K with plot means shown. Lines were fitted to data from all four replicates. Treatments are a range of EEF:urea ratios from 100% urea to 100% EEF.
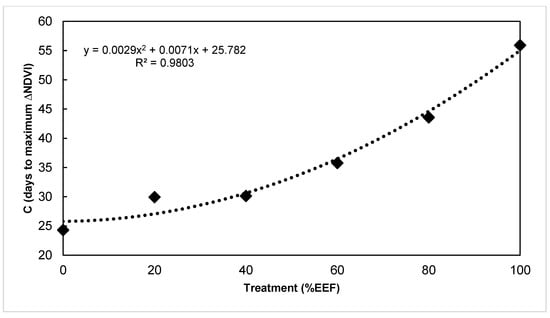
Figure 4.
Curve fitted to fertilizer response as measured by C with plot means shown. Curves were fitted to data from all four replicates. Treatments are a range of EEF:urea ratios from 100% urea to 100% EEF.
4. Discussion
The new calculation, ∆NDVI, obtained by subtracting the mean value of the untreated control plot from the values of the treated plots, is necessary because NDVI values are affected by mowing [36], moisture status [14,37], and other factors such as density [26]. The subtraction relative to the unfertilized control reduces noise in the data (Figure 5) and allows for better visualization of differences due to N status. A compound exponential (pulse peak) function fit the data well, clearly showing the relationship between changes in ∆NDVI and N treatment as a function of time (Figure 6). The two critical parameters of response, maximum ∆NDVI (K) and days to maximum ∆NDVI (C), are indicated on the curve (Figure 6). The shapes of the pulse-peak curves produced by the compound exponential (pulse peak) function to the datasets for each of the treatments showed that the broadening of the fertilization effect throughout the experiment is correlated with the increase in the ratio of EEF to urea (Figure 2).
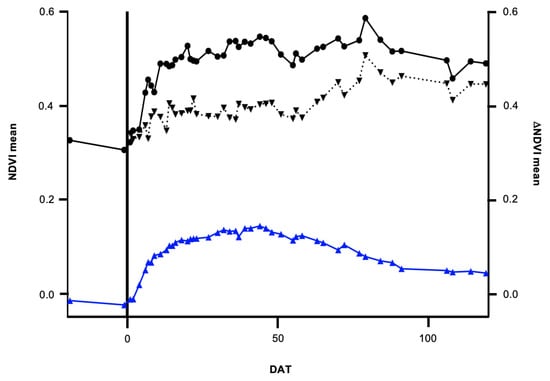
Figure 5.
The mean normalized difference vegetation index (NDVI) of turfgrass plots with (●) and without (▼) fertilizer applied at 0 days after treatment (DAT). By subtracting the unfertilized from the fertilized plots, ∆NDVI (▲) is calculated, reducing the daily variation in NDVI.
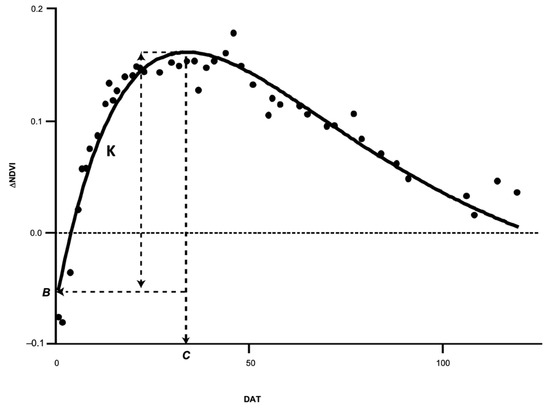
Figure 6.
The difference in the normalized difference vegetation index (∆NDVI) between fertilized and unfertilized plots over time when fertilizer is applied at day zero. K is the days to maximum peak of the difference between the fertilized and unfertilized plots, C represents the days to maximum, and B represents the Y-intercept.
The pulse peak function used in this study is desirable for several reasons. First, it directly provides estimates of maximum and time to maximum ∆NDVI, which is useful to users because it simplifies the understanding of the parameter’s estimates. The curve directly gives the estimates of maximum and time to maximum ∆NDVI. Also, the pulse peak function is relatively easy to fit. The function can be fit using simple statistical software since there are three parameters with easy-to-estimate starting values. By contrast, functions with additional parameters would likely require more computing power and more advanced estimation of starting values to obtain a proper best fit. Linear fitting methods are desirable over non-linear methods because linear methods provide ease of comparison across treatments and across studies, and can be more informative of underlying mechanisms.
The pulse peak function generally fits the data well, but an error in the fit is noted in some treatment tails. Variations in the error of the fit may be due to the variations observed in the study site, including pockets of high organic matter in the soil or residual fertility in particular areas of the field. However, the error is acceptable since it does not appear to cause significant error in the parameters of practical interest: maximum and days to maximum ∆NDVI. It is acknowledged that better fits are possible, but the pulse peak function performs acceptably well for the purpose of this analysis. Other functions could be tested, but the novel method explored in this study of subtracting the control plots’ mean remains.
Most research uses NDVI to estimate differences either at a point in time during the experiment, stating the days on which differences can be found between treatments [23], or differences between treatments based on data pooled throughout the experiment using data taken on multiple days [36]. Often, the differences are not consistent throughout the experiment due to the variation in the NDVI on each day that the measurements are taken, in turn due to variations in the environment. Subtracting the mean value of the untreated control and fitting a pulse peak function allows for a meaningful interpretation of what is happening between the fertilizer treatments over time and throughout the experiment, and allows a different interpretation of the efficacy of fertilizers compared to traditional ways of analysing NDVI data.
Generally, while the growth rate is essential for turfgrass managers, maximal growth is not always desirable. The data show that the method for processing NDVI can represent growth rate data with additional information. The shoot growth data do not provide information about time to maximum response for comparisons like the pulse-peak curves.
The manufacturer of the PCU fertilizer used in this study, Duration CR® 90, recommends when using their product that at least 50% of the N applied is to be in the form of urea to quicken green-up while maximizing the longevity of colour and plant health [36]. Observed differences in response between treatments are consistent with comparisons of visual rating and NDVI found in the literature, which identifies a correlation between visual quality ratings and NDVI [3,4,11,14,24]. While NDVI is more informative than visual ratings for turf assessment over time [38], there can still be differences in NDVI ratings [26]. Even though the two measures are correlative, NDVI data do not predict turfgrass visual quality [39]. Spectral analysis can distinguish between cultivars that have been established and maintained under the same growth conditions [27]. This means that any plant other than the cultivar of interest would affect the NDVI measurements. This is consistent with Leinauer et al. [38], who found that while turfgrass quality was strongly associated with NDVI, varietal differences were better assessed by visual quality ratings. Therefore, a researcher trained in turfgrass evaluation is still necessary to ensure that all data are obtained from turf from a single cultivar free of biotic and abiotic injury and weeds. If these potential injuries are consistent across the treated plots and the untreated control plot, the subtraction of the untreated control plot NDVI data from the treated plots’ NDVI data would reduce the influence of cultivar differences and injury when assessing the EEF.
This current study is presented to show the value of this method of data analysis and interpretation due to its simplicity and straightforward nature. The study is limited in that it tests one EEF at different percentages and does not compare different EFF technologies. The method needs to be proven for other comparisons for which NDVI is often used. This work provides a foundation for future studies, which should determine how well this methodology would work with different types of EEFs, including those that are water-based release instead of temperature-based release. This methodology could be expanded beyond NDVI to utilize alternative vegetation indices, including GNDVI and NDRE, and be used to measure growth in pastures and agricultural fields.
5. Conclusions
The objective, quantifiable method presented here represents an advancement in canopy reflectance data to compare fertilizer responses and differentiate among fertilizer technologies applicable to any plant species. Fitting the ∆NDVI data to a compound exponential (pulse peak) function provides a clear schematic of the maximum response to fertilizer as measured by canopy reflectance and days to maximum response. Although the pulse-peak function provides an adequate fit, there is a possibility that other functions may fit the data better and reduce noise in the tails. Further, visual assessment of turfgrass quality is subjective and therefore may vary from researcher to researcher. However, this research provides a basis for future studies looking at the effects of different types of EEFs and the potential use of alternative vegetation indices. The method presented in this paper was more effective at showing significance in time to maximum NDVI in the EEF data compared to traditional methods that do not fit a curve to treatment responses relative to control as measured by NDVI. While this analysis method is descriptive and not predictive of N need, it demonstrates an improvement over growth data and visual ratings that do not address time to, or level of, maximum response to N fertilization.
Author Contributions
Conceptualization, K.C. and E.M.L.; methodology, K.C. and E.M.L.; software, K.C., T.D. and A.F.; validation, E.M.L.; formal analysis, K.C., T.D., B.G. and A.F.; investigation, K.C.; resources, E.M.L.; data curation, E.M.L.; writing—original draft preparation, K.C.; writing—review and editing, J.E.P., E.M.L., A.F. and B.G.; visualization, A.F. and K.C.; supervision, E.M.L.; project administration, E.M.L.; funding acquisition, E.M.L. All authors have read and agreed to the published version of the manuscript.
Funding
This research was funded by the Ontario Ministry of Agriculture, Food, and Rural Affairs, grant number T2-27263, and Kock Agronomic Services, G15-04.
Data Availability Statement
All data are available at Novel curve fitting analysis of NDVI data to describe turf fertilizer response (view at https://borealisdata.ca/dataset.xhtml?persistentId=doi:10.5683/SP3/ARMBNK (accessed on 27 July 2023)).
Acknowledgments
The authors would like to thank the Turfgrass laboratory members for their help with this research.
Conflicts of Interest
The authors declare no conflict of interest.
References
- Morris, K.N.; Shearman, R.C. NTEP Turfgrass Evaluation Guidelines; National Turfgrass Evaluation Program. 2014. Available online: http://www.ntep.org/pdf/ratings.pdf (accessed on 13 July 2016).
- Horst, G.L.; Engelke, M.C.; Meyers, W. Assessment of visual evaluations techniques. Agron. J. 1984, 76, 619–622. [Google Scholar] [CrossRef]
- Trenholm, L.E.; Carrow, R.N.; Duncan, R.R. Relationship of multispectral radiometry data to qualitative data in turfgrass research. Crop. Sci. 1999, 39, 763–769. [Google Scholar] [CrossRef]
- Bell, G.E.; Martin, D.L.; Wiese, S.G.; Dobson, D.D.; Smith, M.W.; Stone, M.L.; Solie, J.B. Vehicle-mounted optical sensing: An objective means for evaluating turfgrass quality. Crop. Sci. 2002, 42, 197–201. [Google Scholar] [CrossRef]
- Krans, J.V.; Morris, K. Determining a profile of protocols and standards used in the visual field assessment of turfgrasses: A survey of National Turfgrass Evaluation Program-sponsored university scientists. Appl. Turfgrass Sci. 2007, 4, 1–6. [Google Scholar] [CrossRef]
- Bell, G.E.; Howell, B.M.; Johnson, G.V.; Raun, W.R.; Solie, J.B.; Stone, M.L. Optical sensing of turfgrass chlorophyll content and tissue nitrogen. HortScience 2004, 39, 1130–1132. [Google Scholar] [CrossRef]
- Bell, G.E.; Xiong, X. The history, role, and potential of optical sensing for practical turf management. In Handbook of Turfgrass Management and Physiology; Pessarakli, M., Ed.; CRC Press: Boca Raton, FL, USA, 2008; pp. 641–658. [Google Scholar]
- Rouse, J.; Haas, R.; Schell, J.; Deering, D. Monitoring Vegetation Systems in the Great Plains with ERTS. Third ERTS Symposium NASA 1973, 351, 309–317. [Google Scholar]
- Marschner, H. Mineral Nutrition of Higher Plants; Academic Press: San Diego, CA, USA, 1995. [Google Scholar]
- Trenholm, L.E.; Carrow, R.N.; Duncan, R.R. Wear tolerance, growth, and quality of seashore paspalum in response to nitrogen and potassium. HortScience 2001, 36, 780–783. [Google Scholar] [CrossRef]
- Fitz-Rodríguez, E.; Choi, C. Monitoring turfgrass quality using multispectral radiometry. Trans. ASAE 2002, 45, 865–867. [Google Scholar] [CrossRef]
- Trenholm, L.E.; Unruh, J.B. Warm-season turfgrass response to fertilizer rates and sources. J. Plant. Nutr. 2005, 28, 991–999. [Google Scholar] [CrossRef]
- Kruse, J.K.; Christians, N.E.; Chaplin, M.H. Remote sensing of nitrogen stress in creeping bentgrass. Agron. J. 2006, 98, 1640–1645. [Google Scholar] [CrossRef]
- Xiong, X.; Bell, G.E.; Solie, J.B.; Smith, M.W.; Martin, B. Bermudagrass seasonal responses to nitrogen fertilization and irrigation detected using optical sensing. Crop. Sci. 2007, 47, 1603–1610. [Google Scholar] [CrossRef]
- Johnsen, A.R.; Horgan, B.P.; Hulke, B.S.; Cline, V. Evaluation of remote sensing to measure plant stress in creeping bentgrass (Agrostis stolonifera L.) fairways. Crop. Sci. 2009, 49, 2261–2274. [Google Scholar] [CrossRef]
- Flowers, M.D.; Hart, J.M.; Young, W.C.; Mellbye, M.E.; Garbacik, C.J. Using remote sensing to assess the in-season nitrogen status of perennial ryegrass for seed production. Agron. J. 2010, 102, 1441–1447. [Google Scholar] [CrossRef]
- Li, D.Y.; Fang, W.J.; Han, L.B. Nitrogen fertilization influences shear strength and quality of Kentucky bluegrass sod grown on clay. Agron. J. 2011, 103, 751–755. [Google Scholar] [CrossRef]
- Zhu, Q.; Schlossberg, M.J.; Bryant, R.B.; Schmidt, J.P. Creeping bentgrass putting green response to foliar nitrogen fertilization. Agron. J. 2012, 104, 1589–1594. [Google Scholar] [CrossRef]
- Agati, G.; Foschi, L.; Grossi, N.; Guglielminetti, L.; Cerovic, Z.G.; Volterrani, M. Fluorescence-based versus reflectance proximal sensing of nitrogen content in Paspalum vaginatum and Zoysia matrella turfgrasses. Eur. J. Agron. 2013, 45, 39–51. [Google Scholar] [CrossRef]
- Geng, X.; Guillard, K.; Mangiafico, S.S.; Morris, T.F. Defining sufficiency levels of nitrogen in cool-season turfgrass lawns using Macy’s concept. Crop. Sci. 2014, 54, 1844–1858. [Google Scholar] [CrossRef]
- Geng, X.; Guillard, K.; Morris, T.F. Relating turfgrass growth and quality to frequently measured soil nitrate. Crop. Sci. 2014, 54, 366–382. [Google Scholar] [CrossRef]
- Katuwal, K.B.; Jespersen, D.; Bhattarai, U.; Chandra, A.; Kenworthy, K.E.; Milla-Lewis, S.R.; Schwartz, B.M.; Wu, Y.; Raymer, P. Multilocational screening identifies new drought-tolerant, warm-season turfgrasses. Crop. Sci. 2022, 62, 1614–1630. [Google Scholar] [CrossRef]
- Yousfi, S.; Marín, J.; Parra, L.; Lloret, J.; Mauri, P.V. Remote sensing devices as key methods in the advanced turfgrass phenotyping under different water regimes. Agric. Water. Manag. 2022, 266, 107581. [Google Scholar] [CrossRef]
- Keskin, M.; Han, Y.J.; Dodd, R.B.; Khalilian, A. Reflectance-based sensor to predict visual quality ratings of turfgrass plots. Appl. Eng. Agric. 2008, 50, 1867–1872. [Google Scholar] [CrossRef]
- Bell, G.E.; Martin, D.L.; Koh, K.; Han, H.R. Comparison of turfgrass visual quality ratings with ratings determined by a handheld optical sensor. Horttechnology 2009, 19, 309–316. [Google Scholar] [CrossRef]
- Bremer, D.J.; Lee, H.; Su, K.; Keeley, S.J. Relationships between normalized difference vegetation index and visual quality in cool-season turfgrass: II. Factors affecting NDVI and its component reflectances. Crop. Sci. 2011, 51, 2219–2227. [Google Scholar] [CrossRef]
- Caturegli, L.; Foschi, L.; Guglieminetti, L.; Bonari, E.; Volterrani, M. Monitoring turfgrass species and cultivars by spectral reflectance. Europ. J. Hort. Sci. 2014, 79, 97–107. [Google Scholar]
- Trenkel, M.E. Slow- and Control-Release and Stabilized Fertilizers: An Option for Enhancing Nutrient Use Efficiency in Agriculture; International Fertilizer Industry Association (IFA): Paris, France, 2010. [Google Scholar]
- Timilsena, Y.P.; Adhikari, R.; Casey, P.; Muster, T.; Gill, H.; Adhikari, B. Enhanced efficiency fertilizers: A review of formulation and nutrient release patterns. J. Sci. Food Agric. 2014, 95, 1131–1142. [Google Scholar] [CrossRef]
- Shaviv, A.; Mikkelsen, R.L. Controlled-release fertilizers to increase efficiency of nutrient use and minimize environmental degradation—A review. Fertil. Res. 1993, 35, 1–12. [Google Scholar] [CrossRef]
- Huckaby, E.C.K.; Wood, C.W.; Guertal, E.A. Nitrogen source effects on ammonia volatilization from warm-season sod. Crop. Sci. 2012, 52, 1379–1384. [Google Scholar] [CrossRef]
- LeMonte, J.L.; Jolley, V.D.; Summerhays, J.S.; Terry, R.E.; Hopkins, B.J. Polymer coated urea in turfgrass maintains vigor and mitigates nitrogen’s environmental impacts. PLoS ONE 2016, 11, e0146761. [Google Scholar] [CrossRef]
- Phillips, J.R. Zunzun.com Online Curve Fitting and Surface Fitting. Available online: http://www.zunzun.com (accessed on 1 September 2015).
- Motulsky, H.J. GraphPad SGuide. Available online: http://www.graphpad.com/guides/prism/7/statistics/index.htm (accessed on 29 September 2016).
- Koch Turf. Available online: https://www.alliednutrients.com/knowledge-center/736.aspx (accessed on 17 July 2023).
- Lee, H.; Bremer, D.J.; Su, K.; Keeley, S.J. Relationships between normalized difference vegetation index and visual quality in turfgrasses: Effects of mowing height. Crop. Sci. 2011, 51, 323–332. [Google Scholar] [CrossRef]
- Ghali, I.E.; Grabow, G.L.; Huffman, R.L.; Miller, G.L. Comparing Digital Image Analysis and Other Turf Quality Measurements in Evaluation of “SMART” Irrigation Technologies; ASABE Paper No. 1009924; St. Joseph, MI, USA, 2010. Available online: https://elibrary.asabe.org/abstract.asp?aid=30018 (accessed on 25 July 2023).
- Leinauer, B.; Van Leeuwen, D.M.; Serena, M.; Schiavon, M.; Sevostianova, E. Digital image analysis and spectral reflectance to determine turfgrass quality. Agron. J. 2014, 106, 1787–1794. [Google Scholar] [CrossRef]
- Bremer, D.J.; Lee, H.; Su, K.; Keeley, S.J. Relationships between normalized difference vegetation index and visual quality in cool-season turfgrass: I. Variation among species and cultivars. Crop. Sci. 2011, 51, 2212–2218. [Google Scholar] [CrossRef]
Disclaimer/Publisher’s Note: The statements, opinions and data contained in all publications are solely those of the individual author(s) and contributor(s) and not of MDPI and/or the editor(s). MDPI and/or the editor(s) disclaim responsibility for any injury to people or property resulting from any ideas, methods, instructions or products referred to in the content. |
© 2023 by the authors. Licensee MDPI, Basel, Switzerland. This article is an open access article distributed under the terms and conditions of the Creative Commons Attribution (CC BY) license (https://creativecommons.org/licenses/by/4.0/).