Abstract
Decision support system tools such as crop models and considering the uncertainties associated with them are important for making an informed decision to fill the yield gap in farms and increase food security. This study’s objective was to identify and quantify the degree to which crop management practices, as well as climate and soil, affected the uncertainty of total biomass, evapotranspiration, and water productivity of silage maize by using a crop model and spatiotemporal input data. Using a calibrated crop model (DSSAT) and pSIMS platform, three planting dates by considering ten ensemble weather data and three soil profile data were simulated for the time period between 2002 and 2017 with a 2 km × 2 km resolution across maize production areas with arid and Mediterranean climates in Isfahan province, Iran. Additionally, the findings were used to determine the yield gap in the studied area to identify opportunities to boost food production. Our results showed larger uncertainty in Mediterranean climates than in arid climates, and it was more affected by planting date than weather parameters and soil profile. The accuracy of total biomass prediction by using pSIMS-CERES-Maize based on the spatiotemporal input data was 1.9% compared to field experimental data in the dry climate, and the yield gap based on the comparison of modified-pSIMS-CERES-Maize and reported biomass was 6.8 to 13 tons ha−1 in the arid and Mediterranean climate. Generally, all results represented the importance of using crop models and considering spatiotemporal data to increase reliability and accuracy, especially in Mediterranean climates, and their potential to increase food production in developing countries with limited water resources and poor agriculture management.
1. Introduction
According to projections, feeding a world population of 9.1 billion people in 2050 will require raising global food production by some 70 percent, almost twice as much in developing countries [1]. From 1970 to 2020, the cropland area increased by approximately 12% (http://faostat.fao.org/ (accessed on 10 May 2023)). However, food security remains a serious concern in developing countries, particularly in arid and semiarid regions. This is primarily due to a range of challenges, such as growing water scarcity for agricultural practices, rising water pollution levels, inadequate management of resources, and the adverse effects of global climate change [2,3]. Among other things, silage maize is an economical source of energy and fiber for dairy cows [4]. The growth of dairy and meat products is highly dependent on an increase in silage maize production. However, this increase should be accompanied by consideration of water availability, particularly in arid regions with limited water resources [5,6,7,8]. Therefore, our current crop production and water management systems need to adapt to the environment and water limitations in order to meet this requirement. To accomplish this goal, using developed tools such as crop models is inevitable. Such tools require reliable soil information, weather data, and information about cropping practices (planting date, cultivar, and fertilization) for the regions of interest [9]. By using these models, farmers can be provided with alternative options for their farming systems based on the limitations present in their area. Additionally, the simulation results can be used to make appropriate management decisions before planting or during the growing season [10]. Numerous models are available to predict crop growth and development, such as STICS (Simulator mulTIdisciplinary for Crop Standard) [11], APSIM (Agricultural Production Systems Simulator) [12], CROPSYST (Cropping systems simulator) [13], WOFOST (WOrld FOod Studies) [14], and among these, the Decision Support System for Agrotechnology Transfer (DSSAT) [15,16] is one of the most widely used [17]. It simulates cropping systems considering soil types, climatic conditions, and management methods. CERES-maize-CSM is a model within the DSSAT package [18] designed to predict maize growth and yield under a variety of management scenarios and environments [19,20]. Despite their convenience and usefulness, tools such as CERES-Maize have various sources of uncertainty associated with model structure, inputs, and parameters that might restrict the capacity of these models to make accurate predictions [21,22] and could make them less reliable. Therefore, risk and uncertainty must be taken into account by decision-makers when making management decisions based on the result of this tool [23]. Evaluating sources of uncertainty and their underlying drivers using accurate spatial soil data and high-resolution long-term weather records is necessary to achieve reliable and transparent results [24]. Researchers have conducted limited studies to consider spatiotemporal variabilities of soil and weather data in different locations, years, and crop management, such as planting dates, irrigation, and fertilizer, as sources of uncertainty [25,26,27,28,29,30]. However, there exists a gap in identifying the variations across diverse climates by considering different management conditions and their potential to uncover the yield gap.
The decision-making process based on the CERES-Maize result considering uncertainty requires a great deal of computation power. Since defining scenarios in point-based running is limited (99 treatments in each experiment file of DSSAT), assessing different options with variability in input data is time-consuming and subject to human error, especially when dealing with numerous points. To accelerate this process, tools such as pSIMS (System for Integrating Impacts Models and Sectors) are required that combine a crop model, estimate yields and externalities of crop production for several pixels covering a region, as well as a system to process input data and run the model over large areas [31]. It also supports the integration of site-based applications and allows researchers to use high-performance computing to run simulations over large spatial extents.
Isfahan province, located in Iran, is a prominent maize production center, despite having a fluctuating climate and receiving an average annual rainfall of only around 115 mm. The importance of maize in this region and the enormous gap between the yield obtained by farmers and its potential have led to comprehensive research into maize [32,33] and the use of crop models [34] to improve knowledge of crop physiology, genetics, soil management, and weather effects. By using soil profiles and historical weather data for a specific point, Ref. [35] ran CERES-Maize manually to find the optimum planting date in this region. However, they did not consider the spatiotemporal variability of soil and weather data, which could highly affect yield results and their variability under different management conditions [36,37,38,39,40].
The objectives of this study were to (1) apply the pSIMS platform and the CERES-Maize model to quantify the uncertainty of TB, WP, and ETC on different planting dates in arid and Mediterranean climates; (2) compare the average TB simulated by the pSIMS platform with the results of point-based running the CERES-Maize model using regional soil profiles and weather data; (3) compare the pSIMS-CERES-Maize results with experimental data; and (4) estimate the gap yield for the studied area.
2. Material and Methods
2.1. Area of Study
The study area covers four main centers of silage maize production in Isfahan province, situated in the center of Iran. Isfahan province is the fourth-largest producer of silage maize in Iran, of which 23,200 ha is devoted to this crop and provides 8.91% of silage maize in Iran. These four regions include west of Isfahan-Borkhar (RG1), Falavarjan (RG2), Golpayegan (RG3), and Fereydan (RG4) (Figure 1).
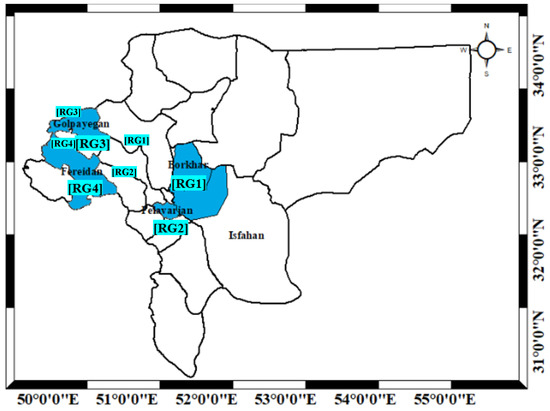
Figure 1.
Location of four studied regions (Isfahan-Borkhar, Falavarjan, Golpayegan, and Fereydan) in Isfahan province.
Based on 15 years of meteorological data (2003–2017) compiled from nearest meteorological station to the study area from the Iranian Meteorological Organization (IMO), the annual average minimum temperatures are 10, 9.5, 8.4, and 4.9 °C, the maximum air temperatures are 24.5, 23.9, 21, and 18 °C, and the 15-year average annual precipitations are 106, 129, 213, and 266 mm for RG1 to RG4, respectively (Figure 2). In addition, based on the De Martonne climate classification method [41], RG1 and RG2 are arid, and RG3 and RG4 are Mediterranean and sub-humid [42].
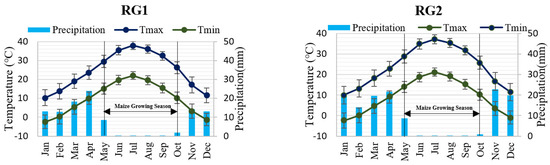
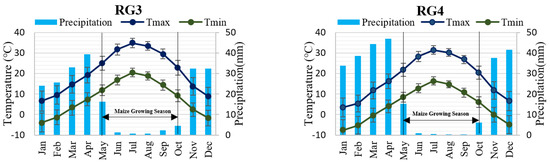
Figure 2.
The 15-year average maximum and minimum air temperature and precipitation over 12 months in four studied regions (Isfahan-Borkhar (RG1), Falavarjan (RG2), Golpayegan (RG3), and Fereydan (RG4)).
2.2. Crop Model and Platform
The CSM-CERES-Maize crop model was used to simulate maize growth and development during the growing season and predict yield across the study area. CERES-Maize is a crop growth model in the DSSAT family (Version 4.5) [43], which consists of crop simulation models for over 28 crops. Based on soil–plant–atmosphere dynamics, CERES-Maize can simulate phenological development, photosynthesis, biomass allocation, and yield. The minimum data requirement for performing crop simulations in DSSAT is daily weather data, including (Tmin, Tmax, rainfall, and solar radiation or sunshine hour), crop genetic coefficients (to represent differences among cultivars), crop management and soil properties (such as percentage of clay and silt) [16].
The pSIMS platform was also used to run CERES-Maize over large spatial areas by considering the spatiotemporal variability of soil and weather data and evaluating the effect of management parameter changes on the results and their uncertainty. pSIMS automates the preparation of input data in DSSAT-compliant formats, running crop simulations on a spatial grid, and aggregation of results. This platform simplified these processes by dividing the simulation process into four main steps: gathering and standardizing data, setting up campaigns, running campaigns, and aggregating results to arbitrary scales [44]. Therefore, in our study, this platform was employed to perform regional crop simulations using DSSAT(CERES-Maize) (Version 4.5) across the farmland of a selected area of Isfahan province at a 0.5 arc-minute resolution (∼2 km grid cells).
2.3. Input Data
SoilGrid [45] and the global soil dataset for earth system modeling (GSDE) [46] were used to assemble soil properties. GSDE provides soil property maps at a 30 arc-second resolution (for eight layers up to a depth of 2.3 m using DSMW, regional, and national soil databases). SoilGrids uses the Global Soil Information Facilities (GSIF), a framework and platform to support widespread, open collaboration in the assembly, collation, and production of global soil information, providing a wide range of soil properties at 7.5 arc-second resolution at various depths: 0, 5, 15, 30, 60, 100, and 200 cm. We used three soil profiles that are based on GSDE (Pr1) and SoilGrids (Pr2 and Pr3) (Supplementary S1). Furthermore, ten ensemble members from the ERA5 reanalysis data products were used to account for uncertainties in weather forces [27]. This global dataset has a 30 km spatial resolution and an hourly temporal resolution developed by the European Centre for Medium-Range Weather Forecasts [47]. The ERA5 temperature data were compared with the nearest weather station data in two studied regions representing different climate conditions (RG2 and RG3) (Supplementary S2).
2.4. Simulation Setup
To investigate the effect of different planting dates on total biomass prediction and its associated uncertainty, three soil profiles and ten weather ensembles were considered, and independent simulations were performed for each region. Management practices included three popular planting dates (18 May: 138 DOY: PD1; 18 June: 169 DOY: PD2; and 8 July: 189 DOY: PD3) for the variety of single-cross 704 in these regions. Simulations were conducted using DSSAT for high farming density in the study areas (Isfahan-Borkhar (RG1), Falavarjan (RG2), Golpayegan (RG3), and Fereydan (RG4)) over 15 years between 2003 and 2017. For this purpose, grid cells with more than 40% farmland were selected, resulting in approximately 600 grid cells for all areas. Out of these 600 grid cells, 290 (48.37%) were located in RG1, 94 (15.67%) in RG2, 80 (13.3%) in RG3, and 136 (22.67%) in RG4. Moreover, in all simulations, irrigation water and fertilizer were applied automatically, without any limitation, based on the plant’s requirement. The genetic coefficient for the selected variety was obtained from Ref. [35] as well. The schematic of the simulation process, utilizing input data and aggregating results, is briefly shown in Figure 3. In the first step, soil and weather data for each selected pixel of the studied area are called according to their geographical location (latitude and longitude), and defined scenarios are retrieved. After that, they are converted to DSSAT format and run parallelly by pSIMS. Once the simulation is completed, the platform aggregates the results in one place for all selected areas.
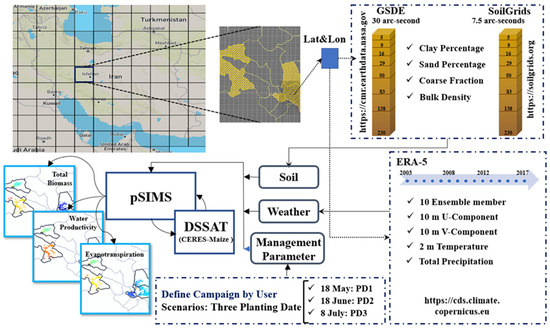
Figure 3.
Expanded schematic of datatypes and processing pipeline.
2.5. Statistical Analysis
To compare and quantify the contribution of considered factors on total biomass, crop evapotranspiration, water use efficiency, and their uncertainty, the standard deviation was calculated for each scenario, followed by an analysis of variance (ANOVA). Statistical analyses were performed using the software IBM-SPSS [48]. Variability was also illustrated by box-and-whisker plots in which the upper and lower box edges represent the first and third quartiles (25th and 75th percentiles). We analyzed all results from each planting date separately, in light of a previous study’s suggestion [26,30] that management practices are one of the most influential factors, and since the primary objective of our study was to assess how management practices affect model predictions and their variability. We calculated results for every planting date using a weighted average of each pixel for a range of soil and weather data over the years within each region.
2.6. Comparison with Point-Based–CERES-Maize Data
The results of pSIMS-CERES-Maize were compared with those obtained with point-based running using measured soil profiles and historical weather data by Ref. [35]. They conducted a simulation of CERES-Maize by using historical weather data of the nearest stations and 5 to 10 measured soil profile data in Isfahan (RG1) and Golpayegan (RG3) to find the best planting date for a specific point of each studied area (Figure 4).
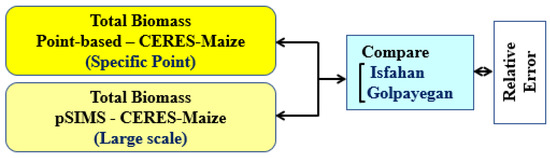
Figure 4.
A schematic of the comparison between the point-based results and the SIMS platform.
2.7. Comparison with Optimum Total Biomass (No Water and No Nutrient Stress) Data
Two experiments conducted in 2016 (EX-1) and 2017 (EX-2) based on full irrigation and no nutrient stress, arranged in a strip-plot design with complete randomized blocks and three replicates [33,49], were used to determine the differences between experimental total biomass and simulated by pSIMS-CERES-Maize. The experimental sites were located in the research farm of the Isfahan University of Technology in Lavark (32.54° N, 51.39° E, 1626 m). Single-cross hybrid 704 (SC704) was planted on 25 June 2016 and 27 June 2017. During the season, the soil received an extra 150 to 180 kg·ha−1 of nitrogen, in addition to an initial 100 kg of nitrogen. Based on these results, a modified coefficient for the Isfahan region (Equation (1)) was derived by comparing the total biomass amount of experimental and pSIMS-CERES-Maize in Isfahan and then assuming it was extensible to other studied areas (Equation (1), Figure 5).
where MC, TBobs, TBpSIMS are modified coefficient, observed total biomass (tons ha−1), and simulated total biomass by pSIMS-CERES-Maize in Isfahan (tons ha−1).
where TBM is modified simulated total biomass.
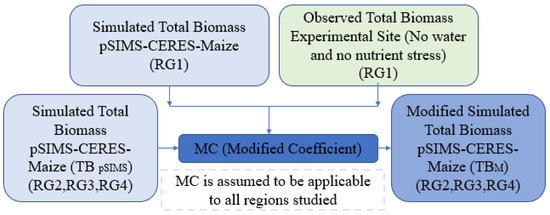
Figure 5.
Process of defining modified coefficient and adjusting simulated total biomass.
The modified simulated results in optimum planting date were compared with 10-year average of actual total biomass reported by Iranian Agriculture Organization in each region to determine the gap between reported and modified simulated total biomass by pSIMS-CERES-Maize.
where TBR is reported actual total biomass by Iranian Agriculture Organization (https://www.maj.ir/ (accessed on 20 December 2022).
3. Results and Discussion
3.1. Crop Meteorology
Across our sites, climate conditions were relatively inconsistent over the growing season. Based on the 15-year (2003–2017) average of data derived from ERA5 (Supplementary S3), the highest average maximum air temperatures during the maize growing season among planting dates in RG1 and RG2 occurred on PD2 by the amount of 33.3 and 32.9 °C, and in RG3 and RG4, they were 30.2 and 27.2 °C, respectively, on PD1. An average minimum air temperature of 15.6, 14.8, 12.3, and 12.2 °C was also observed on PD3 for RG1, RG2, RG3, and RG4, respectively.
The average precipitation varied between 2.5 and 6.1 mm for RG1, 2.1 and 6.2 mm for RG2, 13.1 and 28.3 mm for RG3, and 22.7 and 42.8 mm for RG4 during the maize growing season for all planting dates. Additionally, with 3.8 and 4.0 mm 15-year average precipitation during the maize growing season in RG1 and RG2, 32% of the studied years were higher, 58% lower, and 10% near the mean precipitation. Although, with an average of 36.9 and 18.8 mm per maize growing season in RG3 and RG4, they were 46%, 33%, and 21%, respectively. Generally, based on 2003–2017 average weather data, RG3 and RG4 had more precipitation (33.1 mm differences between RG1 and RG4, and 18.1 mm between RG3 and RG4), and RG1 and RG2 experienced higher temperatures from planting to harvesting of maize (6.3 °C and 3.6 °C more than the maximum temperature in RG3 and RG4, respectively).
3.2. The Temporal Effect on Different Planting Dates and Regions
From a temporal perspective, the SD of total biomass across the region varied for different years (Figure 6). The standard deviation of predicted total biomass over 15 years and four studied areas fluctuated between 0.08 and 2.12 tons ha−1, which is almost 0.4 and 8.5 percent of total biomass. The maximum SD of total biomass in RG1 was 0.52 tons ha−1 in 2009, and in RG2 was 0.56 tons ha−1 in 2016. The SD in regions with lower average temperatures and higher precipitation (RG3 and RG4) showed a higher amount and had more considerable variation among 15 years and three planting dates. The largest SD (2.12 tons ha−1) was found in RG4 in PD2 of 2014 among the studied area. In addition, they changed from 0.12 to 1.13 tons ha−1 in RG3 and 0.15 to 2.12 tons ha−1 in RG4 between three planting dates and 15 years. Compared with an arid climate, the Mediterranean climate experiences more variations in specific planting dates and years. Results for two regions with different climates (RG1 and RG4) showed that in RG4, there were maximum SD differences of 0.29 tons ha−1 in PD1, 1.93 tons ha−1 in PD2, and 0.48 tons ha−1 in PD3. While in RG1, it had lower ranges among planting dates, and it was 0.23, 0.44, and 0.35 tons ha−1 in PD1, PD2, and PD3 over 15 years. This could be associated with more water dynamics (seasonal average precipitation and evapotranspiration) during the growing season in Mediterranean regions in some years. Particularly during summer, rainfall could significantly affect mean temperatures [50]. As rainfall and temperature played a significant role in determining maize yield variations in the NCP [51] and precipitation coincided with the later stages of crop growth, this caused extreme variability in temperature and maize yield in the Loess Plateau region in north China [52].
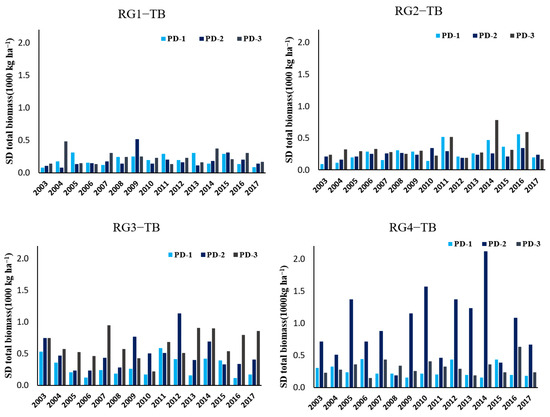
Figure 6.
SD amount of total biomass in 15 years (2003–2017) on the planting dates of 18 May (PD1), 18 June (PD2), and 8 July (PD3) in four studied regions (Isfahan-Borkhar (RG1), Falavarjan (RG2), Golpayegan (RG3), and Fereydan (RG4)).
The highest SD of ETc were also 18.7 mm in RG4, 12.34 mm in RG3, 10.96 mm in RG2, and 6.8 mm per season in RG1 during the growing season among three planting dates and 15 studied years (Figure 7). The variability in ETc was found to be also higher in regions and years with a more considerable variation in temperature and probability of precipitation. According to Ref. [53], extreme temperatures are a better predictor of maize yield due to their effect on soil water demand and transpiration rates. Additionally, since temperature and planting dates determine the length of the growing season [54], they could highly affect crop water demand and crop yield during the planting-to-harvest process.
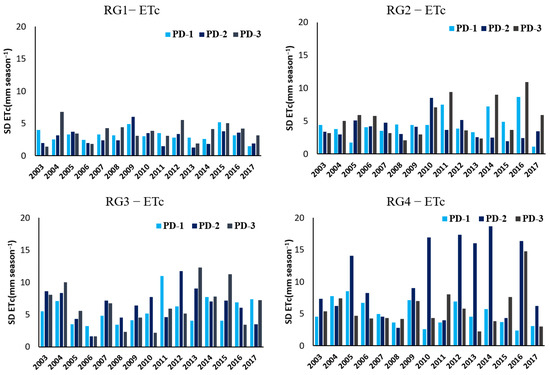
Figure 7.
SD amount of total maize evapotranspiration in growing season in 15 years (2003–2017) on the planting dates of 18 May (PD1), 18 June (PD2), and 8 July (PD3) in four studied regions (Isfahan-Borkhar (RG1), Falavarjan (RG2), Golpayegan (RG3), and Fereydan (RG4)).
3.3. Spatial Patterns of Means and Variability for TB, ETc, and WP
Planting dates and locations had a considerable role in TB, ETc, and WP predictions and their variations (Figure 8 and Figure 9), with different trend patterns across all regions. The simulated average of TB over the studied areas varied from 18.5–23.7 tons ha−1 in PD1, 21.5–25.4 tons ha−1 in PD2, and 17.9–25.6 tons ha−1 in PD3. Among the three planting dates, the highest biomass (25.6 tons ha−1) was in the RG2 (arid climate) and PD3, while the lowest one (17.9 tons ha−1) was in the RG4 (Mediterranean climate) and PD3 (Table 1).
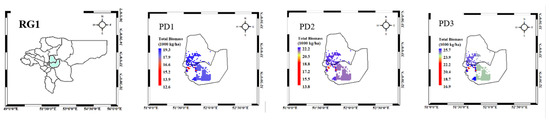
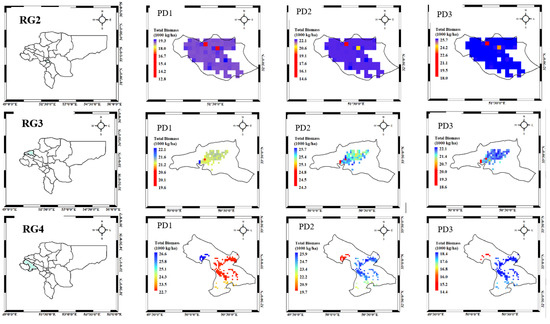
Figure 8.
Average TB results in every farmland pixel of four studied regions (Isfahan-Borkhar (RG1), Falavarjan (RG2), Golpayegan (RG3), and Fereydan (RG4)) on three planting dates (PD1:18 May, PD2:18 June, and PD3:8 July). The scales are varied for different area and planting date.
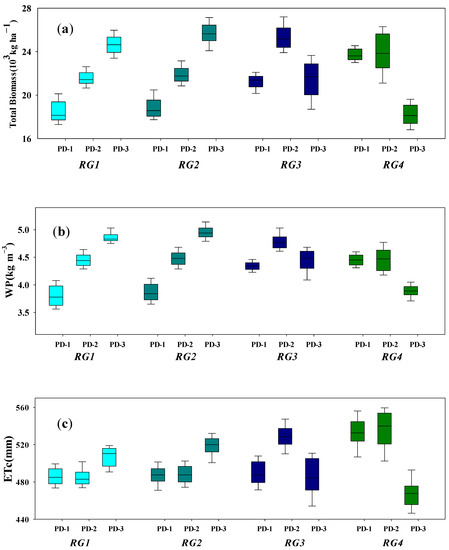
Figure 9.
Results of (a) TB, (b) water productivity, and (c) maize evapotranspiration and their variability on the planting dates of 18 May (PD1), 18 June (PD2), and 8 July (PD3) in four studied regions (Isfahan-Borkhar (RG1), Falavarjan (RG2), Golpayegan (RG3), and Fereydan (RG4)).

Table 1.
Average and SD amount of total biomass (TB), maize evapotranspiration (ETC), and water productivity (WP) in four studied regions (Isfahan-Borkhar (RG1), Falavarjan (RG2), Golpayegan (RG3), and Fereydan (RG4)) on the planting dates of 18 May (PD1), 18 June (PD2), and 8 July (PD3).
Average TB and WP consistently increased by switching planting dates from May to July in warmer areas, while it did not have any specific pattern in colder ones. This could be because of extreme temperatures during the growing season in these regions and the negative correlation between yield and minimum temperature [26].
Comparing TB between PD1 and PD3 in arid climates showed that TB in RG1 increased from 18.5 to 24.6 tons ha−1, and in RG2 increased from 18.9 to 25.6 tons ha−1. However, in the Mediterranean climate, there was no specific variation pattern in RG3, in which TB did not significantly change (21.3 and 21.7tons ha−1), and RG4 showed a reverse trend, with TB decreasing from 23.7 to 17.9 tons ha−1 between PD1 and PD3.
Average ETc for the growing season had the same trend as TB over the studied area. The region with higher ETc showed more TB. The maximum ETC in PD1 was 533 mm in RG4, in PD2, 522 mm in RG3, and in PD3, 518 mm in RG2, which corresponded to TB results.
Additionally, the result showed that planting dates with maximum total biomass and water productivity do not necessarily have the lowest SD and interquartile range (IQR). Moreover, the best planting dates (with high total biomass and low IQR and SD) vary by region. As an example, while in RG1 and RG2, the maximum total biomass was estimated on the PD1, the PD2 had the narrowest interquartile range. Furthermore, changing the planting date had more effect on the SD and IQR in areas such as RG3 and RG4 with the Mediterranean climate. Our result showed a positive correlation between the planting date and the temperature and precipitation variability at the site, which is consistent with Ref. [55]. The planting date controls the length of the growing season, in which the crop accumulates radiation that is positively associated with yield [56]. For instance, switching the planting date from PD1 to PD3 increased the SD biomass from 240 to 550 kg ha−1 in RG3, whereas the interquartile range in RG4 increased from 982 to 1677 kg ha−1. In both cases, the variation in biomass can be attributed to the weather condition variations during the growing season on the different planting dates, in which temperature and precipitation had more variation in these regions. Furthermore, in terms of WP, by planting 1 month later (PD1 to PD2), RG2 results showed a 15.5% increase in average WP with the same SD, while in RG4, the SD amount increased from 0.07 to 0.26 kg m−3 (more than twice) with almost unchanged average WP. The ETc results also revealed remarkable variations in the Mediterranean area compared with the arid region (Figure 9). In addition, comparing variances (ANOVA analysis) across the means of factors (soil, weather, planting date) (Supplementary S4) showed significant differences in planting date factor, that in RG1and RG2, all planting dates were significantly different, and total biomass increased by shifting planting dates later (Table 1). Moreover, in RG1 and RG2, the difference in total biomass was not significant except between PD1 and PD3 in RG3 and between PD1 and PD2 in RG4 (p < 0.05) (Table 2).
Table 2.
Result of ANOVA analysis for planting dates of 18 May (PD1), 18 June (PD2), and 8 July (PD3) in four studied regions on total biomass parameter (Isfahan-Borkhar (RG1), Falavarjan (RG2), Golpayegan (RG3), and Fereydan (RG4)).
The ideal scenario for decision-making was determined based on the total biomass higher than average with the lowest variation while having a lower average and variability of ETc. Figure 10 shows the average total biomass, ETc, and their standard deviation, RG1 and RG2 on the PD3, and RG3 on the PD2, where located in the bottom right corner of the figure are the best results of total biomass across all regions and among three planting dates (with the highest total biomass and lowest SD simultaneously). In addition, RG4 had a high total biomass on planting dates in May and July, though there was a high variability. For ETc, the best scenario was the one with the minimum average ETc and standard deviation, which is shown in the bottom left corner, and on the PD1 and PD3 in RG3 and the PD3 in RG4, ETc and their SD were the lowest.
Figure 10.
Average total biomass (a) and crop evapotranspiration (b) against their SD on the planting dates of 18 May (PD1), 18 June (PD2), and 8 July (PD3) in four studied regions on total biomass parameter (Isfahan-Borkhar (RG1), Falavarjan (RG2), Golpayegan (RG3), and Fereydan (RG4)).
These results highlight that, first of all, when relying on crop models to make decisions, it is important to take local environmental conditions and their temporal variability into account. Assessing the climate variation effects on crop yield along with quantifying uncertainties in estimation is crucial [57,58,59,60], especially in Mediterranean areas with lower average temperatures and a high probability of precipitation with extreme variability of the growing season, in which there is a high potential for uncertainty and variability in the model simulation. Therefore, a precise estimation of how crop yields will be influenced by changing temperatures and precipitation patterns is necessary to comprehend the broader implications of climate impact [61]. Our result showed that it needs special attention, particularly based on the planting dates when the development stage coincides with unstable weather situations and may expose crops to lower temperatures and damage and cause more crop yield variation. Thus, more stable conditions during the maize growing season in arid regions lead to lower uncertainty in total biomass and water productivity simulation. As Ref. [30] demonstrated, management factors had more significant impacts in the colder regions of New Zealand, and the sensitivity of yield to different planting dates showed different patterns across locations. Hence, more carefulness is necessary when utilizing crop models to make decisions in the Mediterranean compared with arid regions.
3.4. Comparison of pSIMS–CERES-Maize and Point-Based–CERES-Maize Result
Average total biomass simulated by pSIMS–CERES-Maize on the best planting date was close to those of Ref. [62] by relative changes of 6.8% and 3.4% in the arid (RG1) and Mediterranean (RG3) regions (Table 3). Since both studies had the same input data for CERES-Maize except weather and soil data, this accuracy confirms the validation of applied data to simulate total biomass by pSIMS over a large scale in arid and Mediterranean regions. In previous studies, applied weather and soil data in the current study (GSDE, SoilGrids, and ERA5) were validated [63,64,65,66], but their effect on total biomass prediction accuracy was not examined. As a result, this methodology would be accurate enough without relying on field measurements of soil properties or weather data. It is also highly recommended, particularly in regions where spatiotemporal data are limited and for large-scale decision-making. However, it is still necessary to have observation-based information during the maize growing season for areas with unpredictable weather [27].
Table 3.
Comparison results of current study adapted form Ref. [62].
3.5. Comparison of pSIMS–CERES-Maize and Experimental Data and Calculate Yield Gap
In comparison with those previously reported in the Isfahan region by full irrigation and no nitrogen limitation with an average total biomass of 21.1 ± 1.9 tons ha−1 [33,49], the results of this study seem feasible in this area, with a difference of almost 1.9% between the simulated and observed results in RG1 region. The modified coefficient (MC) was calculated at 0.98, which was applied to other regions to modify pSIMS–CERES-Maize total biomass. A disparity ranging from 6.8 to 13 tons ha−1 (Table 4) was observed between the average actual total biomass across the studied regions and the modified simulated total biomass calculated using pSIMS–CERES-Maize at the best planting date. Our results also suggest that it may be feasible to reduce the gap and improve yields by focusing on management practices such as planting dates and utilizing decision support models by considering temporal and spatial variability of soil and weather conditions. Furthermore, we can take advantage of established tools such as DSSAT and pSIMS, as well as available data sources.
Table 4.
Comparison results of current study via Farmer result.
4. Conclusions
The results of this study confirm the effectiveness of using the pSIMS platform to run CERES-Maize simulations and explore uncertainties in TB, WP, and ETc while accounting for spatiotemporal variations in input data, such as soil and climates under different planting dates. A significant difference was observed in TB among planting dates with higher standard deviations (SDs) compared with soil and weather data, and variation was higher in the Mediterranean compared with arid climates. The highest biomass production (25.6 tons ha−1) was observed in RG2 (arid climate) and PD3, while the lowest biomass production (17.9 tons ha−1) was recorded in RG4 (Mediterranean climate) and PD3.Temporal effects also showed notable differences in TB and ETc variation among planting dates over 15 years between Mediterranean and arid climates. Furthermore, a comparison of average TB results obtained from the pSIMS–CERES-Maize simulation with point-based–CERES-Maize data showed relative changes of 6.8% and 3.4% in the arid and Mediterranean regions, respectively, confirming the accuracy of the applied spatiotemporal data in TB prediction. The evaluation of predicted TB by pSIMS–CERES-Maize with field experimental data further supported the obtained results, revealing a yield gap ranging from 6.8 to 13 tons ha−1 based on reported data from farmer fields. In conclusion, this study demonstrates the effectiveness of the methodology employed in utilizing the pSIMS platform to predict TB by CERES-Maize and explore uncertainties in crop performance while considering spatiotemporal variations in input data. The results provide low-risk and valuable insights into the potential for increasing food production by identifying yield gaps and optimizing investments in regions to contribute to the enhancement of food security.
Supplementary Materials
The following supporting information can be downloaded at: https://www.mdpi.com/article/10.3390/agriculture13081514/s1, S1: Average and SD amount of soil properties in four studied regions (Isfahan-Borkhar (RG1), Falavarjan (RG2), Golpayegan (RG3) and Fereydan (RG4)); S2: Comparison of maximum and minimum temperatures between nearest station data and ERA5 data in regions RG2 and RG3 throughout the year; S3: Maximum, minimum temperature and precipitation over the crop growth season on the planting date of 18 May (PD1), 18 June (PD2) and 8 July (PD3) in four studied regions (Isfahan-Borkhar (RG1), Falavarjan (RG2), Golpayegan (RG3) and Fereydan (RG4)), S4: Result of ANOVA analysis for soil and weather indexes and their interaction on the planting date of 18 May (PD1), 18 June (PD2) and 8 July (PD3) in four studied regions (Isfahan-Borkhar (RG1), Falavarjan (RG2), Golpayegan (RG3) and Fereydan (RG4)).
Author Contributions
Conceptualization, M.G. (Mahdi Gheysari); Methodology, M.G. (Mahboobe Ghobadi); Formal analysis, H.D.; Investigation, M.G. (Mahboobe Ghobadi); Data curation, M.G. (Mahboobe Ghobadi), M.G. (Mahdi Gheysari), M.S. and H.D.; Writing—original draft, M.G. (Mahboobe Ghobadi); Writing—review & editing, M.G. (Mahdi Gheysari), M.S. and H.D. All authors have read and agreed to the published version of the manuscript.
Funding
This research did not receive any specific grant from funding agencies in the public, commercial, or not-for-profit sectors.
Data Availability Statement
The data presented in this study are available on request from the corresponding author.
Conflicts of Interest
The authors declare no conflict of interest.
References
- FAO. 2009. Available online: https://www.fao.org/3/i0680e/i0680e.pdf (accessed on 1 May 2023).
- Calzadilla, A.; Rehdanz, K.; Betts, R.; Falloon, P.; Wiltshire, A.; Tol, R.S. Climate change impacts on global agriculture. Clim. Chang. 2013, 120, 357–374. [Google Scholar] [CrossRef]
- Rosegrant, M.W.; Ringler, C.; Zhu, T. Water for agriculture: Maintaining food security under growing scarcity. Annu. Rev. Environ. Resour. 2009, 34, 205–222. [Google Scholar] [CrossRef]
- Borreani, G.; Tabacco, E. The relationship of silage temperature with the microbiological status of the face of corn silage bunkers. J. Dairy Sci. 2010, 93, 2620–2629. [Google Scholar] [CrossRef]
- Nilahyane, A.; Islam, M.A.; Mesbah, A.O.; Garcia y Garcia, A. Evaluation of silage corn yield gap: An approach for sustainable production in the semi-arid region of USA. Sustainability 2018, 10, 2523. [Google Scholar] [CrossRef]
- Saseendran, S.A.; Ahuja, L.R.; Ma, L.; Nielsen, D.C.; Trout, T.J.; Andales, A.A.; Chávez, J.L.; Ham, J. Enhancing the water stress factors for simulation of corn in RZWQM2. Agron. J. 2014, 106, 81–94. [Google Scholar] [CrossRef]
- Zhang, G.; Liu, C.; Xiao, C.; Xie, R.; Ming, B.; Hou, P.; Liu, G.; Xu, W.; Shen, D.; Wang, K.; et al. Optimizing water use efficiency and economic return of super high yield spring maize under drip irrigation and plastic mulching in arid areas of China. Field Crops Res. 2017, 211, 137–146. [Google Scholar] [CrossRef]
- Xiao, C.; Zou, H.; Fan, J.; Zhang, F.; Li, Y.; Sun, S.; Pulatov, A. Optimizing irrigation amount and fertilization rate of drip-fertigated spring maize in northwest China based on multi-level fuzzy comprehensive evaluation model. Agric. Water Manag. 2021, 257, 107157. [Google Scholar] [CrossRef]
- Boote, K.J.; Jones, J.W.; Hoogenboom, G.; White, J.W. The role of crop systems simulation in agriculture and environment. Int. J. Agric. Environ. Inf. Syst. 2010, 1, 41–54. [Google Scholar] [CrossRef]
- Hoogenboom, G. Contribution of agrometeorology to the simulation of crop production and its applications. Agric. For. Meteorol. 2000, 103, 137–157. [Google Scholar] [CrossRef]
- Brisson, N.; Gary, C.; Justes, E.; Roche, R.; Mary, B.; Ripoche, D.; Zimmer, D.; Sierra, J.; Bertuzzi, P.; Burger, P.; et al. An overview of the crop model STICS. Eur. J. Agron. 2003, 18, 309–332. [Google Scholar] [CrossRef]
- Holzworth, D.P.; Huth, N.I.; deVoil, P.G.; Zurcher, E.J.; Herrmann, N.I.; McLean, G.; Chenu, K.; van Oosterom, E.J.; Snow, V.; Murphy, C.; et al. APSIM–evolution towards a new generation of agricultural systems simulation. Environ. Model. Softw. 2014, 62, 327–350. [Google Scholar] [CrossRef]
- Stöckle, C.O.; Donatelli, M.; Nelson, R. CropSyst, a cropping systems simulation model. Eur. J. Agron. 2003, 18, 289–307. [Google Scholar] [CrossRef]
- De Wit, A.; Boogaard, H.; Fumagalli, D.; Janssen, S.; Knapen, R.; van Kraalingen, D.; Supit, I.; van der Wijngaart, R.; van Diepen, K. 25 years of the WOFOST cropping systems model. Agric. Syst. 2019, 168, 154–167. [Google Scholar] [CrossRef]
- Jones, J.W.; Hoogenboom, G.; Porter, C.H.; Boote, K.J.; Batchelor, W.D.; Hunt, L.A.; Wilkens, P.W.; Singh, U.; Gijsman, A.J.; Ritchie, J.T. The DSSAT cropping system model. Eur. J. Agron. 2003, 18, 235–265. [Google Scholar] [CrossRef]
- Hoogenboom, G.; Porter, C.H.; Shelia, V.; Boote, K.J.; Singh, U.; White, J.W.; Pavan, W.; Oliveira, F.A.A.; Moreno-Cadena, L.P.; Lizaso, J.I.; et al. Decision Support System for Agrotechnology Transfer (DSSAT), Version 4.8; (DSSAT.net); DSSAT Foundation: Gainesville, FL, USA, 2021. [Google Scholar]
- Jones, J.W.; Antle, J.M.; Basso, B.; Boote, K.J.; Conant, R.T.; Foster, I.; Godfray, H.C.J.; Herrero, M.; Howitt, R.E.; Janssen, S.; et al. Brief history of agricultural systems modeling. Agric. Syst. 2017, 155, 240–254. [Google Scholar] [CrossRef]
- Jones, C.A.; Kiniry, J.R. (Eds.) CERES-Maize: A Simulation Model of Maize Growth and Development; Texas A&M University Press: College Station, TX, USA, 1986. [Google Scholar]
- Song, L.; Jin, J. Improving CERES-Maize for simulating maize growth and yield under water stress conditions. Eur. J. Agron. 2020, 117, 126072. [Google Scholar] [CrossRef]
- Malik, W.; Isla, R.; Dechmi, F. DSSAT-CERES-maize modelling to improve irrigation and nitrogen management practices under Mediterranean conditions. Agric. Water Manag. 2019, 213, 298–308. [Google Scholar] [CrossRef]
- Walker, W.E.; Harremoës, P.; Rotmans, J.; Van Der Sluijs, J.P.; Van Asselt, M.B.; Janssen, P.; Krayer von Krauss, M.P. Defining uncertainty: A conceptual basis for uncertainty management in model-based decision support. Integr. Assess. 2003, 4, 5–17. [Google Scholar] [CrossRef]
- Tao, F.; Rötter, R.P.; Palosuo, T.; Gregorio Hernández Díaz-Ambrona, C.; Mínguez, M.I.; Semenov, M.A.; Kersebaum, K.C.; Nendel, C.; Specka, X.; Hoffmann, H.; et al. Contribution of crop model structure, parameters and climate projections to uncertainty in climate change impact assessments. Glob. Chang. Biol. 2018, 24, 1291–1307. [Google Scholar] [CrossRef]
- Han, E.; Ines, A.V.; Baethgen, W.E. Climate-Agriculture-Modeling and Decision Tool (CAMDT): A software framework for climate risk management in agriculture. Environ. Model. Softw. 2017, 95, 102–114. [Google Scholar] [CrossRef]
- Lobell, D.B.; Asseng, S. Comparing estimates of climate change impacts from process-based and statistical crop models. Environ. Res. Lett. 2017, 12, 015001. [Google Scholar] [CrossRef]
- Ramirez-Villegas, J.; Koehler, A.K.; Challinor, A.J. Assessing uncertainty and complexity in regional-scale crop model simulations. Eur. J. Agron. 2017, 88, 84–95. [Google Scholar] [CrossRef]
- Ojeda, J.J.; Rezaei, E.E.; Kamali, B.; McPhee, J.; Meinke, H.; Siebert, S.; Webb, M.A.; Ara, I.; Mulcahy, F.; Ewert, F. Impact of crop management and environment on the spatio-temporal variance of potato yield at regional scale. Field Crops Res. 2021, 270, 108213. [Google Scholar] [CrossRef]
- Dokoohaki, H.; Kivi, M.S.; Martinez-Feria, R.; Miguez, F.E.; Hoogenboom, G. A comprehensive uncertainty quantification of large-scale process-based crop modeling frameworks. Environ. Res. Lett. 2021, 16, 084010. [Google Scholar] [CrossRef]
- Tao, F.; Zhang, Z. Climate change, high-temperature stress, rice productivity, and water use in Eastern China: A new superensemble-based probabilistic projection. J. Appl. Meteorol. Climatol. 2013, 52, 531–551. [Google Scholar] [CrossRef]
- Wu, R.; Lawes, R.; Oliver, Y.; Fletcher, A.; Chen, C. How well do we need to estimate plant-available water capacity to simulate water-limited yield potential? Agric. Water Manag. 2019, 212, 441–447. [Google Scholar] [CrossRef]
- Teixeira, E.I.; Zhao, G.; de Ruiter, J.; Brown, H.; Ausseil, A.G.; Meenken, E.; Ewert, F. The interactions between genotype, management and environment in regional crop modelling. Eur. J. Agron. 2017, 88, 106–115. [Google Scholar] [CrossRef]
- Folberth, C.; Elliott, J.; Müller, C.; Balkovic, J.; Chryssanthacopoulos, J.; Izaurralde, R.C.; Jones, C.D.; Khabarov, N.; Liu, W.; Reddy, A.; et al. Uncertainties in global crop model frameworks: Effects of cultivar distribution, crop management and soil handling on crop yield estimates. Biogeosci. Discuss. 2016, 1–30. [Google Scholar] [CrossRef]
- Gheysari, M.; Sadeghi, S.H.; Loescher, H.W.; Amiri, S.; Zareian, M.J.; Majidi, M.M.; Asgarinia, P.; Payero, J.O. Comparison of deficit irrigation management strategies on root, plant growth and biomass productivity of silage maize. Agric. Water Manag. 2017, 182, 126–138. [Google Scholar] [CrossRef]
- Gheysari, M.; Pirnajmedin, F.; Movahedrad, H.; Majidi, M.M.; Zareian, M.J. Crop yield and irrigation water productivity of silage maize under two water stress strategies in semi-arid environment: Two different pot and field experiments. Agric. Water Manag. 2021, 255, 106999. [Google Scholar] [CrossRef]
- Dokoohaki, H.; Gheysari, M.; Mousavi, S.F.; Zand-Parsa, S.; Miguez, F.E.; Archontoulis, S.V.; Hoogenboom, G. Coupling and testing a new soil water module in DSSAT CERES-Maize model for maize production under semi-arid condition. Agric. Water Manag. 2016, 163, 90–99. [Google Scholar] [CrossRef]
- Mohamadzade, F.; Gheysari, M.; Eshghizadeh, H.; Tabatabaei, M.S.; Hoogenboom, G. The effect of water and nitrogen on drip tape irrigated silage maize grown under arid conditions: Experimental and simulations. Agric. Water Manag. 2022, 271, 107821. [Google Scholar] [CrossRef]
- Angulo, C.; Rötter, R.; Trnka, M.; Pirttioja, N.; Gaiser, T.; Hlavinka, P.; Ewert, F. Characteristic ‘fingerprints’ of crop model responses to weather input data at different spatial resolutions. Eur. J. Agron. 2013, 49, 104–114. [Google Scholar] [CrossRef]
- Chen, S.; Jiang, T.; Ma, H.; He, C.; Xu, F.; Malone, R.W.; Feng, H.; Yu, Q.; Siddique, K.H.; He, J. Dynamic within-season irrigation scheduling for maize production in Northwest China: A Method Based on Weather Data Fusion and yield prediction by DSSAT. Agric. For. Meteorol. 2020, 285, 107928. [Google Scholar] [CrossRef]
- Tofa, A.I.; Chiezey, U.F.; Babaji, B.A.; Kamara, A.Y.; Adnan, A.A.; Beah, A.; Adam, A.M. Modeling planting-date effects on intermediate-maturing maize in contrasting environments in the Nigerian Savanna: An Application of DSSAT Model. Agronomy 2020, 10, 871. [Google Scholar] [CrossRef]
- Attia, A.; El-Hendawy, S.; Al-Suhaibani, N.; Tahir, M.U.; Mubushar, M.; dos Santos Vianna, M.; Ullah, H.; Mansour, E.; Datta, A. Sensitivity of the DSSAT model in simulating maize yield and soil carbon dynamics in arid Mediterranean climate: Effect of soil, genotype and crop management. Field Crops Res. 2021, 260, 107981. [Google Scholar] [CrossRef]
- Fry, J.; Guber, A.K.; Ladoni, M.; Munoz, J.D.; Kravchenko, A.N. The effect of up-scaling soil properties and model parameters on predictive accuracy of DSSAT crop simulation model under variable weather conditions. Geoderma 2017, 287, 105–115. [Google Scholar] [CrossRef]
- de Martonne, E. Une nouvelle function climatologique: L’indice d’aridité. Meteorologie 1926, 2, 449–459. [Google Scholar]
- Yaghmaei, L.; Soltani, S.; Khodagholi, M. Bioclimatic classification of Isfahan province using multivariate statistical methods. Int. J. Climatol. 2009, 29, 1850–1861. [Google Scholar] [CrossRef]
- Hoogenboom, G.; Porter, C.H.; Boote, K.J.; Shelia, V.; Wilkens, P.W.; Singh, U.; White, J.W.; Asseng, S.; Lizaso, J.I.; Moreno, L.P.; et al. The DSSAT crop modeling ecosystem. In Advances in Crop Modelling for a Sustainable Agriculture; Burleigh Dodds Science Publishing: Cambridge, UK, 2019. [Google Scholar]
- Elliott, J.; Kelly, D.; Chryssanthacopoulos, J.; Glotter, M.; Jhunjhnuwala, K.; Best, N.; Wilde, M.; Foster, I. The parallel system for integrating impact models and sectors (pSIMS). Environ. Model. Softw. 2014, 62, 509–516. [Google Scholar] [CrossRef]
- Hengl, T.; Mendes de Jesus, J.; Heuvelink, G.B.; Ruiperez Gonzalez, M.; Kilibarda, M.; Blagotić, A.; Shangguan, W.; Wright, M.N.; Geng, X.; Bauer-Marschallinger, B.; et al. SoilGrids250m: Global gridded soil information based on machine learning. PLoS ONE 2017, 12, e0169748. [Google Scholar] [CrossRef]
- Shangguan, W.; Dai, Y.; Duan, Q.; Liu, B.; Yuan, H. A global soil data set for earth system modeling. J. Adv. Model. Earth Syst. 2014, 6, 249–263. [Google Scholar] [CrossRef]
- Hersbach, H.; Bell, B.; Berrisford, P.; Hirahara, S.; Horányi, A.; Muñoz-Sabater, J.; Nicolas, J.; Peubey, C.; Radu, R.; Schepers, D.; et al. The ERA5 global reanalysis. Q. J. R. Meteorol. Soc. 2020, 146, 1999–2049. [Google Scholar] [CrossRef]
- IBM Corporation. IBM SPSS Statistics; IBM Corporation: Armonk, NY, USA, 2017. [Google Scholar]
- Tabatabaei, M. Investigation of Water and Nitrogen Use Efficiency and Yield of Silage Maize under Drip-Tape Irrigation Management. Master’s Thesis, Department of Water Engineering, College of Agriculture, Isfahan University of Technology, Isfahan, Iran, 2017. (In Persian). [Google Scholar]
- Domroes, M.; El-Tantawi, A. Recent temporal and spatial temperature changes in Egypt. Int. J. Climatol. 2005, 25, 51–63. [Google Scholar] [CrossRef]
- Sun, H.; Zhang, X.; Wang, E.; Chen, S.; Shao, L.; Qin, W. Assessing the contribution of weather and management to the annual yield variation of summer maize using APSIM in the North China Plain. Field Crops Res. 2016, 194, 94–102. [Google Scholar] [CrossRef]
- Ray, D.K.; Gerber, J.S.; MacDonald, G.K.; West, P.C. Climate variation explains a third of global crop yield variability. Nat. Commun. 2015, 6, 5989. [Google Scholar] [CrossRef] [PubMed]
- Lobell, D.B.; Hammer, G.L.; McLean, G.; Messina, C.; Roberts, M.J.; Schlenker, W. The critical role of extreme heat for maize production in the United States. Nat. Clim. Chang. 2013, 3, 497–501. [Google Scholar] [CrossRef]
- Suyker, A.E.; Verma, S.B. Evapotranspiration of irrigated and rainfed maize–soybean cropping systems. Agric. For. Meteorol. 2009, 149, 443–452. [Google Scholar] [CrossRef]
- Saseendran, S.A.; Ma, L.; Nielsen, D.C.; Vigil, M.F.; Ahuja, L.R. Simulating planting date effects on crop production using RZWQM and CERES-maize models. Agron. J. 2005, 97, 58–71. [Google Scholar]
- Lindquist, J.L.; Arkebauer, T.J.; Walters, D.T.; Cassman, K.G.; Dobermann, A. Maize radiation use efficiency under optimal growth conditions. J. Agron. 2005, 97, 72–78. [Google Scholar] [CrossRef]
- Chapagain, R.; Remenyi, T.A.; Harris, R.M.; Mohammed, C.L.; Huth, N.; Wallach, D.; Rezaei, E.E.; Ojeda, J.J. Decomposing crop model uncertainty: A systematic review. Field Crops Res. 2022, 279, 108448. [Google Scholar] [CrossRef]
- Li, T.; Hasegawa, T.; Yin, X.; Zhu, Y.; Boote, K.; Adam, M.; Bregaglio, S.; Buis, S.; Confalonieri, R.; Fumoto, T.; et al. Uncertainties in predicting rice yield by current crop models under a wide range of climatic conditions. Glob. Chang. Biol. 2015, 21, 1328–1341. [Google Scholar] [CrossRef] [PubMed]
- Asseng, S.; Ewert, F.; Rosenzweig, C.; Jones, J.; Hatfield, J.; Ruane, A.; Boote, K.; Thorburn, P.; Rötter, R.; Cammarano, D. Uncertainty in simulating wheat yield. Nat. Clim. Chang. 2013, 3, 827–832. [Google Scholar] [CrossRef]
- Malhi, G.S.; Kaur, M.; Kaushik, P. Impact of climate change on agriculture and its mitigation strategies: A review. Sustainability 2021, 13, 1318. [Google Scholar] [CrossRef]
- Zimmermann, A.; Webber, H.; Zhao, G.; Ewert, F.; Kros, J.; Wolf, J.; Britz, W.; de Vries, W. Climate change impacts on crop yields, land use and environment in response to crop sowing dates and thermal time requirements. Agric. Syst. 2017, 157, 81–92. [Google Scholar] [CrossRef]
- Mohamadzade, F. Plan of Agricultural Water Management with an Emphasis on the Increasing Water Use Efficiency of Maize in Isfahan Province Based on Field Research and Using DSSAT. Ph.D. Thesis, Department of Water Science and Engineering, College of Agriculture, Isfahan University of Technology, Isfahan, Iran, 2017. (In Persian). [Google Scholar]
- Jiao, D.; Xu, N.; Yang, F.; Xu, K. Evaluation of spatial-temporal variation performance of ERA5 precipitation data in China. Sci. Rep. 2021, 11, 17956. [Google Scholar] [CrossRef]
- Tarek, M.; Brissette, F.P.; Arsenault, R. Evaluation of the ERA5 reanalysis as a potential reference dataset for hydrological modelling over North America. Hydrol. Earth Syst. Sci. 2020, 24, 2527–2544. [Google Scholar] [CrossRef]
- Stoorvogel, J.J.; Mulder, V.L. A comparison, validation, and evaluation of the s-world global soil property database. Land 2021, 10, 544. [Google Scholar] [CrossRef]
- Huang, S.; Eisner, S.; Haddeland, I.; Mengistu, Z.T. Evaluation of two new-generation global soil databases for macro-scale hydrological modelling in Norway. J. Hydrol. 2022, 610, 127895. [Google Scholar] [CrossRef]
Disclaimer/Publisher’s Note: The statements, opinions and data contained in all publications are solely those of the individual author(s) and contributor(s) and not of MDPI and/or the editor(s). MDPI and/or the editor(s) disclaim responsibility for any injury to people or property resulting from any ideas, methods, instructions or products referred to in the content. |
© 2023 by the authors. Licensee MDPI, Basel, Switzerland. This article is an open access article distributed under the terms and conditions of the Creative Commons Attribution (CC BY) license (https://creativecommons.org/licenses/by/4.0/).