Abstract
Plastic shopping bags are often discarded as litter and can be carried away from roadsides and become tangled on cotton plants in farm fields. This rubbish plastic can end up in the cotton at the gin if not removed before harvest. These bags may not only cause problems in the ginning process but might also become embedded in cotton fibers, reducing the quality and marketable value. Therefore, detecting, locating, and removing the bags before the cotton is harvested is required. Manually detecting and locating these bags in cotton fields is a tedious, time-consuming, and costly process. To solve this, this paper shows the application of YOLOv5 to detect white and brown colored plastic bags tangled at three different heights in cotton plants (bottom, middle, top) using Unmanned Aircraft Systems (UAS)-acquired Red, Green, Blue (RGB) images. It was found that an average white and brown bag could be detected at 92.35% and 77.87% accuracies and a mean average precision (mAP) of 87.68%. Similarly, the trained YOLOv5 model, on average, could detect 94.25% of the top, 49.58% of the middle, and only 5% of the bottom bags. It was also found that both the color of the bags (p < 0.001) and their height on cotton plants (p < 0.0001) had a significant effect on detection accuracy. The findings reported in this paper can help in the autonomous detection of plastic contaminants in cotton fields and potentially speed up the mitigation efforts, thereby reducing the amount of contaminants in cotton gins.
1. Introduction
Plastic contamination in U.S. cotton is a prevalent issue and a matter of concern for both ginners and the entire supply chain of the cotton industry. Considering the severity of the problem, the U.S. Department of Agriculture’s Agricultural Marketing Service (USDA-AMS) began implementing new extraneous matter codes (71 and 72) for cotton classification in 2018 [1]. Plastic contaminants in cotton significantly reduce the fiber’s marketable value, lowering the price paid by yarn spinners to growers [2,3,4]. Plastic contaminants in cotton can come from various sources like plastic wraps on round cotton modules, plastic mulch used in crop production, and from other sources at various stages of the supply chain starting in the field [5,6]. Contaminants may come from plastic rubbish, commonly plastic shopping bags, that are carried by the wind from roadsides and then become entangled with cotton plants across cotton fields [7]. During harvesting, mechanical cotton pickers and strippers do not separate this material from the cotton, and it becomes embedded in seed cotton modules. Plastic contaminants often find their way into the processing machinery of cotton gins [2] and become embedded in cotton bales that are ultimately shipped to spinners. Efforts are being made to design a machine vision (MV)-based automated control system at cotton gins to detect and remove plastic contaminants [2]. However, detecting, locating, and removing plastic contaminants in the field before harvest can minimize the amount that ends up at the gin, thereby reducing the requirement for MV detection at that point. The only current option for field removal is human observation, which is too time-consuming, costly, and inefficient to be a viable process. To solve this problem, earlier studies used unmanned aircraft systems (UAS) with a multispectral camera to detect and locate shopping bags in cotton fields [6,8]. A classifier based on a classical machine learning (ML) algorithm was trained with image-based spectral and textural features of plastic shopping bags [6]. The method resulted in a detection accuracy of over 64% in a cotton field before defoliation. In addition to having inadequate detection accuracy (90% or better is desirable), this method was time-consuming, requiring field data collection and offline image processing, meaning the plastic bags could only be located after a day or so when the images had been processed with the developed algorithm.
Traditional approaches of object detection [6,9] involve feature extraction based on either histogram analysis—such as Histogram of Oriented Gradient (HOG) [10,11] and Edge Orientation Histograms (EOH) [12]—or on image textures [13]. Both HOG and EOH count occurrences of gradient orientation in a localized space of an image, while texture-based approaches calculate the spatial variation of image tones depending on statistics like contrast and entropy [14]. Various methods have been tested to detect and identify foreign matter in cotton. For instance, Himmelsbach et al. [4] used Fourier transform infrared spectroscopy to detect contaminants in cotton fibers. Foreign particles in cotton fiber were identified based on differences in absorbance over a range of wavelengths. This kind of approach is practical for laboratory settings but not in the field because detection with this method requires controlled conditions and is slow and expensive.
Deep learning (DL), on the other hand, can detect objects quickly in the field with good accuracy, which is desirable for efficient contamination removal in the field [15,16]. DL based on remotely sensed images is an attractive approach to achieve near real-time detection and location of plastic bags in cotton fields with improved detection accuracy. DL-based algorithms have been successively used for object detection tasks in many agricultural applications [15,16,17,18,19]. Among many DL-based algorithms, You Only Look Once version 5 (YOLOv5) is a state-of-the-art CNN architecture for real-time object detection. Similar to its earlier versions, YOLOv5 is a one-stage detector in which regression is used for detection and localization, but it is much faster and more accurate than previous versions, with inference speeds of up to 110 frames per second (FPS) [20,21] and 142 FPS [22] as compared to the older versions’ average inference speed of 33 FPS [23,24]. Inference speed varies depending on hardware, image quality, and the size and number of objects present in the images. The end goal of this research is to deploy a trained model for real-time plastic bag detection, which requires high inference speeds; therefore, YOLOv5 was selected for this study. Until the release of YOLOX in 2021 [25], YOLOv5 was the latest version of the YOLO family of object detection algorithms. It has four variants: YOLOv5s, YOLOv5m, YOLOv5l, and YOLOv5x, where s, m, l, and x represent small, medium, large, and extra-large versions, respectively, in terms of network depth and number of parameters. The values for the original and scaled-down versions are shown in Table 1.

Table 1.
Original and scaled-down variants of YOLOv5.
In the current study, the four scaled-down versions were used. The objectives of this study are as follows: (i) to determine how well YOLOv5 can be used to detect plastic shopping bags in a cotton field; (ii) to determine how the color of plastic shopping bags affects average precision (AP) and accuracy; (iii) to determine how YOLOv5-variant (s, m, l, and x) affects AP, accuracy, mean average precision (mAP@50), and inference speed for different color bags; (iv) to identify an optimal YOLOv5-variant based on a desirability function dependent upon AP for brown and white bags, mAP@50, accuracy, and inference speed; (v) to determine the effect of height of plastic bags on cotton plants on the overall detection accuracy of the most desirable YOLOv5-variant.
2. Materials and Methods
2.1. Experiment Site
To mimic the natural occurrence of grocery store plastic shopping bags in cotton fields, we manually tied a total of 180 plastic bags, 90 white and 90 brown, on cotton plants in a cotton field (26°9′51.62″ N, 97°56′29.66″ W) located near Weslaco in Hidalgo County, Texas (Figure 1). The bags were tied at three different heights (top, middle, and bottom) on the plants before defoliation. The order in which the bags were tied to plants followed a randomized sequence generated by Microsoft Excel software (Microsoft Corporation, Redmond, Washington, DC, USA). The field had been planted with cotton seed of the Phytogen 350 W3FE variety (CORTEVA agriscience, Wilmington, DE, USA). The soil at the experimental site includes two types: Hidalgo sandy clay loam and Raymondville clay loam [26].
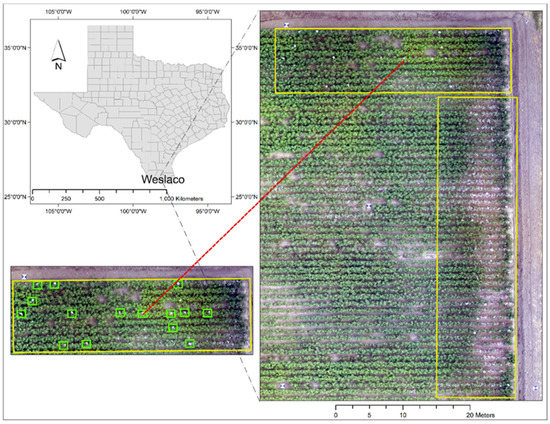
Figure 1.
An orthomosiac aerial image showing the experimental plot where white and brown colored plastic shopping bags were tied on cotton plants, as seen in yellow and green boxes.
2.2. Data Acquisition
A three-band (RGB: red, green, and blue) FC6360 camera (Shenzhen DJI Sciences and Technologies Ltd., Shenzhen, China) integrated on a DJI Phantom P4 quadcopter (Shenzhen DJI Sciences and Technologies Ltd., Shenzhen, China) was used to collect aerial images of the test field from an altitude of 18.28 m (60 feet) above ground level (AGL). Pix4DCapture (Pix4D S.A., Prilly, Switzerland) software was used on a regular smartphone running iOS version 13.5 (Apple Inc., Cupertino, CA, USA) to control the quadcopter in flight. The camera has an image resolution of 1600 × 1300 pixels. The 71 images collected had a ground sampling distance (GSD) of approximately 1 cm/pixel (0.40 inch/pixel). Five ground control points (GCPs) were used for georeferencing aerial images by placing four of them at the corners of the field and one in the middle (Figure 1). An EMLID Reach RS+ (Emlid, Hong Kong, China) GPS unit was used to collect GPS coordinates of the center of the five GCPs. Data were collected on 23 July 2020, between 10 a.m. and 2 p.m. Central Standard Time (CST).
2.3. Image Data Preparation
After the aerial images were collected, they were used to generate an orthomosiac with Pix4DMapper 4.3.33 software (Pix4D S.A., Prilly, Switzerland) which were georeferenced using the GPS coordinates of the five GCPs (Figure 1). The orthomosiac was used only as an aid in visually locating areas of interest on the ground. Individual RGB images of 1600 × 1300 pixels were split into 416 × 416 pixels with Python version 3.8.10 (Python Software Foundation, DE, USA) script [27]. Image augmentation techniques were subsequently applied to increase the number of images in the dataset with the Python library developed by Bloice et al. [28]. The following operations, along with the corresponding probabilities, were used in the augmentation pipeline: rotate with a probability value of 0.7, flip_left_right with a probability of 0.4, zoom_random with a probability of 0.4, percentage_area of 0.8, and flip_top_bottom with a probability of 0.4. These probability values determined the chance of applying the operation each time an image passed through the augmentation pipeline. Once an operation was chosen to be applied, parameter values were randomly applied from within the set range. A total of 1000 samples were generated in each of the 5 iterations, resulting in a total of 5000 augmented images. However, many of these images did not contain either white or brown plastic bags. All such images were discarded, and only the images that contained at least one bag were used, resulting in a total of 1410 images. Then, 10 sets of image data were allocated, with each set containing 141 images. Each of the 10 datasets was divided into training, validation, and testing data in the ratio of 15:3:2. The LabelImg V-1.8.0 [29] software tool was used for annotating ground truth bounding boxes for the two classes, white bags (wb) and brown bags (bb). All these processes can be seen in a workflow pipeline flowchart in Figure 2.
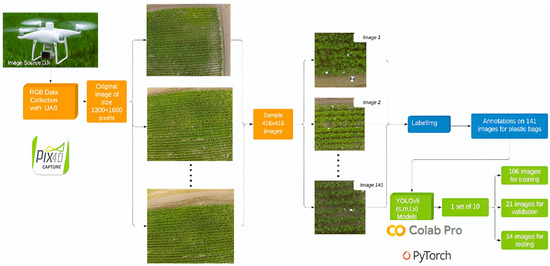
Figure 2.
Workflow pipeline showing the entire processes involved during the study, from image data collection to YOLOv5 model training, validation, and testing.
2.4. YOLOv5 Architecture
All four versions of YOLOv5 have similar architectures that vary in depth and network parameters. To understand the function of YOLOv5, one can consider the architecture of YOLOv5s, shown in Figure 3, as generated by the visualization software, Netron version 4.8.1 [30]. The architecture has a total of 25 nodes, also known as modules [31], which are named model/0 to model/24. The first 10 modules form the backbone network, the next 14 modules form the neck network, and the last module forms the head/detection network of the architecture (Figure 3). The backbone and neck network collectively form the feature extractor, while the head/detection network forms the predictor or detector. In model/24, i.e., detection/head network, the value of nc = 2 represents the number of classes the YOLOv5 network was customized to detect.
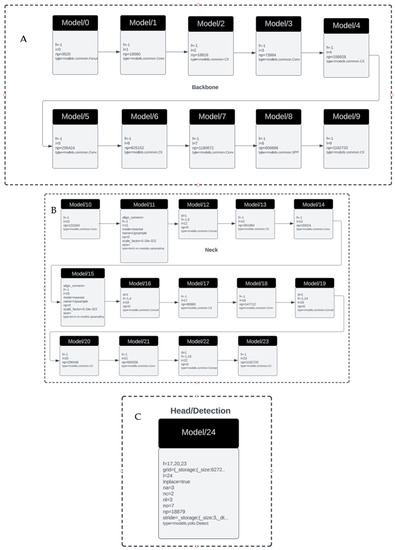
Figure 3.
Customized YOLOv5s network architecture for detecting 2 classes as generated by Netron visualization software. The backbone, neck, and head sections are shown in (A–C), respectively.
YOLOv5 is a single-stage detector that uses a “hard-swish” activation function that makes it faster to train as well as to detect [15]. “Hard-swish”, i.e., h-swish, is a modified version of the “swish” activation function that is mathematically defined by Equations (1) and (2) [32,33].
2.5. YOLOv5 Training, Performance Metrics, and Desirability Function
The source code for YOLOv5 was obtained from the Ultralytics Inc. GitHub repository of YOLOv5 [34]. Selected model hyperparameters are shown in Table 2. The PyTorch framework (Facebook AI Research Lab, Menlo Park, CA, USA) with torch version 1.9.0 and Compute Unified Device Architecture (CUDA) version 10.2 (NVIDIA, Santa Clara, CA, USA) were used to implement YOLOv5. The auto anchoring function of YOLOv5 generated 4.5 anchors per target object based on the annotated ground truth bounding boxes (BBs). Original values from the source code were used for enhancement coefficients of hue (0.015), saturation (0.7), and lightness (0.4). Stochastic gradient descent (SGD) was used as the optimization algorithm for each version. SGD is a method of minimizing an objective function during model training by randomly choosing a single data point from a batch of data points, thereby reducing computation time to speed up the training process [35]. Google Colaboratory Pro (Google LLC, Mountain View, CA, USA) was used to train YOLOv5 on Tesla P100 GPU-16GB (NVIDIA, Santa Clara, CA, USA). All four versions of YOLOv5 were trained for 250 iterations with a batch size of 4, using 106 training, 21 validation, and 14 test images, resulting in a total step size of 6625. YOLOv5 was pre-trained on COCO datasets for 80 different classes [36]. The pre-trained weights were used as the starting point, and YOLOv5 was customized for 2 classes based on a custom dataset. Each trained model was saved in pt format and later used for detection.
Table 2.
YOLOv5 hyperparameters used for this study.
To evaluate the trained models on each of the ten datasets, precision (P), recall (R), average precision (AP), mean average precision (mAP), accuracy, and F1-score were used as performance metrics. These metrics were calculated based on generalized intersection over union loss (GIoUloss), confidence over objectness loss, and classification over probability loss. The equations to calculate these metrics are given below.
where N is the number of classes (N = 2 in our case for wb and bb), TP is the number of true positives, TN is the number of true negatives, FP is the number of false positives, FN is the number of false negatives, APk is the AP of class k, and n is the number of thresholds (n = 1 in our case). Precision is a measure of TP over predicted positives, while recall is a measure of TP rate and is also sometimes called sensitivity. Accuracy, on the other hand, is an overall measure of true detection. F1-score is the harmonic mean of P and R, i.e., reciprocal of the arithmetic mean of reciprocals of P and R. All these metrics are determined based upon different losses that are calculated as shown below.
Confidence Loss/Objectness Loss=
Classification/Probability Loss=
In Equation (9), λcoord is the penalty coefficient associated with the central coordinate of the predicted bounding box (BB), s2 is the number of grid cells generated on the input image, and B is the total number of predefined BB, i.e., the anchors, which is equal to 9 (3 at each scale). In Equations (10) and (11), the existence and absence of an object in the predicted BB are represented by ‘obj’ and ‘nobj’, respectively. Similarly, represents the class of the predicted object, represents the class of the ground truth object, and λnobj represents the penalty coefficient associated with the confidence loss. Even though these metrics are widely used for evaluating the performance of the trained model and its associated classifier, one must be careful about two important aspects: the way data are sampled and the balance between different classes in sampled datasets. Xie and Braga–Neto [37] found that precision as a performance metric may not be reliable and can be severely biased under separate sampling conditions. The sampling technique used in this research was kept consistent to avoid bias induced by sampling discrepancy. Similarly, Luque et al. [38] showed that an imbalance in the proportion of instances between positive and negative classes could affect classification accuracy, and they proposed geometric mean (GM) or Bookmaker Informedness as the most bias-free metrics. To solve this issue, YOLOv5 also uses focal loss [39].
In addition to evaluating each model’s performance separately, the best model had to be identified among all four variants (s, m, l, and x) based on the performance metrics and inference time. Identifying the best overall model would enable its deployment on a UAS using CV for real-time plastic bag detection in a cotton field. Since this problem is similar to optimization with multiple response variables, the desirability function was used to convert all the response variables into a single one by first scaling them from 0 to 1, then taking their geometric mean (GM), and finally, combining them as shown in Equation (12) [40,41].
Here, D is the overall desirability of all the p response variables (in our case, p = 4) denoted by d1,d2 …dp. In our case, d1 = mAP, d2 = accuracy of white bags, d3 = accuracy of brown bags, and d4 = inference speed. To implement this function, JMP Pro version 15.2.0 software was used (SAS Institute, Cary, NC, USA). In this study, the response goals for mAP and accuracies for white and brown bags were set to 1, 0.85, and 0.8 for high, middle, and low, respectively, and then the desirability was maximized using constrained Newton’s method as explained by Dennis and Schnabel [42].
2.6. Experiment Design
To achieve the second objective, a fixed effect model was designed to examine the effect of the color of plastic shopping bags on AP and accuracy with all four variants of the YOLOv5 model. A total of 10 observations were made by randomly selecting 10 sets of 14 test images containing both white and brown plastic shopping bags and then attempting to detect them with the trained YOLOv5s, YOLOv5m, YOLOv5l, and YOLOv5x models. Assuming Yijc is the j-th observation from treatment group ic, where ic = W, B, and jc= 1,2,3, …10, the fixed effect model can be expressed as:
Here, µ.c is the average of all the treatment group means, while ɛijc is the error, or the residual term, for the fixed effect model, and αic is the i-th treatment effect. The null and alternative hypotheses for this model can be shown as
The first step was to test the normality assumption with the Shapiro–Wilk test at the 95% confidence level (α = 0.05) with Python’s SciPy Stats module [43]. Then, the model effect test was conducted with the Standard Least Squares (SLS) personality fit with JMP Pro version 15.2.0 software (SAS Institute, Cary, NC, USA). The SLS method is used to fit linear models for continuous response variables using the method of least-squares.
To achieve the third objective, a fixed effect model was designed to test the effects of YOLOv5 versions on the AP, mAP, and inference speed for white and brown bags. Again, there were 10 observations, 4 treatment groups (YOLOv5s, YOLOv5m, YOLOv5l, and YOLOv5x), and 4 output metrics (AP for white bags, AP for brown bags, mAP, and inference speed). Assuming Yij is the j-th observation from treatment group I, where i = s, m, l, x, and j = 1,2,3, …10, the fixed effect model can be expressed as
Here, µ. is the average of all the treatment group means, while ɛij is the error (the residual term) for the fixed effect model, and αi is the i-th treatment effect. The null and alternate hypotheses for this model can be shown as
Like the previous case, the normality assumption was first tested, and then the model effect, with SLS personality fit with JMP Pro version 15.2.0 software (SAS Institute, NC, USA). Finally, to choose the optimal YOLOv5 model, the desirability function in the prediction profiler graphs obtained from the YOLOv5 model type effect tests was used.
Once the most desirable variant of YOLOv5 was chosen, a fixed effect model test was performed to determine the effect of the height of plastic bags (top, middle, and bottom) on the overall detection accuracy by the trained YOLOv5 model. For these, 10 random image samples (416 × 416 pixels) were chosen, and the most desirable variant of the trained YOLOv5 model was used for the detection of plastic bags. The number of detected bags was matched visually with the experiment layout to determine the number of top, middle, and bottom bags detected out of the total top, middle, and bottom bags present in each image. Then, a percentage ratio for each (top, middle, and bottom) was calculated. This is called bag-based accuracy hereon.
3. Results
3.1. Overall Performance of YOLOv5 for Plastic Bag Detection in Cotton Field
Figure 4 shows the three types of losses that were calculated and plotted for training and validation datasets.
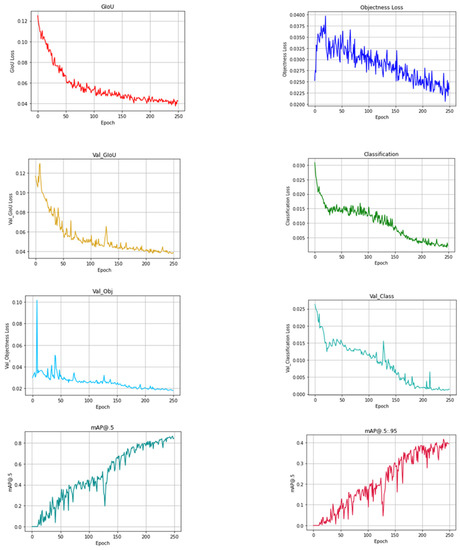
Figure 4.
Example plots showing different losses and performance metrics based on training and validation datasets for YOLOv5s.
The plot titles with val_ as the prefix were obtained from the validation dataset. Based on the 40 total observations (10 observations from 4 variants of YOLOv5), the mean AP for white bags was 90.53% with a standard deviation of 0.08. The mean AP for brown bags was 84.84% with a standard deviation of 0.06. The mean of mAP was found to be 87.68% with a standard deviation of 0.05. The accuracy for white bags had a mean of 92.35% and a standard deviation of 0.05. The mean accuracy for brown bags was 77.87% with a standard deviation of 0.11. The mean inference speed was 81.43 FPS with a standard deviation of 39.78. Figure 5A is a precision-recall plot obtained after training YOLOv5s with one of the 10 observation datasets. The areas under these curves can be used to determine AP for white bags (wb) and brown bags (bb), as well as mAP corresponding to both. Figure 5B includes plots of the F1-score against confidence values, which are directly proportional to a confidence value of around 0.33. After that point, the F1-score starts to decrease with increasing confidence values, indicating that the predicted BBs can be associated with more confidence about the presence of included objects but also that they are less precise and accurate for predicted classes (wb and bb). Until the confidence value of approximately 0.62, the predicted BBs are more accurate, precise, and sensitive about wb, but after this point, they become more precise, sensitive, and accurate about bb. Figure 6 is a confusion matrix heat map in which white bags have a higher true positive rate than brown bags. Figure 7 includes some results of the trained model used for detection on the test dataset.
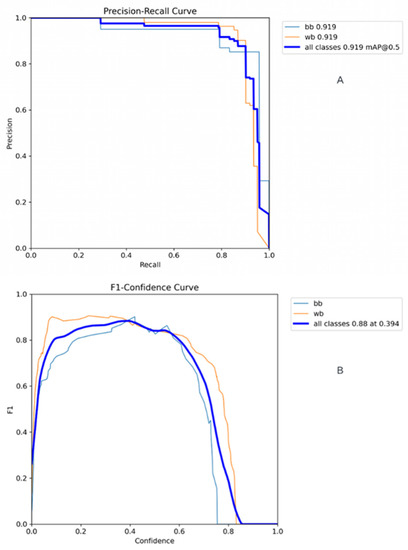
Figure 5.
(A) Precision recall curve that was obtained after one of the training processes. (B) Example of F1-score values plotted against confidence scores.
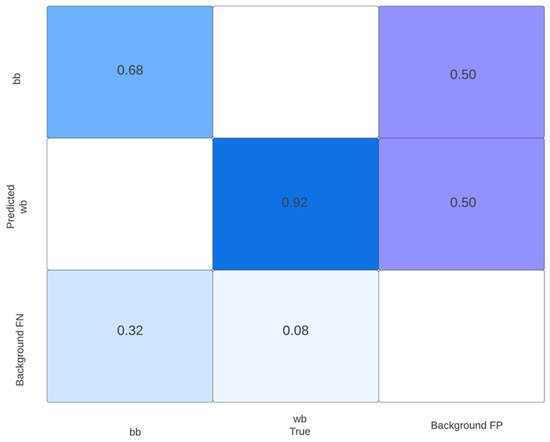
Figure 6.
Example of confusion matrix obtained after training YOLOv5s and using 1 of the 10 validation datasets. Here, darker colors represent higher classification accuracies while lighter colors represent lower classification accuracies.
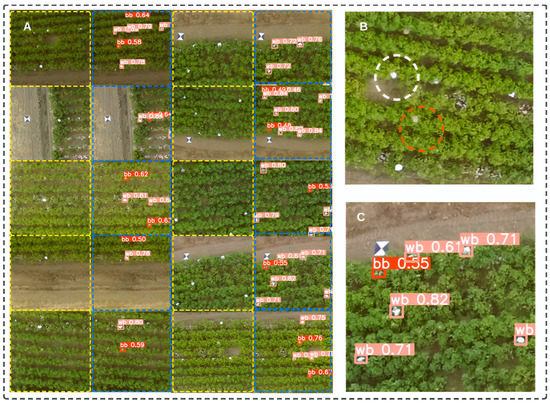
Figure 7.
(A) Example images showing white and brown plastic bags being detected by trained YOLOv5s within predicted BBs and the corresponding class confidence scores. The images enclosed by dotted yellow rectangles are the test images, and the ones within dotted blue rectangles are the ones on which detection results are present. (B) Enlarged version of image showing white and brown color bags in corresponding color dotted circles. (C) Enlarged image showing detection results.
3.2. Color Effect Tests
When the color effect model was tested on the four versions of YOLOv5, the resulting histogram and density plots (Figure 8, Figure 9, Figure 10 and Figure 11) showed the distribution of AP and accuracy for each version (s, m, l, and x) as well as side-by-side box plots with lines connecting their means and medians along with pair-wise Student’s t-test values. Based on 10 observations for both white and brown bags, the mean of AP values for s, m, l, and x models were 89.85%, 90.15%, 87.94%, and 82.81% with standard deviations of 0.06, 0.05, 0.07, and 0.11, respectively. The overall mean accuracies for s, m, l, and x were 84.80%, 88.95%, 85.85%, and 80.85%, respectively. Based on colors, both the AP and accuracy for white bags were significantly higher than the brown bags for s and l (Figure 8 and Figure 10). However, for m and x, only the accuracy for white bags was significantly higher than the brown bags (Figure 9 and Figure 11). The AP and accuracies were expected to be higher with increasing size and depth of the model, but this was true only from s to m, not from m to l or l to x. A possible reason for this could be that there were fixed numbers of training iterations for all versions. Hence, the l and x versions may not have reached convergence during the 250 iterations. In this study, it was necessary to fix the hyperparameter values for consistency in results comparisons. Table 3 shows the results of the effect of the color of plastic bags on AP and accuracy for all four model versions. There was evidence to determine that color had a significant effect (α = 0.05) on accuracy for all four versions. Similarly, there was evidence to determine that color had a significant effect on AP for s and l but not for m and x at the 5% significance level. From the boxplots of accuracy as a function of the color of the bags, white bags had significantly higher accuracy than brown bags (Figure 12).
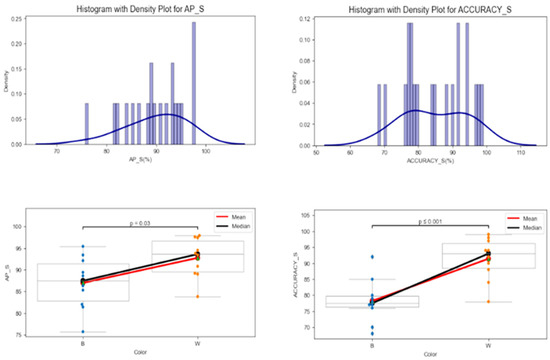
Figure 8.
Distribution of average precision (AP) and accuracy for YOLOv5s as well as for white and brown color plastic shopping bags. The blue dots are for brown colored plastic bags and orange dots are for white colored plastic bags.
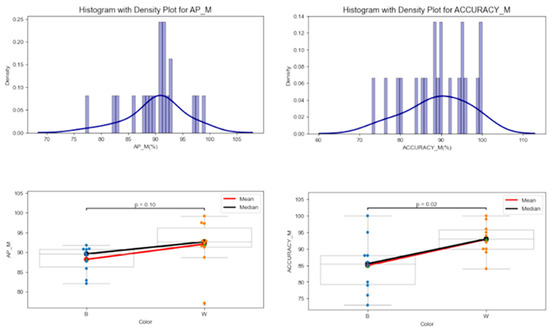
Figure 9.
Distribution of average precision (AP) and accuracy for YOLOv5m as well as for white and brown color plastic shopping bags. The blue dots are for brown colored plastic bags and orange dots are for white colored plastic bags.
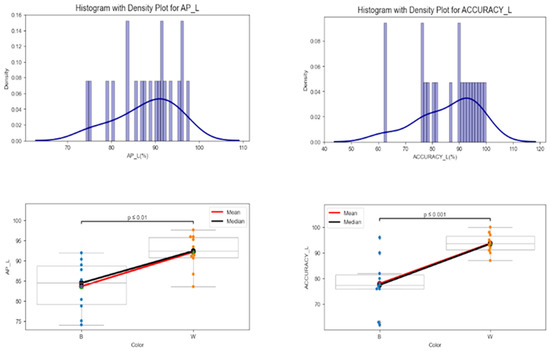
Figure 10.
Distribution of average precision (AP) and accuracy for YOLOv5l as well as for white and brown color plastic shopping bags. The blue dots are for brown colored plastic bags and orange dots are for white colored plastic bags.
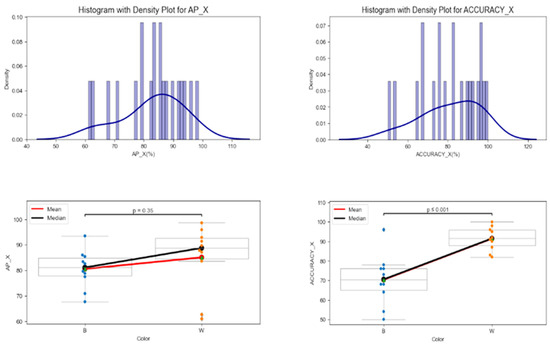
Figure 11.
Distribution of average precision (AP) and accuracy for YOLOv5x as well as for white and brown color plastic shopping bags. The blue dots are for brown colored plastic bags and orange dots are for white colored plastic bags.
Table 3.
Plastic bag color effect test on average precision and accuracy of different variants of YOLOv5.
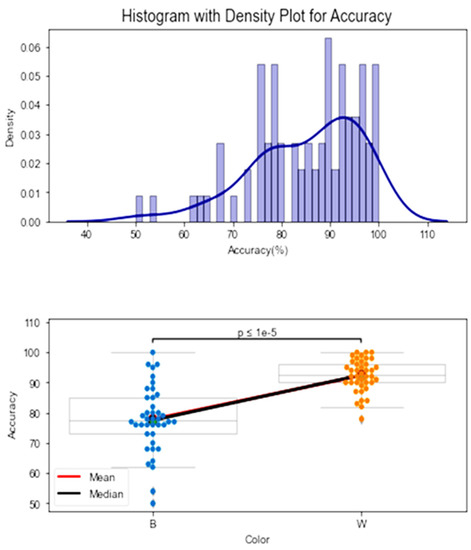
Figure 12.
Distribution of overall accuracy of the YOLOv5 models as well as accuracy for white and brown color plastic shopping bags. The blue dots are for brown colored plastic bags and orange dots are for white colored plastic bags.
A chart showing difference inference times that were obtained by testing 14 images during each of the 10-test datasets.
3.3. Model Type Effect Tests
Values of AP, accuracies, mAP, and inference times for the model effect test are given in Table 4. The model type did not have a significant effect on accuracy and AP for white bags, but it did have a significant effect in all the other metrics (α = 0.05). In part, this means that the detection of white bags was not affected by the choice of model, whereas the detection of brown bags was affected by the type of model used. Furthermore, inference time (i.e., detection speed) depends on the choice of model regardless of bag color. This result was expected because larger models are deeper with many more parameters that require more processing time, as evidenced by the different inference times obtained for each observation test dataset and for all four versions (Figure 13). The distribution of mAP for the four YOLOv5 version models can be seen in Figure 14, with histogram and density plots as well as side-by-side box plots with means and medians connected by lines. Pair-wise Student’s t-test values are also shown with the boxplots. The most consistent distribution can be seen for YOLOv5m, but there was an outlier. The mean and median lines are almost parallel between YOLOv5s and YOLOv5m, indicating similar performance. The lines decline from YOLOv5m to YOLOv5l and from YOLOv5l to YOLOv5x, indicating a sequential decrease in the mAP for the larger models. As mentioned earlier, this result can be attributed to the fact that the larger models were likely not trained adequately for their losses to converge. Mean accuracy increased from s to l but decreased from l to x; however, the decrease was not significant. The model type did not have a significant effect on overall accuracy except between m and x (Figure 14).
Table 4.
YOLOv5 Model type effect test on AP, accuracy, and mAP for white and brown color plastic bags.
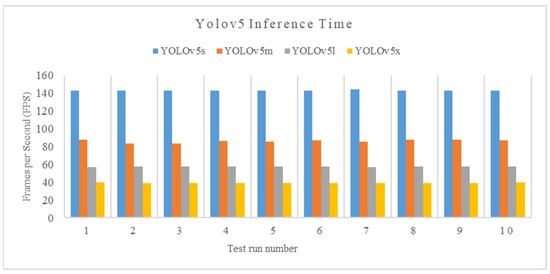
Figure 13.
A chart showing difference inference times that were obtained by testing 14 images during each of the 10-test dataset.
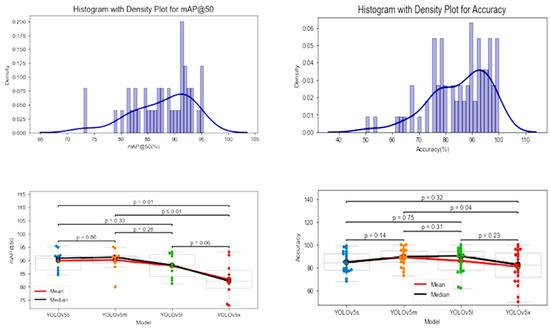
Figure 14.
Distribution of accuracies and mean average precision (mAP) for all four variants of the YOLOv5 model. The blue, orange, green and red dots are for small, medium, large and extra-large variants of the YOLOv5 model respectively.
3.4. Desirability Function as Optimization Method
The most important of the six metrics (AP and accuracy for white and brown bags, mAP, and inference time) were the inference speed, accuracy, and mAP, because the goal was to find an optimal YOLOv5 model with the greatest detection accuracies for white and brown plastic bags at a higher inference speed that can be deployed on a GPU for near real-time detection. The maximum desirability obtained was nearly 0.95 for YOLOv5m, which had the maximum inference speed of 86 FPS, with accuracies for white and brown bags greater than 92% and 85%, respectively, and mAP greater than 90% (Figure 15).
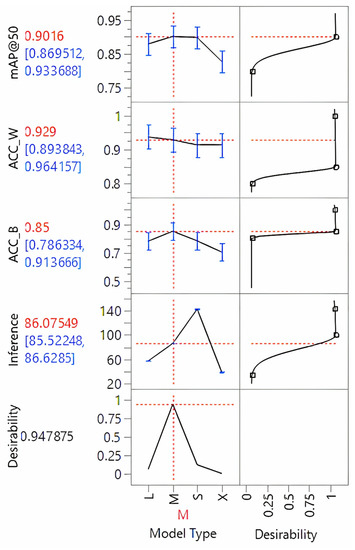
Figure 15.
Prediction profilers show maximum desirability for the YOLOv5m (M) model.
3.5. Plastic Bag Height Effect Test
Once the most desirable variant of YOLOv5 was found, i.e., YOLOv5m, it was used to test how the height of plastic bags on cotton plants affects its detection accuracy (bag-based detection accuracy). Bag-based detection accuracies, i.e., the percentage of top, middle, and bottom bags that were detected in each of the ten test images, are shown in Table 5.
Table 5.
Effect test of plastic bag height on bag-based detection accuracy. Top, middle, and bottom show the percentage of corresponding bags detected in each of the ten test images on which the trained YOLOv5m model was used.
It was found that, on average, 94.25% of the top bags (white and brown), 49.58% of the middle bags (white and brown), and 5% of the bottom bags (white and brown) were detected by the trained YOLOv5m model. A fixed effect model test determined that the height of plastic bags had a significant effect (p < 0.0001) on bag-based detection accuracy.
4. Discussion
4.1. Overall Performance of YOLOv5
Results from this study showed that YOLOv5 was able to detect plastic shopping bags in aerial images of a cotton field with an overall accuracy of 92% for white bags, 78% for brown bags, and mAP of 88%. This means that using the deep learning method, detection accuracy for white bags improved by nearly 19%, for brown bags by 18%, and the overall detection accuracy improved by 24% when compared to the previous methods used [6]. Apart from higher detection accuracy, this method was also able to perform detection at speeds that make it practically viable for near real-time detection (Figure 13). Therefore, this approach can be used to potentially enable field robots like unmanned ground vehicles to remove the bags autonomously, as proposed by Hardin et al. [44]. It was also found that the overall detection accuracy of white bags was significantly higher than that of brown bags. This result was expected because the brown bags had lower contrast with their surroundings, particularly those that were tied at the bottom of the plants and looked like the soil in the background. This is in agreement with the findings by Liu et al. [45], in which detection of aircraft by YOLOv5 decreased due to the white background, as most of the aircraft are white in color.
It is known that the deeper the CNN network, the better the performance. Deeper networks learn better [46,47], explaining why, in most cases, the performance of YOLOv5x > YOLOv5l > YOLOv5m > YOLOv5s [22]. Results of our study showed this to be true for YOLOv5s and YOLOv5m, but the performance was found to be less for YOLOv5l and YOLOv5x. There can be multiple reasons for this, one of which may be attributed to the fact that the larger and deeper models were not trained enough to enable the losses to converge within the fixed 250 iterations. DL and ML models are stochastic in nature; hence fine-tuning hyperparameter values of the l and x other than the ones in Table 1 can result in different and perhaps higher detection results. However, for a fair comparison, all four versions were trained with the same number of iterations and fixed values of hyperparameters, as explained in Section 5 and Section 6.
4.2. Effect of Color of Bags on YOLOv5 Performance
From this study, it was found that the color of plastic bags had a significant effect on overall detection accuracy for all four variants of YOLOv5. White bags were always detected with higher accuracy than brown bags, as was expected due to their higher contrast with the background. This result could be different if the cotton plants had many open bolls, thus creating a white background and making the detection of white bags difficult due to their decreased contrast with the background. An interesting finding was that bag color had a significant effect on AP for YOLOv5s and YOLOv5l but not for the YOLOv5m and YOLOv5x. This means that the m and x models were fine-tuned and trained such that the AP of these models was robust to the changes in the color of plastic bags.
4.3. Effect of Model Type
Findings from this study indicated that YOLOv5m performed the best in terms of overall accuracy and mAP followed by YOLOv5s, YOLOv5l, and YOLOv5x. However, no significant effect was found on the overall detection accuracy of plastic bags except between YOLOv5m and YOLOv5x. These results suggest that if any of the models are trained adequately, they can be used for plastic bag detection in cotton fields without major concerns about detection accuracy. This is only true if computation cost is not an issue, which in practical situations is always a matter of concern.
4.4. Optimal Model
Computation cost in terms of time, energy to operate the system, money, etc., has always been a concern when deploying CV algorithms on edge computing devices [48,49]. In our study, we focused on finding the optimal YOLOv5 model out of the four variants, keeping the detection accuracies for white and brown bags at least 80% and inference speed of at least 35 FPS. The desirability function, as explained in Section 2.5, was helpful in determining the most practically viable model for near real-time detection of plastic shopping bags in cottonfields, which is YOLOv5m.
4.5. Effect of Plastic Bag Height
The bag-based detection accuracies were found to be relatively consistent for the top and bottom bags, with a standard deviation of 12.80 and 15.81, respectively; however, in the case of middle bags, it was highly inconsistent, with a standard deviation of 46.17. On average, the trained YOLOv5m was able to detect top bags with significantly higher detection accuracy than the bottom bags. This is as expected because most of the bags at the bottom remained hidden under the canopy of cotton plants and, therefore, could not be seen in the aerial images collected by the UAS. The middle bags were detected at higher accuracy than the bottom bags but at a significantly lower value than the top bags.
4.6. Limitations
The findings of this study are limited by the fact that fixed hyperparameters and training iterations were used for all YOLOv5 variants, such that deeper models like YOLOv5l and YOLOv5x apparently failed to converge their losses. These models would likely perform better if trained for a greater number of iterations. Furthermore, the inference speed reported here is for a GPU that is part of a high-performance computing system that is not readily available for practical applications in field conditions. Hence, the inference speed may be significantly different for a field-based computing platform. In addition, this study reports the findings based on images collected from 18.28 m (60 feet) above ground limit (AGL), and therefore, the results may improve when high-resolution images are collected from either lower elevation or using a high-resolution camera or combination of both.
5. Conclusions
In conclusion, this paper demonstrates the successful utilization of YOLOv5 for detecting white and brown plastic shopping bags in a cotton field using RGB aerial images obtained from UAS. The average accuracies achieved were 92.35% and 77.87% for white and brown bags, respectively, with an mAP of 87.68%. Compared to classical ML methods previously employed, YOLOv5 exhibited a 24% higher overall accuracy in bag detection. The study also highlights the significant influence of bag color and height on cotton plants on detection accuracies, concluding that YOLOv5m is the most practical model for near real-time detection. Furthermore, the analysis reveals that top bags were detected with significantly higher accuracy (94.25%) compared to middle (49.58%) and bottom bags (5%). Additionally, it was observed that the background color had a detrimental effect on the detection accuracy of plastic shopping bags. Consequently, it is recommended to survey cotton fields before the open boll stage, during the period when the leaves are green and the cotton bolls are closed, to ensure that the aerial images are free of white and brown backgrounds that may hinder YOLOv5’s performance. Moreover, it is advised to conduct surveys when the plant canopies are not overly dense to avoid overlooking bags entangled at the bottom of cotton plants, which often remain undetected and may require manual scouting.
6. Future Work
Since YOLOv5 is built upon a PyTorch (Facebook AI Research Lab, Menlo Park, CA, USA) framework, which is written in Python programming language, it is easy to deploy on embedded systems like GPUs. The inference results (Figure 9) are promising for real-time object detection. However, these were obtained on Tesla P100 GPU -16GB (NVIDIA, Santa Clara, CA, USA), which provides computation speed not possible to deploy at “the edge” (i.e., at the source of image data generation, a UAS with camera and GPU). The goal of this research is to deploy the developed AI model on a low-cost and lightweight edge computing device that can be easily mounted on a UAS. Developing near real-time computation on an edge computing device will be part of future research. The future work will also involve the extraction of central coordinates of detected BBs with plastic shopping bags and then georeferencing them to a geodetic coordinate system that might allow ground-based robots to collect the detected plastic shopping bags. Ideally, detection and coordinate extraction will be performed in near real-time with the trained YOLOV5m model on a low-cost, lightweight GPU device mounted along with a camera on a UAS.
Author Contributions
Conceptualization, P.K.Y., J.A.T. and E.L.W.; methodology, P.K.Y. and J.A.T.; software, P.K.Y.; validation, P.K.Y. and J.A.T.; formal analysis, P.K.Y. and J.A.T.; investigation, P.K.Y., J.A.T., R.H., S.W.S., U.B.-N., S.C.P., R.R.III and D.E.M.; resources, J.A.T., R.H. and J.E.; data curation, P.K.Y. and J.A.T.; writing—original draft preparation, P.K.Y.; writing—review and editing, P.K.Y., J.A.T., R.H., S.W.S., U.B.-N., S.C.P., R.R.III, D.E.M., J.E., K.M. and E.L.W.; visualization, P.K.Y. and J.A.T.; supervision, J.A.T. and R.H.; project administration, J.A.T. and R.H.; funding acquisition, J.A.T. All authors have read and agreed to the published version of the manuscript.
Funding
This project was supported by Cotton Incorporated Inc. and Texas A&M AgriLife Research.
Institutional Review Board Statement
Not applicable.
Data Availability Statement
All data that support the findings of this study are available from the corresponding author upon reasonable request.
Acknowledgments
We would like to extend our sincere thanks to all the personnel involved, including Roy Graves, Madison Hodges, Thiago Marconi, Jorge Solórzano Diaz, and Uriel Cholula, for their contribution during fieldwork.
Conflicts of Interest
The authors declare that they have no known competing financial interests or personal relationships that could have appeared to influence the work reported in this paper.
References
- Robbins, R.F. New Extraneous Matter Code for Plastic Contaminants in Cotton Samples, Memphis, TN, USA. 2018. Available online: https://mymarketnews.ams.usda.gov/sites/default/files/resources/2018-08/New%20Extraneous%20Matter%20Code%20for%20Plastic%20Contaminants%20in%20Cotton%20Samples_0.pdf (accessed on 8 July 2023).
- Pelletier, M.G.; Holt, G.A.; Wanjura, J.D. A Cotton Module Feeder Plastic Contamination Inspection System. AgriEngineering 2020, 2, 280–293. [Google Scholar] [CrossRef]
- Whitelock, D.; Pelletier, M.; Thomasson, A.; Buser, M.; Xu, B.; Delhom, C.; Hardin, R. Current University and USDA Lab Cotton Contamination Research. Beltwide Cotton Conferences. 2018, pp. 516–520. Available online: http://www.cotton.org/beltwide/proceedings/2005-2019/data/conferences/2018/papers/18518.pdf#page=1 (accessed on 4 June 2021).
- Himmelsbach, D.S.; Hellgeth, J.W.; McAlister, D.D. Development and use of an Attenuated Total Reflectance/Fourier Transform Infrared (ATR/FT-IR) spectral database to identify foreign matter in cotton. J. Agric. Food Chem. 2006, 54, 7405–7412. [Google Scholar] [CrossRef] [PubMed]
- Wanjura, J.; Pelletier, M.; Ward, J.; Hardin, B.; Barnes, E. Prevention of Plastic Contamination When Handling Cotton Modules; Cotton Incorporated: Cary, NC, USA, 2020; pp. 1–10. [Google Scholar]
- Yadav, P.K.; White, E.L.; Thomasson, J.A.; Cholula, U.; Marconi, T.; Enciso, J. Application of UAV Remote Sensing for Detecting Plastic Contaminants in Cotton Fields. In Proceedings of the Beltwide Cotton Conferences, Austin, TX, USA, 8–10 January 2020; pp. 817–823. [Google Scholar]
- Blake, C.; Sui, C.; Yang, R. UAV-Based Multispectral Detection of Plastic Debris In Cotton Fields. In Proceedings of the 2020 Beltwide Cotton Conferences, Austin, TX, USA, 8–10 January 2020; Volume 53, pp. 560–564. [Google Scholar]
- Byler, R.K.; Boykin, J.C.; Hardin, R.G. 2013: Removal of Plastic Sheet Material with Normal Cotton Ginning Equipment. In Proceedings of the Beltwide Cotton Conferences, San Antonio, TX, USA, 7–10 January 2013; pp. 676–685. [Google Scholar]
- Hardin, R.G.; Byler, R.K. Removal of sheet plastic materials from seed cotton using a cylinder cleaner. J. Cotton Sci. 2016, 20, 375–385. [Google Scholar] [CrossRef]
- Dalal, N.; Triggs, B. Histograms of oriented gradients for human detection. In Proceedings of the 2005 IEEE Computer Society Conference on Computer Vision and Pattern Recognition (CVPR’05), San Diego, CA, USA, 20–25 June 2005. [Google Scholar] [CrossRef]
- Ren, X.; Ramanan, D. Histograms of Sparse Codes for Object Detection. In Proceedings of the 2013 IEEE Conference on Computer Vision and Pattern Recognition, Portland, OR, USA, 23–28 June 2013; pp. 3246–3253. [Google Scholar] [CrossRef]
- Whitehill, J.; Littlewort, G.; Fasel, I.; Bartlett, M.; Movellan, J. Toward practical smile detection. IEEE Trans. Pattern Anal. Mach. Intell. 2009, 31, 2106–2111. [Google Scholar] [CrossRef] [PubMed]
- Kalinke, T.; Tzomakas, C.; Seelen, W.V. A texture-based object detection and an adaptive model-based classification. In Proceedings of the International Conference on Intelligent Vehicles, Stuttgart, Germany, 28–30 October 1998; pp. 341–346. Available online: http://citeseerx.ist.psu.edu/viewdoc/summary?doi=10.1.1.33.526 (accessed on 8 July 2023).
- Chen, Y.Q. Novel Techniques for Image Texture Classification; University of Southampton: Southampton, UK, 1995. [Google Scholar]
- Yadav, P.K.; Thomasson, J.A.; Searcy, S.W.; Hardin, R.G.; Braga-Neto, U.; Popescu, S.C.; Martin, D.E.; Rodriguez, R.; Meza, K.; Enciso, J.; et al. Assessing the Performance of Yolov5 Algorithm for Detecting Volunteer Cotton Plants in Corn Fields at Three Different Growth Stages. Artif. Intell. Agric. 2022, 6, 292–303. [Google Scholar] [CrossRef]
- Yadav, P.K.; Thomasson, J.A.; Hardin, R.; Searcy, S.W.; Braga-Neto, U.; Popescu, S.C.; Martin, D.E.; Rodriguez, R.; Meza, K.; Enciso, J.; et al. Detecting volunteer cotton plants in a corn field with deep learning on UAV remote-sensing imagery. Comput. Electron. Agric. 2023, 204, 107551. [Google Scholar] [CrossRef]
- Chen, Y.R.; Chao, K.; Kim, M.S. Machine vision technology for agricultural applications. Comput. Electron. Agric. 2002, 36, 173–191. [Google Scholar] [CrossRef]
- Fan, S.; Li, J.; Zhang, Y.; Tian, X.; Wang, Q.; He, X.; Zhang, C.; Huang, W. On line detection of defective apples using computer vision system combined with deep learning methods. J. Food Eng. 2020, 286, 110102. [Google Scholar] [CrossRef]
- Liu, G.; Nouaze, J.C.; Mbouembe, P.L.T.; Kim, J.H. YOLO-Tomato: A Robust Algorithm for Tomato Detection Based on YOLOv3. Sensors 2020, 20, 2145. [Google Scholar] [CrossRef]
- Zhou, F.; Zhao, H.; Nie, Z. Safety Helmet Detection Based on YOLOv5. In Proceedings of the International Conference on Power Electronics, Computer Applications, ICPECA 2021, Shenyang, China, 22–24 January 2021; pp. 6–11. [Google Scholar] [CrossRef]
- Brungel, R.; Friedrich, C.M. DETR and YOLOv5: Exploring Performance and Self-Training for Diabetic Foot Ulcer Detection. In Proceedings of the 34th International Symposium on Computer-Based Medical Systems (CBMS) 2021, Online, 7–9 June 2021; pp. 148–153. [Google Scholar] [CrossRef]
- Solawetz, J.; Nelson, J. How to Train YOLOv5 On a Custom Dataset. 2020. Available online: https://blog.roboflow.com/how-to-train-yolov5-on-a-custom-dataset/ (accessed on 7 August 2021).
- Redmon, J.; Farhadi, A. YOLOv3:An Incremental Improvement. 2018. Available online: http://arxiv.org/abs/1804.02767 (accessed on 7 August 2021).
- Mao, Q.C.; Sun, H.M.; Liu, Y.B.; Jia, R.S. Mini-YOLOv3: Real-Time Object Detector for Embedded Applications. IEEE Access 2019, 7, 133529–133538. [Google Scholar] [CrossRef]
- Ge, Z.; Liu, S.; Wang, F.; Li, Z.; Sun, J. YOLOX: Exceeding YOLO Series in 2021. arXiv 2021, arXiv:2107.08430. Available online: http://arxiv.org/abs/2107.08430 (accessed on 2 February 2022).
- USDA; Natural Resources Conservation Service. Web Soil Survey. 2020. Available online: https://websoilsurvey.sc.egov.usda.gov/App/HomePage.htm (accessed on 5 March 2021).
- Yadav, P. image_splitter. 2021. Available online: https://github.com/pappuyadav/image_splitter (accessed on 17 September 2022).
- Bloice, M.D.; Stocker, C.; Holzinger, A. Augmentor: An Image Augmentation Library for Machine Learning. arXiv 2017, arXiv:1708.04680. [Google Scholar] [CrossRef]
- Tzutalin. LabelImg. Git Code. 2015. Available online: https://github.com/tzutalin/labelImg (accessed on 10 November 2020).
- Kist, A.M. Glottis Analysis Tools—Deep Neural Networks. Zenodo. 13 January 2021. Available online: https://zenodo.org/record/4436985 (accessed on 8 May 2021).
- Yan, B.; Fan, P.; Lei, X.; Liu, Z.; Yang, F. A real-time apple targets detection method for picking robot based on improved YOLOv5. Remote Sens. 2021, 13, 1619. [Google Scholar] [CrossRef]
- Howard, A.; Sandler, M.; Chen, B.; Wang, W.; Chen, L.-C.; Tan, M.; Chu, G.; Vasudevan, V.; Zhu, Y.; Pang, R.; et al. Searching for mobileNetV3. In Proceedings of the IEEE/CVF International Conference on Computer Vision, Seoul, Republic of Korea, 27 October–2 November 2019; pp. 1314–1324. [Google Scholar] [CrossRef]
- Yadav, P.K.; Thomasson, J.A.; Hardin, R.; Searcy, S.W.; Braga-Neto, U.; Popescu, S.C.; Martin, D.E.; Rodriguez, R.; Meza, K.; Enciso, J.; et al. Computer Vision for Volunteer Cotton Detection in a Corn Field With UAS Remote Sensing Imagery and Spot-Spray Applications. arXiv 2022, arXiv:2207.07334. [Google Scholar] [CrossRef]
- Jocher, G.; Stoken, A.; Borovec, J.; Chaurasia, A.; Abhiram, V.; Changyu, L.; Hogan, A.; Hajek, J.; Diaconu, L.; Kwon, Y.; et al. Ultralytics/yolov5: v5.0—YOLOv5-P6 1280 Models, AWS, Supervisely and YouTube Integrations. 11 April 2021. Available online: https://zenodo.org/record/4679653 (accessed on 21 July 2021).
- Ruder, S. An overview of gradient descent optimization algorithms. arXiv 2016, arXiv:1609.04747. Available online: http://arxiv.org/abs/1609.04747 (accessed on 1 June 2023).
- Lin, T.Y.; Maire, M.; Belongie, S.; Hays, J.; Perona, P.; Ramanan, D.; Dollár, P. Microsoft COCO: Common Objects in Context. In Proceedings of the European Conference on Computer Vision, Zurich, Switzerland, 6–12 September 2014; Volume 8693, LNCS, no. PART 5. pp. 740–755. [Google Scholar] [CrossRef]
- Xie, S.; Braga-Neto, U.M. On the Bias of Precision Estimation Under Separate Sampling. Cancer Inform. 2019, 18, 1176935119860822. [Google Scholar] [CrossRef]
- Luque, A.; Carrasco, A.; Martín, A.; de las Heras, A. The impact of class imbalance in classification performance metrics based on the binary confusion matrix. Pattern Recognit. 2019, 91, 216–231. [Google Scholar] [CrossRef]
- Li, P.; Goyal, T.-Y.; Girshick, P.; He, R.; Dollar, K. Focal Loss for Dense Object Detection. In Proceedings of the IEEE international conference on computer vision, Salt Lake City, UT, USA, 18–22 June 2018; pp. 1980–2988. [Google Scholar]
- Obermiller, D.J. Multiple Response Optimization Using JMP. 2000. Available online: https://support.sas.com/resources/papers/proceedings/proceedings/sugi22/INFOVIS/PAPER178.PDF (accessed on 2 June 2022).
- Costa, N.R.; Lourenço, J.; Pereira, Z.L. Desirability function approach: A review and performance evaluation in adverse conditions. Chemom. Intell. Lab. Syst. 2011, 107, 234–244. [Google Scholar] [CrossRef]
- Dennis, R.B.; Schnabel, J.E., Jr. Numerical Methods for Unconstrained Optimization and Nonlinear Equations, 1st ed.; Society for Industrial and Applied Mathematics: Philadelphia, PA, USA, 1996. [Google Scholar]
- The SciPy Community. Statistical Functions (scipy.stats). 2021. Available online: https://docs.scipy.org/doc/scipy/reference/stats.html (accessed on 9 August 2021).
- Hardin, R.G.; Huang, Y.; Poe, R. Detecting Plastic Trash in a Cotton Field With a UAV. In Proceedings of the Beltwide Cotton Conferences, San Antonio, TX, USA, 3–5 January 2018; pp. 521–527. Available online: http://www.cotton.org/beltwide/proceedings/2005-2018/data/conferences/2018/papers/18538.pdf (accessed on 15 September 2021).
- Liu, X.; Tang, G.; Zou, W. Improvement of Detection Accuracy of Aircraft in Remote Sensing Images Based on YOLOV5 Model. In Proceedings of the International Geoscience and Remote Sensing Symposium IGARSS, Brussels, Belgium, 11–16 July 2021; pp. 4775–4778. [Google Scholar] [CrossRef]
- Raghavendra, U.; Fujita, H.; Bhandary, S.V.; Gudigar, A.; Tan, J.H.; Acharya, U.R. Deep convolution neural network for accurate diagnosis of glaucoma using digital fundus images. Inf. Sci. 2018, 441, 41–49. [Google Scholar] [CrossRef]
- Bevilacqua, V.; Brunetti, A.; Guerriero, A.; Trotta, G.F.; Telegrafo, M.; Moschetta, M. A performance comparison between shallow and deeper neural networks supervised classification of tomosynthesis breast lesions images. Cogn. Syst. Res. 2019, 53, 3–19. [Google Scholar] [CrossRef]
- Dandois, J.P.; Ellis, E.C. High spatial resolution three-dimensional mapping of vegetation spectral dynamics using computer vision. Remote Sens. Environ. 2013, 136, 259–276. [Google Scholar] [CrossRef]
- Samie, F.; Tsoutsouras, V.; Bauer, L.; Xydis, S.; Soudris, D.; Henkel, J. Computation offloading and resource allocation for low-power IoT edge devices. In Proceedings of the 3rd World Forum on Internet of Things (WF-IoT), Brussels, Belgium, 11–16 July 2016; pp. 7–12. [Google Scholar] [CrossRef]
Disclaimer/Publisher’s Note: The statements, opinions and data contained in all publications are solely those of the individual author(s) and contributor(s) and not of MDPI and/or the editor(s). MDPI and/or the editor(s) disclaim responsibility for any injury to people or property resulting from any ideas, methods, instructions or products referred to in the content. |
© 2023 by the authors. Licensee MDPI, Basel, Switzerland. This article is an open access article distributed under the terms and conditions of the Creative Commons Attribution (CC BY) license (https://creativecommons.org/licenses/by/4.0/).