Polyphenolic and Fruit Colorimetric Analysis of Hungarian Sour Cherry Genebank Accessions

 ,
,  , , and
Abstract
1. Introduction
2. Materials and Methods
2.1. Firmness, Soluble Solid Content (SSC), Acidity, Sweetness, Juiciness, Fruit, and Seed Weight
2.2. Colour Scaling: Pantone, UPOV, CTIFL and CIELab
2.3. Total Phenolic Content (TPC) Analysis
2.4. Statistical Analysis
3. Results
3.1. Sour Cherry Colour Comparison
3.2. Polyphenolic and Colour Analysis of Sour Cherry Fruits
3.3. Firmness, Soluble Solid Content (SSC) and Weight
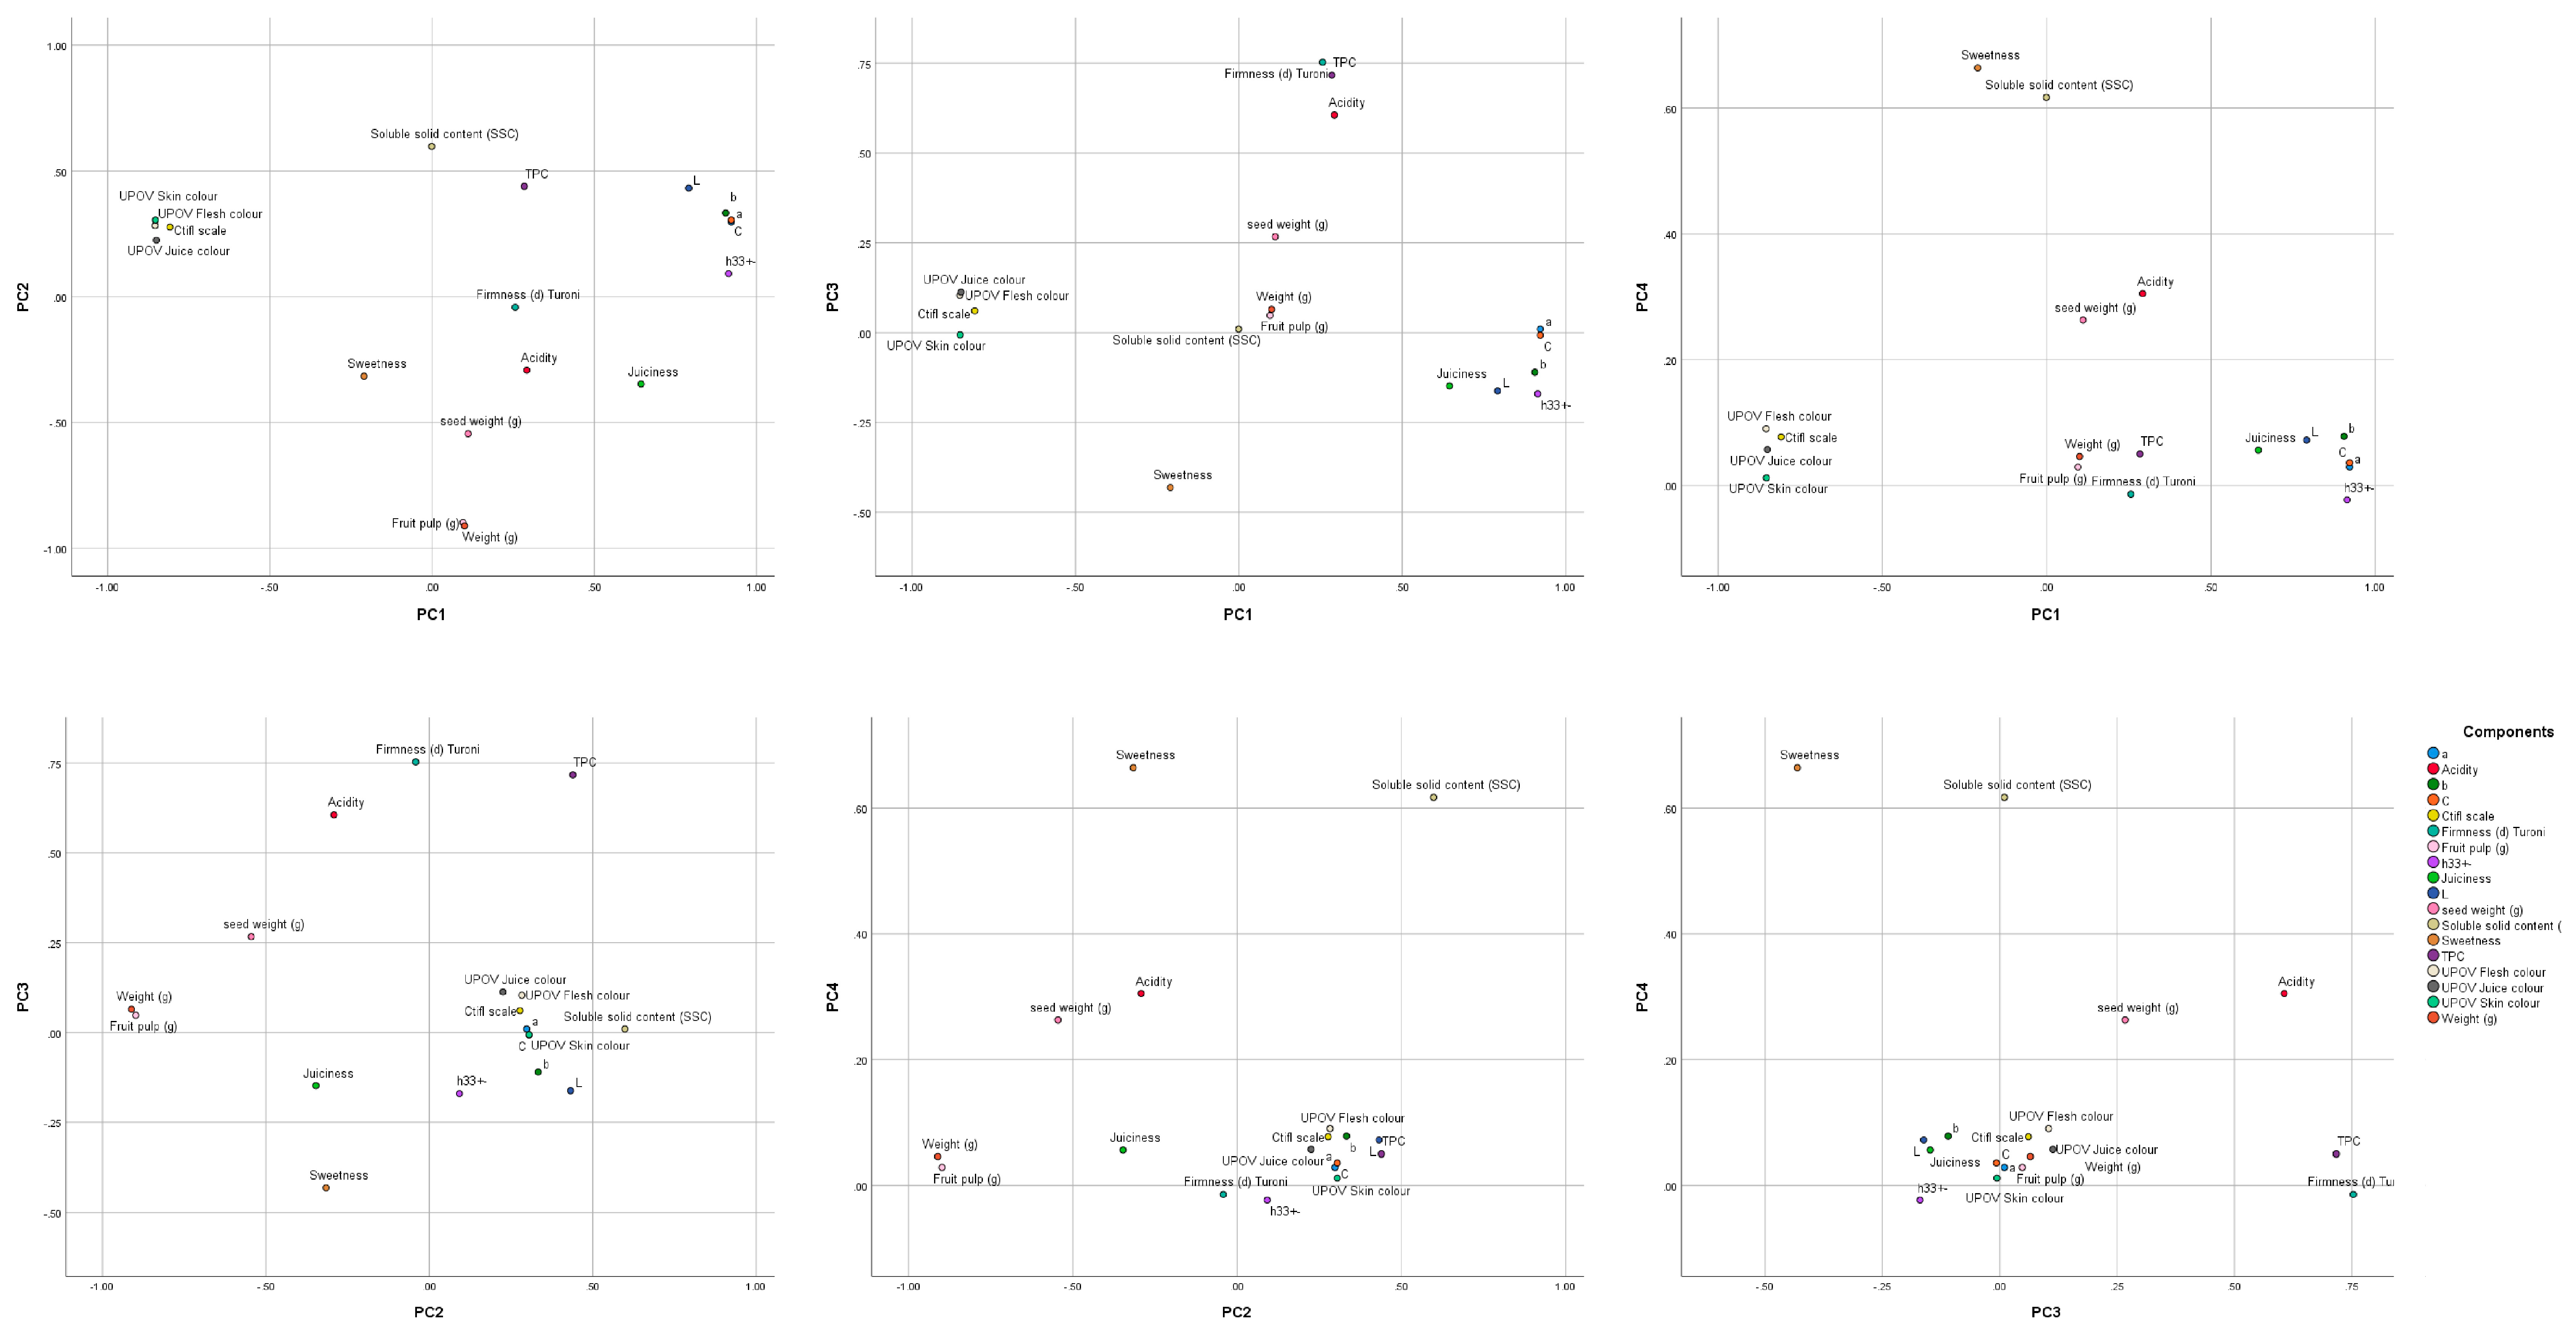
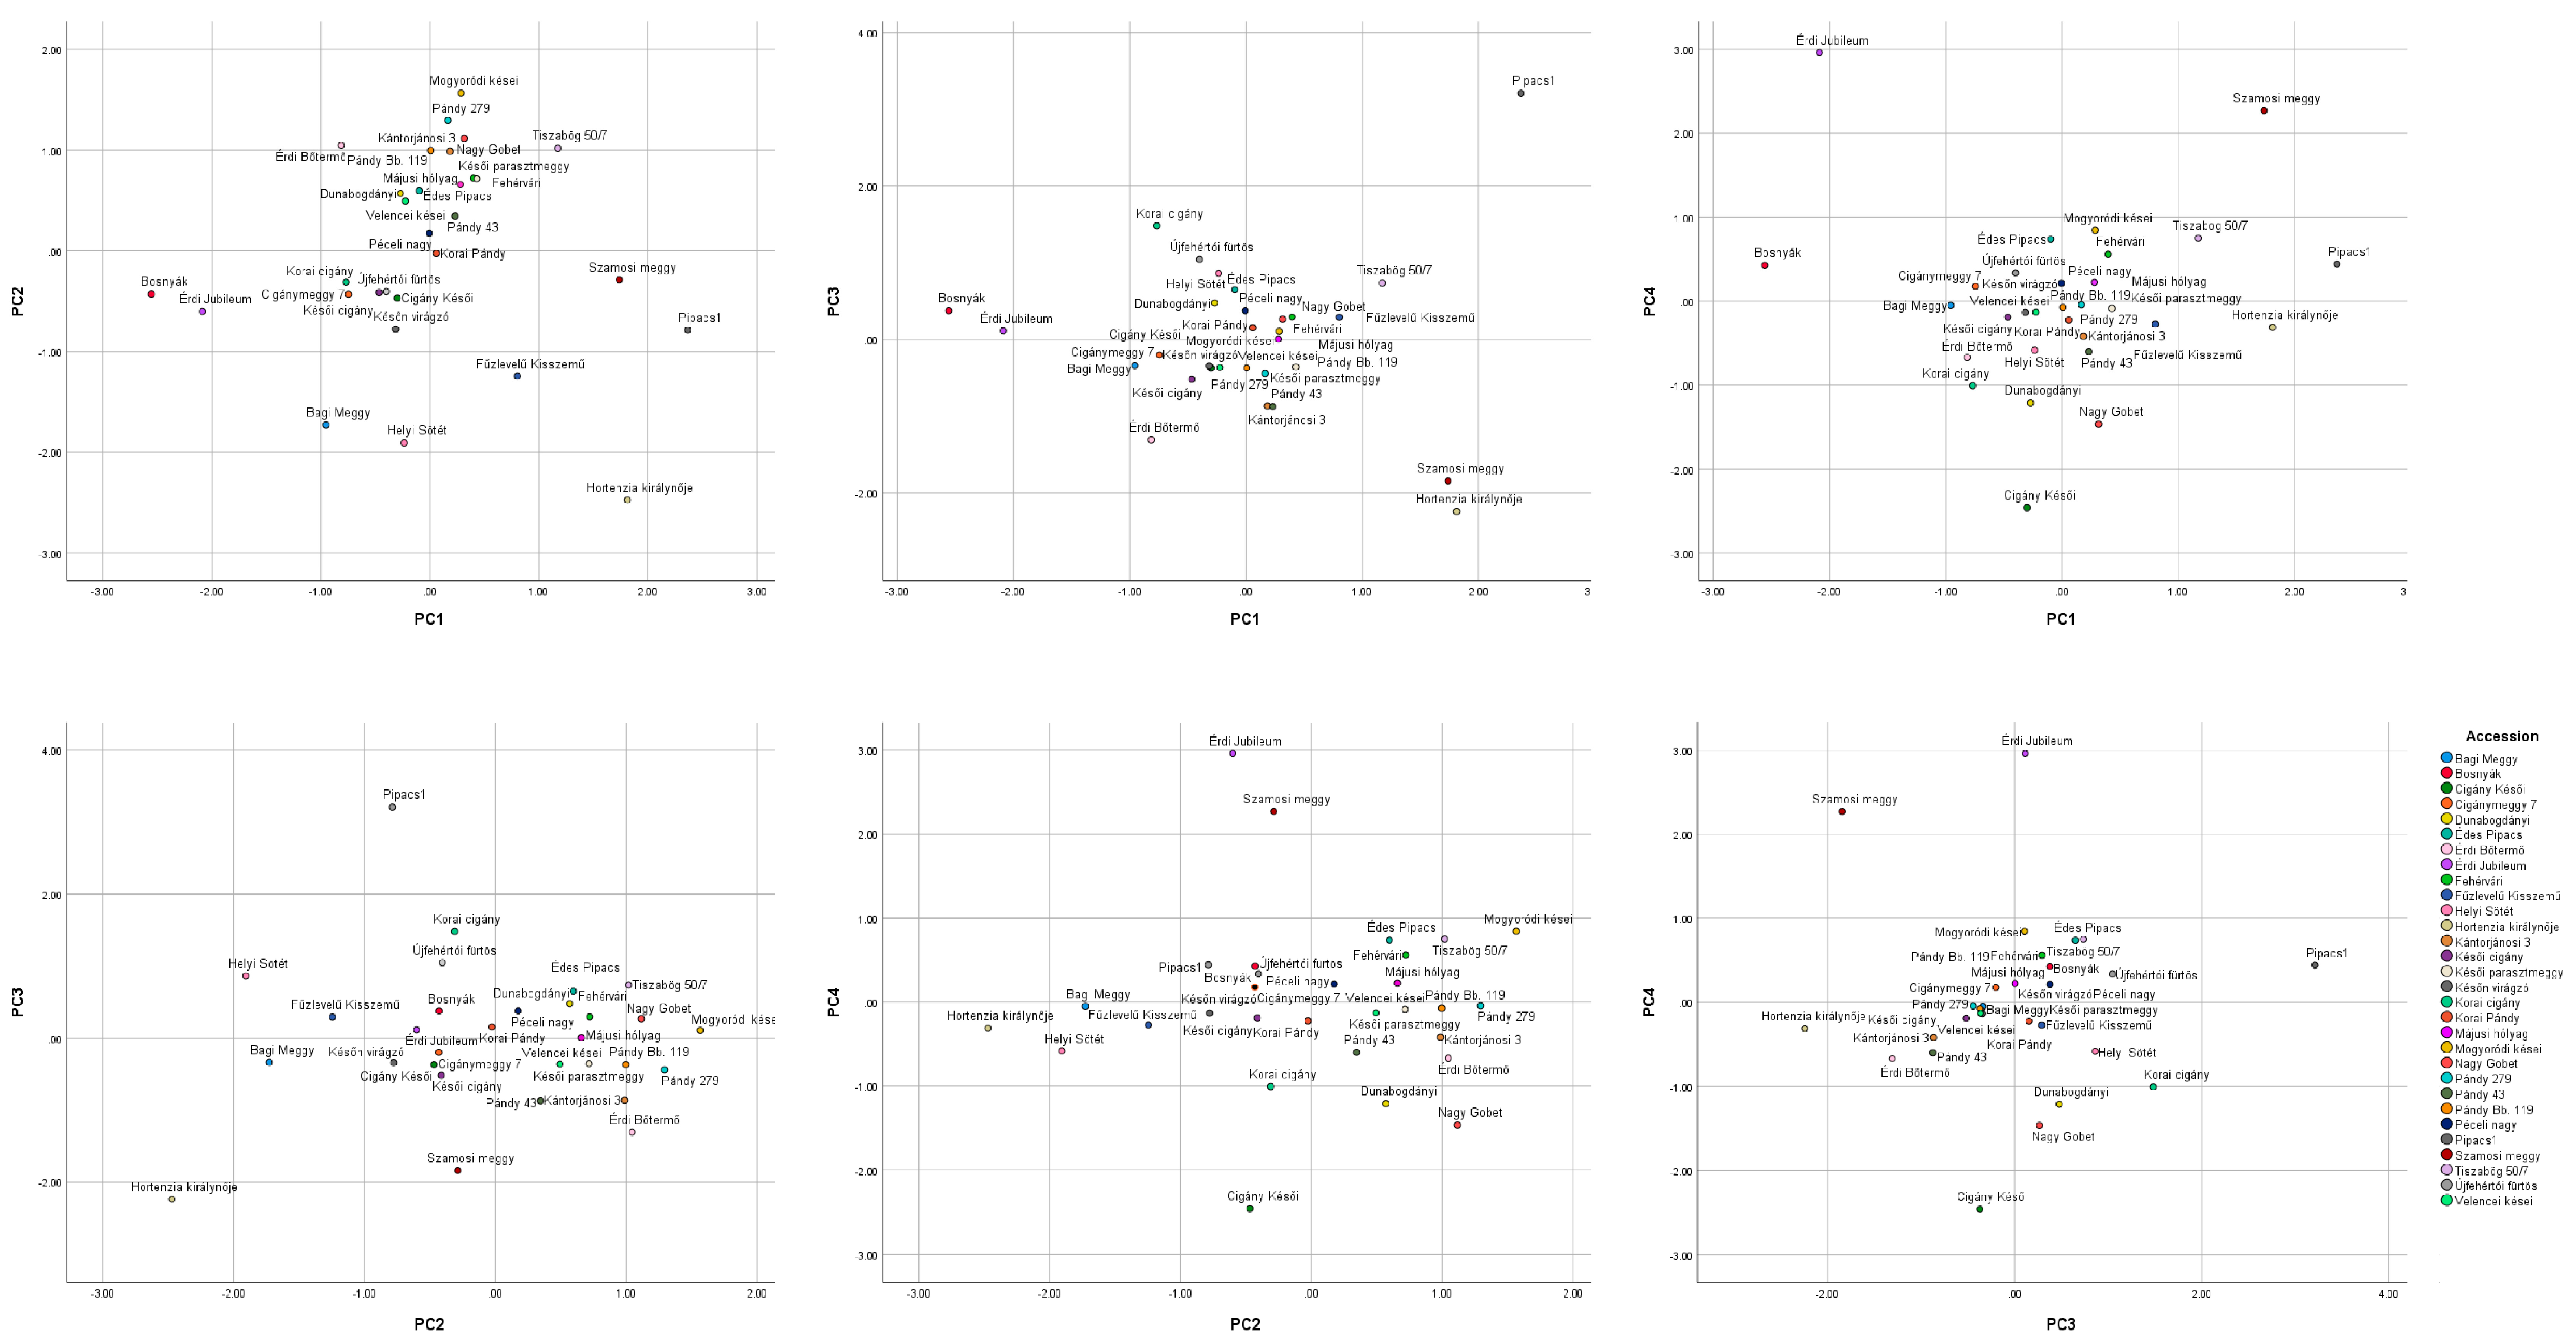
3.4. Principal Component Analysis (PCA) and Bivariate Analysis
4. Discussion
5. Conclusions
Supplementary Materials
Author Contributions
Funding
Institutional Review Board Statement
Data Availability Statement
Conflicts of Interest
References
- Bujdosó, G.; Hrotkó, K. Cherry production. In Cherries: Botany, Production and Uses; CABI: Wallingford, UK, 2017; pp. 1–13. [Google Scholar] [CrossRef]
- Schuster, M.; Apostol, J.; Iezzoni, A.; Jensen, M.; Milatović, D. Sour cherry varieties and improvement. In Cherries: Botany, Production and Uses; CABI: Wallingford, UK, 2017; pp. 95–116. [Google Scholar] [CrossRef]
- FAOSTAT. Crops and Livestock Products, Sour Cherry Production in Hungary. 2021. Available online: https://www.fao.org/faostat/en/#data/QCL (accessed on 15 May 2023).
- Faust, M.; Surány, D. Origin and dissemination of cherry. In Horticultural Reviews; Wiley: Hoboken, NJ, USA, 1997; pp. 263–270. [Google Scholar]
- Kelley, D.S.; Adkins, Y.; Laugero, K.D. A review of the health benefits of cherries. Nutrients 2018, 10, 368. [Google Scholar] [CrossRef] [PubMed]
- Gonçalves, A.C.; Nunes, A.R.; Flores-Félix, J.D.; Alves, G.; Silva, L.R. Cherries and Blueberries-Based Beverages: Functional Foods with Antidiabetic and Immune Booster Properties. Molecules 2022, 27, 3294. [Google Scholar] [CrossRef] [PubMed]
- Głowacka, A.; Rozpara, E.; Hallmann, E. The Dynamic of Polyphenols Concentrations in Organic and Conventional Sour Cherry Fruits: Results of a 4-Year Field Study. Molecules 2020, 25, 3729. [Google Scholar] [CrossRef] [PubMed]
- Papp, N.; Szilvássy, B.; Abrankó, L.; Szabó, T.; Pfeiffer, P.; Szabó, Z.; Nyéki, J.; Ercisli, S.; Stefanovits-Bányai, É.; Hegedüs, A. Main quality attributes and antioxidants in Hungarian sour cherries: Identification of genotypes with enhanced functional properties. Int. J. Food Sci. Technol. 2010, 45, 395–402. [Google Scholar] [CrossRef]
- Kazazic, M.; Mehic, E.; Djapo-Lavic, M. Phenolic content and bioactivity of two sour cherry cultivars and their products. Glas. Hem. Tehnol. Bosne Hercegovine 2022, 1–6. [Google Scholar]
- Milošević, T.; Milošević, N.; Mladenović, J. Combining fruit quality and main antioxidant attributes in the sour cherry: The role of new clonal rootstock. Sci. Hortic. 2020, 265, 109236. [Google Scholar] [CrossRef]
- Bujdosó, G.; Hrotkó, K.; Feldmane, D.; Giovannini, D.; Demirsoy, H.; Tao, R.; Ercisli, S.; Ertek, N.; Malchev, S. What kind of sweet cherries do the final consumers prefer? South-West. J. Hortic. Biol. Environ. 2020, 11, 37–48. Available online: https://www.researchgate.net/publication/342347418_WHAT_KIND_OF_SWEET_CHERRIES_DO_THE_FINAL_CONSUMERS_PREFER (accessed on 18 June 2023).
- Homoki, J.R.; Nemes, A.; Fazekas, E.; Gyémánt, G.; Balogh, P.; Gál, F.; Al-Asri, J.; Mortier, J.; Wolber, G.; Babinszky, L.; et al. Anthocyanin composition, antioxidant efficiency, and α-amylase inhibitor activity of different Hungarian sour cherry varieties (Prunus cerasus L.). Food Chem. 2016, 194, 222–229. [Google Scholar] [CrossRef] [PubMed]
- Pedisić, S.; Levaj, B.; Verica, D.U.; Škevin, D.; Babojelić, M.S. Color parameters and total anthocyanins of sour cherries (Prunus Cerasus L.) during ripening. Agric. Conspec. Sci. 2009, 74, 259–262. Available online: http://acs.agr.hr/acs/index.php/acs/article/view/459 (accessed on 18 June 2023).
- Singleton, V.L.; Rossi, J.A. Colorimetry of total phenolics with phosphomolybdic-phosphotungstic acid reagents. Am. J. Enol. Vitic. 1965, 16, 144–158. Available online: https://www.ajevonline.org/content/16/3/144 (accessed on 18 June 2023). [CrossRef]
- Najafzadeh, R.; Arzani, K.; Bouzari, N.; Hashemi, J. Identification of new Iranian sour cherry genotypes with enhanced fruit quality parameters and high antioxidant properties. New Zeal. J. Crop Hortic. Sci. 2014, 42, 275–287. [Google Scholar] [CrossRef]
- Khoo, G.M.; Clausen, M.R.; Pedersen, B.H.; Larsen, E. Bioactivity and total phenolic content of 34 sour cherry cultivars. J. Food Compos. Anal. 2011, 24, 772–776. [Google Scholar] [CrossRef]
- Pissard, A.; Lateur, M.; Baeten, V.; Magein, H.; Dupont, P.; Tabart, J.; Pincemail, J.; Kevers, C. Determination of total phenolic compound content and antioxidant activity in cherry species and cultivars. J. Berry Res. 2016, 6, 81–91. [Google Scholar] [CrossRef]
- Viljevac, M.; Dugalic, K.; Jurkovic, V.; Mihaljevic, I.; Tomas, V.; Puskar, B.; Lepedus, H.; Sudar, R.; Jurkovic, Z. Relation between polyphenols content and skin colour in sour cherry fruits. J. Agric. Sci. Belgrade 2012, 57, 57–67. [Google Scholar] [CrossRef]
- Veres, Z.; Holb, I.J.; Nyéki, I.J.; Szabó, Z.; Remenyik, J.; Fári, M.G. High antioxidant—And anthocyanin contents of sour cherry cultivars may benefit the human health: International and Hungarian achievements on phytochemicals. Int. J. Hortic. Sci. 2006, 12, 45–47. [Google Scholar] [CrossRef]
- Wojdyło, A.; Nowicka, P.; Laskowski, P.; Oszmiański, J. Evaluation of Sour Cherry (Prunus cerasus L.) Fruits for Their Polyphenol Content, Antioxidant Properties, and Nutritional Components. J. Agric. Food Chem. 2014, 62, 12332–12345. [Google Scholar] [CrossRef] [PubMed]
- Magri, A.; Malorni, L.; Cozzolino, R.; Adiletta, G.; Siano, F.; Picariello, G.; Cice, D.; Capriolo, G.; Nunziata, A.; Di Matteo, M.; et al. Agronomic, Physicochemical, Aromatic and Sensory Characterization of Four Sweet Cherry Accessions of the Campania Region. Plants 2023, 12, 610. [Google Scholar] [CrossRef] [PubMed]


| Accession | Origin | Parents | Harvest Time |
|---|---|---|---|
| Bagi Meggy | Carpathian Basin | Landrace | 29 June 2022 |
| Bosnyák | Carpathian Basin | Landrace | 29 June 2022 |
| Cigány Késői | Carpathian Basin | Landrace | 29 June 2022 |
| Cigánymeggy 7 * | Carpathian Basin | Landrace | 30 June 2022 |
| Dunabogdányi | Carpathian Basin | Landrace | 29 June 2022 |
| Édes Pipacs | Carpathian Basin | Landrace | 28 June 2022 |
| Érdi Bőtermő * | Hungary | Pándy × Nagy angol | 29 June 2022 |
| Érdi Jubileum * | Hungary | Pándy × Eugenia | 30 June 2022 |
| Fehérvári | Carpathian Basin | Landrace | 28 June 2022 |
| Fűzlevelű Kisszemű | Carpathian Basin | Landrace | 28 June 2022 |
| Helyi Sötét | Carpathian Basin | Landrace | 28 June 2022 |
| Hortenzia Királynője | France | Landrace (also called Königin Hortense) | 29 June 2022 |
| Kántorjánosi 3 * | Hungary | Landrace | 30 June 2022 |
| Késői cigány | Carpathian Basin | Landrace | 28 June 2022 |
| Késői parasztmeggy | Carpathian Basin | Landrace | 28 June 2022 |
| Későn virágzó | Carpathian Basin | Landrace | 29 June 2022 |
| Korai cigány | Carpathian Basin | Landrace | 28 June 2022 |
| Korai Pándy | Carpathian Basin | Landrace | 29 June 2022 |
| Májusi hólyag | Carpathian Basin | Landrace | 29 June 2022 |
| Mogyoródi kései | Carpathian Basin | Landrace | 28 June 2022 |
| Nagy Gobet | France | Landrace (also called Grosse Gobet) | 29 June 2022 |
| Pándy 279 * | Carpathian Basin | Landrace | 30 June 2022 |
| Pándy 43 * | Carpathian Basin | Landrace | 29 June 2022 |
| Pándy Bb. 119 * | Carpathian Basin | Landrace | 30 June 2022 |
| Péceli nagy | Carpathian Basin | Landrace | 29 June 2022 |
| Pipacs1 * | Carpathian Basin | Landrace | 30 June 2022 |
| Szamosi meggy | Carpathian Basin | Landrace | 29 June 2022 |
| Tiszabög 50/7 | Carpathian Basin | Landrace | 29 June 2022 |
| Újfehértói fürtös * | Újfehértó, Hungary | Landrace | 30 June 2022 |
| Velencei kései | Carpathian Basin | Landrace | 28 June 2022 |
| Skin Colour (UPOV Scale) | L* | a* | b* | Chroma | h±33° |
|---|---|---|---|---|---|
| 6 | 25.16 ± 0.90 a | 4.26 ± 2.54 a | 0.52 ± 0.88 a | 4.32 ± 2.65 a | −29.29 ± 6.89 a |
| 5 | 26.29 ± 0.56 b | 9.21 ± 1.55 b | 2.10 ± 0.57 b | 9.45 ± 1.63 b | −20.33 ± 1.40 b |
| 4 | 26.67 ± 0.98 b | 13.04 ± 3.52 c | 3.43 ± 1.36 c | 13.49 ± 3.74 c | −18.71 ± 1.92 b,c |
| 3 | 27.11 ± 2.20 b | 15.59 ± 5.51 c | 4.72 ± 2.92 d | 16.32 ± 6.14 c | −17.24 ± 3.08 c |
| 2 | 29.02 ± 1.12 c | 18.93 ± 2.65 d | 6.92 ± 1.42 e | 20.16 ± 2.97 d | −13.09 ± 1.35 d |
| 1 | 29.92 ± 0.94 c | 24.88 ± 2.41 e | 8.55 ± 1.33 f | 26.31 ± 2.71 e | −14.13 ± 1.17 d |
| Ctifl Scale | L* | a* | b* | Chroma | h±33° |
|---|---|---|---|---|---|
| 7 | 25.14 ± 0.93 a | 4.30 ± 2.26 a | 0.49 ± 0.72 a | 4.35 ± 2.32 a | −29.23 ± 7.04 a |
| 6 | 25.86 ± 1.16 a,b | 6.70 ± 3.88 a | 1.38 ± 1.36 a | 6.87 ± 4.05 a | −25.01 ± 6.97 b |
| 5 | 26.63 ± 1.05 b | 12.37 ± 3.89 b | 3.19 ± 1.48 b | 12.79 ± 4.14 b | −19.07 ± 2.00 c |
| 4 | 26.79 ± 1.36 b | 14.25 ± 4.19 b | 3.99 ± 1.92 b | 14.81 ± 4.56 b | −17.98 ± 2.19 c |
| 3 | 28.11 ± 2.85 c | 18.50 ± 5.96 c | 6.30 ± 3.47 c | 19.59 ± 6.76 c | −15.35 ± 3.69 d |
| 2 | 29.83 ± 0.97 d | 23.35 ± 3.53 d | 8.16 ± 1.57 d | 24.75 ± 3.82 d | −13.81 ± 1.37 d |
| Pantone Scale | L* | a* | b* | Chroma | h±33° |
|---|---|---|---|---|---|
| Pantone Black 6 C | 25.09 ± 1.02 a | 3.48 ± 1.77 a | 0.32 ± 0.64 a | 3.52 ± 1.82 a | −30.58 ± 8.00 a |
| Pantone 222 C | 26.27 ± 0.56 b | 9.19 ± 1.44 b | 2.07 ± 0.51 b | 9.43 ± 1.51 b | −20.43 ± 1.33 b |
| Pantone 209 C | 26.49 ± 0.72 b | 13.35 ± 3.93 c,d | 3.56 ± 1.51 c,d | 13.82 ± 4.18 c,d | −18.55 ± 1.07 c |
| Pantone 202 C | 26.43 ± 0.86 b | 12.71 ± 2.21 c,d | 3.30 ± 0.83 c,d | 13.13 ± 2.34 c,d | −18.60 ± 2.05 c |
| Pantone 195 C | 26.41 ± 1.13 b | 12.14 ± 1.85 c | 3.14 ± 0.62 c | 12.54 ± 1.94 c | −18.63 ± 1.41 c |
| Pantone 193 C | 30.72 ± 1.51 e | 25.65 ± 4.11 g | 9.69 ± 2.50 g | 28.01 ± 5.04 g | −13.18 ± 2.15 d |
| Pantone 188 C | 26.69 ± 0.93 b,c | 14.08 ± 3.00 d | 3.81 ± 1.23 d,e | 14.59 ± 3.22 d,e | −18.17 ± 1.52 c |
| Pantone 187 C | 29.07 ± 1.97 d | 20.41 ± 3.99 f | 7.15 ± 2.36 f | 21.65 ± 4.53 f | −14.14 ± 2.55 d |
| Pantone 1817 C | 27.06 ± 1.06 c | 15.39 ± 3.90 e | 4.32 ± 1.54 e | 15.99 ± 4.17 e | −17.69 ± 1.56 c |
| Pantone 1807 C | 31.89 ± 3.02 f | 26.45 ± 4.05 g | 11.09 ± 3.46 h | 28.18 ± 4.64 g | −10.17 ± 3.76 e |
| Accession | TPC | L* | a* | b* | Chroma | h±33° |
|---|---|---|---|---|---|---|
| Bosnyák | 283.59 ± 0.74 | 24.52 ± 0.78 a | 2.75 ± 1.15 a | −0.05 ± 0.33 a | 2.77 ± 1.15 a | −36.08 ± 6.97 a |
| Késői parasztmeggy | 220.11 ± 0.42 | 25.05 ± 1.20 a,b | 17.29 ± 3.46 m | 5.08 ± 1.51 k | 18.03 ± 3.75 k | −16.87 ± 1.35 h,i |
| Érdi Bőtermő* | 172.53 ± 0.69 | 25.36 ± 0.43 b,c | 7.35 ± 1.83 b | 1.50 ± 0.56 c | 7.50 ± 1.90 b | −21.74 ± 1.66 c |
| Érdi Jubileum* | 280.82 ± 0.77 | 25.66 ± 0.90 b,c,d | 4.21 ± 1.97 a | 0.68 ± 0.68 b | 4.28 ± 2.06 a | −25.08 ± 4.36 b |
| Korai Pándy | 289.19 ± 0.64 | 25.71 ± 0.87 c,d | 14.30 ± 1.51 h,i,j,k | 3.88 ± 0.60 f,g,h,i,j | 14.82 ± 1.62 g,h,i | −17.90 ± 0.86 e,f,g,h |
| Nagy Gobet | 329.83 ± 0.76 | 26.05 ± 0.64 d,e | 12.85 ± 2.60 d,e,f,g,h,i | 3.32 ± 0.99 d,e,f,g,h | 13.27 ± 2.76 d,e,f,g,h | −18.80 ± 1.48 e,f,g |
| Mogyoródi kései | 247.26 ± 0.95 | 26.24 ± 0.83 d,e,f | 12.53 ± 2.66 d,e,f,g,h | 3.23 ± 1.00 d,e,f,g,h | 12.94 ± 2.82 d,e,f,g | −18.86 ± 1.74 e,f,g |
| Korai cigány | 400.43 ± 1.24 | 26.27 ± 0.56 d,e,f | 9.19 ± 1.44 c | 2.07 ± 0.51 c | 9.43 ± 1.51 c | −20.43 ± 1.33 d |
| Pándy Bb. 119 * | 213.65 ± 0.98 | 26.40 ± 0.53 e,f,g | 11.46 ± 1.50 d,e | 2.93 ± 0.52 d,e | 11.83 ± 1.58 d | −18.75 ± 0.99 e,f,g |
| Dunabogdányi | 267.71 ± 0.29 | 26.40 ± 0.60 e,f,g | 11.79 ± 2.17 d,e,f | 2.97 ± 0.79 d,e | 12.16 ± 2.29 d,e | −19.03 ± 1.55 e,f,g |
| Pándy 43 * | 195.16 ± 1.11 | 26.43 ± 0.61 e,f,g | 13.56 ± 1.79 f,g,h,i,j,k | 3.52 ± 0.66 d,e,f,g,h,i | 14.01 ± 1.90 e,f,g,h,i | −18.57 ± 0.85 e,f,g |
| Pándy 279 * | 202.28 ± 0.94 | 26.43 ± 0.86 e,f,g | 12.14 ± 1.85 d,e,f,g | 3.14 ± 0.62 d,e,f,g | 12.54 ± 1.94 d,e,f | −18.55 ± 1.07 e,f,g |
| Velencei kései | 245.19 ± 1.01 | 26.50 ± 0.63 e,f,g | 13.18 ± 1.80 e,f,g,h,i,j | 3.48 ± 0.68 d,e,f,g,h,i | 13.63 ± 1.91 d,e,f,g,h,i | −18.30 ± 1.04 e,f,g,h |
| Cigány Késői | 270.39 ±2.87 | 26.51 ± 0.65 e,f,g | 12.72 ± 2.62 d,e,f,g,h,i | 3.34 ± 0.96 d,e,f,g,h,i | 13.15 ± 2.78 d,e,f,g | −18.51 ± 1.16 e,f,g |
| Késői cigány | 241.71 ± 0.47 | 26.51 ± 0.85 e,f,g | 12.38 ± 2.87 d,e,f,g | 3.13 ± 1.15 d,e,f,g | 12.78 ± 3.07 d,e,f | −19.15 ± 1.69 d,e,f |
| Cigánymeggy 7 * | 294.43 ± 0.49 | 26.52 ± 0.60 e,f,g | 11.68 ± 2.11 d,e | 2.99 ± 0.73 d,e,f | 12.06 ± 2.22 d,e | −18.81 ± 1.16 e,f,g |
| Fehérvári | 296.12 ± 0.70 | 26.55 ± 0.54 e,f,g | 13.56 ± 1.94 f,g,h,i,j,k | 3.61 ± 0.77 d,e,f,g,h,i | 14.03 ± 2.07 e,f,g,h,i | −18.23 ± 1.09 e,f,g,h |
| Édes Pipacs | 297.35 ± 0.73 | 26.69 ± 0.63 e,f,g | 13.81 ± 1.80 g,h,i,j,k | 3.74 ± 0.76 e,f,g,h,i | 14.31 ± 1.93 f,g,h,i | −17.98 ± 1.09 e,f,g,h |
| Újfehértói fürtös* | 466.19 ± 0.37 | 26.77 ± 0.61 e,f,g | 12.74 ± 1.86 d,e,f,g,h,i | 3.19 ± 0.67 d,e,f,g,h | 13.13 ± 1.96 d,e,f,g | −19.08 ± 1.09 d,e,f |
| Májusi hólyag | 256.16 ± 0.51 | 26.83 ± 0.72 f,g | 14.68 ± 2.08 j,k | 4.06 ± 0.87 h,i,j | 15.23 ± 2.24 h,i | −17.70 ± 1.22 f,g,h |
| Későn virágzó | 293.32 ± 0.74 | 26.92 ± 0.75 f,g | 15.01 ± 2.49 k,l | 4.22 ± 1.11 i,j | 15.60 ± 2.70 i,j | −17.51 ± 1.39 g,h |
| Bagi Meggy | 313.28 ± 0.75 | 26.94 ± 0.54 f,g | 11.30 ± 2.46 d | 2.81 ± 0.94 d | 11.65 ± 2.61 d | −19.43 ± 2.06 d,e |
| Péceli nagy | 281.76 ± 0.71 | 27.04 ± 0.54 g | 14.64 ± 1.53 j,k | 3.94 ± 0.56 g,h,i,j | 15.16 ± 1.62 h,i | −17.97 ± 0.69 e,f,g,h |
| Kántorjánosi 3 * | 122.76 ± 0.97 | 27.11 ± 0.99 g,h | 14.38 ± 3.45 i,j,k | 3.89 ± 1.40 f,g,h,i,j | 14.90 ± 3.70 g,h,i | −18.20 ± 1.43 e,f,g,h |
| Helyi Sötét | 315.29 ± 0.82 | 27.68 ± 1.37 h,i | 16.39 ± 5.11 l,m | 4.62 ± 2.24 j,k | 17.05 ± 5.52 j,k | −18.03 ± 2.93 e,f,g,h |
| Tiszabög 50/7 | 436.87 ± 0.86 | 27.94 ± 0.96 i | 18.91 ± 2.87 n | 5.84 ± 1.33 l | 19.80 ± 3.12 l | −16.04 ± 1.52 i |
| Fűzlevelű Kisszemű | 398.72 ± 0.42 | 28.25 ± 0.68 i | 19.89 ± 2.17 n | 6.12 ± 0.97 l | 20.81 ± 2.36 l | −16.00 ± 0.95 i |
| Szamosi meggy | 192.59 ± 0.93 | 30.21 ± 2.07 j | 21.91 ± 4.39 o | 8.46 ± 2.45 m | 23.50 ± 4.97 m | −12.24 ± 1.85 j |
| Pipacs1 * | 650.57 ± 1.41 | 30.72 ± 1.51 j | 26.45 ± 4.05 p | 9.69 ± 2.50 n | 28.18 ± 4.64 n | −13.18 ± 2.15 j |
| Hortenzia Királynője | 179.11 ± 0.93 | 31.89 ± 3.02 k | 25.65 ± 4.11 p | 11.09 ± 3.46 o | 28.01 ± 5.04 n | −10.17 ± 3.76 k |
| Accession | Firmness | Soluble Solid Content (SSC) | Fruit Weight | Seed Weight | Pulp Weight |
|---|---|---|---|---|---|
| Bagi Meggy | 23.38 ± 5.26 b,c,d,e | 26.37 ± 3.20 j | 2.38 ± 0.26 a | 0.15 ± 0.05 a | 2.23 ± 0.26 a |
| Bosnyák | 32.45 ± 9.75 f,g,h,i,j | 25.90 ± 2.04 j | 3.49 ± 0.40 b,c | 0.19 ± 0.06 a,b | 3.30 ± 0.42 d,e,f |
| Cigány Késői | 22.16 ± 6.40 b,c,d | 19.60 ± 1.54 a,b,c | 3.38 ± 0.33 b,c | 0.28 ± 0.04 c,d,e | 3.11 ± 0.32 d,e,f |
| Cigánymeggy 7 * | 14.33 ± 5.77 a | 23.24 ± 1.68 g,h,i | 3.50 ± 0.53 b,c | 0.30 ± 0.08 c,d,e,f | 3.21 ± 0.48 d,e,f |
| Dunabogdányi | 34.48 ± 5.68 i,j | 20.76 ± 1.44 a,b,c,d,e,f | 4.90 ± 0.31 e | 0.36 ± 0.08 e,f,g,h,i | 4.55 ± 0.30 h |
| Édes Pipacs | 37.42 ± 4.86 j | 21.94 ± 1.45 c,d,e,f,g,h | 4.91 ± 0.42 e | 0.37 ± 0.06 f,g,h,i,j | 4.54 ± 0.41 h |
| Érdi Bőtermő * | 25.99 ± 6.65 c,d,e,f | 19.97 ± 2.41 a,b,c,d | 5.80 ± 0.52 h,i | 0.32 ± 0.08 d,e,f,g,h | 5.48 ± 0.52 k,l |
| Érdi Jubileum * | 27.26 ± 6.29 d,e,f,g,h | 30.63 ± 2.98 l | 3.71 ± 0.96 b,c,d | 0.28 ± 0.06 c,d,e | 3.43 ± 0.91 d,e,f,g |
| Fehérvári | 37.50 ± 4.86 j | 21.57 ± 1.17 b,c,d,e,f,g,h | 4.86 ± 0.42 e | 0.32 ± 0.07 d,e,f,g,h | 4.54 ± 0.41 h |
| Fűzlevelű Kisszemű | 44.54 ± 7.99 k,l | 23.05 ± 1.60 f,g,h | 2.71 ± 0.39 a | 0.24 ± 0.08 b,c,d | 2.47 ± 0.39 a,b,c |
| Helyi Sötét | 32.72 ± 9.07 f,g,h,i,j | 28.54 ± 2.50 k | 2.22 ± 0.19 a | 0.23 ± 0.06 b,c | 2.00 ± 0.18 a |
| Hortenzia Királynője | 19.99 ± 6.07 a,b,c | 25.21 ± 2.55 i,j | 2.60 ± 0.31 a | 0.22 ± 0.06 b,c | 2.38 ± 0.32 a,b |
| Kántorjánosi 3 * | 33.39 ± 4.52 g,h,i,j | 19.17 ± 2.20 a | 5.42 ± 0.75 e,f,g,h | 0.45 ± 0.08 j,k | 4.97 ± 0.71 h,i,j |
| Késői cigány | 18.75 ± 4.92 a,b | 22.71 ± 2.49 e,f,g,h | 3.23 ± 0.34 b | 0.38 ± 0.06 g,h,i,j,k | 2.85 ± 0.32 b,c,d |
| Késői parasztmeggy | 37.00 ± 7.20 i,j | 20.93 ± 1.97 a,b,c,d,e,f | 5.28 ± 0.63 e,f,g,h | 0.37 ± 0.07 f,g,h,i | 4.92 ± 0.63 h,i |
| Későn virágzó | 26.32 ± 6.94 c,d,e,f,g | 23.70 ± 1.80 h,i | 3.82 ± 0.55 b,c,d | 0.25 ± 0.08 b,c,d | 3.57 ± 0.51 f,g |
| Korai cigány | 38.39 ± 6.63 j,k | 22.88 ± 1.97 f,g,h | 3.27 ± 0.27 b,c | 0.32 ± 0.07 d,e,f,g,h | 2.95 ± 0.28 c,d,e |
| Korai Pándy | 38.29 ± 4.84 j,k | 20.87 ± 1.85 a,b,c,d,e,f | 3.73 ± 0.39 b,c,d | 0.28 ± 0.04 c,d,e | 3.45 ± 0.39 e,f,g, |
| Májusi hólyag | 33.88 ± 6.30 h,i,j | 20.36 ± 1.41 a,b,c,d | 5.01 ± 0.62 e,f | 0.35 ± 0.07 e,f,g,h,i | 4.67 ± 0.59 h |
| Mogyoródi kései | 37.39 ± 4.90 j | 22.27 ± 1.67 d,e,f,g,h | 6.62 ± 0.74 j | 0.41 ± 0.09 i,j,k | 6.21 ± 0.71 m |
| Nagy Gobet | 37.34 ± 4.53 j | 20.42 ± 1.38 a,b,c,d,e | 6.29 ± 0.86 i,j | 0.33 ± 0.06 e,f,g,h,i | 5.96 ± 0.84 l,m |
| Pándy 279 * | 32.30 ± 5.30 f,g,h,i,j | 19.51 ± 2.05 a,b | 5.72 ± 0.69 g,h | 0.45 ± 0.09 k,l | 5.27 ± 0.70 i,j |
| Pándy 43 * | 36.12 ± 4.86 i,j | 20.87 ± 1.28 a,b,c,d,e,f | 4.82 ± 0.66 e | 0.28 ± 0.08 c,d,e | 4.54 ± 0.65 h |
| Pándy Bb. 119 * | 32.15 ± 4.53 f,g,h,i,j | 19.61 ± 1.13 a,b,c | 5.23 ± 0.49 e,f,g,h | 0.39 ± 0.09 g,h,i,j,k | 4.84 ± 0.45 h,i |
| Péceli nagy | 37.47 ± 6.60 j | 21.02 ± 3.01 a,b,c,d,e,f,g | 4.24 ± 0.42 d | 0.31 ± 0.04 d,e,f,g | 3.93 ± 0.42 g |
| Pipacs1 * | 57.26 ± 11.73 m | 26.01 ± 2.16 j | 3.87 ± 0.56 c,d | 0.52 ± 0.12 l | 3.35 ± 0.48 d,e,f |
| Szamosi meggy | 29.87 ± 5.51 e,f,g,h,i | 26.44 ± 3.69 j | 5.57 ± 0.85 f,g,h | 0.33 ± 0.06 e,f,g,h,i | 5.24 ± 0.83 i,j |
| Tiszabög 50/7 | 46.96 ± 7.19 l | 21.22 ± 1.69 a,b,c,d,e,f,g | 6.39 ± 0.65 j | 0.40 ± 0.07 h,i,j,k | 5.99 ± 0.65 l,m |
| Újfehértói fürtös * | 36.37 ± 8.11 i,j | 22.75 ± 1.68 e,f,g,h | 3.55 ± 0.55 b,c | 0.32 ± 0.04 d,e,f,g,h | 3.23 ± 0.53 d,e,f |
| Velencei kései | 35.33 ± 4.99 i,j | 20.53 ± 1.04 a,b,c,d,e | 5.19 ± 0.77 e,f,g | 0.29 ± 0.06 c,d,e | 4.91 ± 0.77 h,i |
| Bivariate Correlations | |||||||||||||||||||
|---|---|---|---|---|---|---|---|---|---|---|---|---|---|---|---|---|---|---|---|
| L | a | b | C | h±33° | TPC | UPOV Skin Colour | Ctifl Scale | UPOV Flesh Colour | UPOV Juice Colour | Soluble Solid Content (SSC) | Firmness (d) Turoni | Acidity | Sweetness | Juiciness | Weight (g) | Seed Weight (g) | Fruit Pulp (g) | ||
| Spearman’s rho | L | 1.000 | |||||||||||||||||
| a | 0.694 ** | 1.000 | |||||||||||||||||
| b | 0.709 ** | 0.992 ** | 1.000 | ||||||||||||||||
| C | 0.696 ** | 1.000 ** | 0.993 ** | 1.000 | |||||||||||||||
| h±33° | 0.718 ** | 0.922 ** | 0.960 ** | 0.926 ** | 1.000 | ||||||||||||||
| TPC | 0.281 ** | 0.296 ** | 0.266 * | 0.291 ** | 0.196 | 1.000 | |||||||||||||
| UPOV Skin colour | −0.322 ** | −0.493 ** | −0.502 ** | −0.494 ** | −0.495 ** | 0.191 | 1.000 | ||||||||||||
| Ctifl scale | −0.314 ** | −0.518 ** | −0.524 ** | −0.519 ** | −0.507 ** | 0.117 | 0.677 ** | 1.000 | |||||||||||
| UPOV Flesh colour | −0.325 ** | −0.533 ** | −0.547 ** | −0.535 ** | −0.553 ** | 0.143 | 0.802 ** | 0.700 ** | 1.000 | ||||||||||
| UPOV Juice colour | −0.322 ** | −0.542 ** | −0.552 ** | −0.544 ** | −0.546 ** | 0.139 | 0.753 ** | 0.666 ** | 0.885 ** | 1.000 | |||||||||
| Soluble solid content (SSC) | 0.236 ** | 0.125 ** | 0.120 ** | 0.124 ** | 0.108 ** | 0.294 ** | 0.116 ** | 0.213 ** | 0.098 * | 0.033 | 1.000 | ||||||||
| Firmness (d) Turoni | 0.054 | 0.244 ** | 0.232 ** | 0.243 ** | 0.196 ** | 0.444 ** | −0.255 ** | −0.275 ** | −0.312 ** | −0.242 ** | −0.023 | 1.000 | |||||||
| Acidity | 0.161 ** | 0.208 ** | 0.205 ** | 0.207 ** | 0.195 ** | 0.333 ** | −0.219 ** | −0.298 ** | −0.154 ** | −0.170 ** | −0.121 ** | 0.347 ** | 1.000 | ||||||
| Sweetness | −0.012 | 0.000 | 0.026 | 0.004 | 0.066 | −0.403 ** | −0.115 ** | −0.098 * | 0.005 | 0.028 | 0.062 | −0.155 ** | −0.032 | 1.000 | |||||
| Juiciness | 0.309 ** | 0.397 ** | 0.405 ** | 0.398 ** | 0.407 ** | −0.107 | −0.605 ** | −0.559 ** | −0.625 ** | −0.445 ** | −0.189 ** | 0.217 ** | 0.280 ** | 0.196 ** | 1.000 | ||||
| Weight (g) | −0.219 ** | −0.068 | −0.050 | −0.066 | −0.016 | −0.409 ** | −0.404 ** | −0.277 ** | −0.312 ** | −0.281 ** | −0.473 ** | 0.199 ** | 0.297 ** | 0.186 ** | 0.267 ** | 1.000 | |||
| seed weight (g) | −0.050 | 0.018 | 0.023 | 0.019 | 0.040 | −0.232 * | −0.343 ** | −0.277 ** | −0.250 ** | −0.220 ** | −0.270 ** | 0.219 ** | 0.396 ** | −0.032 | 0.227 ** | 0.523 ** | 1.000 | ||
| Fruit pulp (g) | −0.229 ** | −0.078 | −0.059 | −0.076 | −0.025 | −0.409 ** | −0.386 ** | −0.262 ** | −0.300 ** | −0.268 ** | −0.473 ** | 0.188 ** | 0.280 ** | 0.199 ** | 0.261 ** | 0.998 ** | 0.467 ** | 1.000 | |
| Component Matrix a | ||||
|---|---|---|---|---|
| Component | ||||
| PC1 | PC2 | PC3 | PC4 | |
| a | 0.922 | 0.298 | 0.01 | 0.029 |
| C | 0.922 | 0.305 | −0.007 | 0.036 |
| h33+− | 0.914 | 0.092 | −0.17 | −0.023 |
| b | 0.905 | 0.333 | −0.11 | 0.078 |
| UPOV Flesh colour | −0.854 | 0.283 | 0.104 | 0.09 |
| UPOV Skin colour | −0.853 | 0.305 | −0.006 | 0.012 |
| UPOV Juice colour | −0.85 | 0.225 | 0.113 | 0.057 |
| Ctifl scale | −0.808 | 0.277 | 0.061 | 0.077 |
| L | 0.791 | 0.432 | −0.162 | 0.072 |
| Juiciness | 0.644 | −0.347 | −0.148 | 0.056 |
| Weight (g) | 0.1 | −0.911 | 0.065 | 0.046 |
| Fruit pulp (g) | 0.095 | −0.898 | 0.048 | 0.029 |
| seed weight (g) | 0.111 | −0.545 | 0.267 | 0.263 |
| Firmness (d) Turoni | 0.256 | −0.042 | 0.753 | −0.014 |
| TPC | 0.284 | 0.439 | 0.717 | 0.05 |
| Acidity | 0.292 | −0.292 | 0.606 | 0.305 |
| Sweetness | −0.21 | −0.316 | −0.431 | 0.664 |
| Soluble solid content (SSC) | −0.001 | 0.598 | 0.01 | 0.617 |
Disclaimer/Publisher’s Note: The statements, opinions and data contained in all publications are solely those of the individual author(s) and contributor(s) and not of MDPI and/or the editor(s). MDPI and/or the editor(s) disclaim responsibility for any injury to people or property resulting from any ideas, methods, instructions or products referred to in the content. |
© 2023 by the authors. Licensee MDPI, Basel, Switzerland. This article is an open access article distributed under the terms and conditions of the Creative Commons Attribution (CC BY) license (https://creativecommons.org/licenses/by/4.0/).
Share and Cite
Desiderio, F.; Szilagyi, S.; Békefi, Z.; Boronkay, G.; Usenik, V.; Milić, B.; Mihali, C.; Giurgiulescu, L. Polyphenolic and Fruit Colorimetric Analysis of Hungarian Sour Cherry Genebank Accessions. Agriculture 2023, 13, 1287. https://doi.org/10.3390/agriculture13071287
Desiderio F, Szilagyi S, Békefi Z, Boronkay G, Usenik V, Milić B, Mihali C, Giurgiulescu L. Polyphenolic and Fruit Colorimetric Analysis of Hungarian Sour Cherry Genebank Accessions. Agriculture. 2023; 13(7):1287. https://doi.org/10.3390/agriculture13071287
Chicago/Turabian StyleDesiderio, Francesco, Samuel Szilagyi, Zsuzsanna Békefi, Gábor Boronkay, Valentina Usenik, Biserka Milić, Cristina Mihali, and Liviu Giurgiulescu. 2023. "Polyphenolic and Fruit Colorimetric Analysis of Hungarian Sour Cherry Genebank Accessions" Agriculture 13, no. 7: 1287. https://doi.org/10.3390/agriculture13071287
APA StyleDesiderio, F., Szilagyi, S., Békefi, Z., Boronkay, G., Usenik, V., Milić, B., Mihali, C., & Giurgiulescu, L. (2023). Polyphenolic and Fruit Colorimetric Analysis of Hungarian Sour Cherry Genebank Accessions. Agriculture, 13(7), 1287. https://doi.org/10.3390/agriculture13071287