Abstract
Amaranth, a pseudocereal crop which is rich in nutrients and climate resistant, can provide an opportunity to increase food security and nutritional content for the growing population. Farmers rely mainly on synthetic fertilizers to improve the quality and yield of the crop; however, this overuse harms the ecosystem. Understanding the mechanism causing this environmental deterioration is crucial for crop production and ecological sustainability. In recent years, high-throughput phenotyping using Artificial Intelligence (AI) has been thriving and can provide an effective solution for the identification of fertilizer overuse. Influenced by the strength of deep learning paradigms and IoT sensors, a novel multimodal fusion network (M2F-Net) is proposed for high-throughput phenotyping to diagnose overabundance of fertilizers. In this paper, we developed and analyzed three strategies that fuse agrometeorological and image data by assessing fusion at various stages. Initially two unimodal baseline networks were trained: Multi-Layer Perceptron (MLP) on agrometeorological data and a pre-trained Convolutional Neural Network (CNN) model DenseNet-121 on image data. With these baselines, the multimodal fusion network is developed, capable of adeptly learning from image and non-image data and the model’s performance is evaluated in terms of accuracy and Area Under Curve (AUC). Moreover, the fusion approaches that are considered outperformed the unimodal networks remarkably with 91% accuracy. From the experimental result, it is proven that incorporating agrometeorological information and images can substantially boost the classification performance for the overabundance of fertilizer.
1. Introduction
Precision agriculture is an advanced farming approach that uses technology to optimize crop yields while minimizing environmental impact [1]. By leveraging such technology, farmers can make more informed decisions about crop management, resulting in better yield and reduced environmental impact. Plant phenotyping plays a crucial role in this process by providing data on plant growth and health, which can inform decisions on when and how much to apply inputs such as water and fertilizers. Recent advancements in machine learning (ML) and deep learning (DL) have enabled the development of innovative plant phenotyping techniques that can quickly and accurately analyze large amounts of data on plant growth and development [2]. Several studies have been carried out on the automated phenotyping of plants and its genomic analysis [3,4,5], while there is still a lack of research focusing on environmental sustainability and soil degradation due to the overuse of inorganic fertilizers. To address this issue, in this work, a study on an Amaranthus crop is conducted by analyzing phenotypic growth differences in different soil conditions (varying fertilizer dosage) using DL classification techniques.
Amaranth (Amaranthus spp.) is a highly nutritious, underutilized crop that has a significant influence on reducing malnutrition and is widely farmed in South Asia and Africa [6,7]. Its high nutritional value, genetic diversity, and weather resistance make it a promising crop for nutritional stability in a rapidly evolving climate. It has a significant commercial value [8] due to its widespread international consumption, particularly in India. It grows well on average to rich, well-draining soil with good amounts of nitrogen and phosphorus. Amaranthus, like most other crops, requires soil with good organic content and an adequate nutritional reserve for maximum yield. Chemical fertilizers are commonly used to improve crop quality by supplying nutrients essential for crop growth. These fertilizers considerably enhance productivity and nutrient-dense plant development when used in sufficient dosage. However, farmers are tempted to use unnecessarily large amounts of fertilizer that is a reliable supply of nitrogen, phosphate, and potassium to increase their profitability [9]. Although this over fertilization desire is to maximize the yield, it results in abusing the soil quality by altering the physical, chemical, and microbiological indicators [10]. There are also several visible and invisible symptoms such as fertilizer burn, browning leaf, death of seedlings, and root burn, all of which eventually decrease the yield.
In general, the detrimental effect of chemical fertilizers on crop quality and environmental, genetic susceptibility is a major constraint to their usage. This leads to the emission of hazardous greenhouse gases into the environment. Groundwater pollution is yet another serious problem caused by inappropriate fertilizer usage [11]. High dosages of chemical fertilizer deteriorate the organic matter content, increase in soil pH, depreciation of beneficial soil microorganisms, and an increased erosion rate. Numerous studies have revealed that applying only the necessary amount of fertilizers can significantly increase the optimal crop yield without causing any environmental damage [12,13,14]. In order to achieve an immense yield, it is customary for farmers to apply unnecessarily high dosages of fertilizers to the soil, which has several negative effects on the environment [15]. However, there is no proven confirmation available about how crops would respond to high fertilization levels. A farmer may be persuaded to reduce fertilizer use if there were an easy automated way to identify instances of abuse. Therefore, the aim of this research is to determine how inorganic fertilizers affect the growth and yield of Amaranthus through automated phenotyping and classification through “deep learning” (DL), a cutting-edge technology.
With significant advancements in technological power in recent years, it is now feasible to make use of the massive amount data that is available from several resources in discovering new techniques regarding agricultural tasks [16]. Advanced techniques such as DL and Internet of Things (IoT) are cutting-edge technologies that have opened up new possibilities for automating precision agricultural activities [17]. Data collection of such activity can be of any form: digital images, measurements from different soil and climate related sensors, weather data, etc. With these data, different Artificial Intelligence (AI) techniques are developed and tested effectively. In particular, popular ML and DL approaches offer efficient solutions for developing such integrated high-throughput phenotyping systems [18]. However, there exist few issues with using conventional unimodal deep learning: with only images, the performance of the model can be degraded due to several unexpected circumstances such as severe light illumination, background noise or low-quality recorded images. Similarly, with sole IoT sensor data, geographical and climatical constraints can lead to inadequate accuracy of the model.
In the context of fertilizer overuse identification, multimodal fusion strategies are crucial for capturing a holistic view of the problem. Each imaging modality provides unique insights into the crops, soil conditions, weather conditions, and fertilizer distribution patterns. By fusing these modalities, one can leverage their complementary strengths, compensate for individual limitations, and obtain a more comprehensive understanding of fertilizer overuse. Hence, fusing these data together and moving towards multimodal fusion could open up new avenues for a robust solution as it utilizes the advantage of each modality. In this paper, a novel deep learning framework to phenotype the features of Amaranthus in order to assess its adaptability in different chemically treated soil conditions is proposed. We investigate multimodal approaches for high-throughput phenotyping to identify excessive fertilizer by fusing information from different modalities such as plant images and associated non-image data. The hypothesis is that a Convolutional Neural Network (CNN) model can learn more precisely when different modalities are fused than that of a single trained model on individual modalities. To determine the optimum technique to integrate data from two modalities and improve such network, experiments are carried out using three adaptive multimodal fusion strategies.
This study makes the following significant contributions:
- A novel CNN-based framework termed multimodal fusion network (M2F-Net) is developed to achieve accurate fertilizer overuse identification and crop phenotyping.
- In order to improve the effectiveness of classification, this method makes use of the agrometeorological data gathered from sensors as an additional key feature.
- Three different fusion approaches are investigated in order to determine the best way to combine data from various modalities.
The remainder of the paper is structured as follows: Section 2 presents a brief review of automated plant phenotyping, works related to over fertilization and multimodal data fusion techniques. Section 3 elucidates the data preparation and the proposed multimodal framework with baseline models. Section 4 exemplifies the results with the discussion, and finally, Section 5 concludes the paper.
2. Related Work
2.1. Plant Phenotyping
The essence of emerging plant phenotyping is to provide quantitative information on the dynamic interactions of plants in a specific environment. Plant phenotyping is the most important step in several numerous precision agricultural tasks, such as image-based crop weed classification [19], plant disease and pest identification [20], fruit detection [21], crop growth monitoring [22], and yield prediction [23]. Modern technology such as image-based high-throughput phenotyping that can evaluate plant growth and physiological state without intrusive methods is becoming more widely available, and this has largely been the source of recent advancements [24]. The quantitative screening protocols with different sensors over environmental conditions can lead to form a good phenotyping system. In this regard, much research has been carried out, much of which is discussed here. Lee et al. proposed an automated, high-throughput plant phenotyping system for a computerized plant-imaging analysis pipeline consisting of machine learning-based plant segmentation [25]. Super pixel-based Random Forest (RF) was used for segmenting images for the plant growth analysis. The performance analysis was carried out with three ML algorithms and found RF to be more accurate. An automated image analysis system was developed to extract plot-level vegetation indexes (CIAT PhenoI) in [26]. Using these vegetation indices and the ground-truth data acquired from a multispectral sensor, multiple linear regression models were built at various growth phases of cassava development. The spectral indices/features were integrated with different ML approaches to create models and forecast cassava root yield. Another automated phenotypic segmentation algorithm that deals with tomatoes and its structural parameters was developed [27]. A phenotyping framework and a Structure From Motion (SFM) method were used to generate the three-dimensional model. The analysis results show that the daily plant growth and its height are the most responsive trait to early water stress.
With a significant focus on Amaranthus crop phenotyping, much research has been carried out emphasizing both physiological and morphological traits. Winnie et al. studied phenotyping morphological and nutritional attributes in Amaranthus [28]. Considering four species, the phenotypic data were correlated with five nutrient traits using ANOVA and found that greenness with oxalate and vitamin C contents are highly correlated. This study ensures that nutrient quality can be ensured with the color of the leaves. Several researchers have focused on molecular-based phenotyping in Amaranthus [29,30], genetic diversity analysis [31], etc. Similarly, the influence of soil and light conditions on the growth of Amaranthus has been studied in various aspects affecting its nutrient content, growth, and development [32].
2.2. Over Fertilization
Over fertilization is one of the primary concerns impacting both plant development and the quality of the soil [33]. Numerous studies have been conducted regarding the impacts of both organic and inorganic fertilizers. A comparative effect of organic (OG), organomineral (OMF), and mineral fertilizers was proposed in a previous study. Considering soil properties, nutrient intake, growth, and yield of maize, experiments were carried out with four classes, namely, control, OG, OMF, and NPK (Nitrogen, Phosphorus, and Potassium) fertilizers. The analytical results prove that OG and OMF at a low level of application could be enough to improve plant nutrients [34]. Similarly, a comparison of the effects of NPK fertilizer and organic wastes on maize production, nutrient availability, and the deposition of dry matter was conducted [35]. Another study was carried out by Olowoake et al. [36] in Nigeria on developing and producing Amaranthus with different compost, namely, unamended compost, OMF, and NPK. The experiment was conducted on ANOVA and proved that both the yield and residual effect of Amaranthus are significantly higher with OMF than that of NPK.
2.3. Multimodal Data Fusion
A massive amount of data is produced by the numerous methods used for precision agricultural tasks and especially for plant monitoring [37]. To handle these data, there are two options. One is building models on individual modals and assessing their efficacy. The second option involves combining data on plant growth that have been gathered from various sources [38]. Numerous studies have been conducted with the aim of multimodal data fusion. By boosting contextual data for plant disease diagnosis, a multi-context fusion CNN network was proposed. ContextNet is used for extracting contextual data and CNN for visual features and integrated to the fused MCF network. The algorithm achieves an accuracy of 97.5% with a dataset of 50,000 crop disease samples [39]. Another approach, rice fusion for the diagnosis of rice disease, was developed utilizing multimodal fusion. The suggested framework is capable of extracting numerical features from sensor-collected data as well as visual features from images. A concatenation layer is employed to further combine these features and the model achieved an accuracy of 95.31%, which is higher than the accuracy of an alternative simple unimodal framework [40].
However, these previous studies failed to consider various methods for combining heterogeneous information. Instead, we concentrate on several multimodal architectural variations that may be enhanced to simultaneously learn from image and non-image data. In summary, plant phenotyping research progress has stalled in recent years despite the success of the existing approaches and no study has been conducted from the perspective of the automated identification of fertilizer over usage. Furthermore, due to several difficulties in visual inference conditions, such as illumination and complex backgrounds, most of these methods might not attain adequate performance in real-world plant phenotyping scenarios. A novel multimodal fusion network termed M2F-Net is therefore designed to overcome these issues in agricultural phenotyping tasks by merging phenological data and images to develop and strengthen the model.
3. Materials and Methods
3.1. Data Preparation
This section presents a detailed description of the multimodal dataset collected through the experiment conducted on different soil conditions of an Amaranthus crop. The experiment was carried out for 45 days (harvesting age) in the summer season of 2022. The soil used in the experiment was collected from the local village of Karaikal in India, with no prior records of fertilizer application.
The soil was first analyzed for NPK using a standard procedure, and it was reported that the results were significantly below the typical NPK levels for Tamilnadu soil. Optimum Nutrient Treatment (ONT) entails the procedure of bringing the soil to the prescribed NPK levels. For Amaranthus crops, the report [41] reveals that the values for ONT could be 1.5 g of urea, 1.95 g of Diammonium Phosphate (DAP), and 0.69 g of Muriate of Potash (MOP). Despite this being a sufficient NPK requirement, the majority of farmers overuse fertilizers due to lack of knowledge [42]. Ten classes of nutrient treatment for Amaranthus were developed in order to comprehensively study the impact of the fertilizers. The measurements of fertilizers for each treatment are represented in Table 1. The class categories include an optimal class (C1) with the optimal recommended amount (ONT) of NPK fertilizer and a control class (C10) with no fertilizer. Further, to increase the effects of fertilizers, two levels were formed: a moderate excess level of fertilizer (C2–C5) and a high excess level of fertilizer (C6–C9). All the experiments and data collection were carried out with the guidance of agricultural experts.

Table 1.
Measurements of fertilizers for each treatment.
3.2. Dataset Description
The data were acquired on two scales on a daily basis. First, the agrometeorological sensor-related numerical values were collected. The weather- and soil-related data that were measured on a daily basis include temperature, relative humidity, soil pH, soil moisture, and sunlight intensity (depicted in Table 2). Temperature and relative humidity data from the HTC1 sensor were recorded. A 4-in-1 digital soil test meter was used to gather all soil-related data, including soil temperature, pH, moisture, and sunlight. Secondly, along with agrometeorological data, the datasets of 750 images were captured for 45 days (represented in Figure 1). Therefore, the dataset is ideal for multimodal data fusion. These images of an Amaranthus crop with different chemically treated soil conditions were acquired with a Sony optical SteadyShot DSC-WX80 camera (28 mm–22.4 mm sensor size, 16.2 megapixels resolution, with focal distance of 5 mm, exposure time: 1/30 sec, ISO-100 captured in natural daylight) mounted on a tripod. The image dimension is 4608 × 3456 pixels. Sample images for each class are depicted in Figure 2.
Table 2.
Samples of agrometeorological non-image data collected for 45 days through sensors.
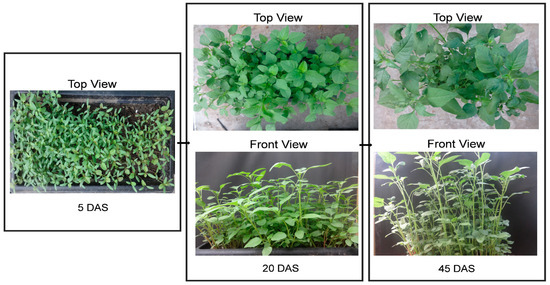
Figure 1.
Dataset samples created with top and front views 5, 20, and 45 days after sowing (DAS).
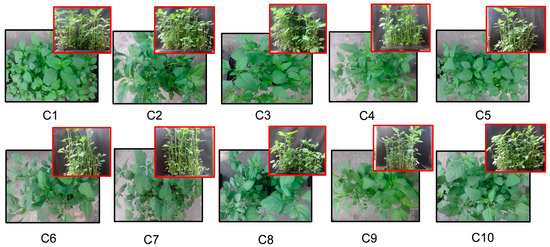
Figure 2.
Sample images of each class involved in the treatments.
3.3. Proposed Framework
To understand the multimodal fusion and to determine whether the classification could be enhanced by integrating image and non-image information from agrometeorological sensors, stand-alone baseline models for both non-image and image-only data were trained. Basic MLP architecture was used for the non-image data. The popular CNN model, DenseNet-121, was adapted for image-only data [43]. The overall illustration of the proposed framework is shown in Figure 3. The next sub section discusses the architecture of these baseline models and the proposed multimodal fusion technique.
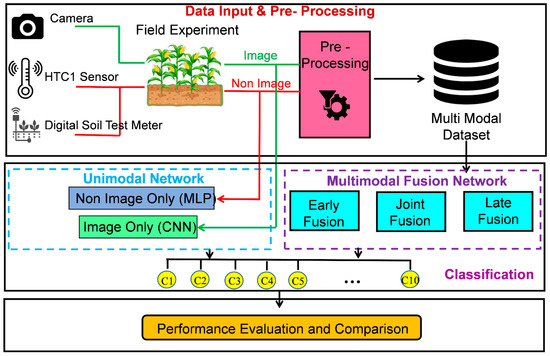
Figure 3.
Illustration of overall workflow of the proposed M2F-Net framework.
3.3.1. Baseline 1: Neural Network
MLP is a supervised neural network that is most commonly used in the decision support system that focuses on continuous data. A typical MLP network is capable of categorizing non-linear data with three or more layers.
The proposed MLP network uses continuous data from agrometeorological sensors (sample shown in Table 2) as its input. The input data have dimensions of 271 × 10, where the 271 rows are the total agrometeorological features wrt. DAS and image_ID and the ten columns of class labels. The dataset is continuous and non-linearly separable. A sequential model is built with a custom number of layers. The input layer consists of 6 neurons representing the sensor data, namely, temperature, relative humidity, soil temperature, soil pH, moisture, and sunlight, which are applied to the neural network as input. The numbers of hidden layers and neurons in each layer are more important factors when training the features of the input data and enhancing classification accuracy. In this work, two hidden layers were used, with five neurons in each layer. The choice of using two hidden layers in the Baseline 1: MLP architecture was likely influenced by the insights gained from the literature study. Given the limited size of our dataset, we opted for a relatively simple architecture that could effectively capture the underlying patterns and relationships. The output layer consists of 10 neurons representing the classes (set of treatments) in Figure 4.
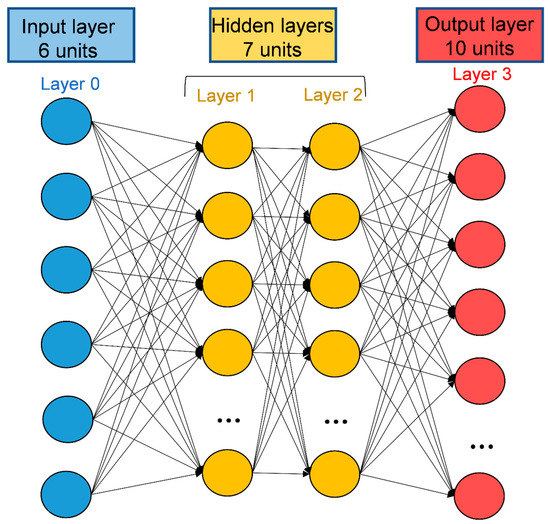
Figure 4.
Baseline 1: MLP architecture.
The model was constructed with a 7:2:1 train, validation, and test data ratio. The dense layer is included with the ReLU activation function. With each neuron, the set of weights and its updation in backpropagation is a crucial step for minimizing the loss function or maximizing the learning efficiency. Optimization and hyperparameters are the essential aspects for such good network convergence. The learning rate chosen was 0.01. The categorical cross-entropy loss function was used for our multi-class problem, and the optimizer is Adam. The SoftMax activation function was employed as the last layer to categorize multiple classes (ten classes here). The model was trained with batch size 64, and the number of epochs is set to 300.
Finally, this unimodal baseline model’s performance was evaluated with the metrics such as accuracy, precision, recall, and F1 score, and achieved a validation accuracy of 76%.
3.3.2. Baseline 2: CNN
Image classification is a fundamental computer vision task. CNN is the most successful approach for automated image-based precision agricultural tasks. Using the training dataset that has been previously defined for the neural network, it predicts possible future classifications. Utilizing its advantages, this neural network tackles the curse of dimensionality problem. The accuracy and speed of classification could be enhanced with a robust model. Therefore, a feasible DL model architecture is needed. However, building a deep CNN model from scratch and training could be computationally very expensive. Transfer learning-based models have been suggested by several researchers as a solution to these problems [44,45,46]. These models were developed and trained using the ImageNet dataset that contains 1000 categories of images. Due to the similarity of visual characteristics like edges and contours across datasets, these transfer learning models can be trained on any dataset. The transfer learning strategy has therefore been proven to be the most effective and reliable model for classification tasks. Prominent CNN models including VGG-16 [47], MobileNet [48], and DenseNet [43] are frequently utilized for the transfer learning approach. DenseNet is among the most widely used and powerful pre-trained models that can make use of dense connections within layers using dense blocks. The benefit of this network is that it addresses the gradient problem and reuses features, and thus exploits the benefits of the dense layers. In this work, DenseNet-121 architecture is used as the baseline CNN for the classification task. An ablation study of several state-of-the-art CNN architectures was carried out and DenseNet-121 was found to perform the best on our dataset. As a result, we selected it as our baseline CNN model for further experiments with multimodal data.
3.3.3. DenseNet-121
DenseNet-121 is one of the deep CNN models developed for classification tasks that utilizes dense layers [43]. In this network, each layer transfers its constructed feature maps to the subsequent layer along with the inputs from each layer. Each layer performs concatenation, which allows the next layer to obtain the cumulative knowledge of all the previous layers. These feature mappings of the previous layer are transferred to the later layers, further resulting in a narrow and confined network leading to fewer channels in dense blocks. The general architecture of DenseNet-121 is represented in Figure 5.
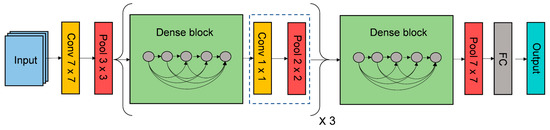
Figure 5.
Baseline 2: DenseNet-121 architecture.
DenseNet-121 captures input images with a dimension of 224 × 224. All of the images were consequently rescaled to the appropriate 224 × 224 dimension. The train, validate, and test ratio was set to 7:2:1. With the batch size of 128, the learning rate was fixed to 0.001 and the momentum was fixed to 0.9. To address the limited number of samples in the dataset, data augmentation techniques were utilized, which involved applying various transformations such as rotation (both horizontal and vertical), scaling, and flipping. The optimizer and loss function are the key elements that provide the network with the ability to handle large amounts of data and regulate the learning speed [49]. Different optimizers such as Adam, Stochastic Gradient Descend, and RMSprop were applied and found that the Adam optimizer has demonstrated superior performance. The loss function used was the categorical cross-entropy loss function. The final layers were replaced with two fully connected layers with SoftMax activation for final classification and the model attained an 84.03% test accuracy.
3.3.4. Multimodal Fusion
The network becomes more resilient, fault tolerant, and accurate when data from various sources are fused than when it is only used from one source. Multimodality in AI refers to the problem-solving process where the single model uses two or more heterogeneous inputs. For precision agricultural tasks, data collected from different sources (modalities) are widely utilized, such as meteorological information, images of affected crops, and real-time data from sensors. Combining these modalities enhances the model’s overall performance and effectiveness. An end-to-end multimodal framework for high-throughput phenotyping is proposed in this work, which uses agrometeorological features to examine over fertilization and the correlation between crop image from agro-climate data. The architecture of the proposed framework is depicted in Figure 6. In contrast to the traditional CNN architecture, we incorporated an additional module to extract agrometeorological features and utilized it by merging with image features. Three basic approaches were considered for fusing tabular non-image features with image features; each of which varies at the point where the features are fused in the multimodal architecture. They are early fusion, joint fusion, and late fusion, which are elaborated in the next section. The numeric agrometeorological data include meteorological and soil-related information, such as temperature, relative humidity, soil pH, soil moisture, and sunlight intensity. Agrometeorological data have the potential to be extremely influential in crop growth and might be used to enhance identification performance. We developed the M2F-Net to utilize the contextual data in order to improve the accuracy rate.
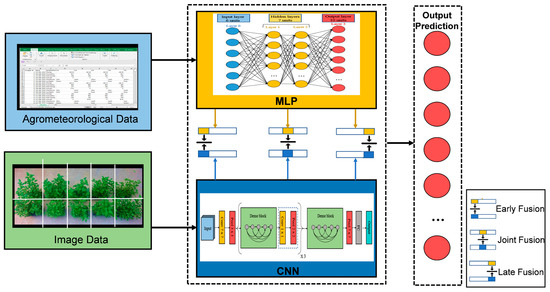
Figure 6.
Architecture of proposed M2F-Net framework.
With this multimodal data, our proposed system includes three main components: MLP, baseline CNN, and a fully connected network. The MLP model is employed to extract contextual information of different chemically treated crop classes. DenseNet-121 is employed for feature extraction which has the ability to produce a set of feature maps that highlight different aspects of the images. Furthermore, a fully connected network is constructed to concatenate both the extracted features and these fused feature vectors are simultaneously learned. Final SoftMax layers are used to produce the classification output. Thus, our proposed M2F-Net is capable of strongly connecting features from two different unimodal networks into a unified deep learning framework and achieves performance for the novel high-throughput phenotyping in identifying fertilizer overuse.
3.3.5. Experimenting by Varying Fusion Approach
Three experiments were carried out based on the types of features one could fuse during training: early fusion, joint fusion, and late fusion. These experiments were carried out in order to develop a robust multimodal framework and to comprehend how the various fusion approaches impact the performance of the model.
Early Fusion
Early fusion involves fusing many modalities into a combined feature vector before loading it to any model (Figure 7a). Several mechanisms combine input modalities, such as concatenation, pooling, and gated units. Combining the actual features defines type I, whereas combining features that have been manually extracted, analyzed using imaging software, or learned out from different networks defines type II. According to the proposed framework, CNN is considered as a feature extraction module, enabling early fusion type II, and the fusion of these features with non-image input from a second modality. This fusion concatenates the 33 non-image inputs onto the 2048 feature vectors that were extracted from the crop image. A series of fully connected layers with nonlinear ReLU functions are then applied to the concatenated feature vectors, followed by a SoftMax layer, to generate the final classification.
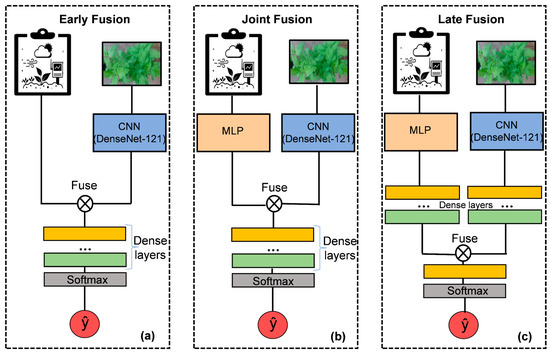
Figure 7.
Representation of three different DL-based fusion strategies (a) Early fusion, (b) Joint fusion and (c) Late fusion.
Joint Fusion
Joint fusion is the process of feeding learned, extracted features from intermediate layers into a final layer together with features from several modalities. Neural networks are often employed to perform joint fusion type I because of their capacity to transmit feature maps from intermediate layers. In our model, the output of each model and its probabilities were taken into consideration and fed to the series of fully connected layers for final classification. The probability fusion simply incorporates the individual baseline models on its own. (Figure 7b).
Late Fusion
The basic idea of late fusion is the fusing significant predictions from different models for the final prediction (Figure 7c). Here, several modalities are employed for individual models with the predictions of several models are combined to make the final decision by utilizing the aggregation function. For the classification, we considered the aggregation function to be average. This fusion mechanism concurrently learns feature vectors from both the crop image and non-image data. Furthermore, it concatenates the acquired feature vectors from each modality to create a final prediction.
3.4. Performance Evaluation Metrics
The results of all five models were evaluated and compared for the analysis. Moreover, the validation accuracy and confusion matrix are the two factors that were used to evaluate the architecture. The word validation accuracy refers to how well the trained model mimics and performs on the test data. A standard performance metric that is used to measure the efficacy of the model is classification accuracy. The confusion matrix is the heatmap in a matrix form where the row represents the ground truth class labels, and the column represents the predicted outcome. The matrix represents the rate of each class’s true positive (TP (correctly classified positive)), true negative (TN (correctly classified negative)), false positive (FP (misclassified positive)), and false negative (FN (misclassified negative)) values. To measure the overall performance of each model, the F1 score was also measured. It is the harmonic mean of precision and recall, providing a balanced measure of both metrics. The formulas used to calculate the model’s accuracy, precision, recall, and F1 score are given in the Equations (1)–(4) below:
4. Results and Discussion
This research aimed to use the multimodal fusion concept for identifying fertilizer overabundance on an Amaranthus crop. Agrometeorological data and images of the Amaranthus crop are two different modalities that were taken into consideration. We used Jupyter Notebook in the Google Colab environment as our software platform. For implementation, several standard libraries such as Keras, TensorFlow, and Matplotlib were utilized. The language used is Python 3.7. The hardware specifications for the GPU and CPU used for the model is displayed in Table 3. At the 50th epoch, the MLP model begins to converge, while the CNN model reaches its maximum accuracy after the 90th epoch. The fusion approach reaches saturation around the 60th epoch. When compared to fusion models, the performance of the individual models is less. Several metrics were considered for the performance evaluation of the proposed model and its variations (Section 3.4). The metrics considered and the results obtained by the proposed model are discussed in the below section.
Table 3.
Hardware configuration for the implementation of proposed M2F-Net.
Performance Analysis
The performance of the proposed fusion models was compared with the baseline CNN and MLP models. Five architectures were trained that include two baselines unimodal mentioned in Section 3.3.1 and Section 3.3.2, and the three variations of multimodal fusion stated in Section 3.3.3. With randomly initialized weights, all models were trained using the same optimizer “Adam”, with batch size 64 and the learning rate is fixed to 0.01.
Performance metrics, including classification accuracy, precision, recall, and F1 score are calculated to evaluate the effectiveness of various models, as shown in Table 4. The accuracy loss versus epoch graph, shown in Figure 8, illustrates the training process and provides valuable insights into the model’s learning capabilities. The graph demonstrates the relationship between the number of training epochs and the accuracy loss achieved by all three models on the validation dataset. Initially, as the model undergoes training, there is a noticeable increase in accuracy with each epoch, indicating that the model is learning and improving its predictive capabilities.
Table 4.
Performance evaluation of both unimodal and proposed M2F-Net.
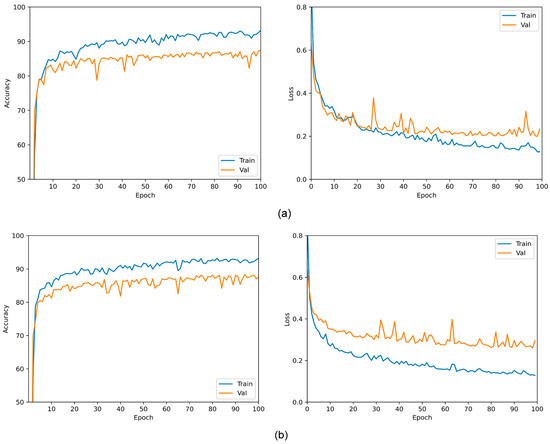
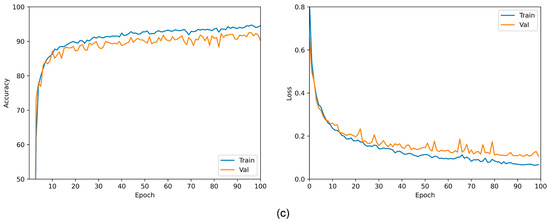
Figure 8.
Accuracy and loss vs. epoch of various fusion strategies: (a) Early fusion, (b) Joint fusion, and (c) Late fusion.
In the early fusion approach, it is observed that the training loss and accuracy gradually converged and reached a saturation stage of around the 60th epoch. Conversely, the validation accuracy continued to improve and peaked at the 80th epoch. Beyond this point, there was no significant fluctuation in the training accuracy. Notably, the joint fusion model achieved a validation accuracy of 87% at the 70th epoch, after which the learning process reached saturation. However, it is important to highlight that the validation accuracy curve started to decline after the 96th epoch. In the late fusion technique, both the training and validation accuracy steadily converged after the 40th epoch, reaching a maximum of 91%. These findings demonstrate the dynamics of accuracy improvements over epochs for different fusion strategies. The confusion matrix for the accuracy of the test data performance for the excessive fertilizer identification by the proposed model is shown in Figure 9. Moreover, models trained on both related agrometeorological data and crop imaging perform better than unimodal versions in terms of validation accuracy.
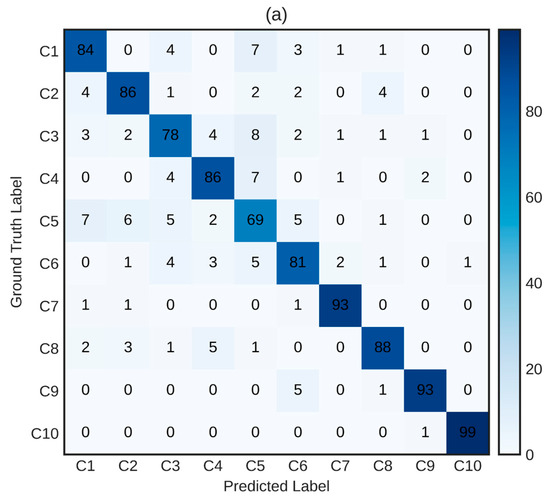
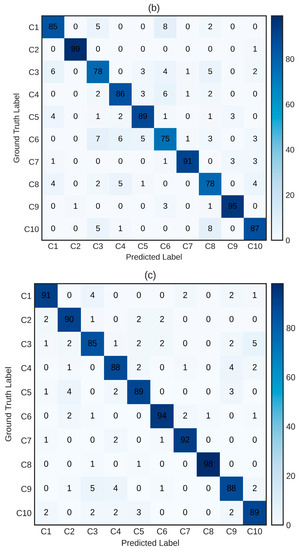
Figure 9.
Confusion matrix of various fusion strategies: (a) Early fusion, (b) Joint fusion, and (c) Late fusion.
Considering fusion models on both image and non-image data, early fusion attained an accuracy of 86%, joint fusion achieved an accuracy of 87%, and late fusion achieved an accuracy of 91%. Additionally, with the help of Area Under Curve (AUC), we discover that when compared to unimodal baselines, false positive rates are drastically reduced while fusing two modalities at a high-sensitivity operating point. Specifically, specificity at 95% sensitivity increases with 12% in the late fusion approach. Regarding accuracy and AUC, each fusion approach performs considerably better than the image-only baseline shown in Figure 10.
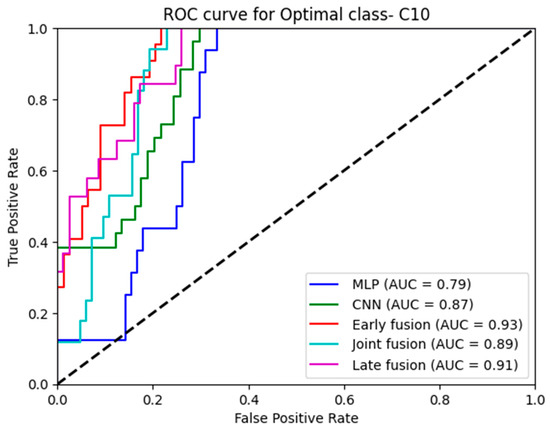
Figure 10.
ROC curve for the optimal class (C10).
When fusion methods are compared to one another, late fusion is the model that performs the best in terms of AUC and specificity at 95% sensitivity. In terms of AUC, early and late fusion considerably outperforms joint fusion. In summary, the models that integrate intermediate features outperform the model that combines output probabilities prior to learning a decision. Our primary contribution is the analysis of three fundamental strategies for integrating features of different modalities and the subsequent tests for determining the most effective ways to integrate data from multiple modalities. Figure 11 describes the comparison of all five models. We observed that fusing output probabilities proved to be inadequate when compared to integrating intermediate-learned features among the fusion variants for high phenotyping and excess fertilizer classification. In addition, no discernible difference is observed in performance when we merge the actual non-image features with the learned features from the image as well as merging the learned features from both image and non-image data.
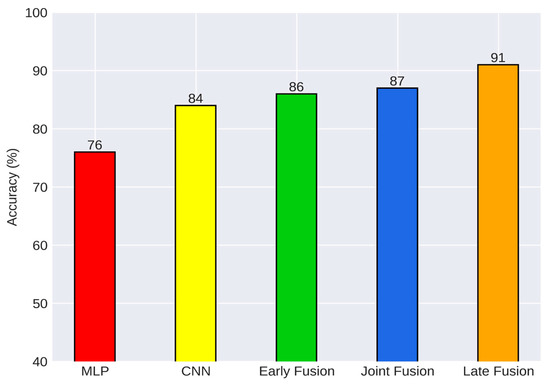
Figure 11.
Performance comparison of unimodal and multimodal fusion approach.
Our approach to identifying fertilizer overuse through image-based phenotyping is a groundbreaking method and to the best of our knowledge, no previous research has delved into this specific domain, making direct comparisons challenging. However, we attempted to evaluate our model’s performance by comparing it with existing approaches in image-based phenotyping for precision agricultural tasks. In our comparative analysis (Table 5), a range of studies were examined that utilized various imaging modalities and targeted different phenotyping tasks from the literature.
Table 5.
Comparison of proposed M2F-Net with existing approaches.
It is found that our proposed model for identification of fertilizer overuse performs better in terms of accuracy. With the analysis of the performance of these approaches, it is worth noting that although one of the authors, Koh et al. [52], achieved slightly higher performance (~2%), it is important to consider the differences in problem context and dataset characteristics as they focus on wheat lodging assessment through phenotyping.
Thus, our novel high-throughput phenotyping approach for identifying fertilizer overuse has practical implications with good performance. The study yielded significant findings, demonstrating the ability to classify differences among various treatments that are imperceptible to the human eye. This provides farmers with a simple and effective way to identify instances of fertilizer overdosage. Additionally, the study found that the growth and yield between optimally fertilized and over-fertilized crops were almost on par. This emphasizes the practicality and sufficiency of using optimal fertilizer levels in farming practices.
While the proposed system offers several advantages, it is not without its limitations. One significant drawback is the limited availability of data, particularly given that the experiments were conducted using a short-season crop, Amaranthus. The use of multiple modalities further exacerbates the issue, as integrating data from different sources can increase the complexity of the model and the computational resources required for implementation.
5. Conclusions
The major cause of the depletion of soil quality is the use of ineffective soil and crop management techniques during cultivation. Without a thorough understanding of the nutrient requirement for crop growth, chemical fertilizers have been applied excessively, which has resulted in a steady decline in soil quality and eventual yield loss. To address this issue of fertilizer overuse using the emerging deep learning approach, a high-throughput automated phenotyping with multimodal fusion network (M2F-Net) is proposed in this work. The proposed M2F-Net model uses the combination of two modalities to improve the system’s performance and robustness. We explored three DL-based fusion strategies for integrating crop image data with sensor-collected non-image agrometeorological data. In order to evaluate the strength of the proposed M2F-Net, the two unimodal baseline networks were implemented and studied. The experimental results clearly indicate that all three fusion strategies exhibited significantly better performance compared to the individual unimodal networks for classifying different chemically treated crops. Specifically, our proposed M2F-Net achieved an impressive accuracy of 91% with late fusion, outperforming the MLP and CNN models, which achieved accuracies of only 76% and 84%, respectively. The fusion of intermediate features yielded the highest performance, highlighting the importance of integrating features from multiple modalities. By leveraging the fusion of intermediate features in the M2F-Net, our proposed model can contribute to more accurate and right decision making regarding fertilizer usage. As a future scope, the proposed model can be further deployed with the integration of IoT devices, which holds great potential for enhancing the practical implications of our work. Additionally, exploring time series image analysis can provide valuable insights into the temporal patterns and trends of fertilizer overuse, offering a promising avenue for agricultural practices.
Author Contributions
Conceptualization, methodology, software, validation, formal analysis, visualization, writing—original draft preparation, J.D.; investigation, resources, data curation, writing—review and editing, J.D. and B.S.; supervision, B.S. All authors have read and agreed to the published version of the manuscript.
Funding
This research received no external funding.
Institutional Review Board Statement
Not applicable.
Informed Consent Statement
Not applicable.
Data Availability Statement
The data presented in this study are available on request from the corresponding author.
Conflicts of Interest
The authors declare no conflict of interest.
References
- Shafi, U.; Mumtaz, R.; García-Nieto, J.; Hassan, S.A.; Zaidi, S.A.R.; Iqbal, N. Precision agriculture techniques and practices: From considerations to applications. Sensors 2019, 19, 3796. [Google Scholar] [CrossRef] [PubMed]
- Li, L.; Zhang, Q.; Huang, D. A review of imaging techniques for plant phenotyping. Sensors 2014, 14, 20078–20111. [Google Scholar] [CrossRef] [PubMed]
- Nguyen, C.; Sagan, V.; Bhadra, S.; Moose, S. UAV Multisensory Data Fusion and Multi-Task Deep Learning for High-Throughput Maize Phenotyping. Sensors 2023, 23, 1827. [Google Scholar] [CrossRef] [PubMed]
- Alcântara, J.F.D.; Santos, R.G.D.; Baio, F.H.R.; Júnior, C.A.D.S.; Teodoro, P.E.; Teodoro, L.P.R. High-throughput phenotyping as an auxiliary tool in the selection of corn hybrids for agronomic traits. Rev. Ceres 2023, 70, 106–113. [Google Scholar] [CrossRef]
- Tang, Z.; Wang, M.; Schirrmann, M.; Dammer, K.H.; Li, X.; Brueggeman, R.; Zhang, Z. Affordable High Throughput Field Detection of Wheat Stripe Rust Using Deep Learning with Semi-Automated Image Labeling. Comput. Electron. Agric. 2023, 207, 107709. [Google Scholar] [CrossRef]
- Aderibigbe, O.R.; Ezekiel, O.O.; Owolade, S.O.; Korese, J.K.; Sturm, B.; Hensel, O. Exploring the potentials of underutilized grain amaranth (Amaranthus spp.) along the value chain for food and nutrition security: A review. Crit. Rev. Food Sci. Nutr. 2022, 62, 656–669. [Google Scholar] [CrossRef]
- Das, S. Amaranthus: A Promising Crop of Future; Springer: Singapore, 2016. [Google Scholar]
- Sharma, A.; Chetani, R. A review on the effect of organic and chemical fertilizers on plants. Int. J. Res. Appl. Sci. Eng. Technol. 2017, 5, 677–680. [Google Scholar] [CrossRef]
- Boafo, D.K.; Kraisornpornson, B.; Panphon, S.; Owusu, B.E.; Amaniampong, P.N. Effect of organic soil amendments on soil quality in oil palm production. Appl. Soil Ecol. 2020, 147, 103358. [Google Scholar] [CrossRef]
- Gordon, W.B.; Whitney, D.A.; Raney, R.J. Nitrogen Management in Furrow Irrigated, Ridge-Tilled Corn. J. Prod. Agric. 1993, 6, 213–217. [Google Scholar] [CrossRef]
- Akanbi, W.B.; Togun, A.O.; Adediran, J.A.; Ilupeju, D.E. Growth, dry matter and fruit yields components of okra under organic and inorganic sources of nutrients. Am. Eurasian J. Sustain. Agric. 2010, 4, 1–13. [Google Scholar]
- Pospišil, A.; Pospišil, M.; Varga, B.; Svecˇnjak, Z. Grain yield and protein concentration of two amaranth species (Amaranthus spp.) as influenced by the nitrogen fertilization. Eur. J. Agron. 2006, 25, 250–253. [Google Scholar] [CrossRef]
- Zainab, M.A.; Vincent, E.C.; Ayodele, O.S.; Lakwannum, G.Y.; Kehinde, O.S. Effects of organic and inorganic fertilizers on the growth of NH-Ae 47-4 variety of okra. J. Appl. Sci. Environ. Manag. 2016, 20, 201–206. [Google Scholar] [CrossRef]
- Hendricks, G.S.; Shukla, S.; Roka, F.M.; Sishodia, R.P.; Obreza, T.A.; Hochmuth, G.J.; Colee, J. Economic and environmental consequences of overfertilization under extreme weather conditions. J. Soil Water Conserv. 2019, 74, 160–171. [Google Scholar] [CrossRef]
- Mustafa, G.; Hayat, N.; Alotaibi, B.A. How and why to prevent over fertilization to get sustainable crop production. In Sustainable Plant Nutrition; Academic Press: Cambridge, MA, USA, 2023; pp. 339–354. [Google Scholar]
- Engås, K.G.; Raja, J.Z.; Neufang, I.F. Decoding technological frames: An exploratory study of access to and meaningful engagement with digital technologies in agriculture. Technol. Forecast. Soc. Chang. 2023, 190, 122405. [Google Scholar] [CrossRef]
- Kamilaris, A.; Prenafeta-Boldú, F.X. Deep learning in agriculture: A survey. Comput. Electron. Agric. 2018, 147, 70–90. [Google Scholar] [CrossRef]
- Li, Z.; Guo, R.; Li, M.; Chen, Y.; Li, G. A review of computer vision technologies for plant phenotyping. Comput. Electron. Agric. 2020, 176, 105672. [Google Scholar] [CrossRef]
- Dhakshayani, J.; Sanket, S.; Mahapatra, A.; Surendiran, B.; Nath, M.K. Weed Classification from Paddy Crops Using Convolutional Neural Network. In Proceedings of the International Conference on Paradigms of Communication, Computing and Data Sciences: PCCDS 2021, Kurukshetra, India, 7–9 May 2021; Springer: Singapore, 2022; pp. 493–507. [Google Scholar]
- Zhao, S.; Peng, Y.; Liu, J.; Wu, S. Tomato leaf disease diagnosis based on improved convolution neural network by attention module. Agriculture 2021, 11, 651. [Google Scholar] [CrossRef]
- Sa, I.; Ge, Z.; Dayoub, F.; Upcroft, B.; Perez, T.; McCool, C. Deepfruits: A fruit detection system using deep neural networks. Sensors 2016, 16, 1222. [Google Scholar] [CrossRef]
- Hwang, Y.; Lee, S.; Kim, T.; Baik, K.; Choi, Y. Crop Growth Monitoring System in Vertical Farms Based on Region-of-Interest Prediction. Agriculture 2022, 12, 656. [Google Scholar] [CrossRef]
- Li, C.; Adhikari, R.; Yao, Y.; Miller, A.G.; Kalbaugh, K.; Li, D.; Nemali, K. Measuring plant growth characteristics using smartphone based image analysis technique in controlled environment agriculture. Comput. Electron. Agric. 2020, 168, 105123. [Google Scholar] [CrossRef]
- Arya, S.; Sandhu, K.S.; Singh, J. Deep learning: As the new frontier in high-throughput plant phenotyping. Euphytica 2022, 218, 47. [Google Scholar] [CrossRef]
- Lee, U.; Chang, S.; Putra, G.A.; Kim, H.; Kim, D.H. An automated, high throughput plant phenotyping system using machine learning-based plant segmentation and image analysis. PLoS ONE 2018, 13, 196615. [Google Scholar] [CrossRef] [PubMed]
- Selvaraj, M.G.; Valderrama, M.; Guzman, D.; Valencia, M.; Ruiz, H.; Acharjee, A. Machine learning for high-throughput field phenotyping and image processing provides insight into the association of above and below-ground traits in cassava (Manihot esculenta Crantz). Plant Methods 2020, 16, 87. [Google Scholar] [CrossRef]
- Rose, J.C.; Paulus, S.; Kuhlmann, H. Accuracy analysis of a multi-view stereo approach for phenotyping of tomato plants at the organ level. Sensors 2015, 15, 9651–9665. [Google Scholar] [CrossRef] [PubMed]
- Nyonje, W.A.; Schafleitner, R.; Abukutsa-Onyango, M.; Yang, R.Y.; Makokha, A.; Owino, W. Precision phenotyping and association between morphological traits and nutritional content in Vegetable Amaranth (Amaranthus spp.). J. Agric. Food Res. 2021, 5, 100165. [Google Scholar] [CrossRef]
- Park, Y.J.; Nemoto, K.; Nishikawa, T.; Matsushima, K.; Minami, M.; Kawase, M. Origin and evolution of the waxy phenotype in Amaranthus hypochondriacus: Evidence from the genetic diversity in the Waxy locus. Mol. Breed. 2012, 29, 147–157. [Google Scholar] [CrossRef]
- Park, Y.J.; Nishikawa, T.; Tomooka, N.; Nemoto, K. The molecular basis of mutations at the Waxy locus from Amaranthus caudatus L.: Evolution of the waxy phenotype in three species of grain amaranth. Mol. Breed. 2012, 30, 511–520. [Google Scholar] [CrossRef]
- Jamalluddin, N. Genetic Diversity Analysis and Trait Phenotyping for Drought Tolerance in Amaranth (Amaranthus spp.) Germplasm. Ph.D. Thesis, University of Nottingham Malaysia Campus, Selangor, Malaysia, 2020. [Google Scholar]
- Tazoe, Y.; Noguchi, K.; Terashima, I. Effects of growth light and nitrogen nutrition on the organization of the photosynthetic apparatus in leaves of a C4 plant, Amaranthus cruentus. Plant Cell Environ. 2006, 29, 691–700. [Google Scholar] [CrossRef]
- Weinbaum, S.A.; Johnson, R.S.; Dejong, T.M. Causes and consequences of overfertilization in orchards. HortTechnology 1992, 2, 112–121. [Google Scholar] [CrossRef]
- Ayeni, L.S.; Adeleye, E.O.; Adejumo, J.O. Comparative effect of organic, organomineral and mineral fertilizers on soil properties, nutrient uptake, growth and yield of maize (Zea mays). Int. Res. J. Agric. Sci. Soil Sci. 2012, 2, 493–497. [Google Scholar]
- Olowoake, A.A.; Adeoye, G.O. Comparative efficacy of NPK fertilizer and composted organic residues on growth, nutrient absorption and dry matter accumulation in maize. Int. J. Org. Agric. Res. Dev. 2010, 2, 43–53. [Google Scholar]
- Adebayo Abayomi, O.; James Adebayo, O. Effect of fertilizer types on the growth and yield of Amaranthus caudatus in Ilorin. Adv. Agric. 2014, 947062. [Google Scholar]
- Ouhami, M.; Hafiane, A.; Es-Saady, Y.; Hajji, M.E.; Canals, R. Computer vision, IoT and data fusion for crop disease detection using machine learning: A survey and ongoing research. Remote Sens. 2021, 13, 2486. [Google Scholar] [CrossRef]
- Yuan, L.; Bao, Z.; Zhang, H.; Zhang, Y.; Liang, X. Habitat monitoring to evaluate crop disease and pest distributions based on multi-source satellite remote sensing imagery. Optik 2017, 145, 66–73. [Google Scholar] [CrossRef]
- Zhao, Y.; Liu, L.; Xie, C.; Wang, R.; Wang, F.; Bu, Y.; Zhang, S. An effective automatic system deployed in agricultural Internet of Things using Multi-Context Fusion Network towards crop disease recognition in the wild. Appl. Soft Comput. 2020, 89, 106128. [Google Scholar] [CrossRef]
- Patil, R.R.; Kumar, S. Rice-fusion: A multimodality data fusion framework for rice disease diagnosis. IEEE Access 2022, 10, 5207–5222. [Google Scholar] [CrossRef]
- Crop Production Guide: Horticulture Crops, Amaranthus, Directorate of Horticulture and Plantation Crops 2020. TNAU, 158. Available online: https://agritech.tnau.ac.in/pdf/HORTICULTURE.pdf (accessed on 1 May 2023).
- Ren, C. Fertilizer overuse in Chinese smallholders due to lack of fixed inputs. J. Environ. Manag. 2021, 293, 112913. [Google Scholar] [CrossRef] [PubMed]
- Huang, G.; Liu, Z.; Maaten, L.V.D.; Weinberger, K.Q. Densely Connected Convolutional Networks. In Proceedings of the IEEE Conference on Computer Vision and Pattern Recognition, Honolulu, HI, USA, 21–26 July 2017; pp. 4700–4708. [Google Scholar]
- Sahu, P.; Chug, A.; Singh, A.P.; Singh, D. TLDC: Tomato Leaf Disease Classification Using Deep Learning and Image Segmentation. In International Conference on Innovative Computing and Communications, Delhi, India, 19–20 February 2022; Springer: Singapore, 2023; pp. 401–408. [Google Scholar]
- Lu, Z.; Miao, J.; Dong, J.; Zhu, S.; Wang, X.; Feng, J. Automatic classification of retinal diseases with transfer learning-based lightweight convolutional neural network. Biomed. Signal Process. Control 2023, 81, 104365. [Google Scholar] [CrossRef]
- Khazalah, A.; Prasanthi, B.; Thomas, D.; Vello, N.; Jayaprakasam, S.; Sumari, P.; Khodadadi, N. Image Processing Identification for Sapodilla Using Convolution Neural Network (CNN) and Transfer Learning Techniques. In Classification Applications with Deep Learning and Machine Learning Technologies; Springer: Cham, Switzerland, 2023; pp. 107–127. [Google Scholar]
- Simonyan, K.; Zisserman, A. Very deep convolutional networks for large-scale image recognition. arXiv 2014, arXiv:1409.1556. [Google Scholar]
- Howard, A.G.; Zhu, M.; Chen, B.; Kalenichenko, D.; Wang, W.; Weyand, T.; Andreetto, M.; Adam, H. Mobilenets: Efficient convolutional neural networks for mobile vision applications. arXiv 2017, arXiv:1704.04861. [Google Scholar]
- Syed Shahul Hameed, A.S.; Rajagopalan, N. SPGD: Search Party Gradient Descent Algorithm, a Simple Gradient-Based Parallel Algorithm for Bound-Constrained Optimization. Mathematics 2022, 10, 800. [Google Scholar] [CrossRef]
- Findurová, H.; Veselá, B.; Panzarová, K.; Pytela, J.; Trtílek, M.; Klem, K. Phenotyping drought tolerance and yield performance of barley using a combination of imaging methods. Environ. Exp. Bot. 2023, 209, 105314. [Google Scholar] [CrossRef]
- Yousfi, S.; Marín, J.; Parra, L.; Lloret, J.; Mauri, P.V. Remote sensing devices as key methods in the advanced turfgrass phenotyping under different water regimes. Agric. Water Manag. 2022, 266, 107581. [Google Scholar] [CrossRef]
- Koh, J.C.; Spangenberg, G.; Kant, S. Automated machine learning for high-throughput image-based plant phenotyping. Remote Sens. 2021, 13, 858. [Google Scholar] [CrossRef]
- Giuffrida, M.V.; Doerner, P.; Tsaftaris, S.A. Pheno-deep counter: A unified and versatile deep learning architecture for leaf counting. Plant J. 2018, 96, 880–890. [Google Scholar] [CrossRef] [PubMed]
- Ampatzidis, Y.; Partel, V. UAV-based high throughput phenotyping in citrus utilizing multispectral imaging and artificial intelligence. Remote Sens. 2019, 11, 410. [Google Scholar] [CrossRef]
Disclaimer/Publisher’s Note: The statements, opinions and data contained in all publications are solely those of the individual author(s) and contributor(s) and not of MDPI and/or the editor(s). MDPI and/or the editor(s) disclaim responsibility for any injury to people or property resulting from any ideas, methods, instructions or products referred to in the content. |
© 2023 by the authors. Licensee MDPI, Basel, Switzerland. This article is an open access article distributed under the terms and conditions of the Creative Commons Attribution (CC BY) license (https://creativecommons.org/licenses/by/4.0/).