Article

Effects of Agricultural Machinery Operations on PM2.5, PM10 and TSP in Farmland under Different Tillage Patterns

1
College of Engineering, China Agricultural University, Beijing 100083, China
2
Key Laboratory of Agricultural Equipment for Conservation Tillage, Ministry of Agricultural and Rural Affairs, Beijing 100083, China
*
Author to whom correspondence should be addressed.
Agriculture 2023, 13(5), 930; https://doi.org/10.3390/agriculture13050930
Submission received: 17 March 2023 / Revised: 17 April 2023 / Accepted: 21 April 2023 / Published: 24 April 2023
(This article belongs to the Section Agricultural Technology)

Abstract

:
Agricultural machinery can improve agricultural productivity and promote agricultural scale operation. However, machinery operations lead to increased dust in farmland and affect the atmospheric environment; thus, they have been increasingly emphasized. In this study, the effects of agricultural machinery operations in wheat cultivation were investigated regarding the emissions of three kinds of particulate matters, namely fine particulate matter (PM2.5), inhalable particulate matter (PM10) and total suspended particulate (TSP), from farmland in Beijing. The results showed that the total dust emission from the traditional tillage mode, including straw crushing, rotary tilling and sowing, was 3.990 g per hectare, which was larger than that of the conservation tillage mode including only no-tillage sowing (0.407 g per hectare). The total dust emission for one hectare of farmland under the two modes was 3.415 g, 0.497 g, 0.407 g and 0.078 g for straw shredding, rotary tillage, no-tillage sowing and conventional sowing, respectively. The values of PM2.5/PM10 and PM2.5/TSP decreased in each tillage section after each agricultural machinery operation, while the values of PM10/TSP were basically unchanged, indicating that particulate matter emissions from farmland due to agricultural machinery operations are mainly PM10 and TSP. The dust concentration generated by agricultural machinery increased with an increase in the speed of the machinery operation, provided that the quality of the operation was guaranteed. This study provides guidance for reducing dust emissions from mechanized operations, improving air quality and decreasing health hazards to operators of agricultural machinery.

1. Introduction

Agricultural dust is a non-negligible source of air pollution, especially fine particles in dust, such as fine particulate matter (PM2.5), inhalable particulate matter (PM10) and total suspended particulate (TSP), can cause great risks to the environment and human health [1,2,3]. Agricultural dust mainly originates from soil wind erosion, field tillage and crop harvesting [4]. Fine particles on the surface of farmland during soil wind erosion do not settle and are suspended in the atmosphere with airflow movement, which can cause direct pollution to the atmosphere [5]. Current research on wind erosion dust in agricultural fields mainly focuses on the effects of different tillage patterns on wind erosion dust from the surface of agricultural fields under natural environments [5,6,7,8,9]. In contrast, tillage, sowing and harvesting machinery operations produce violent disturbances to surface soil, which can make the soil more susceptible to erosion and increase the emission of agricultural dust, leading to pollution. Some studies in Europe have shown that particulate matter emissions from machinery operations account for 80% of total agricultural emissions [10,11,12]. When wind speed near the surface is higher than 0.5 m/s, particulate pollutants, such as PM2.5, PM10 and TSP from agricultural dust, will also be transported over long distances, causing regional air pollution [13,14]. According to the results of road dust research studies in recent years, the impact of dust emissions on human health cannot be ignored [15,16,17]. The three types of particulate matter, PM2.5, PM10 and TSP, present different hazards to the human body [18,19]. The smaller the particle size, the easier it is to adsorb harmful substances in the air and invade the human body. Research on the epidemiological impact of atmospheric particulate matter has shown that short-term exposure to particulate matter pollution is associated with respiratory diseases, while long-term exposure to particulate matter pollution is associated with lung and cardiovascular diseases and, in more severe cases, cancer [20,21,22,23,24,25,26,27,28,29,30]. Therefore, the issue regarding how to prevent and control particulate pollution, such as PM2.5, PM10 and TSP, from agricultural dust has been widely studied by researchers [31].
Scholars at home and abroad have conducted extensive research on the influencing factors of dust in agricultural fields. Hai et al. measured the thickness of blowing erosion when arable soils with different moisture contents were subjected to wind action and found that the amount of wind erosion decreased significantly when the moisture content of the soil surface layer increased [32]. Li et al. measured the starting wind speed of soil under different soil moisture contents and carried out wind tunnel simulations to explore the influences of the interaction between soil moisture content and wind speed on soil wind erosion rate and vertical distribution of wind-drift sand flow, which proved that increasing soil moisture content could increase the starting wind speed of soil particles, thus improving soil resistance to wind erosion and reducing dust emission [33]. Wolfe et al. measured the surface shear velocity under different vegetation cover conditions and proved that increasing the vegetation cover of farmland could effectively reduce the near-surface wind speed and, thus, play an important role in suppressing agricultural dust emission [34]. Conservation tillage technology centered on straw mulching and no-tillage sowing can improve the moisture content and surface vegetation cover of agricultural soils, and it is effective in protecting soils and reducing the emission of particulate matters [35,36]. These studies mainly focused on the effects of soil physical and chemical properties, straw mulch and tillage patterns on the amount of agricultural dust. There is a relative lack of research on the effects of agricultural machinery operations on agricultural dust. With the current full mechanization of crop production, researchers have become increasingly concerned about the aggravation of environmental pollution caused by agricultural machinery operations [37,38]. Some scholars have proposed a method to reduce dust emissions from agricultural machinery by suspending or diminishing the operations of agricultural machinery under high wind speed and low air humidity conditions based on the dust emission characteristics of combined harvester operations during peanut and wheat harvesting [39,40], which provides guidance for dust removal from mechanized harvesting operations. However, their studies have only discussed the influences of natural factors during the operation of agricultural machinery without considering the effects of the types of agricultural machinery and tillage patterns. Given that agricultural dust is mainly generated in the tillage and crop harvesting stages [41], it is important to investigate the effects of different agricultural machinery operations on farmland particulate matter emissions and air pollution during the tillage and sowing stages under different tillage patterns to guide the selection of agricultural machinery operation patterns from the perspective of reducing agricultural dust.
In order to study the dust emission characteristics of agricultural machinery operations in the tillage and sowing stages, the objectives of this research were to (1) characterize the PM and TSP emissions during mechanized agricultural tillage and sowing of wheats in Miyun District, Beijing; (2) monitor the emissions of agricultural dust under the conservation tillage pattern and traditional tillage pattern; and (3) clarify the effects of agricultural machinery operations on PM2.5, PM10 and TSP concentrations. The results can provide theoretical support for the prevention and control of agricultural dust pollution caused by mechanized tillage and sowing operations.

2. Materials and Methods

2.1. Field Site

The experiments were conducted during the wheat planting season in October 2022. The test site was located in Taikishi Village, Miyun District, Beijing, China (40°37′49.97″ N, 117°20′5.70″ E). The arable land in the Miyun District is around 413.2 hectares, with wheat and corn as the main crops, thus providing two types of cropping a year. The climate is semi-humid continental monsoon climate, with an average annual precipitation and temperature of 592.3 mm and 10.4 °C, respectively. The soil type of the test site was loam, the moisture content was 19.1% ± 2.9%, the soil temperature was 20.3 ± 0.7 °C, and the soil bulk density was 1.35 ± 0.13 g/cm3.

2.2. Experimental Design

In the wheat tillage and sowing stages, conventional and conservation tillage patterns were adopted. In the traditional tillage pattern, straw was shredded by a straw crusher; a rotary tiller was then applied for tilling, and finally a 2B-12 wheat seeder (a wheat seeder with 12 rows) was used to complete the sowing operation. In the conservation tillage pattern, after corn was harvested, no straw treatment and farm tillage were carried out, and a 2BM-12 no-tillage wheat seeder (a wheat no-tillage seeder with 12 rows of sowing) was used to complete the sowing operation.
Considering the structure of agricultural machinery and in order to cover different types of particulate matter, PM2.5/PM10/TSP integrated sensors were scattered on each machine (the positions marked in Figure 1). For the straw crusher with a sloped metal housing, the sensors were evenly distributed in the area with less slope. For the rotary tiller, the top of which is flat with a tab in the middle, which is not convenient for the sensors to be fixed there, the sensors were symmetrically scattered on both sides of the tab. For the seeder, the furrow opener and soil-covering device are the main dust-raising parts, so the sensors were scattered at the flat top of the corresponding parts. The sensors were installed at a height of 0.4 m on the straw crusher and the rotary tiller and at 0.3 m on the seeder, being connected to each machine with magnetic nuts.
Dust concentration tests were conducted in each agricultural operation with both patterns for 10 min. Each agricultural operation was carried out in triplicate at two tractor speeds of 3.5–4.5 km/h (normal operating speed) and 6.0–8.0 km/h (faster operating speeds). Figure 2 shows pictures of the field monitoring of agricultural dust.

2.3. Test Indexes and Methods

Environmental parameters, such as wind speed, temperature, humidity and atmospheric pressure, during the test were measured using a FB-10 handheld meteorological instrument, and the environmental parameters are listed in Table 1.
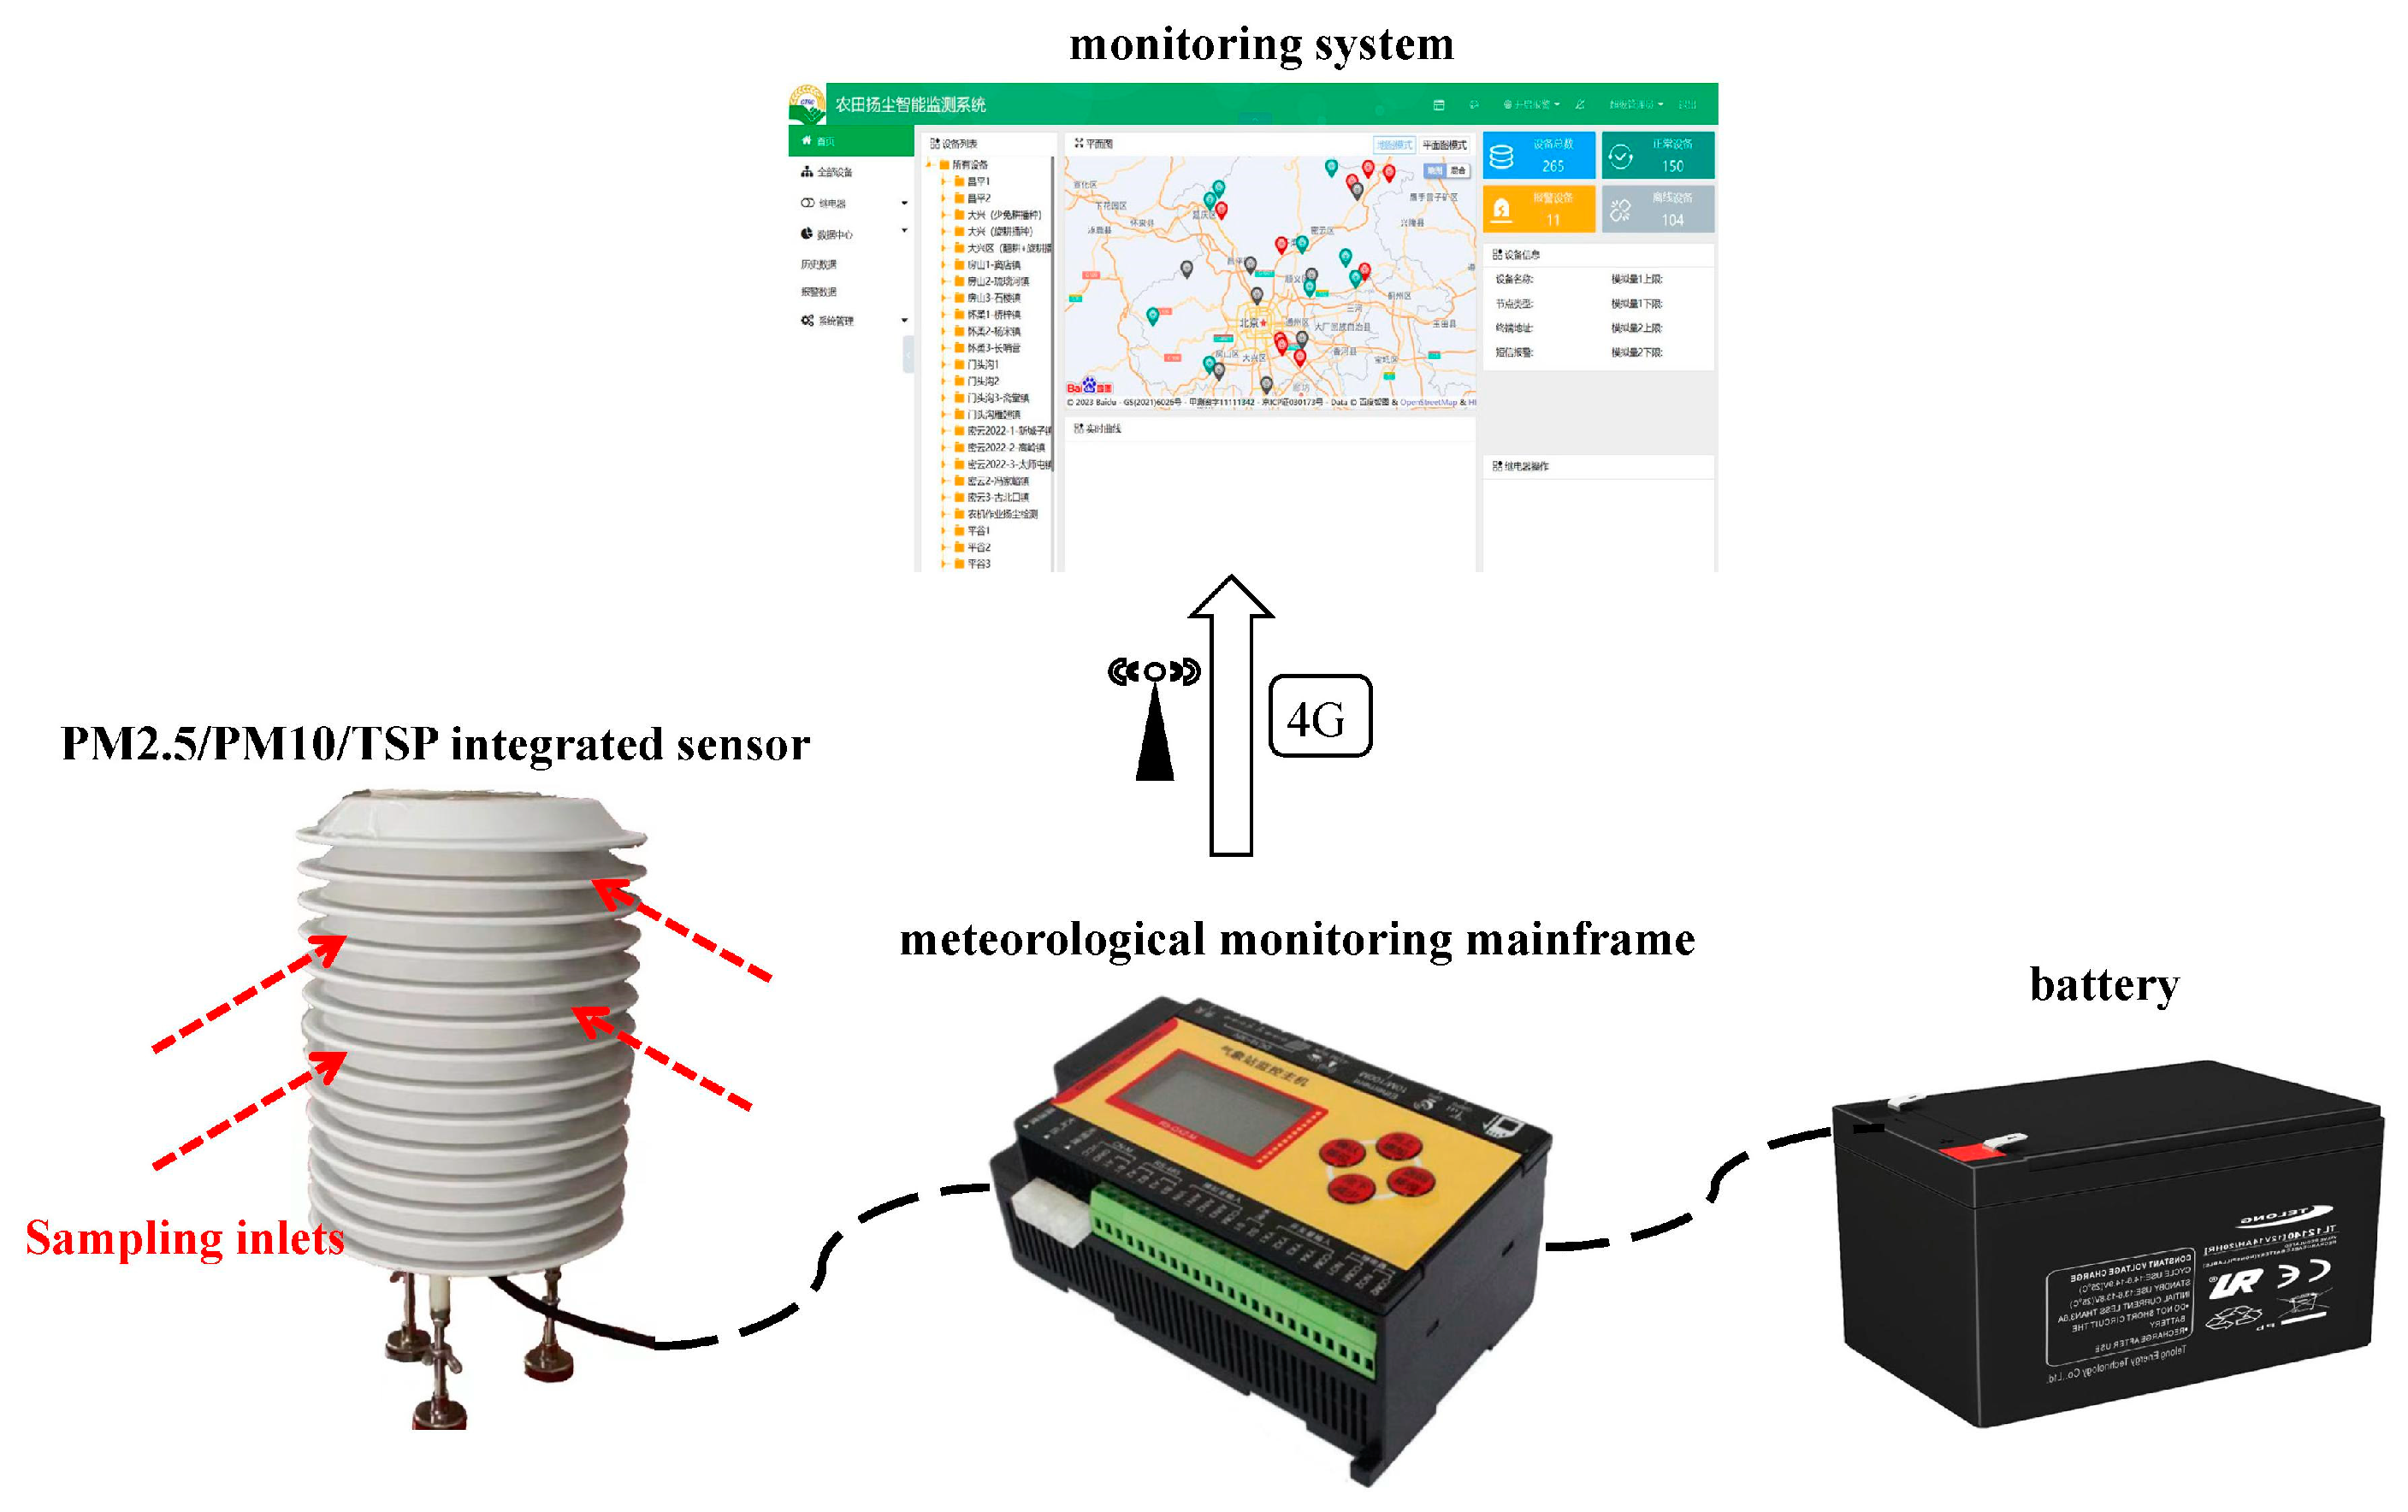
Dust concentration was measured using the PM2.5/PM10/TSP integrated sensors and transmitted to the monitoring system simultaneously by communicating with the meteorological monitoring mainframe when in use. Figure 3 shows the PM2.5/PM10/TSP monitoring system. The concentration measurement range of these integrated sensors is 0~999 ± 10 μg·m−3 for PM2.5, 0~1999 ± 10 μg·m−3 for PM10, and 0~19999 ± 30 μg·m−3 for TSP. The available temperature and humidity ranges are −20~60 °C and 0~70%, respectively, with a measurement interval of 1 min.

2.3.1. Dust Concentration Measurement

A laser respirable dust tester was used to calibrate the sensors before each operation test. The sensors on the body of the machines then monitored and automatically recorded the dust concentration changes during the operation in real time from the beginning to the end of each operation.

2.3.2. Calculation of Dust Mass

After monitoring dust concentration and real-time wind speed at the time of operation, dust emissions from the surface of a given area per unit time can be calculated according to Equation (1) [42]:
E = 1 L 0 z C u d z
where E is the dust emission released from the surface of the specified area per unit time, in μg/m2/s; L is the soil disturbance distance, in m; C is the concentration of dust at different heights, in μg/m3; u is the wind speed at the height z, in m/s; and z is the height of the sensor arrangement on the machine, in m.
The time of agricultural machinery operation on the unit area was calculated according to Equation (2):
t = 1 v · l
where t is the time of agricultural machinery operation on the unit area, in s; v is the average operating speed of the tractor during the test time, in m/s; and l is the operating width of the machine, in m.
The amount of agricultural dust emitted per hectare of farmland was estimated using Equation (3):
m = E · S · t
where m is the dust emission per hectare in the case of machinery operation, in μg, and S is one hectare with the value equals to 10,000 m2.

2.4. Data Processing

The concentrations of PM2.5, PM10 and TSP measured during calibration with the laser respirable dust tester were used as the environmental values before operation. After each agricultural machinery operation at different machine operating speeds, the average of the dust concentration values monitored by all sensors per minute was taken as the dust concentration value for that minute. The difference between the post-operation dust concentration value and the pre-operation ambient value was considered as the increment in dust concentration, which was recorded as the mean ± standard deviation. The variations in dust concentration increments between different operations were analyzed using one-way ANOVA, and multiple comparisons were performed (α = 0.05) using the least significant difference.
Origin 2021 was used for plotting, while Excel 2016 and SPSS were employed for data processing and statistical analysis, respectively.

3. Results

3.1. Comparison of Dust Concentration under Different Agricultural Machinery Operations

Table 2 shows the monitoring data of dust concentration in each operation at normal operation speed, while Table 3 shows the multiple comparisons of dust concentration increments at each stage. From the monitoring results of each operation, the dust concentration of straw crushing and returning operation was the highest, with the concentrations of PM2.5, PM10 and TSP reaching 494.3 μg/m3, 1121.6 μg/m3 and 1565.8 μg/m3, respectively. The reason is that the high-speed rotating straw chopper constantly cut and hit the straw and topsoil, and high-speed airflow forms in different parts of the machine during the process of straw crushing and returning in the field, during which shredded straw and fine soil are continuously thrown up, forming a large amount of fine particles. These cause a significant increase in dust concentrations (p < 0.05). The tillage operation of the rotary tiller mainly depends on the low-speed rotation of the rotary tillage knife to cut into the soil, and then it throws the soil up to break it up in the inner wall of the machine. Straw is then mixed with soil and buried, leading to an increase in soil microparticle emissions. Its concentrations for PM2.5, PM10 and TSP were 119.3, 192.1, and 241.9 μg/m3, being second only to the straw crushing operation. Regarding the no-tillage sowing, its agricultural dust emission was significantly lower than that of straw crushing (p < 0.05), reducing by 86.9%; when compared to rotary tillage, it decreased by 14.9%. However, its emission increased by 150.1% when compared to traditional sowing. This is mainly because during the no-tillage sowing operation, only straw and soil in the 12–15 cm seed belt is shredded and tilled, respectively; at the same time, the fertilization and sowing operations are completed. Compared to the straw crushing and rotary tilling operations, the soil disturbance is smaller. The conventional seeder uses a chisel-type opener to sow directly onto the tilled soil, and the agricultural dust is mainly due to the soil being disturbed during the trenching process and the air flow during the movement of the machine. Therefore, the dust concentration is relatively low.

3.2. Differences in Dust Concentration Caused by Agricultural Machinery Operations at Different Operating Speeds

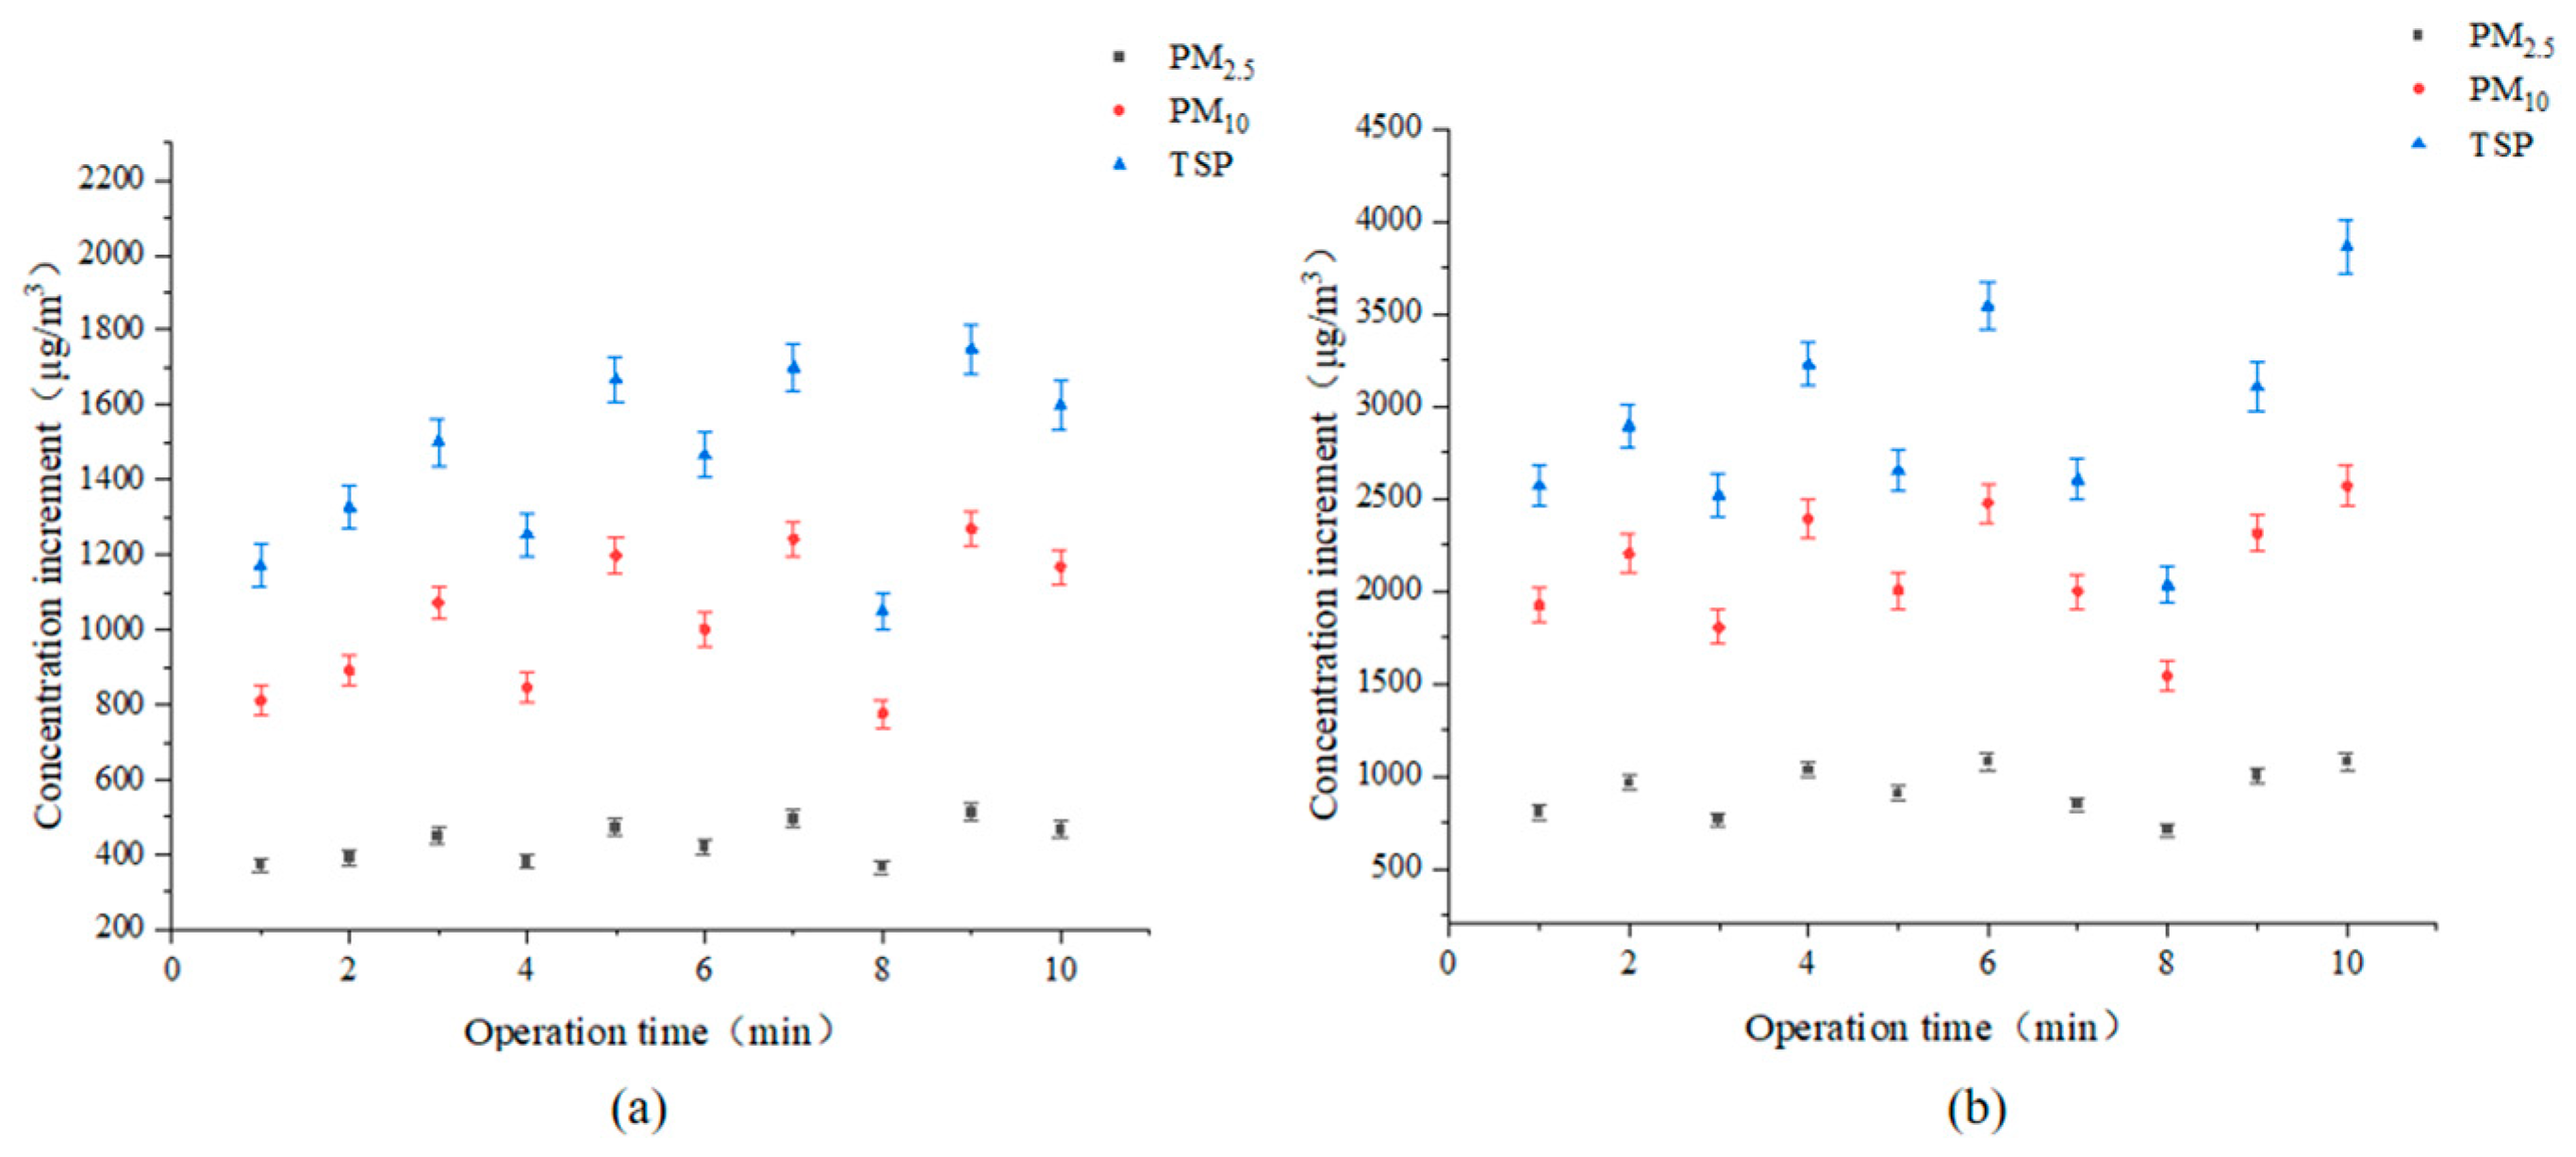
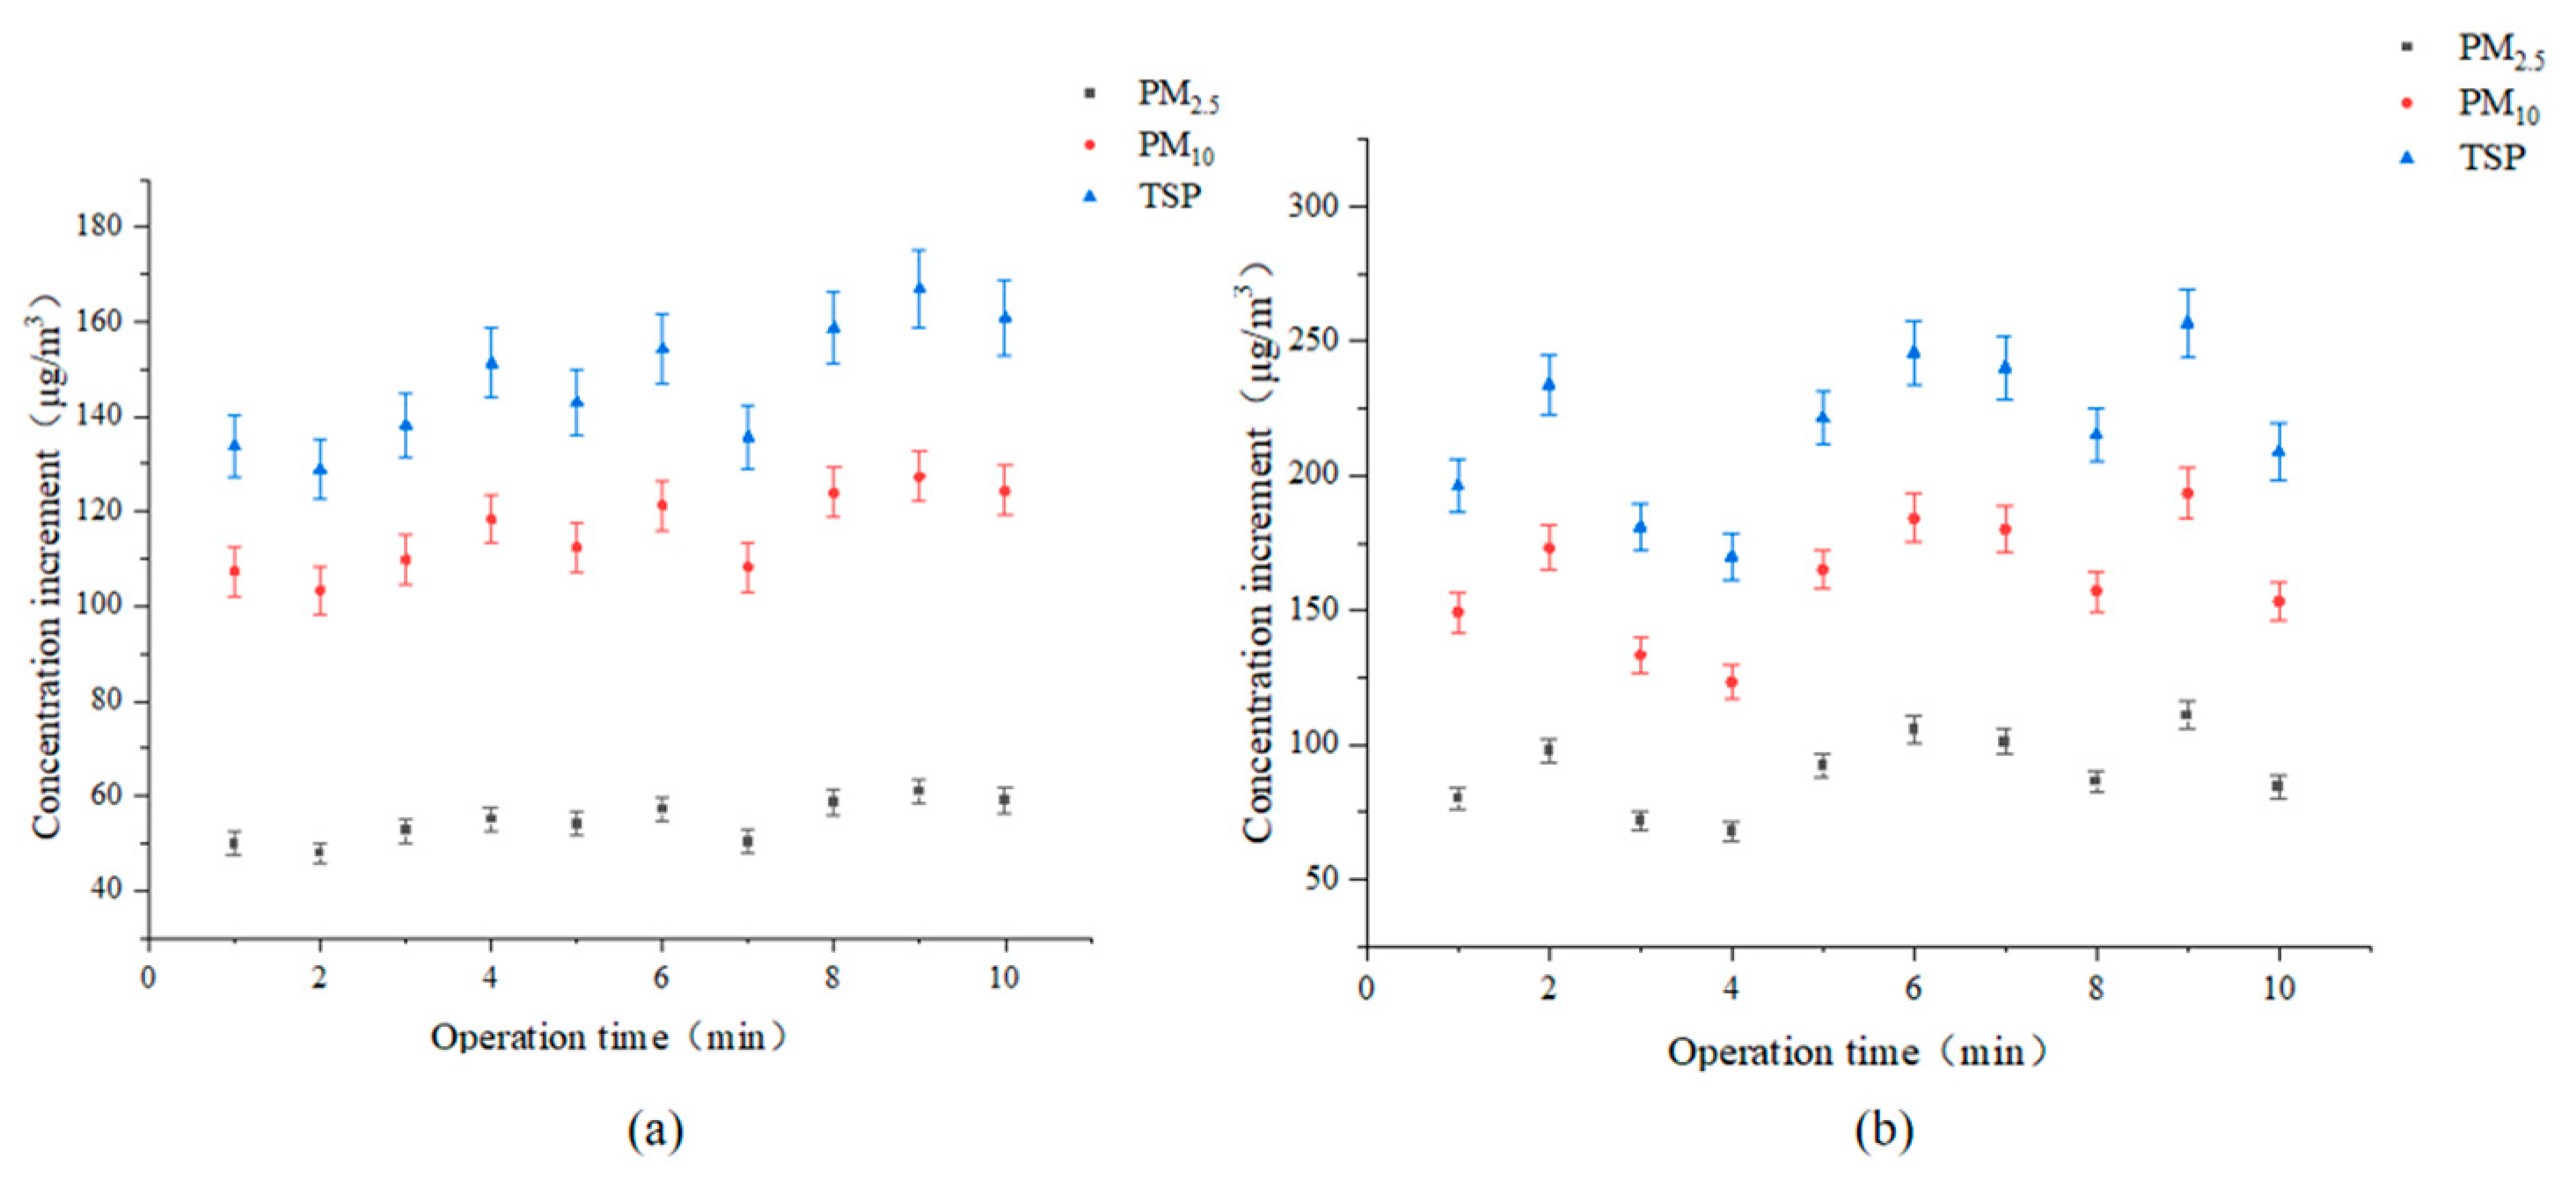
The dust generated during the operation of agricultural machinery is mainly caused by the disturbance of the soil by the machinery and the airflow generated during the operation. In this study, the comparison of dust increment after each operation was conducted separately at normal and faster operation speeds, and the results are shown in Figure 4, Figure 5, Figure 6 and Figure 7. At the normal operating speed, the mean values of the concentration increment in PM2.5, PM10 and TSP during the straw crushing operation were 440.2, 1048.3 and 1468.3 μg/m3, respectively. When the operating speed increased, the mean values of concentration increment of the three indicators rose to 900.7, 2080.5 and 2848.5 μg/m3, indicating a rise of 104.6%, 98.5% and 94.0%, respectively. During the rotary tillage operation, the average increments in PM2.5, PM10 and TSP at the normal operating speed were 84.1, 147.7 and 183.3 μg/m3, respectively, while those at the faster operating speed reached 160.4, 339.9 and 391.1 μg/m3, with an increase of 90.7%, 130.1% and 113.4%, respectively. During the sowing and no-tillage sowing operations, the dust concentrations also showed the same trend after the speed of the machine operation increased. The PM2.5 concentrations for the two operations increased from 11.0 and 54.2 μg/m3 to 18.1 and 87.9 μg/m3, respectively, while the PM10 and TSP concentrations for the sowing and no-tillage sowing operations increased from 15.6 and 115.2 to 30.5 and 162.8 and from 24.2 and 147.2 μg/m3 to 39.4 and 216.9 μg/m3, respectively, after of the operational speed increased. This resulted in increased ratios of 64.5%, 95.5% and 62.8% and 62.2%, 41.3% and 47.3%, respectively, for PM2.5, PM10 and TSP for the two operations. From the experimental results, it can be seen that the concentrations of the three types of dust particles produced during the straw-crushing and rotary-tillage operations were accelerated with the increase in the speed of operation of agricultural machinery, both rising more than 90%. In the conventional sowing section, the concentration increment in PM10 increased the greatest with the speed of operation, while in the no-tillage sowing section, the concentration increment in PM2.5 was mostly affected by the speed of operation of the machinery. The increments in dust concentration per minute showed different standard deviations because of the differences in dust concentration values measured at the same moment by the different sensors arranged on the machines and the influence of some sensors from dust generated by the tractor tires [43]. In addition, the standard deviations of the dust concentration increments increased in all operations with faster speed. The results indicated that at a faster speed operation, there was an increase in the increment of all types of particulate matter concentrations, and more atmospheric pollutants were emitted from the farmland, which is very harmful to the atmospheric environment as well as to the health of machinery drivers. In order to reduce the emission of dust from farmland, it is recommended that the frequency of high-speed operations of agricultural machinery is reduced.

3.3. Characteristics of Dust Emission from Each Operation

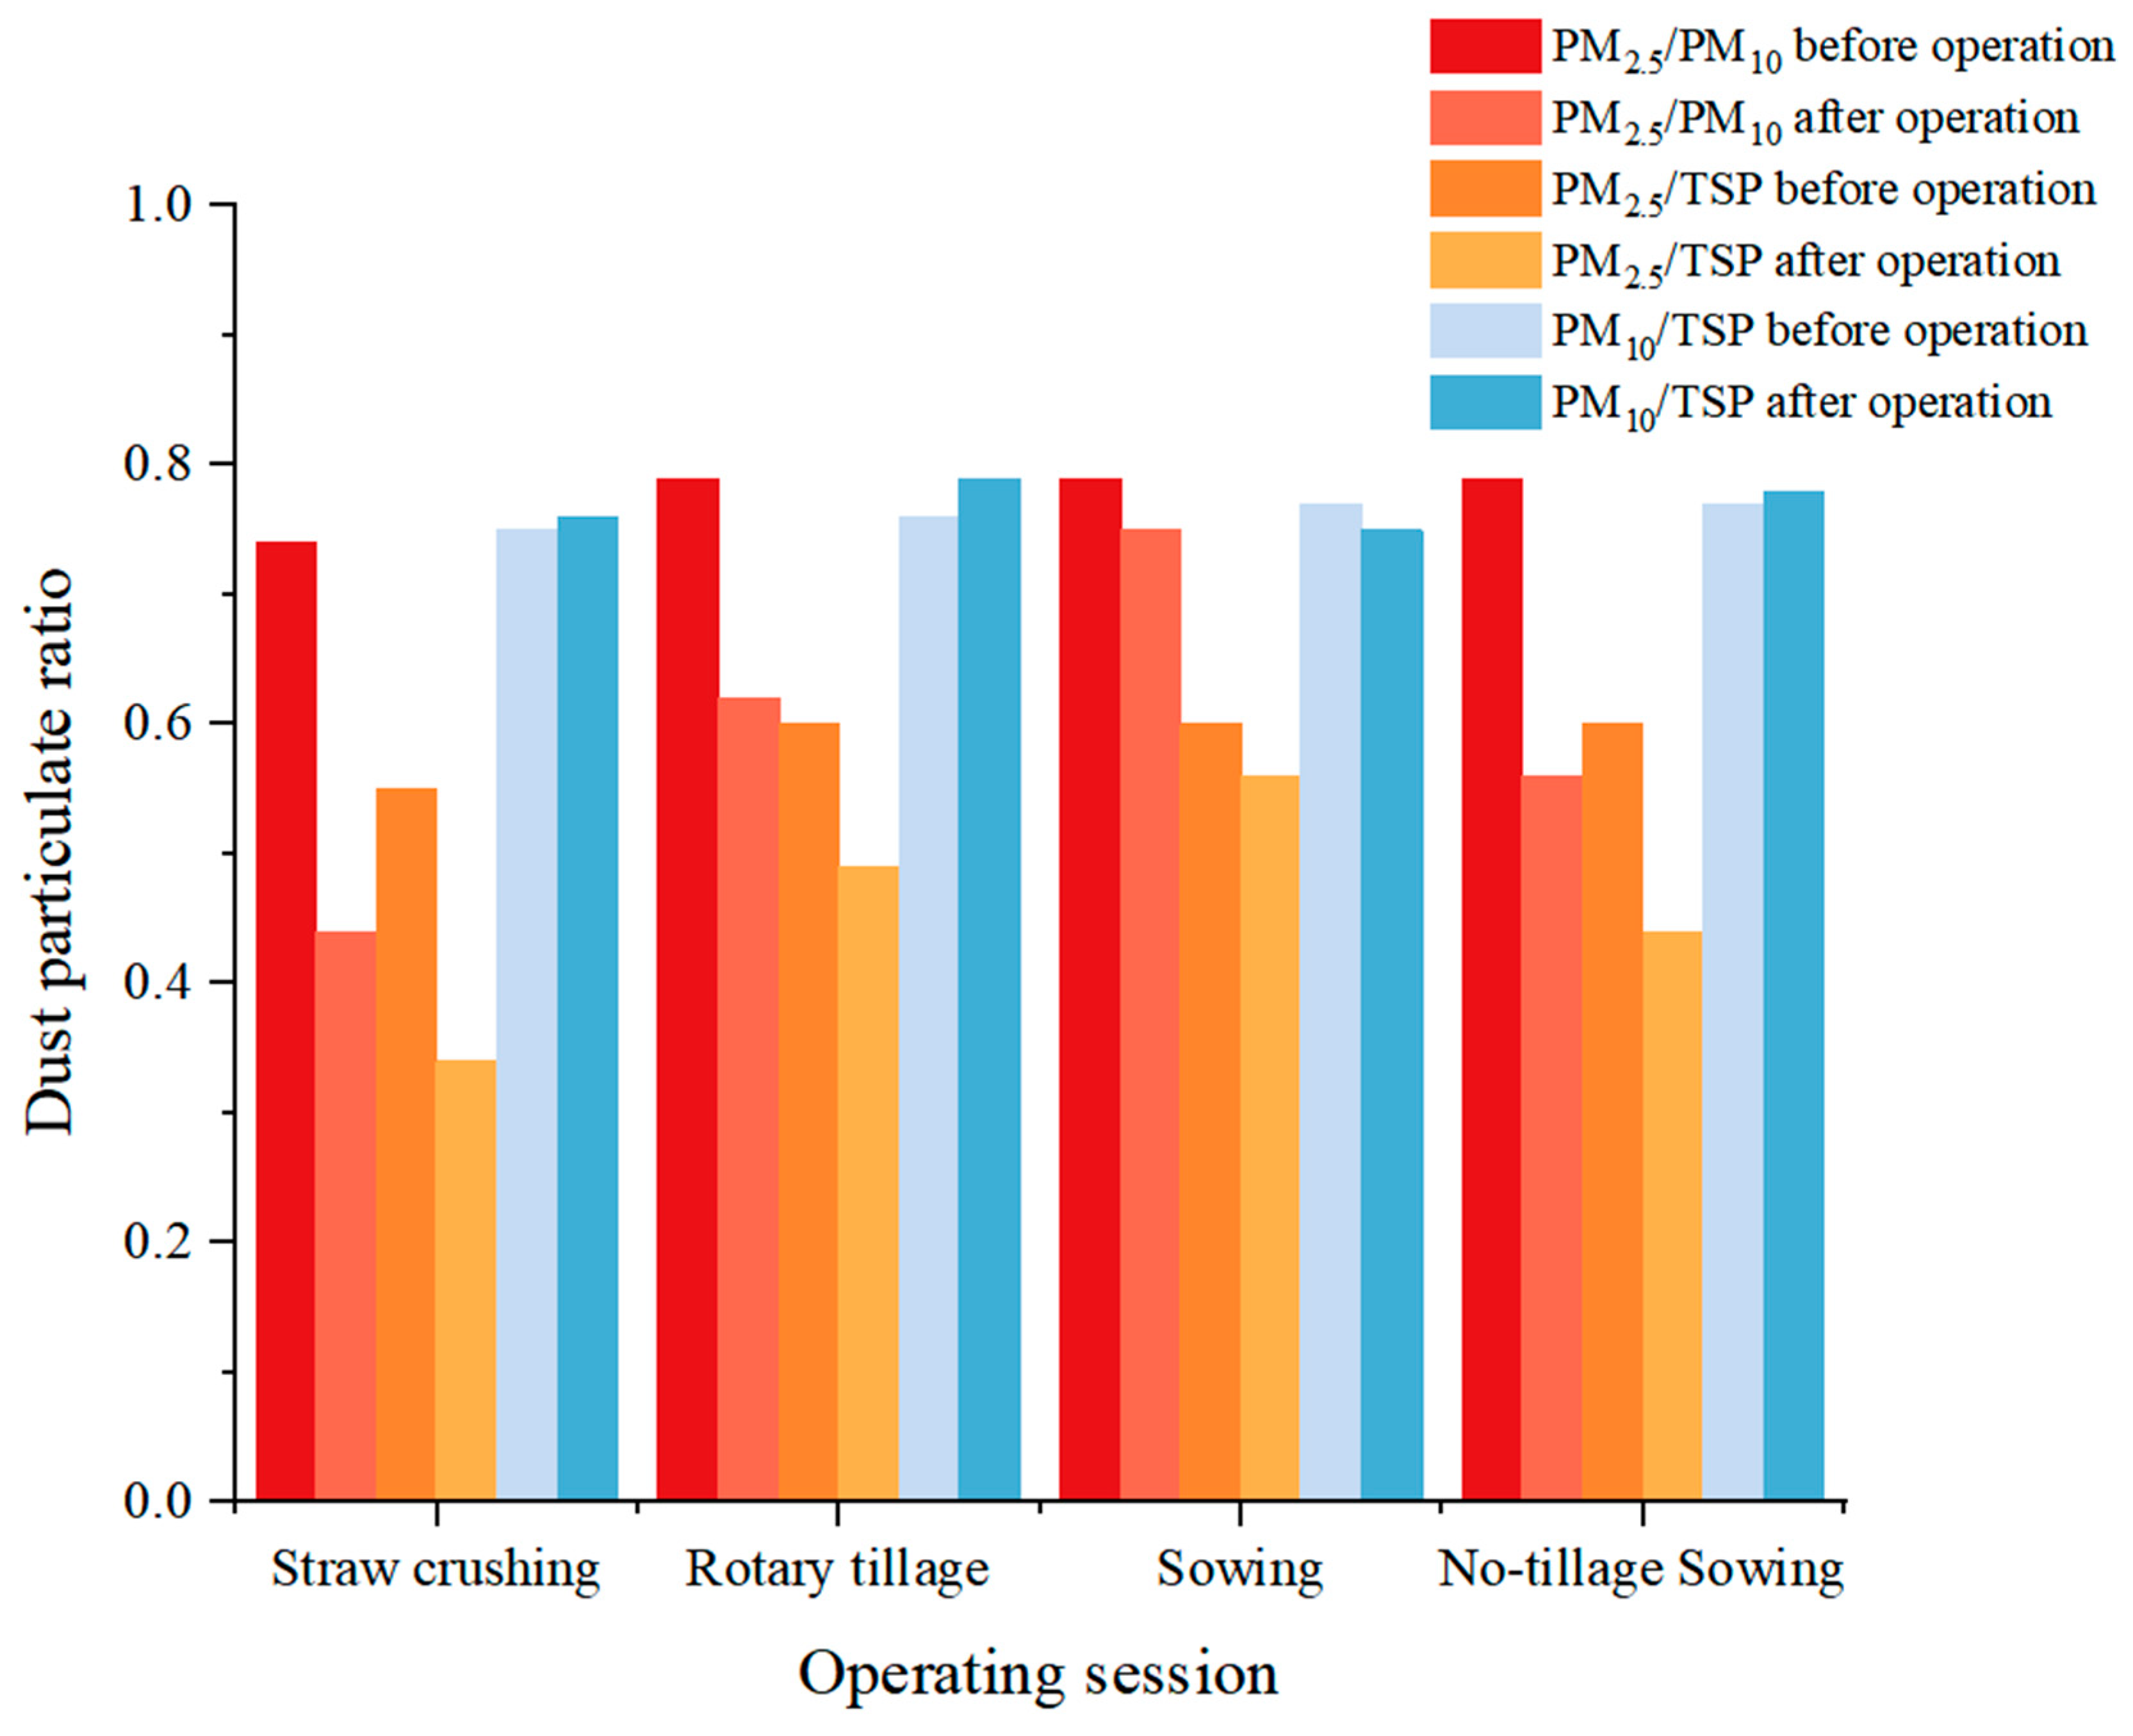
Figure 8 shows the ratios of three dust indicators, PM2.5, PM10 and TSP, emitted from different operations at the normal operating speed. After the operation of agricultural machinery, the values of PM2.5/PM10 and PM2.5/TSP in the straw-crushing operation both decreased, from 0.74 and 0.55 to 0.44 and 0.34, respectively. These two ratios also showed a decreasing trend in the rotary-tillage operation, from 0.79 and 0.60 to 0.62 and 0.49. For the sowing and no-tillage sowing operations, the PM2.5/PM10 values decreased from 0.79 and 0.79 to 0.75 and 0.56, respectively, and the PM2.5/TSP values decreased from 0.60 and 0.60 to 0.56 and 0.44, respectively. From the monitoring results, it can be seen that the percentage of PM2.5 in the area can be reduced by machinery operation, whereas the percentages of PM10 and TSP increase; thus, it can be inferred that PM10 and TSP generated by machinery operation are the main contributors of dust in farmland during the cultivation season. For PM10/TSP, the values after the straw-crushing, rotary-tillage, sowing and no-tillage sowing operations altered from 0.75 to 0.76, from 0.76 to 0.79, from 0.77 to 0.75 and from 0.77 to 0.78, respectively, with very small changes from the values before each operation, indicating that the concentrations of PM10 and TSP emitted from farmland under the operation of machinery increased at a similar rate.

3.4. Comparison of the Total Amount of Dust Generated by the Two Patterns

Comparing the total amount of dust generated by the operations of agricultural machinery under the two patterns is of great practical importance for the selection of agricultural production mode and environmental protection. Table 4 shows the values of the total amount of dust generated by the traditional tillage pattern and the conservation tillage pattern in this study. The traditional tillage pattern emits 9.8 times more dust per hectare than the conservation tillage pattern. The number of operations for conservation tillage is less than that of traditional tillage, which fundamentally reduces agricultural dust, reflecting the superiority of conservation tillage.

4. Discussion

Dust is one of the important components of atmospheric pollutants. In recent years, researchers have conducted more studies on environmental pollution caused by wind erosion on farmland, as well as exhaust emissions from agricultural machinery and agricultural waste, and some important conclusions have been drawn. However, in addition to the engines, which produce exhaust emissions, agricultural machinery operations, such as soil tillage, straw handling, sowing, field management and harvesting, also produce a large amount of dust, leading to the emissions of agricultural dust particles, which pollute the environment and become a popular topic of discussion.
In this study, the effects of agricultural machinery on dust emission from farmland were investigated using different operations under two tillage patterns, namely conservation tillage and traditional tillage. The effects of straw treatment, soil tillage and sowing on PM2.5, PM10 and TSP were clarified under the two different tillage patterns. The PM2.5, PM10 and TSP concentrations generated by the straw-crushing operation were the highest, followed by those generated by the rotary-tillage operation; the concentrations under conventional seeding operation were the lowest, while the concentrations of dust emissions from the no-tillage seeding operation were much higher than those of conventional seeding operation, with a 140.2% increase in dust concentration. In terms of the total amount of dust generated during the whole operation of agricultural machinery under different tillage patterns, the conservation tillage pattern reduced the number of operations, especially with the elimination of straw crushing and tillage, and its average total concentrations of PM2.5, PM10 and TSP were much lower than those of traditional tillage, with the total amount of dust per unit area being 1/9.8 of the traditional tillage pattern. In addition, the operation speed of the machine also affected the emission concentrations of PM2.5, PM10 and TSP to a certain extent, with higher operation speed corresponding to greater concentration of agricultural dust.
The soil moisture content and the amount of straw mulch also seriously affected the emissions of PM2.5, PM10 and TSP during the operation of the machines. Specifically, higher soil moisture content and lower amount of straw mulch led to lower emissions of particulate matters produced by agricultural machinery during operations. Therefore, while ensuring the quality of the operations, the working time of machinery operations should be reasonably chosen, such as 1–2 days after rainfall or irrigation, depending on the soil moisture content. Conservation tillage uses straw mulching to return to the field, eliminating traditional tillage and rototilling and other tillage operations, thereby effectively reducing soil moisture evaporation and increasing soil water content [44,45], which is probably a reason for the decrease in dust from agricultural machinery operations.
Winter wheat sowing season in Beijing area is a high dust generating period on farmland [46], especially concentrated in late September and early October. On the one hand, from the traditional tillage operation to the winter wheat seedling period, the exposed area of agricultural soil is large, and the soil is prone to severe wind erosion. On the other hand, there are many agricultural machinery operations in this season, especially the traditional tillage pattern focuses on straw crushing and tillage operations, resulting in increased agricultural dust emissions [41,47]. Therefore, in order to reduce environmental pollution and improve the quality of atmosphere in the capital of China, high-quality conservation tillage with more straw mulching and less soil tilling should be promoted in suitable areas.
However, due to the seasonal nature of agricultural farming, the contribution of agricultural dust emitted from agricultural machinery operations to air pollution is only partial. In terms of urban pollution, huge traffic volume and regular use of industrial facilities lead to the possibility that road dust is a direct contributor to atmospheric pollution [48,49,50,51,52]. The control of dust pollution in human living environment is a long-term, urgent and arduous task, and regional governments should accelerate the development of environmental regulations to strengthen the management of pollution control. In particular, both agricultural dust and road dust should be controlled and reduced using advanced dust pollution control technologies.

5. Conclusions

Dust emissions caused by agricultural machinery operations during mechanized wheat tillage and sowing under different tillage patterns were investigated in this study. The key findings are as follows:
(1)
The agricultural dust concentration caused by different agricultural machinery operations in descending order was straw shredding, rotary tillage, no-tillage sowing and traditional seeding. The total amount of dust per unit area of machinery operations under the traditional tillage mode was significantly higher than that of conservation tillage, with an increase of about 8.8 times.
(2)
Under different tillage patterns, agricultural dust caused by agricultural machinery operation was mainly PM10 and TSP, with a relatively low portion of PM2.5.
(3)
With an increase in speed of the agricultural machinery operations, the concentrations of PM2.5, PM10 and TSP for each machinery operation all became augmented, being more obvious for the straw-crushing and rotary-tillage operations, which had an increment of more than 90%. In the conventional seeding operation, the generation of PM10 was greater than the other two particulate matters. In the no-tillage sowing operation, the higher operation speed of the seeder had a greater impact on the generation of PM2.5. Under the condition of ensuring the quality of operation, agricultural dust emissions were positively correlated with the speed of the agricultural machinery operations.
(4)
The cumulative concentrations of the three types of particulate matter emitted from the agricultural machinery operations under the traditional tillage pattern reached 659.7 μg/m3, 1375 μg/m3 and 1890 μg/m3, respectively, which were much higher than the 24-hour average secondary concentration limits (75 μg/m3, 150 μg/m3 and 300 μg/m3) required by the Ambient Air Quality Standards (GB 3095-2012), indicating that agricultural machinery operations can cause serious pollution to the farmland atmosphere. Although the PM concentrations emitted from the agricultural machinery operations under the conservation tillage pattern were also higher than the secondary concentration limits, they still served to protect the environment when compared to the traditional pattern.

Author Contributions

Methodology, L.J., X.Z. and Q.W.; software, L.J.; formal analysis, L.J. and X.Z.; investigation, L.J. and X.Z.; data curation, L.J. and X.Z.; writing—original draft, L.J. and X.Z.; writing—review and editing, Q.W.; supervision, Q.W.; project administration, L.J. and X.Z.; funding acquisition, Q.W. All authors have read and agreed to the published version of the manuscript.

Funding

This research is supported by the National Key R&D Program Research under the Mechanism of Modern Agricultural Industrial Technology System Construction Project—Wheat—Mechanization of Tillage and Field Management, grant number: CARS-03, and co-funded by the horizontal project of the Beijing Municipal Bureau of Agriculture and Rural Affairs “Operation and Maintenance of Protective Tillage Dust Monitoring Points and Wind Erosion Effect Monitoring in Miyun District, Beijing in 2022”, grant number: 202205510710803.

Institutional Review Board Statement

Not applicable.

Informed Consent Statement

Not applicable.

Data Availability Statement

Not applicable.

Conflicts of Interest

The authors declare no conflict of interest.

References

  1. Xing, Y.F. Atmospheric particulate matter pollution hazards and control technology. Resour. Econ. Environ. Prot. 2016, 04, 122. (In Chinese) [Google Scholar] [CrossRef]
  2. Xie, S.Y. Study on the Prevention and Control Effect of Conservation Tillage on Soil Wind Erosion and Dust. Master’s Thesis, Beijing Forestry University, Beijing, China, 2019. (In Chinese). [Google Scholar] [CrossRef]
  3. Zhang, X.; Zhao, L.; Tong, D.; Wu, G.; Dan, M.; Teng, B. A Systematic Review of Global Desert Dust and Associated Human Health Effects. Atmosphere 2016, 7, 158. [Google Scholar] [CrossRef]
  4. Chen, W.W. Research progress on atmospheric particulate matter emissions from agricultural soil tillage. J. Agro-Environ. Sci. 2015, 34, 1225–1232. Available online: https://kns.cnki.net/kcms/detail/12.1347.s.20150722.0825.016.html (accessed on 12 December 2022). (In Chinese).
  5. Lin, X.; Niu, J.; Yu, X.; Berndtsson, R.; Wu, S.; Xie, S. Maize residue effects on PM2.5, PM10, and dust emission from agricultural land. Soil Tillage Res. 2021, 205, 104738. [Google Scholar] [CrossRef]
  6. Duan, G.L.; Wang, W.J.; Chen, W.W.; Wang, L.Y.; Xing, G.Q. Study on the effect of conservation tillage on inhibiting dust in seasonal bare farmland. Agric. Sci. Technol. Equip. 2021, 05, 112–114. (In Chinese) [Google Scholar] [CrossRef]
  7. Sun, L.L. Experimental Study on Conservation Tillage Measures for Prevention and Control of Wind Erosion Dust in Farmland Soil in Beijing. Master’s Thesis, Beijing Forestry University, Beijing, China, 2019. (In Chinese). [Google Scholar] [CrossRef]
  8. Yan, T.G. The importance of conservation tillage technology in Northwest China. Econ. Res. Guide 2011, 16, 22–23. Available online: https://kns.cnki.net/kcms2/article/abstract?v=3uoqIhG8C44YLTlOAiTRKgchrJ08w1e7tvjWANqNvp_8CWYbxvLBV7twVTs3Hz9IjQCL_Ov2tqjyGDYg3OVCVWkBvzwgpH-6&uniplatform=NZKPT (accessed on 12 December 2022). (In Chinese).
  9. Zhang, J.M. Study on the Process and Coupling Mechanism of Soil Wind Erosion and Dust in Typical Areas of Northern North China. Ph.D. Thesis, Beijing Forestry University, Beijing, China, 2020. (In Chinese). [Google Scholar] [CrossRef]
  10. Yan, C.Z.; Zhou, Y.M.; Song, X.; Duan, H.C. Estimation of areas of sand and dust emission in the Hexi Corridor from a land cover database: An approach that combines remote sensing with GIS. Environ. Geol. 2008, 57, 707–713. [Google Scholar] [CrossRef]
  11. Hooper, J.; Marx, S. A global doubling of dust emissions during the Anthropocene? Glob. Planet. Change 2018, 169, 70–91. [Google Scholar] [CrossRef]
  12. Bogman, P.; Cornelis, W.; Rollé, H.; Gabriels, D. Prediction of TSP and PM10 Emissions from Agricultural Operations in Flanders, Belgium. 2005. Available online: https://www.researchgate.net/publication/254715564_Prediction_of_TSP_and_PM10_emissions_from_agricultural_operations_in_Flanders_Belgium (accessed on 12 December 2022).
  13. Wu, Y.T.; Wu, J.G.; Wang, L. The relationship between PM10 concentration and environmental factors in farmland surface air in spring. J. Agro-Environ. Sci. 2020, 39, 1792–1802. Available online: https://kns.cnki.net/kcms2/article/abstract?v=3uoqIhG8C44YLTlOAiTRKibYlV5Vjs7i8oRR1PAr7RxjuAJk4dHXorrs3Hdw5DMAfp6OTBFMNg7wq5LyfCyc-eCoXE_DktU9&uniplatform=NZKPT (accessed on 12 December 2022). (In Chinese).
  14. Zhao, C.X.; Wang, Y.Q.; Wang, Y.J.; Zhang, H.L.; Zhao, B.Q. The spatial and temporal distribution of PM2.5 and PM10 pollution levels in winter and spring in Beijing and its relationship with meteorological conditions. Environ. Sci. 2014, 35, 418–427. (In Chinese) [Google Scholar] [CrossRef]
  15. Du, P.R.; Du, R.; Ren, W.S. Progress of research on the toxicity effects and mechanisms of urban atmospheric particulate matter. China Environ. Sci. 2016, 36, 2815–2827. Available online: https://kns.cnki.net/kcms2/article/abstract?v=3uoqIhG8C44YLTlOAiTRKibYlV5Vjs7ijP0rjQD-AVm8oHBO0FTadu2wA4Zrg4PZ-IeA6gq-5s6EEO_cva_gp2dlSIx3ErT5&uniplatform=NZKPT (accessed on 12 December 2022). (In Chinese).
  16. Li, L.M.; Li, L.G.; Li, N.W. Research progress on the causes and hazards of urban haze. Environ. Eng. 2017, 35, 92–97+104. (In Chinese) [Google Scholar] [CrossRef]
  17. Tao, Y.; Liu, Y.M.; Mi, S.Q.; Guo, Y.T. Pollution characteristics of atmospheric fine particulate matter and its impact on human health. Acta Sci. Circumstantiae 2014, 34, 592–597. (In Chinese) [Google Scholar] [CrossRef]
  18. Liu, A.M.; Yang, L.; Wu, Y.L.; Lv, H.K. Study on the health effects of atmospheric particulate matter in urban area. Environ. Monit. China 2012, 28, 19–23. (In Chinese) [Google Scholar] [CrossRef]
  19. Fann, N.; Lamson, A.D.; Anenberg, S.C.; Wesson, K.; Risley, D.; Hubbell, B.J. Estimating the national public health burden associated with exposure to ambient PM2.5 and ozone. Risk Anal. 2012, 32, 81–95. [Google Scholar] [CrossRef] [PubMed]
  20. Boudier, A.; Markevych, I.; Jacquemin, B.; Abramson, M.J.; Accordini, S.; Forsberg, B.; Fuertes, E.; Garcia-Aymerich, J.; Heinrich, J.; Johannessen, A.; et al. Long-term air pollution exposure, greenspace and health-related quality of life in the ECRHS study. Sci. Total Environ. 2022, 849, 157693. [Google Scholar] [CrossRef]
  21. Brook, R.D.; Rajagopalan, S.; Pope, C.A., 3rd; Brook, J.R.; Bhatnagar, A.; Diez-Roux, A.V.; Holguin, F.; Hong, Y.; Luepker, R.V.; Mittleman, M.A.; et al. Particulate matter air pollution and cardiovascular disease: An update to the scientific statement from the American Heart Association. Circulation 2010, 121, 2331–2378. [Google Scholar] [CrossRef]
  22. Huang, L.; Fu, W.; Xia, L.; Cao, S. Long-term air pollution exposure associates with increased risk of coronary heart disease morbidity and mortality. Eur. J. Prev. Cardiol. 2022, 28, e6–e10. [Google Scholar] [CrossRef]
  23. Kriit, H.K.; Andersson, E.M.; Carlsen, H.K.; Andersson, N.; Ljungman, P.L.S.; Pershagen, G.; Segersson, D.; Eneroth, K.; Gidhagen, L.; Spanne, M.; et al. Using Distributed Lag Non-Linear Models to Estimate Exposure Lag-Response Associations between Long-Term Air Pollution Exposure and Incidence of Cardiovascular Disease. Int. J. Environ. Res. Public Health 2022, 19, 2630. [Google Scholar] [CrossRef]
  24. Lin, H.; Liu, T.; Xiao, J.; Zeng, W.; Li, X.; Guo, L.; Zhang, Y.; Xu, Y.; Tao, J.; Xian, H.; et al. Mortality burden of ambient fine particulate air pollution in six Chinese cities: Results from the Pearl River Delta study. Environ. Int. 2016, 96, 91–97. [Google Scholar] [CrossRef]
  25. Qi, H.Q. Study on the Characteristics and Potential Sources of Atmospheric Particulate Matter PM2.5 and PM10 Pollution in Laixi City. Master’s Thesis, Qingdao University of Technology, Qingdao, China, 2021. (In Chinese). [Google Scholar] [CrossRef]
  26. Alex, F.J.; Tan, G.; Kyei, S.K.; Ansah, P.O.; Agyeman, P.K.; Fayzullayevich, J.V.; Olayode, I.O. Transmission of viruses and other pathogenic microorganisms via road dust: Emissions, characterization, health risks, and mitigation measures. Atmos. Pollut. Res. 2023, 14, 101642. [Google Scholar] [CrossRef]
  27. Gupta, V.; Bisht, L.; Arya, A.K.; Singh, A.P.; Gautam, S. Spatially Resolved Distribution, Sources, Exposure Levels, and Health Risks of Heavy Metals in <63 mum Size-Fractionated Road Dust from Lucknow City, North India. Int. J. Environ. Res. Public Health 2022, 19, 12898. [Google Scholar] [CrossRef] [PubMed]
  28. Mahato, M.K.; Singh, A.K.; Giri, S. Assessment of metal pollution and human health risks in road dust from mineral rich zone of East Singhbhum, India. Environ. Geochem. Health. 2022. [Google Scholar] [CrossRef] [PubMed]
  29. Park, S.B.; Kim, E.A.; Kim, K.Y.; Koh, B. Induction of toxicity in human colon cells and organoids by size- and composition-dependent road dust. RSC Adv. 2023, 13, 2833–2840. [Google Scholar] [CrossRef] [PubMed]
  30. Hoek, G.; Krishnan, R.M.; Beelen, R.; Peters, A.; Ostro, B.; Brunekreef, B.; Kaufman, J.D. Long-term air pollution exposure and cardio-respiratory mortality: A review. Environ. Health 2013, 12, 43. [Google Scholar] [CrossRef] [PubMed]
  31. Kwon, H.J.; Cho, S.H.; Chun, Y.; Lagarde, F.; Pershagen, G. Effects of the Asian dust events on daily mortality in Seoul, Korea. Environ. Res. 2002, 90, 1–5. [Google Scholar] [CrossRef] [PubMed]
  32. Hai, C.X.; Zhou, X.C.; Li, X.J. Effects of soil surface moisture changes on wind erosion under different land use practices in Hebei Dam. J. Soil Water Conserv. 2005, 02, 29–32. (In Chinese) [Google Scholar] [CrossRef]
  33. Li, B.P.; Chen, X.C.; Dong, Z.; Li, J.R.; Zhang, C.X.; Li, H.L.; Gao, T.M. Wind tunnel simulation study on the effect of different soil moisture conditions on surface wind erosion in desert steppe of Inner Mongolia. J. Arid. Land Resour. Environ. 2022, 36, 126–132. (In Chinese) [Google Scholar] [CrossRef]
  34. Wolfe, S.A.; Nickling, W.G. Shear Stress Partitioning in Sparsely Vegetated Desert Canopies. Earth Surf. Process. Landf. 1996, 21, 607–619. [Google Scholar] [CrossRef]
  35. Chen, W.; Tong, D.Q.; Zhang, S.; Zhang, X.; Zhao, H. Local PM10 and PM2.5 emission inventories from agricultural tillage and harvest in northeastern China. J. Environ. Sci. 2017, 57, 15–23. [Google Scholar] [CrossRef]
  36. Sha, R.N.; Yu, M.H.; Ding, G.D.; Wu, Y.L.; Li, J.L.; Tan, J. Windproof effect of different intercropping harvest modes of crops in sandy farmland during fallow period. Res. Environ. Sci. 2022, 35, 2469–2476. (In Chinese) [Google Scholar] [CrossRef]
  37. Sharratt, B.; Auvermann, B. Dust Pollution from Agriculture. In Encyclopedia of Agriculture and Food Systems; Van Alfen, N.K., Ed.; Academic Press: Oxford, UK, 2014; pp. 487–504. [Google Scholar] [CrossRef]
  38. Polin, J.P.; Gu, Z.; Humburg, D.S.; Dalsted, K.J. Source of airborne sunflower dust generated during combine harvester operation. Biosyst. Eng. 2014, 126, 23–29. [Google Scholar] [CrossRef]
  39. Zhang, P.; Xu, H.; Hu, Z.; Chen, Y.; Cao, M.; Yu, Z.; Mao, E. Characteristics of Agricultural Dust Emissions from Harvesting Operations: Case Study of a Whole-Feed Peanut Combine. Agriculture 2021, 11, 1068. [Google Scholar] [CrossRef]
  40. Xu, H.; Zhang, P.; Hu, Z.; Mao, E.; Yan, J.; Yang, H. Analysis of dust diffusion from a self-propelled peanut combine using computational fluid dynamics. Biosyst. Eng. 2022, 215, 104–114. [Google Scholar] [CrossRef]
  41. Kong, D.P.; Li, Y.B. Research and Discussion on Dust Control Work of Agricultural Machinery Operation in Kaifeng City. Agric. Dev. Equip. 2020, 08, 85–86. Available online: https://kns.cnki.net/kcms2/article/abstract?v=3uoqIhG8C44YLTlOAiTRKibYlV5Vjs7i8oRR1PAr7RxjuAJk4dHXonmml9sktZcBJhYaIEUiGD1IClO8OubkIWLr6YW25LUM&uniplatform=NZKPT (accessed on 8 January 2023). (In Chinese).
  42. Wang, Y.Q. The Dust Emission Characteristics of PM10 and PM2.5 in Bare Farmland Soil Were Studied Based on Wind Tunnel Experiments. Master’s Thesis, Tianjin Normal University, Tianjin, China, 2019. Available online: https://kns.cnki.net/kcms2/article/abstract?v=3uoqIhG8C475KOm_zrgu4lQARvep2SAkEcTGK3Qt5VuzQzk0e7M1z0qcGpqOps4WPgjnssbIC0b5I_ki8WOc3jBBKGxDWztp&uniplatform=NZKPT (accessed on 8 January 2023). (In Chinese).
  43. Sun, X.; Li, G.F. Analysis and Control of Tire Dust in Truck. Creat. Living 2018, 05, 64–65. Available online: https://kns.cnki.net/kcms2/article/abstract?v=3uoqIhG8C44YLTlOAiTRKibYlV5Vjs7i0-kJR0HYBJ80QN9L51zrP6JdMdfAQomFXv-sJTsDVxW81wXOgondHRAtU4eBCsXm&uniplatform=NZKPT (accessed on 9 January 2023). (In Chinese).
  44. Wang, J.; Li, G.; Nie, Z.G.; Liu, Q.; Yan, L.J. Simulation study on soil moisture variation characteristics under conservation tillage. Trans. Chin. Soc. Agric. Mach. 2021, 52, 263–274. Available online: https://kns.cnki.net/kcms2/article/abstract?v=3uoqIhG8C44YLTlOAiTRKibYlV5Vjs7iy_Rpms2pqwbFRRUtoUImHTKDP4idwqp7grN0W3zGq-M-FUHZJ89ID8EdUMpogsmo&uniplatform=NZKPT (accessed on 9 January 2023). (In Chinese).
  45. Wang, L.X.; Gao, Y.Y. Effects of conservation tillage on soil moisture content, soybean growth and yield. China Rural. Water Hydropower 2013, 09, 37–40. Available online: https://kns.cnki.net/kcms2/article/abstract?v=3uoqIhG8C44YLTlOAiTRKgchrJ08w1e7xAZywCwkEEKC3micSvTXthR6HrhI9niFgE9Py472j7J6JO8ZQtXKOm1iS1H6elgm&uniplatform=NZKPT (accessed on 9 January 2023). (In Chinese).
  46. Liu, H.T. ‘Sanqiu (Autumn)’ agricultural machinery operation should not only harvest well but also raise less dust. Contemp. Farm Mach. 2019, 09, 13. Available online: https://kns.cnki.net/kcms2/article/abstract?v=3uoqIhG8C44YLTlOAiTRKibYlV5Vjs7iLik5jEcCI09uHa3oBxtWoG02IDvhvYQQALwo9uHHSDktqa-D2i-SUQHmVjrEiWwP&uniplatform=NZKPT (accessed on 9 January 2023). (In Chinese).
  47. Yi, H.; Peng, G.Y. The causes, harm and control measures of agricultural machinery non-point source pollution in xi county. Agric. Henan 2020, 13, 19–20. (In Chinese) [Google Scholar] [CrossRef]
  48. Adewumi, A.J. Heavy Metals in Soils and Road Dust in Akure City, Southwest Nigeria: Pollution, Sources, and Ecological and Health Risks. Expo. Health 2022, 14, 375–392. [Google Scholar] [CrossRef]
  49. Feng, W.; Zhang, Y.; Huang, L.; Li, Y.; Wang, S.; Zheng, Y.; Shi, L.; Xu, K. Source apportionment of environmentally persistent free radicals (EPFRs) and heavy metals in size fractions of urban arterial road dust. Process Saf. Environ. Prot. 2022, 157, 352–361. [Google Scholar] [CrossRef]
  50. Shao, Y.; Yang, G.; Luo, M.; Xu, D.; Tazoe, H.; Yamada, M.; Ma, L. Multiple Evaluation of Typical Heavy Metals Pollution in Surface Soil and Road Dust from Beijing and Hebei Province, China. Bull. Environ. Contam. Toxicol. 2022, 109, 317–322. [Google Scholar] [CrossRef]
  51. Vlasov, D.; Ramírez, O.; Luhar, A. Road Dust in Urban and Industrial Environments: Sources, Pollutants, Impacts, and Management. Atmosphere 2022, 13, 607. [Google Scholar] [CrossRef]
  52. Zuo, L.; Lu, X.; Fan, P.; Wang, L.; Yu, B.; Lei, K.; Yang, Y.; Chen, Y. Concentrations, sources and ecological–health risks of potentially toxic elements in finer road dust from a megacity in north China. J. Clean. Prod. 2022, 358, 132036. [Google Scholar] [CrossRef]
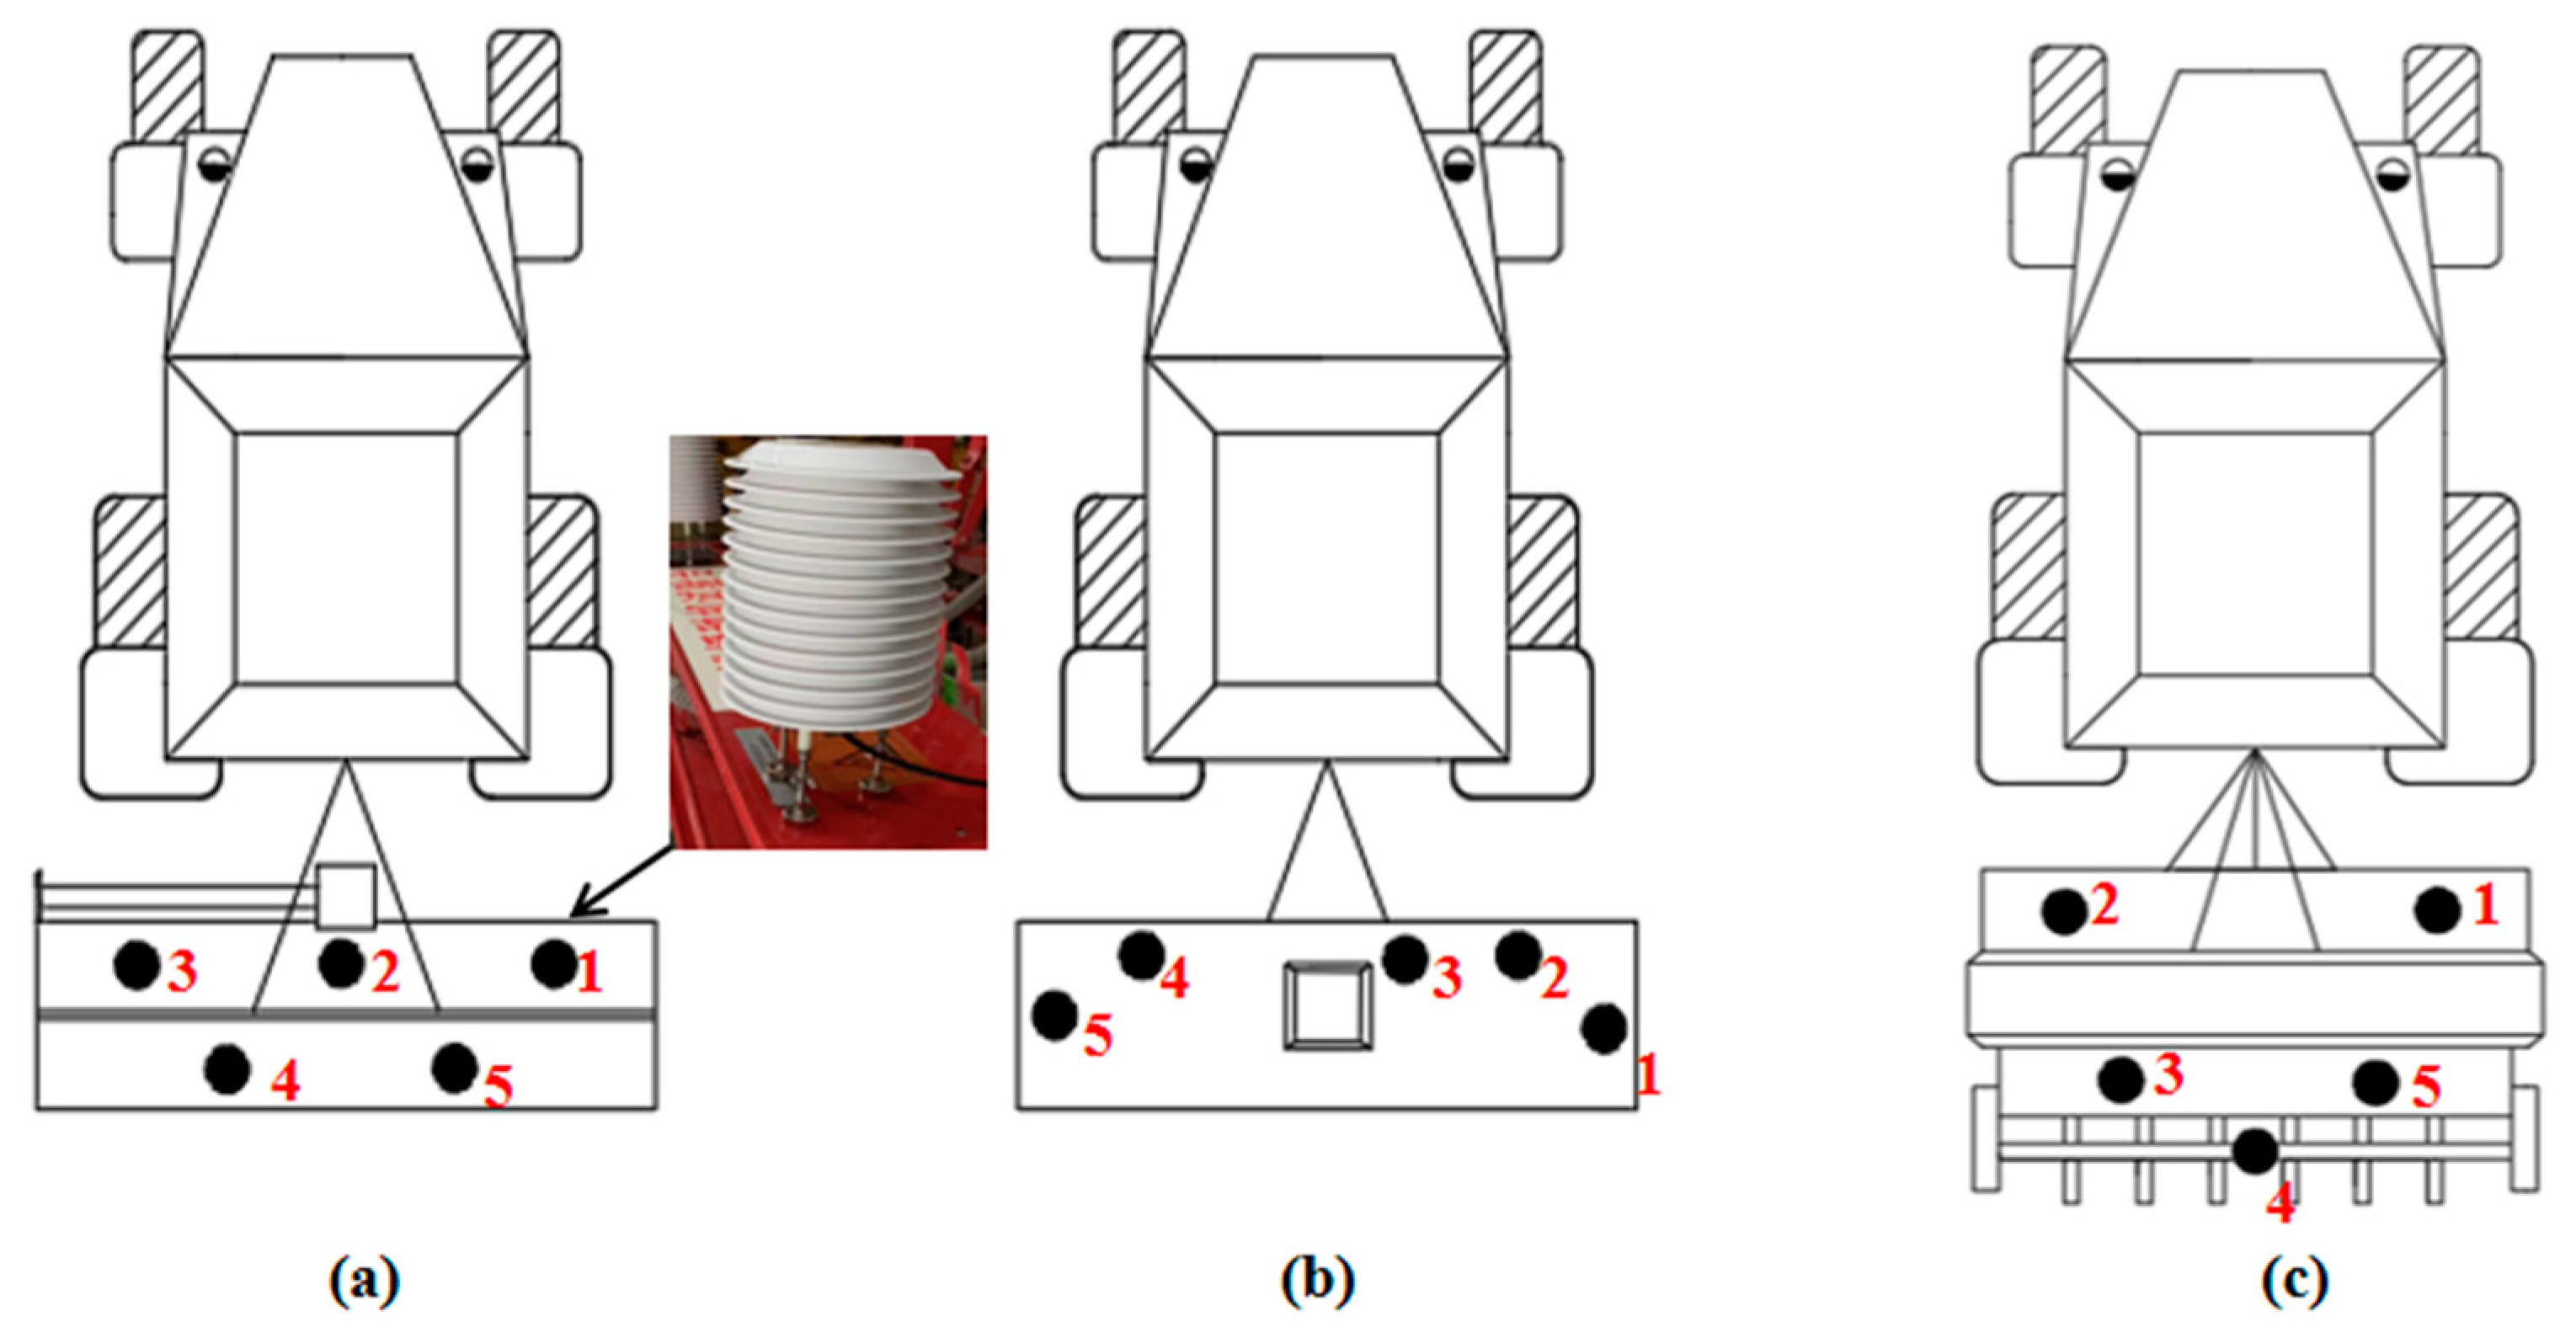
Figure 1. Arrangement of sensors for different machines: (a) straw crusher; (b) rotary tiller; and (c) seeder.
Agriculture 13 00930 g001
Figure 2. Field monitoring of agricultural dust: (a) straw-crushing operation site; (b) rotary-tilling operation site; and (c) sowing operation site.
Agriculture 13 00930 g002
Figure 3. PM2.5/PM10/TSP monitoring system.
Agriculture 13 00930 g003
Figure 4. Dust increments at different speeds during straw–crushing operation: (a) speed of 3.5–4.5 km/h; (b) speed of 6–8 km/h.
Agriculture 13 00930 g004
Figure 5. Dust increments at different speeds during rotary–tillage operation: (a) speed of 3.5–4.5 km/h; (b) speed of 6–8 km/h.
Agriculture 13 00930 g005
Figure 6. Dust increments at different speeds during sowing operation: (a) speed of 3.5–4.5 km/h; (b) speed of 6–8 km/h.
Agriculture 13 00930 g006
Figure 7. Dust increment at different speeds during no–tillage sowing operation: (a) speed of 3.5–4.5 km/h; (b) speed of 6–8 km/h.
Agriculture 13 00930 g007
Figure 8. Ratio of dust concentrations emitted from different operations.
Agriculture 13 00930 g008
Table 1. Environmental parameters.
ParametersValue
Wind speed (m/s)1.2 ± 0.4
Temperature (°C)22.3 ± 0.3
Humidity (%RH)21.2 ± 0.2
Atmospheric pressure (kpa)101.5
Table 2. Dust concentration before and after each operation.
Farming PatternOperationType of DustEnvironmental Value of Dust Concentration
(Unit: μg/m3)
Dust Concentration after Each Operation
(Unit: μg/m3)
Traditional tillageStraw crushingPM2.554.1 ± 3.2494.3 ± 69.8
PM1073.3 ± 4.31121.6 ± 233.0
TSP97.5 ± 5.71565.8 ± 392.7
Rotary tillingPM2.535.2 ± 4.2119.3 ± 26.2
PM1044.4 ± 6.5192.1 ± 31.2
TSP58.6 ± 8.5241.9 ± 54.3
SowingPM2.535.1 ± 4.446.1 ± 1.6
PM1044.7 ± 6.361.3 ± 1.8
TSP58.1 ± 8.782.3 ± 3.2
Conservation tillageNo-tillage sowingPM2.535.3 ± 4.489.5 ± 6.5
PM1045.1 ± 6.3160.3 ± 12.0
TSP58.6 ± 8.7205.8 ± 19.0
Table 3. Comparison of dust concentration increments.
OperationIncremental Dust Concentration
PM2.5 Increment
(μg/m3)
PM10 Increment
(μg/m3)
TSP Increment
(μg/m3)
Straw crushing440.2 ± 69.8 a1048.3 ± 233.0 b1468.3 ± 392.7 c
Rotary tilling84.1 ± 26.2 b147.7 ± 31.2 c183.3 ± 54.3 a
Sowing11.0 ± 1.6 c15.6 ± 1.8 a24.2 ± 3.2 b
No-tillage sowing54.2 ± 6.5 b115.2 ± 12.0 c147.2 ± 19.0 a
Note: Same letter in the same column indicates that the difference is not significant (p > 0.05).
Table 4. Total dust emissions under two tillage patterns.
Farming PatternOperation Quality of PM2.5
(g)
Quality of PM10
(g)
Quality of TSP
(g)
Traditional tillageStraw crushing1.096 ± 0.1742.612 ± 0.5813.415 ± 0.978
Rotary tilling0.183 ± 0.0580.389 ± 0.0690.497 ± 0.121
Sowing0.036 ± 0.0050.055 ± 0.0060.078 ± 0.010
Total mass1.135 ± 0.1833.056 ± 0.5853.990 ± 0.985
Conservation tillageNo-tillage sowing0.187 ± 0.0220.328 ± 0.0400.407 ± 0.064
Total mass0.187 ± 0.0220.328 ± 0.0400.407 ± 0.064
Disclaimer/Publisher’s Note: The statements, opinions and data contained in all publications are solely those of the individual author(s) and contributor(s) and not of MDPI and/or the editor(s). MDPI and/or the editor(s) disclaim responsibility for any injury to people or property resulting from any ideas, methods, instructions or products referred to in the content.