Abstract
Aiming at the lack of accurate and reliable discrete element simulation parameters for the design of buckwheat metering devices and seeders based on the discrete element simulation method, an accurate buckwheat seed model was obtained by calibrating the discrete element simulation parameters. In this study, buckwheat seed particle models were established based on the manual and automatic filling methods. In order to improve the accuracy of the models, discrete element simulation parameters were calibrated, and the static cylinder-lifting test and dynamic seed-metering test were used to verify the simulation results. A 3D model of buckwheat seed was obtained using the CT scanning method, and a manual filling 7-sphere particle model and an automatic filling multi-sphere particle model were established. The physical parameters and contact parameters were measured using the uniaxial compression test, the drop test, and the friction coefficient measurement test. The Plackett–Burman test and steepest ascent path were used to obtain the optimal parameter combination based on the static cylinder-lifting test. We conducted dynamic seed-metering tests using the two particle models under the optimal parameter combination. The results show that, compared with the measured values of stacking angle, the relative errors of the simulation values of the manual filling 7-sphere and automatic filling 36-sphere particle models are 1.04% and 0.50%, respectively. When the rotation speed range of the seeding wheel is 20~60 r/min, the average relative errors between the simulated value and the measured value are 15.85% and 4.69%, respectively. When the effective working length range of the seeding wheel is 20~40 mm, the average relative errors between the simulated value and the measured value are 22.18% and 9.07%, respectively. Regardless of whether the manual filling 7-sphere or the automatic filling 36-sphere particle model of buckwheat seed was used for static motion parameter simulation or dynamic motion simulation, the automatic filling 36-sphere particle model has a higher accuracy. The buckwheat seed particle model established in this study will provide support for the design of buckwheat special seed-metering devices and improve the quality of buckwheat mechanized sowing operation.
1. Introduction
Buckwheat has a long history of planting and is one of the earliest crops in China. Buckwheat is known as one of the healthiest foods in the 21st century because of its high nutritional and medicinal value [1,2,3,4,5]. The seeds of buckwheat are triangular and irregular in shape, resulting in a low accuracy of standard spherical particle models when conducting simulation using the discrete element method (DEM). Discrete element parameter calibration is usually used to improve simulation accuracy. However, there are few reports on buckwheat seed particle models and calibration parameters that can be used for reference.
The discrete element method studies the motion state of materials through numerical simulation and provides support for the optimal structure and operation parameter design of devices. It is widely used in the design of devices in agricultural fields, such as seed-metering devices and soil-engaging components [6,7,8,9,10]. Particle model establishment and parameter calibration are used to improve simulation accuracy. Seed particle models of common field crops, such as corn, wheat, rice, soybean, and potato, have been established and published in relevant references [11,12,13,14,15,16,17,18], in which the physical parameters and contact parameters of these seed particle models have been measured using physical tests and discrete element simulation parameter calibration tests. The calibration of particle simulation parameters is helpful to improve the accuracy of the discrete element method in the study of the interaction mechanism and motion law between particles, and to realize the optimization of process parameters of related equipment.
In this study, buckwheat seed particle models were established using the manual and automatic filling methods. The discrete element simulation parameters were calibrated, and static cylinder-lifting test and dynamic seed-metering test were used to verify the simulation results. The established discrete element simulation model and calibration parameters of buckwheat seed particles will provide support for the design of special metering devices. This study will also provide a reference for the establishment of an irregular particle model using the DEM.
2. Materials and Methods
2.1. Buckwheat Seeds
XINONG 9976 buckwheat seeds were used to measure the parameters and establish the particle model, which were provided by the College of Agriculture, Northwest A & F University, Yangling District, Shaanxi Province. The average moisture content is 10.40% based on the sampling and drying methods.
2.2. Measurement Method of Physical Parameters
The physical parameters are the basic parameters of the buckwheat seed particle model established using the DEM, which are mainly affected by the physical and mechanical properties of buckwheat seeds. The physical parameters of buckwheat seeds include basic physical parameters, such as shape size (length × width × height), 1000-grain weight, density, Poisson’s ratio, and elastic modulus. In this study, the basic physical parameters were measured using an electronic balance, a Vernier caliper, and a measuring cylinder. The elastic modulus and Poisson’s ratio were obtained using the uniaxial compression test with a texture analyzer.
2.2.1. Basic Physical Parameters
Five thousand buckwheat seeds were randomly selected and divided into five groups. The 1000-grain weight was measured using an electronic balance with an accuracy of 0.001 g, and the average value is 35.964 g. A digital Vernier caliper with an accuracy of 0.01 mm was used to measure the three-axis size, and the average three-axis size of buckwheat seeds is 6.66 mm × 4.80 mm × 4.35 mm. The density of buckwheat seeds was measured using an electronic balance with an accuracy of 0.001 g and a measuring cylinder with an accuracy of 0.1 mL, and the average density is 1146.84 kg/m3.
2.2.2. Poisson’s Ratio and Elastic Modulus
The Poisson’s ratio and elastic modulus of buckwheat seeds were measured using the uniaxial compression test with a texture analyzer (type: TA.XTC). The test system is shown in Figure 1. The circular probe with a diameter of 36 mm is used to load along the thickness direction, and the loading speed and time are 0.25 mm/s and 3 s, respectively. The digital Vernier caliper is used to measure the deformation in the extrusion direction and the vertical direction, and the load–displacement data are recorded by the texture analyzer [19]. Each parameter was measured five times, and the average value was used to calculate the Poisson’s ratio and elastic modulus based on Formulas (1) and (2). As shown in Table 1, the Poisson’s ratio and elastic modulus of buckwheat seeds are 0.42 and 5.32 × 10⁶ Pa, respectively.
where μ is Poisson’s ratio of buckwheat seeds; εx is the transverse strain of buckwheat seeds; εy is the longitudinal strain of buckwheat seeds; ∆L is the transverse absolute deformation of buckwheat seeds, in mm; ∆H is the absolute deformation of buckwheat seeds in the height direction, in mm; L is the transverse original length of buckwheat seeds, in mm; and H is the original length of buckwheat seeds in the height direction, in mm.
where E is the relative modulus of elasticity, in Pa; f is the maximum positive force, in N; s is the contact area, in m2; and ε is the linear strain.
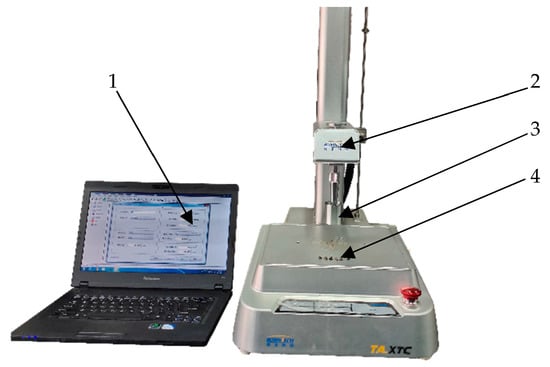
Figure 1.
Uniaxial compression test of buckwheat seeds: (1) control panel; (2) texture analyzer; (3) detection probe; and (4) buckwheat seeds.

Table 1.
Poisson’s ratio and relative elastic modulus of buckwheat seeds.
2.3. Measurement Method of Contact Parameters
The contact parameters reflect the interaction between particles and particles/walls. The drop test was used to measure the collision recovery of buckwheat seeds using a high-speed camera, and the static/rolling friction coefficients between buckwheat seeds and between buckwheat seeds and the polylactic acid (PLA) plate were measured using a friction coefficient tester.
2.3.1. Collision Recovery Coefficient
The collision recovery coefficients between buckwheat seeds and between buckwheat seeds and the PLA plate were measured using the drop test. The drop test device is shown in Figure 2. Formula (3) is usually used to calculate the collision recovery coefficient without air drag [19].
where e is the collision recovery coefficient; h is the rebound height, in mm; H0 is the drop height, in mm.
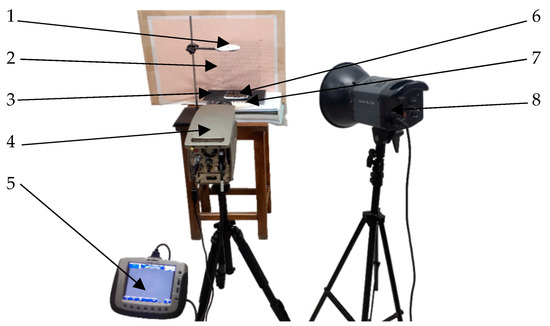
Figure 2.
Drop test device: (1) drop frame; (2) coordinate paper; (3) PLA plate; (4) high-speed camera; (5) control panel; (6) buckwheat seed plate; (7) buckwheat seeds; and (8) lighting.
The buckwheat seeds fell freely from the drop frame with a height of 200 mm and rebounded after colliding with the PLA plate, or buckwheat seed plate. The OLYMPUS i-SPEED high-speed camera system was used to record a drop video of the buckwheat seeds, and through the coordinate paper, the rebound height of the buckwheat seeds was obtained. The buckwheat seed plate was made by pasting seeds on the PLA plate with glue. Each parameter was measured ten times. The average collision recovery coefficients between buckwheat seeds and between buckwheat seeds and the PLA plate are 0.17 and 0.38, respectively, which were calculated using Formula (3), as shown in Table 2.
Table 2.
Collision recovery coefficient.
2.3.2. Static Friction Coefficient and Rolling Friction Coefficient
A friction coefficient test device (Xiamen Oriental Instrument Co., Ltd., Xiamen, China, ST-MXZ-1 type) was used to measure the static/rolling friction coefficient between buckwheat seeds and between buckwheat seeds and the PLA plate, as shown in Figure 3. The whole system is composed of a PLA plate, an objective table, a control panel, a buckwheat seed plate, a tractor, and a slider.
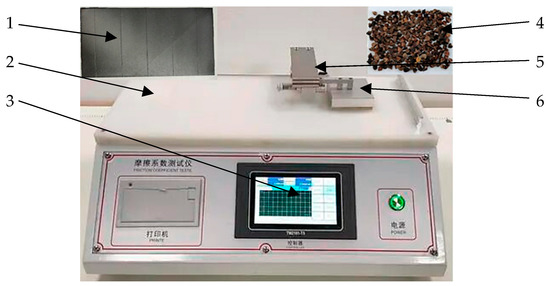
Figure 3.
Friction coefficient test device: (1) PLA plate; (2) objective table; (3) control panel; (4) buckwheat seed plate; (5) tractor; and (6) slider.
The PLA plate and buckwheat seed plate were fixed on the objective table, and 9 buckwheat seeds with similar widths were selected and closely arranged at the bottom of the slider. During the test, the tractor drove the slider to perform a reciprocating motion in order for the seeds on the slider to come into contact and bounce against the PLA plate and the buckwheat seed plate on the objective table. The forward speed of the tractor was 100 mm/min, and the return speed was 300 mm/min. The printer of the control panel was used to export the measurement results, and the experiment was repeated 5 times in each group. As shown in Table 3, the static friction coefficients between buckwheat seeds and between buckwheat seeds and the PLA plate are 0.65 and 0.24, respectively. The rolling friction coefficients between buckwheat seeds and between buckwheat seeds and the PLA plate are 0.40 and 0.13, respectively.
Table 3.
Friction coefficient.
2.4. Measurement Method of Repose Angle
The repose angle refers to the angle between the cone generator and the horizontal plane formed by the accumulation of granular materials when they naturally and continuously fall onto the plane from a certain height. It is widely used as a static parameter calibration of materials based on the DEM.
The bottomless cylinder method was used to measure the repose angle of buckwheat seeds. According to the size of buckwheat seeds, the inner diameter and the height of the cylinder are 60 mm and 180 mm, respectively [20]. During the measurement, the cylinder was filled with buckwheat seeds and placed horizontally on a PLA plate. One end of the cylinder was slowly lifted, and the buckwheat seeds fell onto the PLA plate through the other end to form a cone-shaped seed pile.
The front view image of the buckwheat seed particle heap was taken by a camera and imported into the CAD. As shown in Figure 4, the repose angle was calculated using Formula (4). The test was repeated 5 times, and the average repose angle of the buckwheat seeds is 29.79°.
where θ is the repose angle, (°); θ1 is the left repose angle, (°); and θ2 is the right repose angle, (°).
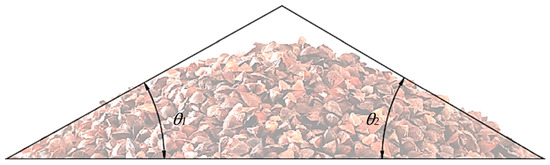
Figure 4.
Measurement of actual stacking angle of buckwheat seeds.
3. Buckwheat Seed Particle Model Establishment and Discrete Element Simulation Parameter Calibration
3.1. Establishment of Discrete Element Model
The methods of manual and automatic filling were used to establish particle models of buckwheat seeds. Table 4 lists six typical seed particle models, including corn, wheat, and alfalfa.
Table 4.
Seed particle models of different crops.
In this study, the buckwheat seed particle models were established using both manual and automatic filling methods. Static and dynamic tests were used to verify the accuracy of the models.
The buckwheat seeds were scanned using an industrial-grade CT imaging system (nanoVoxel128007030108) to obtain an initial 3D model, as shown in Figure 5. The Geomagic Wrap software was used to smooth the sharp edges and points in the process of model optimization.
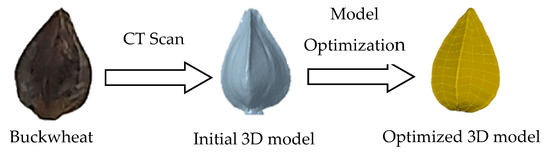
Figure 5.
The establishment of a 3D model of buckwheat seed.
The manual filling 7-sphere and automatic filling multi-sphere particle models of buckwheat seeds were established, as shown in Figure 6. The automatic filling multi-sphere particle models include 17-sphere, 25-sphere, 36-sphere, 49-sphere, 53-sphere, 60-sphere, 66-sphere, and 106-sphere, respectively. These models were used to study the influence of different filling quantities on the simulation results.
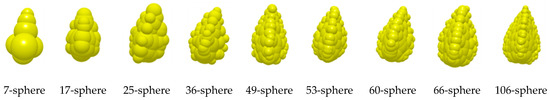
Figure 6.
Buckwheat seed particle model construction (7 spheres for manual modeling, and others for automatic filling).
According to the measured physical parameters and the contact parameters of buckwheat seeds, a cylindrical particle factory was established using the constructed particle models and simulated a bottomless cylinder test device in the EDEM software. In EDEM, the Hertz–Mindlin (no slip) model and the Standard Rolling Friction model were used to construct the particle–particle and particle–wall interaction models. Combined with Reference [25], the Poisson’s ratio, elastic modulus, and density of the PLA substrate were set to be 0.35, 3.5 × 10⁹ Pa, and 1250 kg/m3, respectively. The particle generation rate was 5000/s, and the generation time was 1 s. After running for 5 s to balance the system, the cylinder was lifted vertically at a speed of 0.05 m/s. The particles slowly flowed out from the bottom of the cylinder and, finally, formed a stable particle pile on the bottom plate. To improve the simulation efficiency and the reliability of the simulation results, the size of the generated particles was fixed. In all simulation experiments, the 20% Rayleigh time step was uniformly taken, and the mesh size was 3 times the minimum spherical unit size.
As shown in Figure 7, the simulation results of the repose angle of both manual filling 7-sphere and automatic filling multi-sphere particle models are larger than the measured value (29.79°) of the bottomless cylinder method. The different sphere numbers of the automatic filling multi-sphere particle models have great influence on the simulation results of the repose angle, as shown in Figure 8.
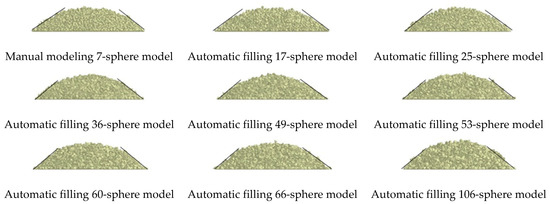
Figure 7.
Simulation results of the stacking angle of different seed particle models.
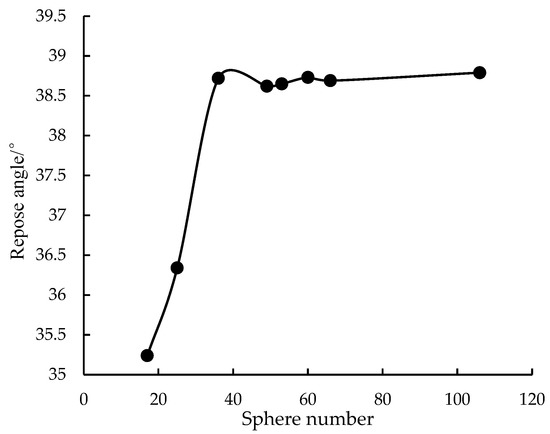
Figure 8.
The influence of different sphere numbers of the automatic filling multi-sphere particle models on the simulation results of repose angle.
As we all know, with an increase in the complexity of a model, the requirements for computing capability and research time also increase. Therefore, on the basis of the independent analysis of sphere numbers, the minimum sphere number was used to establish an automatic filling multi-sphere model of buckwheat seed. When the sphere number increases from 17 spheres to 36 spheres, the repose angle increases from 35.2° to 38.6°, with an increase of 9.7%. When the sphere number increases from 36 spheres to 106 spheres, the repose angle is basically unchanged, with an increase of less than 0.3%. The results of the studies by Pasha and Markauskas also showed that particle models with different numbers of spheres have no significant effect on the packing angle, and the packing angle converges and tends to be constant when the number of spheres reaches a certain number [26,27]. To improve computational efficiency, the 36-sphere model was used to establish a buckwheat seed particle model based on discrete element simulation.
3.2. Discrete Element Simulation Parameter Calibration
The Plackett–Burman test was used to screen for significant factors in the parameter calibration. The regression equation was built using an orthogonal test, and the optimal parameter combination was obtained through parameter optimization design based on the Design-Expert software.
3.2.1. Plackett–Burman (PB) Design
The Design-Expert software was used to design the Plackett–Burman test. The test factors are shown in Table 5. The average values of the test factors refer to the measured values of the physical and contact parameters, and the maximum and minimum values are coded as high level (+1) and low level (−1), respectively. Both manual filling 7-sphere and automatic filling 36-sphere particle models were used for the Plackett–Burman test. The test results and the results of the variance analysis are shown in Table 6 and Table 7, respectively.
Table 5.
Plackett–Burman test factors.
Table 6.
Plackett–Burman test design and results.
Table 7.
Plackett–Burman test variance analysis.
The variance analysis results show that the static friction coefficient between buckwheat seeds and the PLA plate is highly significant for both manual filling 7-sphere particle model and automatic filling 36-sphere particle model. The other factors are not significant. Therefore, the single-factor test was used to build regression equations.
3.2.2. The Single-Factor Test and Parameter Optimization Design
The steepest ascent path was used to approach the best optimal static friction coefficients between buckwheat seeds and the PLA plate in the single-factor test. The levels of the factor were selected as 0.10, 0.16, 0.22, 0.28, 0.34, and 0.40, respectively. The other factors adopted the measured values of the test, that is, the Poisson’s ratio of buckwheat seeds of 0.42, the elastic modulus of 5.32 × 10⁶ Pa, the restitution coefficient of collision between buckwheat seeds and buckwheat seeds of 0.17, the restitution coefficient of collision between buckwheat seeds and the PLA plate of 0.38, the static friction coefficient between buckwheat seeds and buckwheat seeds of 0.65, the dynamic friction coefficient between buckwheat seeds and buckwheat seeds of 0.40, and the dynamic friction coefficient between buckwheat seeds and the PLA plate of 0.13.
As shown in Figure 9, the results show that when the 7-sphere manual filling particle model is used, the repose angle of buckwheat seeds and the static friction coefficient between buckwheat seeds and the PLA plate are linearly related, and when the 36-sphere automatic filling particle model is used, the repose angle of buckwheat seeds and the static friction coefficient between buckwheat seeds and the PLA plate has a quadratic polynomial function; the determination coefficients are 0.971 and 0.998, respectively.
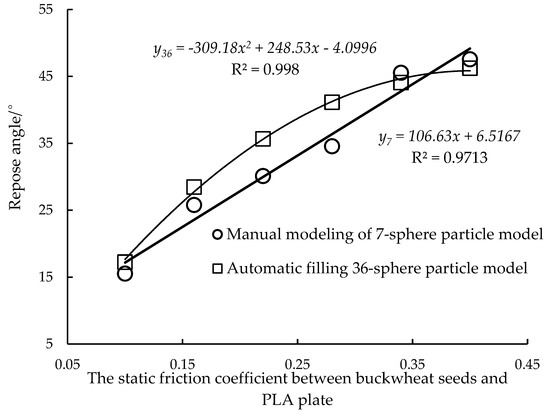
Figure 9.
The influence of the static friction coefficient between buckwheat seeds and the PLA plate on repose angle.
Based on the regression equations of the 7-sphere manual filling particle model and the 36-sphere automatic filling particle model, the best optimal static friction coefficients between buckwheat seeds and the PLA plate were calculated, and the values are 0.22 and 0.17, respectively. The simulation and bench verification of the static cylinder-lifting test were carried out under the condition of optimal parameter combination, and the test results are shown in Table 8.
Table 8.
Comparison of simulation test results and bench verification results.
The results of the optimal parameter combination show that both the manual filling 7-sphere particle model and automatic filling 36-sphere particle model are accurate in the simulation of the static cylinder-lifting test, and the relative error is 1% and 2%, respectively, compared with the bench verification result.
4. Dynamic Seed-Metering Verification Test
The movement and force of buckwheat seeds in the metering device are different from the static cylinder-lifting test. Therefore, a dynamic seed-metering verification test was designed in this study.
4.1. Seed-Metering Device
The seed-metering device for the test is shown in Figure 10a–c. The simulation model of the seed-metering device was built using CROE soft and imported into the EDEM. The seed-metering device test bench was used to verify the simulation results of different rotation speeds and effective working lengths of the seeding wheel. The range of rotation speed is 0~100 r/min, and the range of effective working length is 0~40 mm.
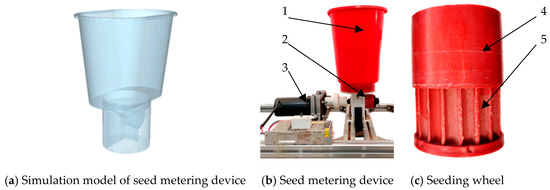
Figure 10.
Seed-metering device: (1) seed box; (2) seed-metering device; (3) speed motor; (4) baffle plate; and (5) slot wheel.
4.2. Method of Dynamic Seed-Metering Verification Test
The manual filling 7-sphere particle model and the automatic filling 36-sphere particle model with the best calibration parameters were used to establish the buckwheat seed particle model. The establishment method of particle factory is the same as that of the static cylinder-lifting test. The rotation speed and effective working length of the seeding wheel were the test factors, and each factor was divided into 5 levels, as shown in Table 9.
Table 9.
Test factor level.
The seeding rate per unit of time was used as the test index. During the verification test, the seed collection plate was used to collect buckwheat seeds discharged by the seed-metering device when the motor speed was stable. The seeds were collected for 1 min and weighed, the seeding rate per unit of time was calculated, and the average was repeated 5 times.
4.3. Results and Analysis
The simulation results of different rotation speeds of the seeding wheel are shown in Figure 11. When the effective working length of the seeding wheel is 40 mm, the seeding rate increases with an increase in the rotation speed of the seeding wheel. For the manual filling 7-sphere particle model, when the rotation speed of the seeding wheel is less than 30 r/min, the discharged seed flow is uniform; on the other hand, when the rotation speed is greater than 40 r/min, the discharged seed flow is discontinuous. For the automatic filling 36-sphere particle model, with an increase in the rotation speed, the seed flow also shows a trend of uniform and then discontinuous; the difference is that the critical rotation speed is increased.
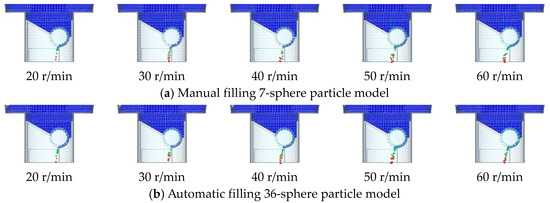
Figure 11.
Simulation test results of different seeding wheel speeds (the effective working length of the seeding wheel is 40 mm).
The simulation results of different effective working lengths of the seeding wheel are shown in Figure 12. When the rotation speed of the seeding wheel is 60 r/min, the seeding rate increases with an increase in the effective working length of the seeding wheel. Compared with the automatic filling 36-sphere particle model, the manual filling 7-sphere particle model has lower uniformity of seed flow. Additionally, with an increase in the effective working length, the difference between the two models shows an increasing trend.
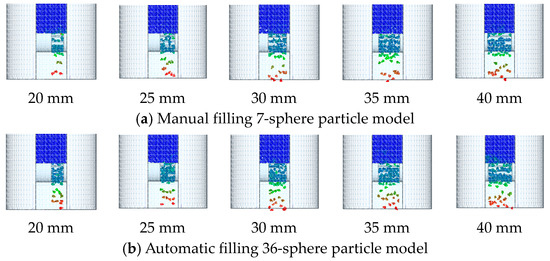
Figure 12.
Simulation test results of different effective working lengths of the seeding wheel (rotation speed of the seeding wheel is 60 r/min).
In general, the seed flow formed by the grooved-wheel seed-metering device is discontinuous due to its structure, and with an increase in the rotation speed of the seeding wheel, the discharged seed flow becomes more and more uniform. In the simulation of the seed-metering device, with an increase in the rotation speed of the metering wheel, the movement and force of the seeds inside the metering device become more complex, which requires a more accurate seed particle model. The simulation results of the automatic filling 36-sphere particle model are more consistent with the experience.
Figure 13 shows the measured and simulated values of the seeding rate per unit time at different rotation speeds of the seeding wheel, when the effective working length of the seeding wheel is 40 mm. With an increase in the rotation speed, both measured value and simulated value of seeding rate per unit of time increase linearly. The average relative error between the measured value and the simulated value of the manual filling 7-sphere particle model and the automatic filling 36-sphere particle mode is 15.85% and 4.69%, respectively.
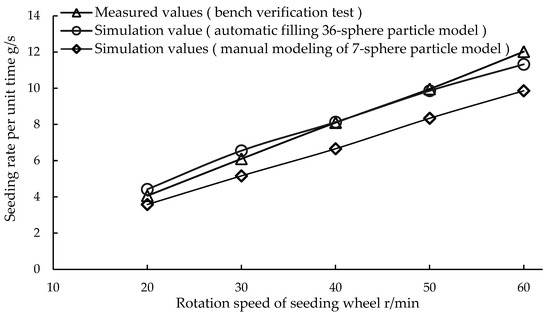
Figure 13.
Measured and simulated values of seeding rate under different rotation speeds of the seeding wheel (effective working length of the seeding wheel is 40 mm).
Figure 14 shows the measured and simulated values of the seeding rate per unit of time at different effective working lengths of the seeding wheel, when the rotation speed of the seeding wheel is 60 r/min. With an increase in effective working length, both measured value and simulated value of seeding rate per unit time increase linearly. The average relative error between the measured value and the simulated value of the manual filling 7-sphere particle model and the automatic filling 36-sphere particle mode is 22.18% and 9.07%, respectively.
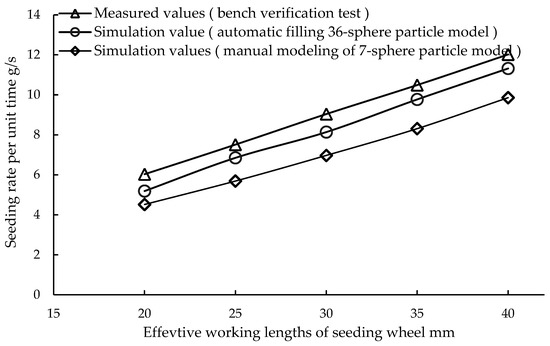
Figure 14.
Measured and simulated values of seeding rate under different effective working lengths of the seeding wheel (rotation speed of the seeding wheel is 60 r/min).
In summary, the verification test results show that compared with the manual filling 7-sphere particle model, the automatic filling 36-sphere particle model has higher accuracy for the simulation of dynamic motion such as seed-metering device.
5. Conclusions
- (1)
- The manual filling 7-sphere particle model and automatic filling 36-sphere particle model of buckwheat seeds were established, respectively. The physical parameters and contact parameters of the particle models were measured, and the discrete element simulation parameters were calibrated. The results of the simulation and bench verification of the static cylinder-lifting test show that the relative errors between the simulated value and the measured value of the two particle models are 1.04% and 0.50%, respectively. The results of the dynamic seed-metering test show that the maximum average relative errors between the simulated value and the measured value are 22.18% and 9.07%, respectively. The automatic filling 36-sphere particle model has higher simulation accuracy.
- (2)
- A simulation test of repose angle with different sphere numbers based on the automatic filling multi-sphere particle model was carried out, and the results show that with an increase in the sphere number in the model, the repose angle first increases and then remains basically unchanged. The automatic filling 36-sphere particle model was used to establish the particle model of buckwheat seed.
- (3)
- The Plackett–Burman test and steepest ascent path were used to obtain the optimal parameter combination based on the static cylinder-lifting test. The optimal parameter values of static friction coefficients of the manual filling 7-sphere particle model and the automatic filling 36-sphere particle model between buckwheat seeds and the PLA plate are 0.22 and 0.17, respectively.
Author Contributions
Conceptualization, Z.F.; methodology, G.L.; validation, G.L., H.L. and X.L.; investigation, Y.H. and Z.G.; resources, Z.F. and Q.Y.; writing—original draft preparation, G.L.; writing—review and editing, G.L. All authors have read and agreed to the published version of the manuscript.
Funding
This research was funded by the National Key R & D Program (2021YFD2000405-5) and the Shaanxi Provincial Key R & D Program (2019ZDLNY02-03).
Institutional Review Board Statement
Not applicable.
Informed Consent Statement
Not applicable.
Data Availability Statement
The data presented in this study are available from the corresponding author upon request at (fuzuoli@nwsuaf.edu.cn).
Acknowledgments
This work was financially supported by the Northwest A&F University. All support and assistance are sincerely appreciated.
Conflicts of Interest
The authors declare no conflict of interest.
References
- Chai, Y.; Wang, P.K.; Feng, B.L. Development Guide of Small Grain Industry in China, 1st ed.; Northwest A & F University Press: Yangling, China, 2007; pp. 394–404. [Google Scholar]
- Chen, Z.; Jin, X.L.; Du, W.L.; Ma, Y.M.; Kang, L.F.; Su, R. Study on Processing Parameters of Different Buckwheat Varieties. J. Inn. Mong. Agric. Univ. (Nat. Sci. Ed.) 2020, 41, 56–61. [Google Scholar]
- Wang, Z.H. Growth Habit and High-yield Planting Technology of Buckwheat. Mod. Anim. Husb. Technol. 2021, 47–48. [Google Scholar] [CrossRef]
- Zhang, C.; Du, W.L.; Chen, Z.; Su, R. The Measurement of Contact Parameters of Buckwheat Rice Screening Material and Discrete Element Simulation Calibration. J. Agric. Mech. Res. 2019, 41, 46–51. [Google Scholar]
- Huang, X.N.; Zhang, W.G.; Zhang, K.K.; Feng, S.K.; Liu, Z.J.; Yang, F.Z. Design Study on Compression and Shear Mechanical Properties of Buckwheat Grain. J. Agric. Mech. Res. 2021, 43, 168–177. [Google Scholar]
- Zeng, Z.W.; Ma, X.; Cao, X.L.; Li, Z.H.; Wang, X.C. Critical Review of Applications of Discrete Element Method in Agricultural Engineering. Trans. Chin. Soc. Agric. Mach. 2021, 52, 1–20. [Google Scholar]
- Huang, Y.X.; Li, P.; Dong, J.X.; Chen, X.H.; Zhang, S.L.; Liu, Y. Design and Experiment of Side-mounted Guided High Speed Precision Seed Metering Device for Soybean. Trans. Chin. Soc. Agric. Mach. 2022, 53, 44–53. [Google Scholar]
- Shu, C.X.; Yang, J.; Wan, X.Y.; Yuan, J.C.; Liao, Y.T.; Liao, Q.X. Calibration and experiment of the discrete element simulation parameters of rape threshing mixture in combine harvester. Trans. CSAE 2022, 38, 34–43. [Google Scholar]
- Li, J.W.; Tong, J.; Hu, B.; Wang, H.B.; Mao, C.Y.; Ma, Y.H. Calibration of parameters of interaction between clayey black soil with different moisture content and soil-engaging component in northeast China. Trans. CSAE 2019, 35, 130–140. [Google Scholar]
- Tian, X.L.; Cong, X.; Qi, J.T.; Guo, H.; Li, M.; Fan, X.H. Parameter Calibration of Discrete Element Model for Corn Straw-Soil Mixture in Black Soil Areas. Trans. Chin. Soc. Agric. Mach. 2021, 52, 100–108. [Google Scholar]
- Wu, Z.Y.; Xie, F.P.; Mei, Y.R.; Wang, X.S.; Liu, D.W.; Wu, B. Review on calibration of discrete element method (DEM) parameters for agricultural engineering. Agric. Eng. Equip. 2021, 48, 7–18. [Google Scholar]
- Coetzee, C.J. Review: Calibration of the Discrete Element Method. Powder Technol. 2017, 310, 104–142. [Google Scholar] [CrossRef]
- Horabik, J.; Molenda, M. Parameters and contact models for DEM simulations of agricultural granular materials: A review. Biosyst. Eng. 2016, 147, 206–225. [Google Scholar] [CrossRef]
- Wang, Y.X.; Liang, Z.J.; Zhang, D.X.; Cui, T.; Shi, G.; Li, K.H.; Yang, L. Calibration method of contact characteristic parameters for corn seeds based on EDEM. Trans. CSAE 2016, 32, 36–42. [Google Scholar]
- Liu, F.Y.; Zhang, J.; Li, B.; Chen, J. Calibration of parameters of wheat required in discrete element method simulation based on repose angle of particle heap. Trans. CSAE 2016, 32, 247–253. [Google Scholar]
- Zhang, R.F.; Jiao, W.; Zhou, J.L.; Qi, B.; Liu, H.; Xia, Q.Q. Parameter Calibration and Experiment of Rice Seeds Discrete Element Model with Different Filling Particle Radius. Trans. Chin. Soc. Agric. Mach. 2020, 51, 227–235. [Google Scholar]
- Yan, D.X.; Yu, J.Q.; Wang, Y.; Zhou, L.; Yu, Y.J. A general modeling method for soybean seeds based on the discrete element method. Powder Technol. 2020, 372, 212–226. [Google Scholar] [CrossRef]
- Liu, W.Z.; He, J.; Li, H.W.; Li, X.Q.; Zheng, K.; Wei, Z.C. Calibration of Simulation Parameters for Potato Minituber Based on EDEM. Trans. Chin. Soc. Agric. Mach. 2018, 49, 125–135. [Google Scholar]
- Hou, Z.F.; Dai, N.Z.; Chen, Z.; Chou, Y.; Zhang, X.W. Measurement and calibration of physical property parameters for Agropyron seeds in a discrete element simulation. Trans. CSAE 2020, 36, 46–54. [Google Scholar]
- Wu, A.X.; Sun, Y.Z.; Liu, X.P. Theory of Granular Dynamics and Its Application, 1st ed.; Metallurgical Press: Beijing, China, 2002; p. 18. [Google Scholar]
- Wu, M.C.; Cong, J.L.; Yan, Q.; Zhu, T.; Peng, X.Y.; Wang, Y.S. Calibration and experiments for discrete element simulation parameters of peanut seed particles. Trans. CSAE 2020, 36, 30–38. [Google Scholar]
- Hao, J.J.; Wei, W.B.; Huang, P.C.; Qin, J.H.; Zhao, J.G. Calibration and experimental verification of discrete element parameters of oil sunflower seeds. Trans. CSAE 2021, 37, 36–44. [Google Scholar]
- Ma, W.P.; You, Y.; Wang, D.C.; Yin, S.J.; Huan, X.L. Parameter Calibration of Alfalfa Seed Discrete Element Model Based on RSM and NSGA-Ⅱ. Trans. Chin. Soc. Agric. Mach. 2020, 51, 136–144. [Google Scholar]
- Hu, M.J.; Xia, J.F.; Zhou, Y.; Luo, C.M.; Zhou, M.K.; Liu, Z.Y. Measurement and Calibration of the Discrete Element Parameters of Coated Delinted Cotton Seeds. Agriculture 2022, 12, 286. [Google Scholar] [CrossRef]
- Liu, Y.H. Structural Design and Transformation Mechanism of 3D-Printed PLA with Positive/Negative Poisson Ratio; Harbin Institute of Technology: Harbin, China, 2020. [Google Scholar]
- Pasha, M.; Hare, C.; Ghadiri, M.; Gunadi, A.; Piccione, P.M. Effect of particle shape on flow in discrete element method simulation of a rotary batch seed coater. Powder Technol. 2016, 296, 29–36. [Google Scholar] [CrossRef]
- Markauskas, D.; Kacianauskas, R.; Dziugys, A.; Navakas, R. Investigation of adequacy of multi-sphere approximation of elliptical particles for DEM simulations. Granul. Matter 2010, 12, 107–123. [Google Scholar] [CrossRef]


Disclaimer/Publisher’s Note: The statements, opinions and data contained in all publications are solely those of the individual author(s) and contributor(s) and not of MDPI and/or the editor(s). MDPI and/or the editor(s) disclaim responsibility for any injury to people or property resulting from any ideas, methods, instructions or products referred to in the content. |
© 2023 by the authors. Licensee MDPI, Basel, Switzerland. This article is an open access article distributed under the terms and conditions of the Creative Commons Attribution (CC BY) license (https://creativecommons.org/licenses/by/4.0/).