Abstract
This study investigated two popular satellite-derived vegetation indices (VIs), MODIS NDVI and EVI, as tools for monitoring crop growth at the Thapanzeik Dam irrigation district in Myanmar, where quality ground data are difficult to obtain. The time-series analysis for seasonal peak VIs presented a considerable improvement in paddy cultivation during 2001–2020 in the irrigation district during summer and monsoon. Fields outside the district had a much lower improvement ratio. Within the irrigation district, a canal with limited water supply was identified via peak and average VIs evaluation. The evaluation of precipitation impact on crop growth demonstrated an opposite impact on crop growth in summer and monsoon cultivations. Water is one of the limiting factors in summer in the irrigation district; thus, precipitation improves water conditions. However, water is not the limiting factor in monsoon; thus, extra water from precipitation, both hydraulically and meteorologically, negatively impacts crop growth. Compared to NDVI, EVI better captured crop growth in densely vegetated surfaces. Meanwhile, information degradation might have occurred with 250 m EVI, using 500 m blue-band reflectance as an input. Thus, the best vegetation index to use depends on the purpose of monitoring and the site situation.
1. Introduction
When planning rehabilitation projects for irrigation systems in developing countries, planners often face a deficit of data required for project design. Agriculture statistics are generally arranged not on an irrigation system basis, but on an administrative unit basis. In some cases, planners cannot conduct detailed field surveys as the target project area is close to the conflict areas. In the Republic of the Union of Myanmar, field data and statistics related to irrigation schemes and agricultural production are not always available due to political confusion, which prevents the strategic planning of irrigation design and management based on scientific data.
Satellite remote-sensing technology provides ground information observed from space. These data are valuable, especially in regions with limited ground-based information [1]. Vegetation monitoring using satellite-observed infrared reflectance has been popular in agricultural applications since Tucker [2] developed the Normalized Difference Vegetation Index (NDVI). NDVI represents the amount of green vegetation using the normalized difference between the red and near-infrared reflectance of solar radiation. This index has been used for several purposes related to agriculture, including crop classification [3], irrigation monitoring [4], field evapotranspiration estimation [5], and yield estimation [6,7]. While the NDVI has been the most popular index for vegetation monitoring, the index has well-known weaknesses at a sparse vegetation region, where the soil background information weight is large, and a region of densely vegetated surface, where the reflectance signals “saturate” [8]. Several alternative vegetation indices (VIs) have been proposed to overcome the limitations of NDVI. The soil-adjusted vegetation index [9] attempted to improve vegetation monitoring performance by reducing noise caused by the background soil, and the Enhanced Vegetation Index (EVI) [10] attempted to improve vegetation monitoring in densely vegetated surfaces. Several studies have reported that EVI is superior to NDVI [11,12,13]. Son et al. [8] investigated NDVI and EVI performance on rice yield estimation in Vietnam and concluded that EVI was slightly better than NDVI as an indicator.
While rich research-type information is available for vegetation monitoring by satellite, there are limitations to the application of these techniques in irrigation project planning. Typical projects are designed to ensure operational achievements within a relatively short period. Additionally, the primary conductors of planners are administrators and engineers, rather than researchers. Such circumstances prevent the introduction of research investigations into the implementation plan. The accumulation of good practices and examples that effectively describe the performance of satellite-based vegetation monitoring is desirable to promote the application of satellite data for operational purposes. Therefore, the purpose of this study is to suggest an operational and feasible framework for the initial investigation of agricultural status in a target area by relying on satellite-based information with limited use of in situ data. By setting the Thapanzeik Dam irrigation district in Myanmar as the study area, this study aims to illustrate the information derived from paddy rice double-cropping cultivation utilizing two popular VIs, NDVI and EVI. Additionally, the characteristics and performance of NDVI and EVI are discussed, which contain a new perspective on the input spatial resolution of VIs.
2. Materials and Methods
2.1. Study Area
The study area was the Thapanzeik Dam irrigation district, located in a vast paddy area along the Mu River in the Sagaing region of Myanmar (Figure 1). The latitude and longitude of the district are 22°15′–23°13′ N and 95°48′–95°12′ E, respectively. The elevation ranges from 160 m at its northern upstream side to 100 m at its southernmost downstream part. The irrigation system has four primary canals: the Right Main (RMC), Ye-U Main (YMC), Shwebo Main (SMC), and Old Mu Canal (OMC). In this study, RMC was further divided into upstream (Upper Right Main Canal, URMC) and downstream (Lower Right Main Canal, LRMC). Six rain gauges, five inside and one outside the district, were available surrounding the study area (Figure 1).
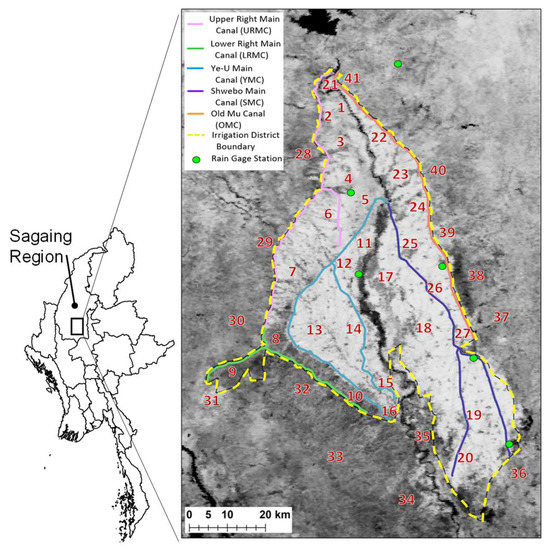
Figure 1.
Study area and the locations of sample points indicated by number depicted on MODIS NDVI for October 2020.
The study area is located within a poor rainfall area in Myanmar, the Central Dry Zone (CDZ). During 2016–2018, the Japan International Cooperation Agency (JICA) and Sanyu Consultants Inc. (SCI) surveyed the agricultural circumstances of the study area [14]. According to the survey, the irrigation district typically cultivates paddy rice twice a year, once in the monsoon and once in the summer. The monsoon paddy cultivation starts from August till November to January, by utilizing sufficient rainfall from the monsoon. Irrigation enables the cultivation of summer paddies from March to early July. Alternatively, in rain-fed areas typically located outside the irrigation district, paddy rice tends to be cultivated only during the monsoon. In the summer, some fields cultivate other crops that require less water, including chickpea, green gram, ground nut, and sesame, from November, just after the early harvest of monsoon paddy rice, to March, using the remaining soil moisture. In upland areas, where water is insufficient to cultivate paddy rice even in monsoon, pulses and oil crops are cultivated in the monsoon.
Annual precipitation (average of six rain gauges installed in the study area from 2001 to 2016) varied from 518 to 1182 mm, averaging 862 mm (Figure 2). As a general characteristic of rainfall in the CDZ, rainfall is not stable by year or location, especially at the onset of the monsoon. It starts raining in April and continues until November, during which the major rainy season is from May to October (Figure 3). The rainfall peaks in August and September were over 150 mm on average and more than 200 mm in some locations. Little rain was expected from December to March.
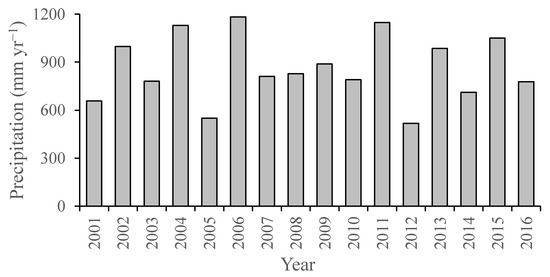
Figure 2.
Annual average precipitation.
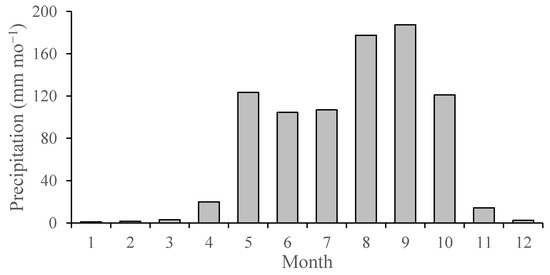
Figure 3.
Monthly average precipitation.
2.2. Data Utilized
Two types of satellite-based VIs, NDVI [2] and EVI [10], were used to monitor vegetation status in the study area. The target duration was set to 20 years from 2001 to 2020. The VIs were provided as Moderate Resolution Imaging Spectroradiometer (MODIS) MOD13Q1 vegetation index product version 3.10 collection 6.1 [15]. MOD13Q1 provided 16-day, cloud-free NDVI and EVI at 250 m maximum resolution, based on daily observation data. While clouds tend to prevent sustainable monitoring of land surfaces with visible and near-infrared satellite observations in monsoon Asia [16], MOD13Q1 provided a 16-day continuous, cloud-free dataset derived from observations with high temporal resolution (i.e., daily). Landsat (spatial resolution = 30 m) and Sentinel-2 (spatial resolution = 10 m) are also popularly used satellites for obtaining VI information. Compared to these satellites, the advantage of MODIS is the higher temporal resolution that contributes to conduct a robust surface observation even under humid climates. The primary disadvantage is the lower spatial resolution. As a characteristic of MODIS-type satellite images, the effective resolution changed based on the sensor angle. The resolution is maximum (250 m × 250 m) at the nadir sensor angle but degrades up to 610 m × 380 m at a 45° sensor angle by the so-called bow-tie effect [17]. Upon generating 16-day, cloud-free composite data from daily observation, MOD13Q1 has tried selecting observations having a higher spatial resolution, by adopting the “Constrained View angle–Maximum Value Composite” (CV-MVC) method [10]. The NDVI and EVI are defined by Equations (1) and (2), respectively:
where ρB, ρR, and ρNIR are blue, red, and near-infrared satellite band reflectance, respectively; C1 and C2 are the coefficients of the aerosol resistance term calibrated as 6.0 and 7.5, respectively; G is a scaling factor given as 2.5; and L is the canopy background adjustment factor given as 1.0, for the MODIS MOD13 product.
In this study, daily precipitation records measured at six rain gauges installed surrounding the study area from 2001 to 2016 were used for the analysis. The rain gauges were managed by the Ministry of Agriculture, Livestock, and Irrigation. General information on agricultural practices and site circumstances was obtained from a survey report for the region [14].
2.3. Analysis Method
The study aims to derive the following three types of information:
- (a)
- Investigation of current agricultural practices.
- (b)
- Impact of precipitation on crop growth.
- (c)
- NDVI and EVI performance assessment.
The study flowchart is depicted in Figure 4. The first step was to comprehend the general agricultural practices of the study area, which were obtained by plotting the NDVI and EVI values. There were some minor technical issues in the accurate derivation of agricultural information from satellite-based VIs. The typical field size in the study area (e.g., 50 m × 50 m) was smaller than the spatial resolution of satellite images (i.e., 250 m or coarser), and some nonagricultural land uses, including buildings, roads, and canals, were spread over the study area. Additionally, MODIS spatial resolution varied according to the observation. To minimize this problem, this study conducted an analysis using VI values from manually selected sample locations, which were selected from large agricultural areas. The VI values of each sample location comprised an average of four 250 m × 250 m pixels, and the sampled locations are depicted in Figure 1. Samples #1 to #27 were from the irrigation district, wherein #1 to #7 were URMC, #8 to #10 were LRMC, #11 to #16 were YMC, #17 to #20 were SMC, and #21 to #27 were OMC command fields. Additionally, 14 sampling locations (#28 to #41) were selected from outside the irrigation district. Samples from outside the district were used for comparison with the data inside the irrigation district, so that the crop growth in the irrigation district was better elucidated. Because the irrigation district practices rice double-cropping, one in summer and the other in the monsoon, two VIs peaks per year were expected. The 20-year change in crop growth was evaluated by investigating (1) the peak VI values for the two seasons, where the peak VI value is a popular indicator for irrigation monitoring [4] and estimating crop yield [18,19] and (2) the seasonal average VI values, which has a close relationship with crop yield [20]. In this study, the specific periods used for computing the peak and the average VIs were set as 22 March to 27 July for summer cultivation and 28 July to 21 March for monsoon cultivation, where 22 March and 27 July correspond to the average dates for two VI bottoms in the study area.
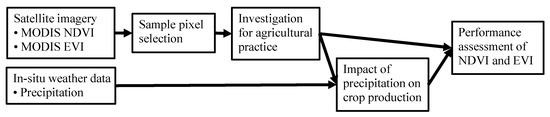
Figure 4.
Study flow chart.
In this study, in situ precipitation records measured in the irrigation district were adopted to evaluate the impact of water circumstances on crop growth, by assuming that the precipitation at the site may represent the water resources' general availability in the irrigation district. This analysis was conducted for the period of 2001 to 2016 (i.e., during the period that the in situ precipitation data are available), by comparing the VI information and precipitation. The characteristics of the two VI values (NDVI and EVI) were compared. Discussions were made regarding which index is operationally more appropriate for paddy rice irrigation monitoring.
3. Results and Discussion
3.1. Agricultural Practices
Figure 5 depicts the 20 years’ average seasonal changes in NDVI and EVI in the study area. The VI values are conferred by the averages of sample locations for each canal system (URMC, LRMC, YMC, SMC, and OMC), with the samples outside the study area. Except for LRMC, the fields inside the irrigation district demonstrated two VIs peaks per year, one in June and the other in late October, indicating that farmers had practiced double-cropping. On the other hand, VI values for the LRMC and outside the district had a single peak in late October, indicating that most of the sampled fields practiced only one cultivation per year. A field survey report [14] indicated that LRMC fields were typically not irrigated due to insufficient water supply to the canal. The satellite observations depicted in Figure 5 verified that LRMC fields were in agricultural conditions similar to nonirrigated fields outside the district. The fields located outside the district demonstrated peak VI in the fall, with significantly lower values than the primary fields of the irrigation district (Figure 5a,b). This result indicated that the irrigation system contributed to effective crop growth. Within the irrigation district, the peak VIs of the command fields of RMCs (i.e., URMC and LRMC) were lower than those in the other areas, implying that refinements or further improvement of the RMC system, or more water resources that can distribute to the canal system, might be required. While NDVI and EVI essentially provided similar information, some differences in appearance were verified. The characteristics and differences between the NDVI and EVI are discussed in a later section.

Figure 5.
Seasonal changes of (a) NDVI and (b) EVI in the study area.
Figure 6 and Figure 7 depict the seasonal peak NDVI and EVI for summer and monsoon, respectively. The regression line inside the irrigation district was computed using the average of all samples located inside the irrigation district, except for LRMC. The LRMC field samples were omitted from this analysis to better describe the primary field conditions in the district. Information for outside the irrigation district is demonstrated only for the monsoon as no peak was verified for summer cultivation. In both summer and monsoon, the peak VI values inside the district have an increasing trend, implying that they have improved crop growth year-by-year. The slope of the linear regression line in NDVI (Figure 6) was approximately 0.01 in both seasons, indicating that NDVI values increased by approximately 0.2 over the past 20 years from 2001 to 2020. This rate of increase in the NDVI is generally regarded as significant. For example, Ajith et al. [18] reported that the average increment of rice yield for the increment of seasonal peak NDVI from 0.6 to 0.8 was approximately 1500 kg ha−1 or 35%. Belton et al. [21] reported that extremely rapid agricultural mechanization improved crop productivity during their study from 2011 to 2020 in Myanmar CDZ. The strong and constant rise in crop production monitored in this study might be the result of technical advancements in the agricultural sector in the study area. The increment trend of VIs was also verified outside the district, although the ratio of increment, as represented by the slope of the linear regression line, was less than half of the fields in the irrigation district. Crop growth has significantly increased, not in the entire region but only in the irrigation district. Within the irrigation district, large annual deviations of VIs were identified in the summer, while little deviation was observed in the monsoon, as appeared in the difference in R2 values between the summer (0.44 for NDVI and 0.50 for EVI) and monsoon (0.88 for NDVI and 0.87 for EVI). This indicates that summer cultivation is unstable compared to monsoon cultivation.
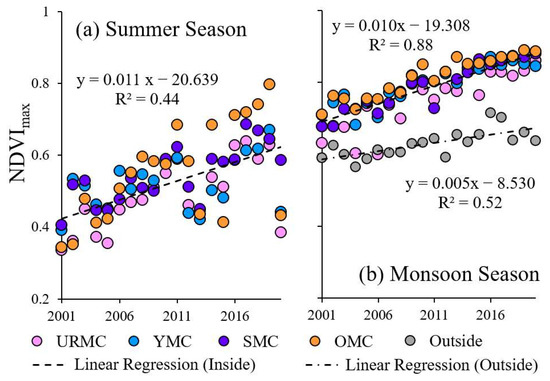
Figure 6.
Seasonal peak NDVI for (a) summer and (b) monsoon by year.
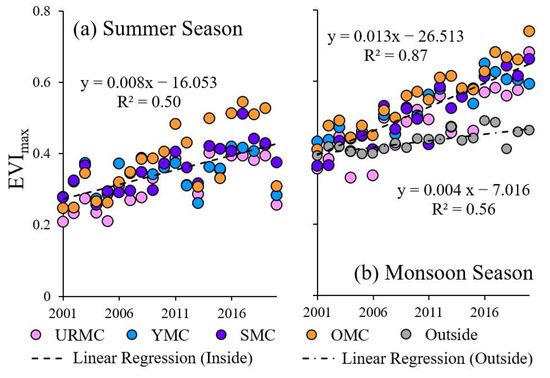
Figure 7.
Seasonal peak EVI for (a) summer and (b) monsoon by year.
3.2. Impact of Precipitation
In the irrigation district, the clear trend of improvement in crop growth (Figure 6 and Figure 7) was not related to precipitation as no such one-way trend of increment was verified in precipitation (Figure 2). The impact of precipitation on crop growth, represented by the seasonal peak VI values, was evaluated by comparing the precipitation amount and the VI values deviation from the general trend of long-term increment, where the “deviation” is illustrated as arrows in Figure 8a for summer and Figure 9a for monsoon. Figure 8b depicts the NDVI deviation (ΔNDVImax) for summer cultivation compared with precipitation accumulated from January to June. January to June was the accumulation period that elucidated the best ΔNDVImax (i.e., it demonstrated the highest R2). As depicted in Figure 8b, a slight positive relationship was verified between ΔNDVImax and precipitation, indicating that the “wet” year tends to expect better crop growth in summer cultivation. The regression line slope, 0.00025, is equivalent to a 0.075 NDVI value, for a 300 mm difference in January to June cumulative precipitation (e.g., 100 mm for dry years vs. 400 mm for wet years). Although the R2 value of 0.24 indicates that precipitation may not be the primary factor for elucidating the year-by-year deviation of crop growth, the impact of precipitation may not be negligible when compared to the ΔNDVImax standard deviation of 0.057.
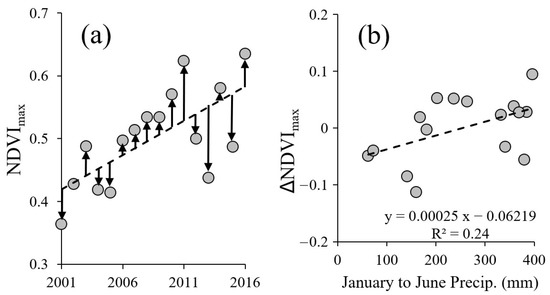
Figure 8.
(a) Seasonal peak NDVI for summer for an average of all sample locations inside the irrigation district, and (b) the comparison between January–June precipitation and NDVI difference.
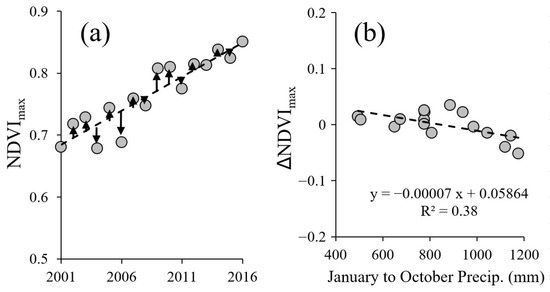
Figure 9.
(a) Seasonal peak NDVI for monsoon for an average of all sample locations inside the irrigation district, and (b) the comparison between January–October precipitation and NDVI difference.
Interestingly, the same analysis for monsoon cultivation demonstrated the opposite response of ΔNDVImax to precipitation (Figure 9b). January to October was the accumulation period that elucidated the best ΔNDVImax (i.e., it demonstrated the highest R2). Hydrologically, precipitation that occurred more than a few months prior to the start of monsoon cultivation may have no or positive impact on the crop growth in monsoon cultivation (e.g., in case the early precipitation contributes to the dam’s water storage at the beginning of monsoon cultivation). Although the details are not shown in Figure 9b, a detailed analysis indicated that early precipitation slightly had a positive impact on monsoon cultivation, while on-season precipitation had a clear negative impact. Precipitation during the monsoon cultivation season can negatively affect crop growth, for two reasons. Excessive or inadequate rain during the cropping season can hydraulically damage crops and cause crop loss in the CDZ of Myanmar [21]. Additionally, precipitation generally has a negative correlation with solar radiation, which can further reduce air temperature during the hot season [22]. Thus, excessive precipitation can inhibit crop growth meteorologically. Analysis using EVI showed similar results.
Figure 10 and Figure 11 depict the seasonal average NDVI and EVI for summer and monsoon cultivation, respectively. The regression line inside the irrigation district was computed using the average of all samples located inside the irrigation district, except for LRMC. In both summer and monsoon cultivations, the average VI values have an increasing trend, as confirmed via the peak analyses shown in Figure 6 and Figure 7. The differences between inside and outside of the irrigation district became more unclear with using average values than using peak values, because the “average” includes field information when paddy rice fields have no or little vegetation. In such periods, inside and outside conditions are similar, as shown in Figure 5.
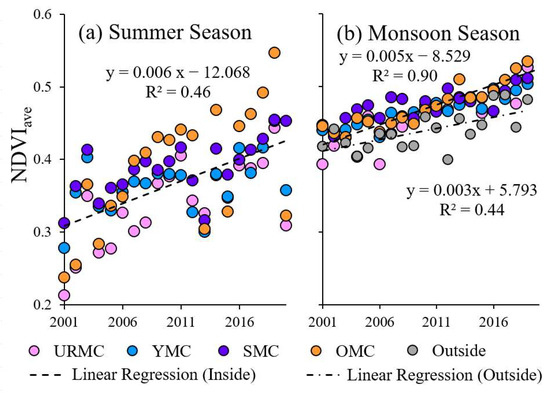
Figure 10.
Seasonal average NDVI for (a) summer and (b) monsoon by year.
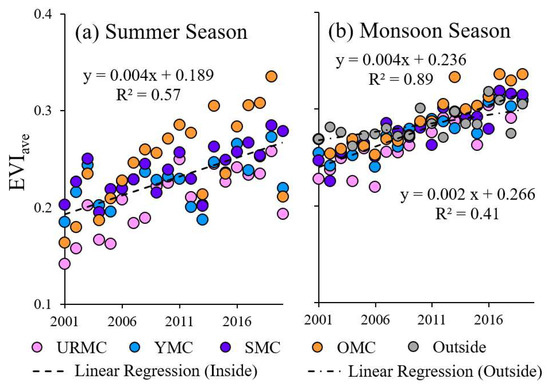
Figure 11.
Seasonal average EVI for (a) summer and (b) monsoon by year.
The impact of precipitation on crop growth was evaluated using seasonal average NDVI as an indicator. The results (Figure 12a for summer cultivation and Figure 12b for monsoon cultivation) were generally consistent with the analysis using peak NDVI (Figure 8 and Figure 9) in both seasons, although some deviations were obtained for an effective period of rainfall. This study adopted simple averages of NDVI from 22 March to 27 July (for summer cultivation) and from 28 July to 21 March (for monsoon cultivation). Johnson et al. [19] suggested that employing a cumulative VI value with setting a certain threshold on minimum VI value on accumulation effectively reflects the crop growth and the production, although the threshold values should be manually determined through an extra analysis. The results of this study implied that a simple average of VIs could reasonably capture the general trend and the circumstance of crop growth condition and the impact of precipitation, although peak VIs might be a superior indicator for distinguishing the crop growth of rice. For example, Figure 5 visually suggested that the rice was much more actively growing inside the irrigation district than outside. Such condition is better captured via seasonal peak VIs than seasonal average VIs.
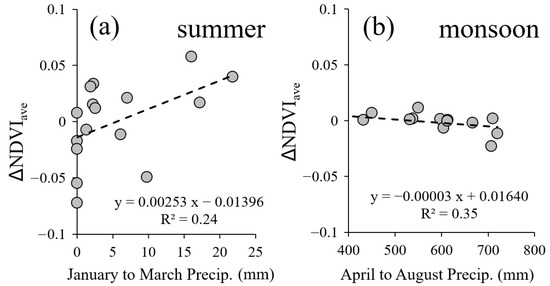
Figure 12.
The comparison between precipitation and NDVI difference for (a) summer and (b) monsoon cultivation seasons.
3.3. Characteristics of NDVI and EVI
Throughout the study, similar results were obtained for both NDVI and EVI. However, some minor differences were observed. Figure 13 depicts the relationship between NDVI and EVI for the sampled data used in this study. Data with negative values were rejected from plotting. The regression curve indicates that the relationship between NDVI and EVI is nearly constant (i.e., the curve is close to a straight line) for an NDVI range of 0.2–0.8. The regression curve slope was steeper than the general trend in the NDVI ranges of 0.0–0.2 and 0.8–1.0. These ranges correspond to sparsely and densely vegetated surfaces, where NDVI has structural weaknesses. In these regions, EVI was superior to NDVI. The NDVI “saturation” was verified by comparing Figure 6b and Figure 7b, wherein, a continuous strong improvement in crop growth during 2012–2020 is better described with EVI (Figure 7b) than NDVI (Figure 6b).
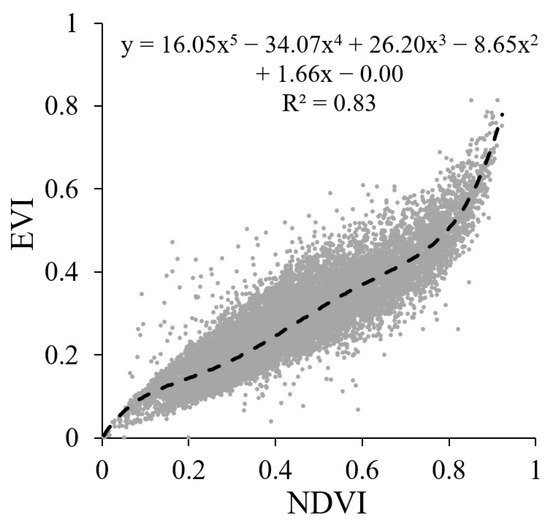
Figure 13.
Relationship between NDVI and EVI for sampled data used in this study.
In addition to the general relationship between NDVI and EVI, as represented by the regression curve in Figure 13, a vast range of scattering is verified in Figure 13 in the moderate NDVI range (0.2 < NDVI < 0.8). The vast range of scattering was likely derived from differences in the input data. While NDVI uses red and near-infrared reflectance, EVI used blue reflectance, in addition to red and near-infrared reflectance. MODIS observed red and near-infrared reflectance with a 250 m spatial resolution (at the nadir sensor angle), but 500 m for blue reflectance. Therefore, the 250 m EVI product partially used coarser resolution information, and NDVI is superior to EVI in terms of spatial resolution. Although no other study has found that the pixel allocation system is an issue of NDVI vs. EVI disagreement, the mixture of two types of resolution bands can accentuate the spatial resolution degradation. MODIS derives pixel information from the observation signal range twice as long as the pixel size, and the pixels of different observation resolutions are aligned not at the edge but at the center of the pixels in the along-scan direction [23], as illustrated in Figure 14. For example, a 500 m blue-band information used for 250 m EVI pixels (e.g. green colored 250 m pixel in Figure 14) may contain information from a 1500 m (along-scan, indicated as green arrow in Figure 14) by 500 m (along-track) area, even at the nadir observation where the spatial resolution is the maximum, which may appear as a large scatter in Figure 13. In the study area, where each field size is small, the impact of the resolution difference can be the largest in the moderate NDVI range, which corresponds to the crop growing and crop senescence seasons, when the surface condition tends to vary field by field. In the moderate NDVI range, 250 m NDVI might be sprier than 250 m EVI when a fine spatial resolution is important.
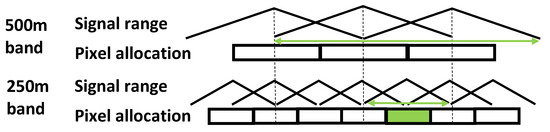
Figure 14.
Signal ranges and the nominal pixel allocations of MODIS 250 and 500 m bands at nadir sensor angle.
4. Conclusions
Throughout this study, agricultural practices in the Thapanzeik Dam irrigation district were successfully illustrated using MODIS NDVI and EVI, with limited use of in situ measurement data. MODIS VIs demonstrated two peaks in a year, indicating that the district practiced double-cropping once in the summer and once in the following monsoon. Both in summer and monsoon cultivations, crop growth was constantly improving for 20 years from 2001 to 2020, which might reflect the rapid agricultural mechanization achieved in this region. Fields outside the district had a much lower ratio of improvement. Within the irrigation district, the RMC system command fields demonstrated relatively weak crop growth in the upstream area and significantly weak growth that was nearly equivalent to no irrigation in the downstream area. Refinements or further improvement of the RMC system or more water resources that can be distributed to the canal system might be required. The impact of precipitation on crop growth was evaluated using in situ precipitation data. The results demonstrated an opposite effect of precipitation on crop growth in summer and monsoon. While precipitation promotes crop growth during summer cultivation, it prevents crop growth during monsoon cultivation. The results indicated that water was one of the limiting factors in summer cultivation in the irrigation district, and that precipitation provides favorable conditions for crop growth. However, water is not a limiting factor in monsoon cultivation. Rather, extra precipitation, hydraulically and meteorologically, negatively affects crop growth.
Essentially, NDVI and EVI can derive similar results for crop growth monitoring in the irrigation district. As a minor difference, EVI was superior to NDVI when the field had densely vegetated active crops, as reported in several other studies. A relatively large, random-type scatter was verified in the relationship between NDVI and EVI at a moderate NDVI range (0.2 < NDVI < 0.8), which should be derived from the difference in input data for the two VIs. Considering the structure of the signal ranges and the regulation of pixel allocation in the MODIS sensor, the scatter potentially indicates a spatial resolution degradation in 250 m EVI, which might be an advantage of using NDVI in moderately vegetated surfaces. This study demonstrates that MODIS VIs are convenient tools for monitoring agricultural practices and the crop growth of irrigated paddy rice using limited ground data. The type of optimum VI to be used depends on the purpose of monitoring and the circumstances of the target area. EVI is superior when the differences in crop conditions at densely vegetated surfaces are important. NDVI might be superior when spatial resolution is important, such as for inhomogeneous surfaces.
Author Contributions
Conceptualization, T.E. and M.T.; methodology, T.E. and M.T.; formal analysis, T.E. and M.T.; investigation, T.E.; data curation, T.E.; writing—original draft preparation, T.E. and M.T.; writing—review and editing, M.T.; visualization, M.T. All authors have read and agreed to the published version of the manuscript.
Funding
This research received no external funding.
Institutional Review Board Statement
Not applicable.
Data Availability Statement
Not applicable.
Acknowledgments
Precipitation and the canals/irrigation district boundary information used in this study are attributed to the Japan International Cooperation Agency.
Conflicts of Interest
The authors declare no conflict of interest.
References
- Tasumi, M.; Hirakawa, K.; Hasegawa, N.; Nishiwaki, A.; Kimura, R. Application of MODIS Land Products to Assessment of Land Degradation of Alpine Rangeland in Northern India with Limited Ground-Based Information. Remote Sens. 2014, 6, 9260–9276. [Google Scholar] [CrossRef]
- Tucker, C.J. Red and photographic infrared linear combinations for monitoring vegetation. Remote Sens. Environ. 1979, 8, 127–150. [Google Scholar] [CrossRef]
- Wardlow, B.D.; Egbert, S.L. Large-area crop mapping using time-series MODIS 250 m NDVI data: An assessment for the U.S. Central Great Plains. Remote Sens. Environ. 2008, 112, 1096–1116. [Google Scholar] [CrossRef]
- Pervez, M.S.; Budde, M.; Rowland, J. Mapping irrigated areas in Afghanistan over the past decade using MODIS NDVI. Remote Sens. Environ. 2014, 149, 155–165. [Google Scholar] [CrossRef]
- French, A.N.; Hunsaker, D.J.; Sanchez, C.A.; Saber, M.; Gonzalez, J.R.; Anderson, R. Satellite-based NDVI crop coefficients and evapotranspiration with eddy covariance validation for multiple durum wheat fields in the US Southwest. Agric. Water Manag. 2020, 239, 106266. [Google Scholar] [CrossRef]
- Lai, Y.R.; Pringle, M.J.; Kopittke, P.M.; Menzies, N.W.; Orton, T.G.; Dang, Y.P. An empirical model for prediction of wheat yield, using time-integrated Landsat NDVI. Int. J. Appl. Earth Obs. Geoinf. 2018, 72, 99–108. [Google Scholar] [CrossRef]
- Panek, E.; Gozdowski, D. Analysis of relationship between cereal yield and NDVI for selected regions of Central Europe based on MODIS satellite data. Remote Sens. Appl. Soc. Environ. 2020, 17, 100286. [Google Scholar] [CrossRef]
- Son, N.T.; Chen, C.F.; Chen, C.R.; Minh, V.Q.; Trung, N.H. A comparative analysis of multitemporal MODIS EVI and NDVI data for large-scale rice yield estimation. Agric. For. Meteorol. 2014, 197, 52–64. [Google Scholar] [CrossRef]
- Huete, A.R. A Soil-Adjusted Vegetation Index (SAVI). Remote Sens. Environ. 1988, 25, 295–309. [Google Scholar] [CrossRef]
- Huete, A.; Didan, K.; Miura, T.; Rodriguez, E.P.; Gao, X.; Ferreira, L.G. Overview of the radiometric and biophysical performance of the MODIS vegetation indices. Remote Sens. Environ. 2002, 83, 195–213. [Google Scholar] [CrossRef]
- Bolton, D.K.; Friedl, M.A. Forecasting crop yield using remotely sensed vegetation indices and crop phenology metrics. Agric. For. Meteorol. 2013, 173, 74–84. [Google Scholar] [CrossRef]
- de Souza, C.H.W.; Mercante, E.; Johann, J.A.; Lamparelli, R.A.C.; Uribe-Opazo, M.A. Mapping and discrimination of soya bean and corn crops using spectro-temporal profiles of vegetation indices. Int. J. Remote Sens. 2015, 36, 1809–1824. [Google Scholar] [CrossRef]
- Petersen, L.K. Real-Time Prediction of Crop Yields From MODIS Relative Vegetation Health: A Continent-Wide Analysis of Africa. Remote Sens. 2018, 10, 1726. [Google Scholar] [CrossRef]
- JICA; SCI. Preparatory Survey on Agriculture Income Improvement Project in the Republic of the Union of Myanmar Final Report; Japan International Cooperation Agency and Sanyu Consultants Inc.: Tokyo, Japan, 2018; 414p, Available online: https://libopac.jica.go.jp/images/report/12306882.pdf (accessed on 28 December 2022).
- Didan, K.; Munoz, A.B. MODIS Vegetation Index User’s Guide (MOD13 Series); Vegetation Index and Phenology Lab, The University of Arizona: Tucson, AZ, USA, 2019. Available online: https://lpdaac.usgs.gov/documents/621/MOD13_User_Guide_V61.pdf (accessed on 28 December 2022).
- Wali, E.; Tasumi, M.; Moriyama, M. Combination of Linear Regression Lines to Understand the Response of Sentinel-1 Dual Polarization SAR Data with Crop Phenology-Case Study in Miyazaki, Japan. Remote Sens. 2000, 12, 189. [Google Scholar] [CrossRef]
- Huete, A.; Justice, C.; van Leeuwen, W. MODIS Vegetation Index (MOD 13) Algorithm Theoretical Basis Document Version 3, 1999, Online Document. Available online: https://modis.gsfc.nasa.gov/data/atbd/atbd_mod13.pdf (accessed on 28 December 2022).
- Ajith, K.; Geethalakshmi, V.; Ragunath, K.P.; Pazhanivelan, S.; Dheebakaran, G. Rice Yield Prediction Using MODIS-NDVI (MOD13Q1) and Land Based Observations. Int. J. Curr. Microbiol. App. Sci. 2017, 6, 2277–2293. [Google Scholar] [CrossRef]
- Johnson, D.M.; Rosales, A.; Mueller, R.; Reynolds, C.; Frantz, R.; Anyamba, A.; Pak, E.; Tucker, C. USA Crop Yield Estimation with MODIS NDVI: Are Remotely Sensed Models Better than Simple Trend Analyses? Remote Sens. 2021, 13, 4227. [Google Scholar] [CrossRef]
- Panek, E.; Gozdowski, D. Relationship between MODIS Derived NDVI and Yield of Cereals for Selected European Countries. Agronomy 2021, 11, 340. [Google Scholar] [CrossRef]
- Belton, B.; Win, M.T.; Zhang, X.; Filipski, M. The rapid rise of agricultural mechanization in Myanmar. Food Policy 2021, 101, 102095. [Google Scholar] [CrossRef]
- Nakata, T.; Tasumi, M.; Mitsuda, Y. Relationships among solar radiation, temperature, precipitation, and cloud cover in Kyushu and Okinawa. J. Rainwater Catchment Syst. 2023. in printing. [Google Scholar]
- Nishihama, M.; Wolfe, R.; Solomon, D.; Patt, F.; Blanchette, J.; Fleig, A.; Masuoka, E. MODIS Level 1A Earth Location: Algorithm Theoretical Basis Document Version 3.0. SDST-092; NASA Goddard Space Flight Centre: Greenbelt, MD, USA, 1997; 147p. [Google Scholar]


Disclaimer/Publisher’s Note: The statements, opinions and data contained in all publications are solely those of the individual author(s) and contributor(s) and not of MDPI and/or the editor(s). MDPI and/or the editor(s) disclaim responsibility for any injury to people or property resulting from any ideas, methods, instructions or products referred to in the content. |
© 2023 by the authors. Licensee MDPI, Basel, Switzerland. This article is an open access article distributed under the terms and conditions of the Creative Commons Attribution (CC BY) license (https://creativecommons.org/licenses/by/4.0/).