Abstract
In humid climates, waterlogging from excessive rainfalls can be a major limiting factor for soybean production, particularly during the reproductive stage. However, there is a limited understanding of how soybean growth and physiology respond to waterlogging during this critical stage. Here, we investigated the effects of waterlogging and subsequent reoxygenation on the growth, physiology, yields, and leaf hyperspectral reflectance traits of the soybean cultivar ‘Asgrow AG5332’. The crop was grown to stage R1 (initial flowering) in outdoor pot culture conditions, and then waterlogged for 16 days. The flooded pots were drained and continuously monitored for recovery for an additional 16 days. The results showed that soil oxygen levels declined rapidly to zero in about 5 days after waterlogging, and slowly recovered in about 5–16 days. However, it did not reach the same level as the control plants, which maintained an oxygen concentration of 18%. Increasing waterlogging duration negatively affected leaf chlorophyll index, water potential, and stomatal conductance, with a consequent decline in the photosynthetic rate. Further, decreased photosynthetic rate, leaf area, and mineral nutrients resulted in lower biomass and seed yield. Pod dry weight and leaf number were the most and least sensitive parameters, respectively, decreasing by 81% and 15% after 16 days of waterlogging. Waterlogged plants also had higher reflectance in the PAR, blue, green, and red regions, and lower reflectance in the near-infrared, tissue, and water band regions, indicating changes in chemistry and pigment content. The current study reveals that the soybean crop is susceptible to waterlogging during the reproductive stage, due to poor recovery of soil oxygen levels and physiological parameters. Understanding and integrating the growth, physiology, and hyperspectral reflectance data from this study could be used to develop improved cultivars to ensure the stability of soybean production in waterlogging-prone areas.
Keywords:
soybean; biomass; leaf gas exchange; photosynthesis; leaf reflectance; nutrient deficiency; hypoxia; recovery 1. Introduction
Soybean [Glycine max (L.) Merr.] is one of the essential food legumes, accounting for 65% of the global protein supply [1]. It has been extensively grown worldwide, with an estimated production of 353.35 million tonnes, and a total harvest area of 1.27 million km2 [2]. Soybeans significantly impact the sustainability of the U.S. agricultural economy, second only to corn [3]. Previous studies have established the nutritional and health benefits of soybeans in terms of proteins, minerals, fiber, fats, vitamins, and other elements essential to good health [4,5]. They also contain immunogenic components, such as isoflavones, which have anticancer properties [6,7]. In the U.S., soybeans are adapted to various soil and environmental conditions due to their agronomic plasticity, high yield potential, and economic value [8,9]. However, soybean growth and development are hampered by periodic waterlogging at all developmental growth stages [10,11]. Waterlogging has been ranked second after drought, causing over 50% yield reduction in soybeans [11]. The geospatial data collected by the United States Department of Agriculture show the mid-southern U.S. as an above average flood-prone soybean production area [12]. Moreover, with rapid climate change, heavy precipitation events are projected to increase by about 7% for every 1 °C increase in global warming, leading to increased flood hazard severity (high confidence) [13]. Therefore, there is a growing need to understand how soybeans respond to waterlogging, to prevent or reduce its impact on crop productivity and yield.
Soil waterlogging rapidly depletes oxygen levels in the soil by causing gas exchange 104 times slower in waterlogged soil than in well-drained soil [14,15]. Consequently, waterlogged soil’s redox potential decreases significantly [16], resulting in hypoxia or anoxia, adversely affecting plant growth and development [17]. Under hypoxic or anoxic conditions, plant root metabolism changes from aerobic to anaerobic respiration, producing insufficient plant energy [18]. Thus, a flood-impaired root system alters leaf physiology, including chlorophyll concentration, stomatal conductance (gs), transpiration rate (E), net photosynthetic rate (Pn), and plant growth and development, and ultimately leads to reduced crop yields [19,20,21]. In addition, waterlogging can lead to increased CO2 concentrations in the plant root zone, and decreased hydraulic conductance, resulting in the rapid closure of stomata [22]. Previous studies have reported that poor pod formation, reduced seed yield, and plant mortality are the damaging effects of chlorophyll degradation and stomatal closure when soybeans are flooded [10,20,23]. Waterlogging-tolerant soybeans can exhibit specific adaptations, such as aerenchyma formation and adventitious roots [24,25]. Therefore, unraveling the mechanistic responses that lead to waterlogging tolerance in soybean is critical to helping current breeding programs aimed at integrating waterlogging tolerance with improved yield.
Waterlogging stress has been revealed to significantly reduce seed yield by 40–80% in soybeans, depending on the growth stage, cultivar, waterlogging duration, and depth [11,26,27]. A recent quantitative review of 54 studies on the effects of soil waterlogging on soybeans at different developmental stages revealed that soybeans are most sensitive to waterlogging in the early reproductive stages (R1-R3) [11]. They also suggested that waterlogging events, after flowering, could alter pod formation and seed development by accelerating leaf senescence and nitrogen deficiency. Nitrogen deficiency in soybean leaves can be explained by the loss of 35–50% chlorophyll pigment when subjected to waterlogging, which slows the plant’s recovery after waterlogging [11,28]. The ability of waterlogged plants to recover when soil growth conditions are drained is also critical for yield. Therefore, studying the response of soybean during waterlogging and reoxygenation can be an effective technique for selecting tolerant cultivars for yield during the reproductive stage. This study is the first to quantify waterlogging effects of soybean during the reproductive stage and, along with soil O2 concentrations, could be used to develop functional algorithms.
Remote sensing has been used to develop indicators of crop growth, nutrient status, and yield development [29]. Remote sensing plays a significant role in monitoring various changes in the climate and physical environment, and assessing the biodiversity large areas. It is also used in monitoring threats to various components of natural systems. The most primitive applications of local remote sensing in forestry and agriculture have shown that chlorophyll in plants has a distinct, readily detectable spectral signature in the visible and near-infrared portions of the electromagnetic spectrum [30]. Previous studies have shown that crop spectral reflectance can be used to estimate plant growth and physiology [29], assess plant nutrient status [31], detect environmental stresses [32], and predict crop yields [33]. However, leaf spectral reflectance properties have not been explored when assessing soybean responses to waterlogging, emphasizing the importance of applying remote sensing to detect waterlogging tolerance in soybeans.
In mid-southern Mississippi, continuous rainfall due to climate change has led to waterlogging and soil inundation, which has left soybeans flooded for days or weeks, under the current management practices. However, recent research lacks studies exploring the quantitative relationship between soybean reproductive growth and development in response to waterlogging and recovery. Hence, this experiment subjected soybean plants to 16 days of waterlogging and recovery at the R1 growth stage. This study aimed to (1) quantify the response of soybean growth and development to waterlogging stress at the reproductive stage, (2) monitor the recovery process from stress-induced damages or variations in soybean plants based on remote sensing data, and (3) evaluate the physiological responses and changes in metabolism, chemical composition, and mineral concentration of waterlogged soybean plants. We hypothesized that: (1.) waterlogging exposure to soybean during the R1 stage would reduce crop yield and nutritional quality, and (2.) remote sensing and hyperspectral reflectance could be used to identify and quantify flood damage to the exposed soybean plants.
2. Materials and Methods
2.1. Growth Conditions and Plant Materials
This study was conducted at the Rodney Foil Plant Science Research Center of Mississippi State University, USA, from 31 May to 18 August 2017. As part of the experiment, we grew the Asgrow AG5332 soybean cultivar in white PVC pots with a diameter of 42.6 cm and a height of 30.6 cm. The pots contained 500 g of gravel at the bottom and were filled with sandy loam soil (87% sand, 2% clay, and 11% silt) to a depth of 2.5 cm. Four soybean seeds were planted in each pot, and after 8 days, the seedlings were thinned to one plant per pot. The pots were kept under a hoop house to maintain consistent experimental conditions, avoiding external influences such as rainfall, transpiration, and temperature fluctuations. To simulate waterlogging treatment, the soil water level was held at 3 cm above the substrate. The pots were arranged in a randomized complete block design, with 15 plants per replication for each treatment.
2.2. Waterlogging Treatments
At 34 days after sowing (DAS) during the early flowering period (R1 stage), soybean plants were assigned to two experimental treatments: a control group and a waterlogging treatment group. Both groups were replicated 15 times and irrigated with a full-strength Hoagland nutrient solution, containing the required macronutrients and micronutrients for plant growth [34] for 34 days under optimal water conditions. Waterlogging treatment was imposed for 16 days, and then the waterlogged pots were drained and continuously monitored for recovery for the next 16 days. The irrigation system was designed to consist of a network of plastic pots and arrayed drippers to irrigate the seedlings. All of the plants were adequately irrigated thrice daily at 4 h intervals (8:00 am, 12.00 noon, and 4.00 pm). The average ambient air temperature during the experimental window was 27.6 ± 1.7 °C standard error of the mean (S.E.) and the average solar radiation was 20.64 ± 1.68 MJ m−2 d−1 S.E.
2.3. Physiological Measurements
Apogee SO-110 soil oxygen sensors (Apogee Instruments, Inc., Logan, UT, USA) were randomly implanted to continuously monitor soil oxygen concentrations throughout the experiment [35]. The canopy or leaf temperature of flooded and control plants was monitored throughout the experiment using a canopy thermometer [36]. The third trifoliate leaf from the top was removed and preserved in an ice-packed cooler to prevent loss of water content. A few minutes after detaching the leaf from the plant, pressures were read, and leaf water potential was determined using a pressure chamber (Plant Moisture Stress (PMS) Instrument, Corvallis, OR, USA).
Net photosynthesis rate (Pn), stomatal conductance (gs), leaf transpiration rate (E), the ratio of internal and external CO2 (Ci/Ca), and electron transport rate (ETR) were monitored during and after waterlogging for the next 16 days [37]. These physiological parameters were measured on the uppermost fully expanded leaf at intervals throughout the treatment period, using the open gas exchange system LI-6400 portable photosynthesis system (LI-COR Inc., Lincoln, NE, USA). Plants were harvested 66 days after sowing (DAS). The ratio between Pn and gs was used for calculating the intrinsic water use efficiency (WUE) [37].
After 16 days of treatment, a Dualex® scientific polyphenols (FORCE-A, Orsay, France) device was clipped onto the second most fully developed soybean leaf across treatments, to obtain the chlorophyll index in the mesophyll, flavonoids, anthocyanin in the epidermis, and nitrogen balance index (NBI) [35]. The NBI shows the plant’s nitrogen status by utilizing the proportion of chlorophyll and flavonoid units in its leaves. The chlorophyll was evaluated as the ratio of the leaf transmission of near-infrared and red wavelengths. The flavonoids and anthocyanin indices are based on measuring chlorophyll fluorescence, while the NBI is a ratio between chlorophyll and flavonoid indices [35].
2.4. Leaf Hyperspectral Reflectance
Leaf hyperspectral reflectance was measured on the leaves by an ASD field spectroradiometer (Analytical Spectral Devices Inc., Boulder, CO, USA), with a spectral range of 350–2500 nm and a 1 nm sampling interval [38]. The fully expanded main stem leaves were measured because of their association with the reflectance of critical leaf-blade, chlorophyll, and N concentrations [38]. A fiber-optic input socket and the contact reflectance probe with an internal light source were used to measure the leaf reflectance spectra. The reflectance was measured on the adaxial side of the leaves and placed on top of a black polyurethane background. The reflectance of the ASD instrument was set to 100% by measuring the spectral reflectance on the reference panel. The white reference (reference panel) was measured at 5 min intervals to ensure instrument constancy for 100% reflectance. The leaf was placed between the light probe and the nonreflective polyurethane black body to measure the reflectance. This confirmed that no extra light penetrated the sensor during these measurements. The reflectance values were averaged in the spectral regions 400–700 (photosynthetically active radiation; PAR), 400–520 (blue), 520–600 (green), 630–690 (red), 760–900 (near-infrared), 900–1350 (tissue reflectance), and 1600–1850 nm (water band).
2.5. Growth and Reproduction Measurements
After 16 days of waterlogging treatment, and 16 days of draining the flooded pots, morphological parameters such as plant height, node numbers, pod numbers, and leaf area were determined on 15 plants in each treatment. At the final harvest, leaf areas were measured using the LI-3100 leaf area meter (LI-COR, Inc., Lincoln, NE, USA) [35]. The distance between the main stem apex and the substrate surface was measured as the plant height increased. The soybean plants were divided into shoot and root, and the root-to-shoot ratio was calculated upon harvesting. The plant leaves, stems, roots, and pods were dried in a forced air agronomy drier at 75 °C for 48 h, and the dry weights were then estimated and expressed in g plant−1. Pod production efficiency was assessed as the dry weight of the pod per total plant dry weight (g kg−1).
2.6. Nutrients Analysis
The dried and ground soybean samples were used to determine the concentration of minerals and nutrients in the leaf tissue using the method outlined by Nelson and Sommers [36]. Four replications of each treatment were collected for mineral analysis. For N concentration, 0.2 g of dried soybean samples were digested with H2SO4, following the standard Kjeldhal protocol [39], using an automatic nitrogen distillation system. To estimate other elements, 0.1 g of dried samples were digested with HNO3 and HClO4. The digest was filtered, and deionized water was added to make the final volume 50 mL. Mg, Mn, Cu, Zn, and Fe concentrations were measured using an atomic absorption spectrophotometer, while Ca and K concentration was determined by a flame photometer. The P concentration was measured using a UV–vis spectrophotometer at a wavelength of 690 nm. The concentrations of N, P, K, Ca, and Mg in the leaf samples were expressed as a percentage (%), and the concentrations of Fe, Mn, Zn, Cu, and Bo were expressed as parts per million (ppm). The transport and accumulation of nutrients in ground samples were expressed in µmol g−1 dry weight units.
2.7. Statistical Analysis
The study followed a completely randomized design, and data were analyzed using the SAS statistical procedure PROC ANOVA and Fisher LSD test at p < 0.05 [40]. Standard errors (mean ± S.E.) of three replications were calculated, with each replication being a mean of 15 plants from each treatment, including control and flooded. Graphs were plotted using Sigma Plot 13.0 to present the waterlogging and recovery phases of the treatments. The percentage difference between the treatments during days of waterlogging (DOW) and recovery (DOR) was calculated for growth, canopy temperature, physiological parameters, and nutrient concentration, using the formula below:
3. Results
3.1. Soil Oxygen Concentration
The results of this study demonstrate a significant decline in soil oxygen concentration in response to waterlogging treatment. Analysis of the data revealed that oxygen depletion occurred in four distinct phases. During the first phase, referred to as hypoxia, oxygen levels decreased gradually at a rate of 3.55% day−1, r2 = 0.96. It took 4.4 days for the levels to stabilize (second phase). During the second phase, oxygen levels reached complete anoxia (zero concentration) at a rate of 1.76% day−1, r2 = 0.73 (Figure 1). This level was sustained throughout the 16 days of the waterlogging treatment. Following the treatment, between 16 and 20 days (third phase), oxygen levels began to recover steadily at a rate of 0.23% day−1, r2 = 0.64, and gradually increased over the next 21–32 days. However, at the final stage, the waterlogged plants did not recover to the same level as the control, which maintained an average of 18% oxygen concentration throughout the experiment. These findings provide important insights into the dynamics of soil oxygen concentration during waterlogging, and highlight the potential impacts of waterlogging on soybean health and growth.
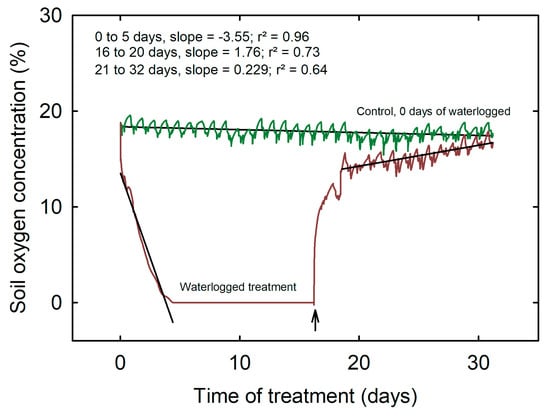
Figure 1.
Soil oxygen concentration across waterlogging and control treatments during the experimental period of 32 days. The arrow indicates the day that waterlogging treatment was stopped, and the recovery period started.
3.2. Leaf Gas Exchange Parameters
The present study investigated the impact of waterlogging treatment and duration on various leaf gas exchange parameters in soybean plants. The results showed that the interaction between waterlogging treatment and time significantly affected all of the measured parameters, except water use efficiency (Table 1).

Table 1.
Analysis of variation across the waterlogging treatment, the time during waterlogging treatment, and the interaction between treatment and time for soybean physiological traits at the reproductive stage.
The Pn of the waterlogged soybean plants decreased gradually over time, reaching an average of 18 µmol m−2 s−1, significantly lower than the average of 40 µmol m−2 s−1 maintained by the control plants over the 32 day treatment period (Figure 2A). This reduction in Pn was most pronounced after 16 days of waterlogging, where a 42% reduction was observed. However, following the cessation of the waterlogging treatment, the Pn of the plants rapidly recovered to 38 µmol m−2 s−1 within 2 days.
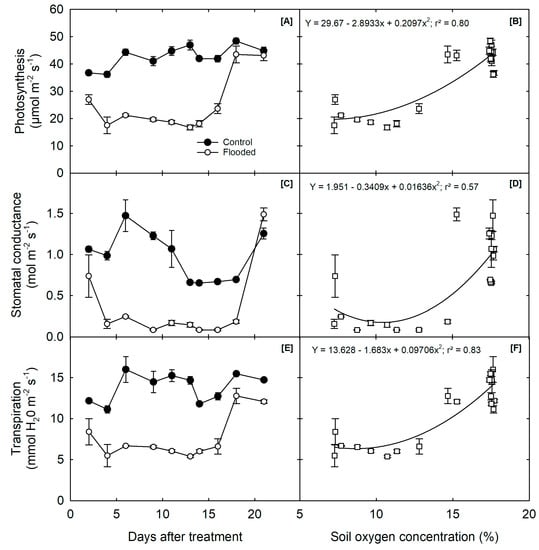
Figure 2.
Influence of waterlogging on soybean plants: (A) net photosynthetic rate (Pn), (C) stomatal conductance (gs), and (E) transpiration rate measured during the waterlogging treatment and (B) photosynthesis, (D) stomatal conductance, and (F) transpiration expressed as a function of soil oxygen concentration (%) using both the treatments data. The graph shows the day that waterlogging treatment stopped, and the recovery period started, at 16 days.
The gs of the waterlogged plants was also severely reduced compared to the control plants (0.98 mol m−2 s−1), reaching a low of 0.30 mol m−2 s−1 within 2 days of the treatment (Figure 2B). However, after the termination of the experiment, the stomatal conductance of the waterlogged plants recovered to the control level of 1.2 mol m−2 s−1 within 6 days, which suggests that the stress factor was alleviated.
Similarly, the E of the waterlogged soybean plants was significantly affected, with a 51% reduction compared to the control plants after 16 days of waterlogging (Figure 2C). The E of the waterlogged plants also decreased, but recovered rapidly within 2 days of draining, reaching an average of 12.4 mmol m−1. In contrast, the control plants had an average of 13.8 mmol m−1 throughout the 32 day treatment period. These results demonstrate the negative impact of waterlogging on soybean leaf gas exchange parameters, which could affect the growth and yield of the plants.
The average ETR of both control and waterlogged plants was 225 mol m−2 s−1, with a percentage decrease of 21.6% in waterlogged soybean compared to control. Specifically, waterlogged soybean plants showed an average ETR of 175 mol m−2 s−1 within the 16 days of waterlogging. Still, they recovered to almost control levels, with an average ETR of 224 mol m−2 s−1, within 2 days of flood termination. This recovery was observed despite the significantly reduced soil oxygen concentration (r2 = 0.62, Figure 3A).
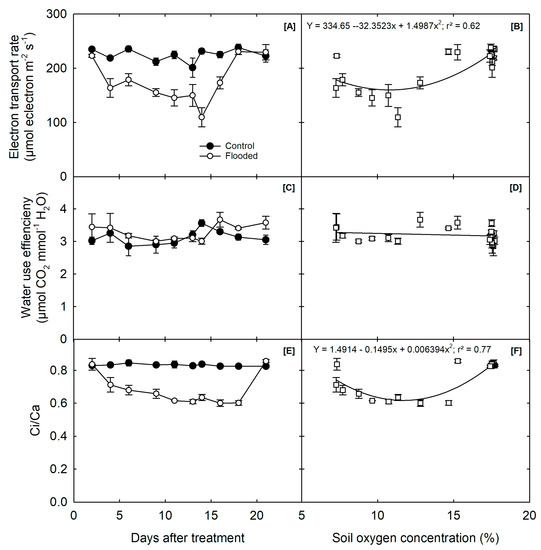
Figure 3.
Influence of waterlogging on soybean plants: (A) electron transport rate (ETR), (C) water use efficiency (WUE), (E) ratio of internal and external CO2 concentration (Ci/Ca) measured during the waterlogging treatment, and (B) photosynthesis, (D) water use efficiency, and (F) ratio of internal and external CO2 concentration (Ci/Ca) expressed as a function of soil oxygen concentration using both the treatments data. Each value is the mean of 15 measurements and S.E. (n = 15). The arrow indicates the day flood treatment stopped, and the recovery period started.
Furthermore, the analysis of variance (Table 1) showed that 16 days of waterlogging treatment slightly improved the WUE of soybeans, as observed by the Ci/Ca. Specifically, under the 16 days of waterlogging, the Ci/Ca for flooded plants gradually reduced from 0.83 to 0.6 mol−1, and recovered to almost normal levels observed in control plants (0.82 mol−1) within the next 4 days after the waterlogging treatment was stopped. This recovery was observed despite significantly reducing soil oxygen concentration (r2 = 0.77, Figure 3C).
3.3. Mineral and Nutrients Analysis
Waterlogging had a significant impact on several nutrient concentrations. Specifically, the 16 day waterlogging treatment reduced the concentration of N, Mg, and Ca by 16%, 25%, and 2%, respectively, compared to the control (Table 2). In contrast, P, K, Fe, Mn, Zn, Cu, and Bo concentrations significantly increased in flooded plants relative to control plants.
Table 2.
Nutrient concentration in flooded and control soybean plants at the reproductive stage in response to waterlogging treatment.
3.4. Leaf Temperature and Plant Pigments
The leaf chlorophyll index of waterlogged soybeans was reduced by 40% after 16 days of flooding, compared to the control plants (Figure 4A). The leaf temperature of waterlogged plants increased to 39 °C, significantly higher than the average temperature of 32 °C in control plants (Figure 4A). Furthermore, flood stress led to a decrease in the nitrogen and carbon concentrations in the leaf tissue. The average NBI of the flooded plants was 20 µg cm−2, compared to the control plants’ 38 µg cm−2, and did not return to normal levels after the flood treatment ended (Figure 4A).
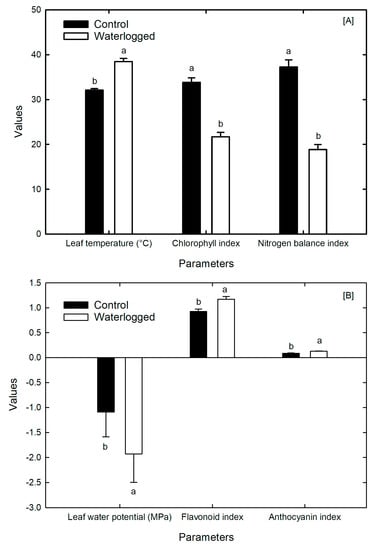
Figure 4.
Impact of waterlogging on soybean plants at the reproductive stage: (A) leaf temperature (°C), chlorophyll index, and nitrogen balance index. (B) Leaf water potential (MPa), flavanol index, and anthocyanin index in soybean plants at the reproductive stage: canopy temperature of the control and flooded plants during and after waterlogging. The standard error of mean = S.E. (n = 15). The lowercase letters indicate a significant difference at p < 0.05.
Waterlogging also created a nitrogen deficiency condition, increasing the flooded plants’ flavanol concentration. The leaf water potential in the control plants was −1.1 MPa, compared to approximately −2.0 MPa in the waterlogged plants. Although there was a negligible difference between the anthocyanin index of both control and flooded plants (Figure 4B), the flavanol index in waterlogged soybean plants was approximately 1.3 compared to 0.9 in control plants.
3.5. Growth, Development, and Biomass Components
The growth and yield parameters of soybean were significantly impacted by waterlogging (Table 3). The plant height and leaf area decreased by 21% and 70%, respectively. The leaf, stem, root, and pod dry weights were also reduced by 67%, 67%, 57%, and 80%, respectively, after 16 days of waterlogging (Table 3). The flooded plants had 79% fewer pods, and their pod production efficiency was reduced by 44% compared to the control plants. Furthermore, under waterlogged conditions, the dry matter was primarily allocated to the shoot, resulting in a 49% increase in shoot growth compared to root growth. Additionally, the ratio of pod number to total dry weight decreased by 34% due to waterlogging (Table 3).
Table 3.
Effects of waterlogging on soybean growth, development, and reproductive traits; measurements were taken 66 days after sowing. The lowercase letters indicate a significant difference at p < 0.05.
3.6. Remote Sensing Parameters
The spectral characteristics of soybean leaves were altered under waterlogged conditions, as shown by the changes in reflectance values in different regions of the hyperspectral curve (Figure 5). Even though, the patterns of reflectance showed similar trends between the control and waterlogged treatment, the peaks and valleys of the percent reflectance varied over the range of the reflectance spectral regions (Figure 5). These changes indicate alterations in the chemistry and pigment content of the leaves. The results provide insight into the relationships between photosynthesis, leaf tissue, and water status in soybean plants. Additionally, the three absorption spectra of water (1400–1500 nm, 1900–2000 nm, and 2450–2500 nm) were within the shortwave infrared region of the hyperspectral reflectance (Figure 6), which suggests that water content in the leaves can be detected using hyperspectral imaging techniques (Figure 6). Compared to control plants, waterlogged plants exhibited higher reflectance values of 6%, 4%, 9%, and 6% in the PAR, blue, green, and red regions, respectively, and lower reflectance values of 55%, 43%, and 28% in near-infrared, tissue, and water band regions, respectively (Figure 6).
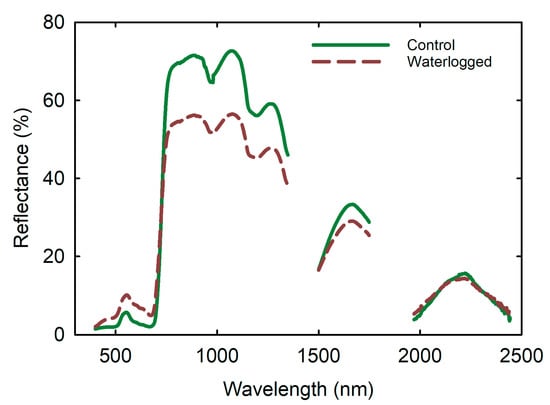
Figure 5.
Effects of waterlogging on soybean leaf reflectance. Data were mean of 15 replications measured from the top-most fully expanded leaf in each plant and expressed reflectance (%) over the wavelength (nm).
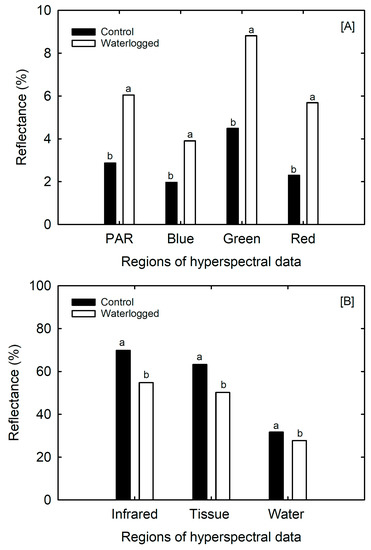
Figure 6.
Effect of waterlogging on regions of the hyperspectral curve of soybean leaf, (A) PAR = 400–700 nm, blue = 400–520 nm, green = 520–600 nm, and red = 630–690 nm) and (B), infrared = 760–900 nm, tissue = 900–1350 nm, and water = 1600–1850 nm, associated with leaf physiological characters. Data are mean ± S.E. (n = 15). The lowercase letters indicate a significant difference at p < 0.05.
The near-infrared region can penetrate deeply into the plant canopy, making it a helpful tool for estimating plant biomass. In healthy leaves, the absorption peaks at 450 and 670 nm, with high reflectance in the near-infrared range of 700–1200 nm [31]. As shown in Figure 5, these peaks correspond to blue and red light, and the magnitude of absorption is directly related to the amount of radiant energy the plant utilizes. The green region (500–600 nm) in Figure 6 corresponds to the upshot bar, which explains why most vegetation is perceived as green by the human eye. In the middle infrared region, the stressed plants exhibited less absorption in the chlorophyll and water bands, resulting in decreased reflection in the near-infrared (Figure 6).
The transition from low reflectance in the PAR, blue, green, and red regions, to high reflectance in the near-infrared, tissue, and water band regions observed in waterlogged soybean leaves is remarkable (Figure 6A,B). This shift, known as the “red edge,” is influenced by changes in chlorophyll content, leaf area index (LAI), biomass and hydro status, age, stress factor, and seasonal patterns [30]. The shortwave infrared region of the hyperspectral reflectance in Figure 6 includes the three absorption spectra of water (1400–1500 nm, 1900–2000 nm, and 2450–2500 nm).
4. Discussion
The impact of waterlogging on soybean growth and development has been studied extensively [10,23,27], but little is known regarding its effects during the early reproductive stage. To address this knowledge gap, we conducted a comprehensive study exploring various traits related to gas exchange, plant pigment, hyperspectral leaf reflectance, shoot and root growth, and yield in soybeans subjected to 16 days of waterlogging stress in the early reproductive stage. This study found that waterlogging during the early reproductive stage severely impacted soybean growth and development, resulting in yield reductions of over 50%. This reduction in yield can be attributed to a range of physiological changes, including reduced leaf photosynthesis, stomatal closure, root and shoot biomass inhibition, nutrient deficiencies, and leaf chlorosis, as reported by previous studies [11,27]. Additionally, this study evaluated the effect of waterlogging on soil oxygen concentration and soybean response after 16 days of recovery, which provides new insights into how waterlogging stress affects soybeans. The data from this study adds to our understanding of how waterlogging stress affects soybeans during the early reproductive stage and emphasizes the need for developing soybean cultivars with improved tolerance to waterlogging stress, to maintain yield potential in a high soil moisture environment.
The sensitivity of soybeans during the early reproductive stage (R1-R3) is attributed to the energy-demanding processes of rapidly developing reproductive structures, such as flowers, pods, and seeds [10,15,20]. In this study, waterlogging reduced the number of pods by 79%, and the pod production efficiency of flooded plants decreased by 44% compared to the control. The observed reductions in plant height, leaf area, and biomass further underscore the negative impact of waterlogging on soybean growth and development. These findings are consistent with previous studies that reported similar effects of waterlogging on soybean growth and yield [11,41,42], highlighting the need for effective management strategies in high soil moisture environments.
Soil oxygen concentrations drop rapidly during waterlogging, creating an energy-deficient environment for plant growth (Figure 1). Stomatal closure compensates for the drop in water absorption due to increased root resistance, to maintain leaf turgor during waterlogging [43]. Consequently, the gas exchange parameters, including gs and E, reduced sharply, with a corresponding decline in Pn as waterlogging duration increased. Past studies confirmed that oxygen deprivation is one of the major factors leading to stomatal closure and reduced photosynthesis in soybeans [15,44,45], suggesting that the extent of stomatal closure may strongly limit carbon assimilation.
This study also found that the plant system spontaneously responded to the recovery from waterlogging by reopening the stomata, which increased the diffusion of the external CO2. The reopening of apertures on the soybean leaf increases the internal and external CO2 transmission rate into the plant, restoring photosynthesis and the rate of transpiration [43,46]. The potassium concentration can influence the stomatal conductance of a plant. In this study, the K level in the leaf sample of a waterlogged soybean plant was slightly higher, 0.31%, compared to the control. During transpiration, water and minerals from the roots are transported to the leaves through the stem, and the water escapes to the atmosphere through guard cells [25,47]. In this study, flood-stressed plants developed an external root architecture that helped tap atmospheric oxygen and improve aerobic respiration at the root zone, as oxygen levels could not fully recover.
Limited access to soil oxygen due to waterlogging hampers root growth and functioning, which alters nutrients and water absorption from the root to the shoot [48]. Waterlogging drastically reduced nutrient uptake, especially nitrogen and magnesium (Table 2). When growth is inhibited due to various stress conditions or nutrient deficiencies, N deficiency and Mn toxicity can be caused by an anoxic condition in flooded soils, which promotes denitrification and produces Mn2+ available to plants [48]. Previous studies have reported that waterlogged soybeans are weakened and lack energy in the root zone, corresponding to reduced transport and absorption of plant minerals and water [45,49,50].
Nutrient deficiencies due to waterlogging can also adversely affect plant growth, metabolism, photosynthesis, and yield [11]. For example, 7 days of waterlogging resulted in poor pod formation and reduced seed yield due to reduced leaf N levels in soybeans [51]. The impairment of nitrate’s electrochemical gradient activity, due to soil hypoxia, is responsible for the decline in plant nitrogen status in flooded plants [18,47]. Moreover, the reduction in plant growth during waterlogging is often associated with a decrease in leaf N, leading to leaf chlorosis [50]. Thus, our current findings support previous studies reporting that N plays a critical role in waterlogging stress in soybean [51,52].
Several years of research have shown that polyphenols, especially flavonoids, are indicators of plant nitrogen status [35]. Under normal conditions, flavanols facilitate their primary metabolism and synthesis of proteins (nitrogen-containing molecules) containing chlorophyll, and a small amount of carbon-based secondary compounds [53]. In waterlogged conditions, in the case of N deficiency, the plants direct their metabolism towards increased production of flavonoids [53]. In this study, anthocyanins and flavanols increased under flood conditions, consistent with previous studies [35,54]. However, increasing the duration of waterlogging damaged soybean chlorophyll, and exacerbated it in the form of premature leaf senescence during the recovery period. Earlier studies showed that waterlogging compromised leaf chlorophyll content, limited nitrogen uptake, and reduced seed yield [20,46]. This study shows that reductions in the chlorophyll and nitrogen balance indices shifted plant metabolism to producing flavonoids and anthocyanins in flooded soybean plants.
In contrast to leaf N, waterlogging increased the concentrations of P, K, Fe, Zn, Cu, Mn, and Bo (Table 2), indicating minor effects. Similar results have been reported in previous studies on soybean, suggesting that waterlogging has little effect on P and K [51,52]. On the other hand, an increase in nutrient concentration may not necessarily benefit the plant, because it is caused by stress. High concentrations of certain nutrients, such as manganese, copper, etc., in the plant tissues, e.g., leaf or root, may be toxic [55]. Hence, it is suggested that waterlogging alters the magnitude of plant nutrients, which can be either positive or negative nutrient uptake.
Waterlogged plants’ leaf or canopy temperature increased drastically (Figure 4). Waterlogged plants are susceptible to high temperatures and nitrogen deficiency due to poor root development [56]. Flooded cotton plants showed higher foliage temperatures [57]. Hence, increased canopy temperature could measure soybean exposure to waterlogging in the field. Additionally, decreased nutrient uptake by roots, particularly nitrogen, could lead to lower chlorophyll content and reduced photosynthesis, further contributing to increased leaf temperature. These findings are consistent with previous studies that have reported similar effects of waterlogging stress on leaf temperature and photosynthesis [58,59].
The use of hyperspectral imaging techniques to assess the effects of waterlogging on plant physiology has been previously investigated in various studies. For example, Yang et al. [60,61] and Jiang et al. [62] found that waterlogging decreased chlorophyll content, biomass, leaf area index, and water content of winter wheat and maize plants, leading to changes in spectral reflectance in the visible and near-infrared region. In this study, waterlogging led to higher reflectance values in the PAR, blue, green, and red regions, and lower reflectance values in the near-infrared, tissue, and water band regions of soybean leaves (Figure 5). These changes in reflectance values can provide insights into the chemistry and pigment content of the leaves, photosynthesis, leaf tissue, and water status [63]. Furthermore, the decrease in reflectance in the chlorophyll and water bands in the middle infrared region suggests changes in leaf tissue and water content in the waterlogged soybean plants.
The red edge shift observed in the waterlogged soybean plants has been previously reported, and is influenced by various factors, including chlorophyll content, LAI, biomass, and hydro status [64,65]. The shift in reflectance values observed in the waterlogged soybean plants is related to changes in chlorophyll content, as seen in the reduction of the chlorophyll index in waterlogged plants (Figure 4A). Chlorophyll is responsible for absorbing light energy to initiate photosynthesis. Changes in chlorophyll content and pigment composition could explain the shift in reflectance values observed in the waterlogged soybean plants [66]. The ability to detect water content in plant leaves has significant implications for assessing plant water status, particularly in water-stressed agricultural regions. Overall, hyperspectral imaging techniques can provide a nondestructive and efficient means of monitoring plant health and growth.
5. Conclusions
Waterlogging has an adverse impact on soybean growth, reproduction, and productivity, primarily due to hypoxia and anoxia conditions that weaken the root system and reduce nutrient and water uptake. Waterlogging decreased nutrient uptake, especially nitrogen and magnesium, affecting plant growth, metabolism, photosynthesis, and yield. In addition, soil oxygen concentration decreased rapidly during waterlogging, leading to a drop in energy for plant growth, which resulted in the reduction of gas exchange parameters. The impact of waterlogging is particularly notable on root growth and leaf nitrogen concentration, which could serve as benchmarks to evaluate the effects of waterlogging on soybean. This study shows that potassium concentration and external root architecture could improve stomatal conductance and aerobic respiration at the root zone. Overall, this study provides new insights into how waterlogging stress affects soybeans during the early reproductive stage, and emphasizes the need for developing soybean cultivars with improved tolerance to waterlogging stress to maintain yield potential in high soil moisture environments. Developing such cultivars will be critical in ensuring food security in regions prone to flooding.
Moreover, integrating remote sensing techniques, such as hyperspectral imaging, with physiological and biochemical analyses can provide a more comprehensive understanding of the effects of waterlogging on plant growth and development. Hyperspectral imaging can detect and monitor the effects of waterlogging on plant physiology, indicating changes in photosynthesis, leaf tissue, water status, and pigment content. The use of remote sensing techniques, such as hyperspectral imaging, can be a valuable tool for assessing plant health under waterlogged conditions and for developing strategies to mitigate the effects of waterlogging on crop productivity.
Author Contributions
Conceptualization, K.R.R.; methodology, G.A.A., C.H.W., C.W. and K.R.R.; validation, G.A.A., F.A.A., S.R.K. and K.R.R.; formal analysis, G.A.A., C.H.W., F.A.A. and K.R.R.; investigation, G.A.A., C.H.W., C.W. and K.R.R.; resources, S.R.K. and K.R.R.; data curation, G.A.A., C.H.W. and C.W.; writing—original draft preparation, G.A.A., O.J.O. and K.R.R.; writing—review and editing, G.A.A., O.J.O., K.N.R. and K.R.R.; visualization, G.A.A. and K.R.R.; supervision, K.R.R.; project administration, K.R.R.; funding acquisition, K.N.R. and K.R.R. All authors have read and agreed to the published version of the manuscript.
Funding
The USDA NIFA 201934263 30552, MIS 043050, and Mississippi Soybean Promotion Board funded the research.
Institutional Review Board Statement
Not applicable.
Informed Consent Statement
Not applicable.
Data Availability Statement
The data supporting this study’s findings are available from the corresponding author upon reasonable request.
Acknowledgments
We thank David Brand for the technical assistance, and graduate students at the Environmental Plant Physiology Laboratory for their help during the data collection.
Conflicts of Interest
The authors declare no conflict of interest.
References
- Liu, K. Chemistry and nutritional value of soybean components. In Soybeans: Chemistry, Technology, and Utilization; Liu, K., Ed.; Springer US: Boston, MA, USA, 1997; pp. 25–113. ISBN 978-1-4615-1763-4. [Google Scholar]
- FAO. FAOSTAT Database. Available online: https://www.fao.org/faostat/en/#data/QCL (accessed on 31 May 2022).
- Council for Agricultural Science and Technology. Sustainability of U.S. Soybean Production: Conventional, Transgenic, and Organic Production Systems; Council for Agricultural Science and Technology: Ames, IA, USA, 2009; ISBN 978-1-887383-32-5. [Google Scholar]
- Van Ee, J.H. Soy constituents: Modes of action in low-density lipoprotein management. Nutr. Rev. 2009, 67, 222–234. [Google Scholar] [CrossRef]
- Shea, M.K.; Booth, S.L. Update on the role of vitamin K in skeletal health. Nutr. Rev. 2008, 66, 549–557. [Google Scholar] [CrossRef]
- Franke, A.A.; Custer, L.J.; Wang, W.; Shi, C.Y. HPLC Analysis of Isoflavonoids and Other Phenolic Agents from Foods and from Human Fluids. Proc. Soc. Exp. Boil. Med. 1998, 217, 263–273. [Google Scholar] [CrossRef]
- De Mejia, E.G.; Bradford, T.; Hasler, C. The anticarcinogenic potential of soybean lectin and lunasin. Nutr. Rev. 2003, 61, 239–246. [Google Scholar] [CrossRef]
- Bandillo, N.B.; Anderson, J.E.; Kantar, M.B.; Stupar, R.M.; Specht, J.E.; Graef, G.L.; Lorenz, A.J. Dissecting the Genetic Basis of Local Adaptation in Soybean. Sci. Rep. 2017, 7, 17195. [Google Scholar] [CrossRef]
- Zachary Shea Soybean Production, Versatility, and Improvement. In Legume Crops; Singer, W.M., Ed.; IntechOpen: Rijeka, Croatia, 2020; p. Ch. 3. ISBN 978-1-83968-274-2. [Google Scholar]
- Linkemer, G.; Board, J.E.; Musgrave, M.E. Water logging effects on growth and yield components in late planted soybean. Crop Sci. 1998, 38, 1576–1584. [Google Scholar] [CrossRef] [PubMed]
- Ploschuk, R.A.; Miralles, D.J.; Striker, G.G. A quantitative review of soybean responses to waterlogging: Agronomical, morpho-physiological and anatomical traits of tolerance. Plant Soil 2022, 475, 237–252. [Google Scholar] [CrossRef]
- USDA United States Department of Agriculture (USDA), National Agricultural Statistics Services. Available online: https://www.nass.usda.gov/Publications/AgCensus/2012/Online_Resources/Ag_Census_Web_Maps/Data_download/index.php/ (accessed on 4 April 2023).
- Pörtner, H.-O.; Roberts, D.C.; Adams, H.; Adelekan, I.; Adler, C.; Adrian, R.; Aldunce, P.; Ali, E.; Ara Begum, R.; Bednar-Friedl, B.; et al. IPCC, 2022: Climate Change 2022: Impacts, Adaptation, and Vulnerability: Contribution of Working Group II to the Sixth Assessment Report of the Intergovernmental Panel on Climate Change; Pörtner, H.-O., Roberts, D.C., Tignor, M., Poloczanska, E.S., Mintenbeck, K., Alegría, A., Craig, M., Langsdorf, S., Löschke, S., Möller, V., et al., Eds.; Cambridge University Press: Cambridge, UK, 2022. [Google Scholar]
- Armstrong, W. Aeration in Higher Plants. In Advances in Botanical Research; Woolhouse, H.W., Ed.; Academic Press: Cambridge, MA, USA, 1980; Volume 7, pp. 225–332. ISBN 0065-2296. [Google Scholar]
- Ploschuk, R.A.; Miralles, D.J.; Colmer, T.D.; Ploschuk, E.L.; Striker, G.G. Waterlogging of Winter Crops at Early and Late Stages: Impacts on Leaf Physiology, Growth and Yield. Front. Plant Sci. 2018, 9, 1863. [Google Scholar] [CrossRef]
- Ponnamperuma, F.N. The chemistry of submerged soils. In Advances in Agronomy; Brady, N.C., Ed.; Academic Press: Cambridge, MA, USA, 1972; Volume 24, pp. 29–96. ISBN 0065-2113. [Google Scholar]
- Shaw, R.E.; Meyer, W.S.; McNeill, A.; Tyerman, S.D. Waterlogging in Australian agricultural landscapes: A review of plant responses and crop models. Crop. Pasture Sci. 2013, 64, 549–562. [Google Scholar] [CrossRef]
- Gibbs, J.; Greenway, H. Review: Mechanisms of anoxia tolerance in plants. I. Growth, survival and anaerobic catabolism. Funct. Plant Biol. 2003, 30, 1–47. [Google Scholar] [CrossRef] [PubMed]
- Sairam, R.K.; Kumutha, D.; Ezhilmathi, K.; Chinnusamy, V.; Meena, R.C. Waterlogging induced oxidative stress and antioxidant enzyme activities in pigeon pea. Biol. Plant. 2009, 53, 493–504. [Google Scholar] [CrossRef]
- Garcia, N.; Da-Silva, C.J.; Cocco, K.L.T.; Pomagualli, D.; de Oliveira, F.K.; da Silva, J.V.L.; de Oliveira, A.C.B.; Amarante, L.D. Waterlogging tolerance of five soybean genotypes through different physiological and biochemical mechanisms. Environ. Exp. Bot. 2020, 172, 103975. [Google Scholar] [CrossRef]
- Malik, A.I.; Ailewe, T.I.; Erskine, W. Tolerance of three grain legume species to transient waterlogging. AoB Plants 2015, 7, plv040. [Google Scholar] [CrossRef] [PubMed]
- Araki, H.; Hamada, A.; Hossain, M.A.; Takahashi, T. Waterlogging at jointing and/or after anthesis in wheat induces early leaf senescence and impairs grain filling. Field Crop. Res. 2012, 137, 27–36. [Google Scholar] [CrossRef]
- Kaur, G.; Zurweller, B.A.; Nelson, K.A.; Motavalli, P.P.; Dudenhoeffer, C.J. Soil Waterlogging and Nitrogen Fertilizer Management Effects on Corn and Soybean Yields. Agron. J. 2017, 109, 97–106. [Google Scholar] [CrossRef]
- Yamauchi, T.; Colmer, T.D.; Pedersen, O.; Nakazono, M. Regulation of Root Traits for Internal Aeration and Tolerance to Soil Waterlogging-Flooding Stress. Plant Physiol. 2017, 176, 1118–1130. [Google Scholar] [CrossRef]
- Thomas, A.L.; Carmello-Guerreiro, S.M.; Sodek, L. Aerenchyma Formation and Recovery from Hypoxia of the Flooded Root System of Nodulated Soybean. Ann. Bot. 2005, 96, 1191–1198. [Google Scholar] [CrossRef]
- Scott, H.D.; DeAngulo, J.; Daniels, M.B.; Wood, L.S. Flood Duration Effects on Soybean Growth and Yield. Agron. J. 1989, 81, 631–636. [Google Scholar] [CrossRef]
- Rhine, M.D.; Stevens, G.; Shannon, G.; Wrather, A.; Sleper, D. Yield and nutritional responses to waterlogging of soybean cultivars. Irrig. Sci. 2010, 28, 135–142. [Google Scholar] [CrossRef]
- Kim, K.H.; Cho, M.J.; Kim, J.-M.; Lee, T.; Heo, J.H.; Jeong, J.Y.; Lee, J.; Moon, J.-K.; Kang, S. Growth Response and Developing Simple Test Method for Waterlogging Stress Tolerance in Soybean. J. Crop. Sci. Biotechnol. 2019, 22, 371–378. [Google Scholar] [CrossRef]
- Zhao, D.; Reddy, K.R.; Kakani, V.G.; Read, J.J.; Carter, G.A. Corn (Zea mays L.) growth, leaf pigment concentration, photosynthesis and leaf hyperspectral reflectance properties as affected by nitrogen supply. Plant Soil 2003, 257, 205–218. [Google Scholar] [CrossRef]
- Purkis, S.J.; Klema, V.V. Remote Sensing and Global Environmental Change; John Wiley & Sons: Hoboken, NJ, USA, 2011; ISBN 1444340255. [Google Scholar]
- Zhao, D.; Reddy, K.R.; Kakani, V.G.; Read, J.J.; Koti, S. Selection of Optimum Reflectance Ratios for Estimating Leaf Nitrogen and Chlorophyll Concentrations of Field-Grown Cotton. Agron. J. 2005, 97, 89–98. [Google Scholar] [CrossRef]
- Wijewardana, C.; Alsajri, F.A.; Irby, J.T.; Krutz, L.J.; Golden, B.; Henry, W.B.; Gao, W.; Reddy, K.R. Physiological assessment of water deficit in soybean using midday leaf water potential and spectral features. J. Plant Interactions 2019, 14, 533–543. [Google Scholar] [CrossRef]
- Plant, R.E.; Munk, D.S.; Roberts, B.R.; Vargas, R.N.; Travis, R.L.; Rains, D.W.; Hutmacher, R.B. Application of remote sensing to strategic questions in cotton management and research. J. Cotton. Sci. 2001, 5, 30–41. [Google Scholar]
- Hoagland, D.R.; Arnon, D.I. The water-culture method for growing plants without soil. Circ. Calif. Agric. Exp. 1950, 347, 32. [Google Scholar]
- Walne, C.H.; Reddy, K.R. Developing Functional Relationships between Soil Waterlogging and Corn Shoot and Root Growth and Development. Plants 2021, 10, 2095. [Google Scholar] [CrossRef] [PubMed]
- Poudel, S.; Vennam, R.R.; Shrestha, A.; Reddy, K.R.; Wijewardana, N.K.; Reddy, K.N.; Bheemanahalli, R. Resilience of soybean cultivars to drought stress during flowering and early-seed setting stages. Sci. Rep. 2023, 13, 1277. [Google Scholar] [CrossRef]
- Reddy, K.R.; Matcha, S.E. Quantifying nitrogen effects on castor (Ricinus communis L.) development, growth, and photosynthesis. Ind. Crop. Prod. 2010, 31, 185–191. [Google Scholar] [CrossRef]
- Zhao, D.; Reddy, K.R.; Kakani, V.G.; Reddy, V.R. Nitrogen deficiency effects on plant growth, leaf photosynthesis, and hyperspectral reflectance properties of sorghum. Eur. J. Agron. 2005, 22, 391–403. [Google Scholar] [CrossRef]
- Nelson, D.W.; Sommers, L.E. Total Nitrogen Analysis of Soil and Plant Tissues. J. AOAC Int. 1980, 63, 770–778. [Google Scholar] [CrossRef]
- SAS Institute SAS Guide to Macro Processing; SAS Institute: Cary, NC, USA, 2011; Volume 11.
- Pereira, Y.C.; da Silva, F.R.; da Silva, B.R.S.; Cruz, F.J.R.; Marques, D.J.; Lobato, A.K.D.S. 24-epibrassinolide induces protection against waterlogging and alleviates impacts on the root structures, photosynthetic machinery and biomass in soybean. Plant Signal. Behav. 2020, 15, 1805885. [Google Scholar] [CrossRef]
- Lapaz, A.D.M.; de Camargos, L.S.; Yoshida, C.H.P.; Firmino, A.C.; de Figueiredo, P.A.M.; Aguilar, J.V.; Nicolai, A.B.; Paiva, W.D.S.D.; Cruz, V.H.; Tomaz, R.S. Response of soybean to soil waterlogging associated with iron excess in the reproductive stage. Physiol. Mol. Biol. Plants 2020, 26, 1635–1648. [Google Scholar] [CrossRef]
- Jackson, M.B.; Hall, K.C. Early stomatal closure in waterlogged pea plants is mediated by abscisic acid in the absence of foliar water deficits. Plant Cell Environ. 1987, 10, 121–130. [Google Scholar] [CrossRef]
- Olorunwa, O.J.; Adhikari, B.; Shi, A.; Barickman, T.C. Screening of cowpea (Vigna unguiculata (L.) Walp.) genotypes for waterlogging tolerance using morpho-physiological traits at early growth stage. Plant Sci. 2022, 315, 111136. [Google Scholar] [CrossRef]
- Kozlowski, T.T. Plant Responses to Flooding of Soil. Bioscience 1984, 34, 162–167. [Google Scholar] [CrossRef]
- Yordanova, R.Y.; Popova, L.P. Flooding-induced changes in photosynthesis and oxidative status in maize plants. Acta Physiol. Plant. 2007, 29, 535–541. [Google Scholar] [CrossRef]
- Pang, J.; Zhou, M.; Mendham, N.; Shabala, S. Growth and physiological responses of six barley genotypes to waterlogging and subsequent recovery. Aust. J. Agric. Res. 2004, 55, 895–906. [Google Scholar] [CrossRef]
- Steffens, D.; Hütsch, B.W.; Eschholz, T.; Lošák, T.; Schubert, S. Water logging may inhibit plant growth primarily by nutrient deficiency rather than nutrient toxicity. Plant Soil Environ. 2005, 51, 545–552. [Google Scholar] [CrossRef]
- Huang, B.; Johnson, J.W.; Nesmith, S.; Bridges, D.C. Growth, physiological and anatomical responses of two wheat genotypes to waterlogging and nutrient supply. J. Exp. Bot. 1994, 45, 193–202. [Google Scholar] [CrossRef]
- Arduini, I.; Baldanzi, M.; Pampana, S. Reduced Growth and Nitrogen Uptake During Waterlogging at Tillering Permanently Affect Yield Components in Late Sown Oats. Front. Plant Sci. 2019, 10, 1087. [Google Scholar] [CrossRef]
- Board, J.E. Waterlogging Effects on Plant Nutrient Concentrations in Soybean. J. Plant Nutr. 2008, 31, 828–838. [Google Scholar] [CrossRef]
- Bacanamwo, M.; Purcell, L.C. Soybean dry matter and N accumulation responses to flooding stress, N sources and hypoxia. J. Exp. Bot. 1999, 50, 689–696. [Google Scholar] [CrossRef]
- Cartelat, A.; Cerovic, Z.G.; Goulas, Y.; Meyer, S.; Lelarge, C.; Prioul, J.-L.; Barbottin, A.; Jeuffroy, M.-H.; Gate, P.; Agati, G.; et al. Optically assessed contents of leaf polyphenolics and chlorophyll as indicators of nitrogen deficiency in wheat (Triticum aestivum L.). Field Crop. Res. 2005, 91, 35–49. [Google Scholar] [CrossRef]
- Chalker-Scott, L. Environmental Significance of Anthocyanins in Plant Stress Responses. Photochem. Photobiol. 1999, 70, 1–9. [Google Scholar] [CrossRef]
- Huang, B. Nutrient Accumulation and Associated Root Characteristics in Response to Drought Stress in Tall Fescue Cultivars. Hortscience 2001, 36, 148–152. [Google Scholar] [CrossRef]
- Ransom, J. Flooding/Waterlogging Will Affect Crop Development. Available online: https://www.ag.ndsu.edu/news/newsreleases/2011/may-30-2011/flooding-waterlogging-will-affect-crop-development (accessed on 10 July 2022).
- Reicosky, D.C.; Smith, R.C.G.; Meyer, W.S. Foliage temperature as a means of detecting stress of cotton subjected to a short-term water-table gradient. Agric. For. Meteorol. 1985, 35, 193–203. [Google Scholar] [CrossRef]
- Zhang, R.; Zhou, Y.; Yue, Z.; Chen, X.; Cao, X.; Ai, X.; Jiang, B.; Xing, Y. The leaf-air temperature difference reflects the variation in water status and photosynthesis of sorghum under waterlogged conditions. PLoS ONE 2019, 14, e0219209. [Google Scholar] [CrossRef] [PubMed]
- Zhang, F.; Zhu, K.; Wang, Y.Q.; Zhang, Z.P.; Lu, F.; Yu, H.Q.; Zou, J.Q. Changes in photosynthetic and chlorophyll fluorescence characteristics of sorghum under drought and waterlogging stress. Photosynthetica 2019, 57, 1156–1164. [Google Scholar] [CrossRef]
- Yang, F.; Liu, T.; Wang, Q.; Du, M.; Yang, T.; Liu, D.; Li, S.; Liu, S. Rapid determination of leaf water content for monitoring waterlogging in winter wheat based on hyperspectral parameters. J. Integr. Agric. 2021, 20, 2613–2626. [Google Scholar] [CrossRef]
- Yang, F.; Liu, S.; Wang, Q.; Liu, T.; Li, S. Assessing Waterlogging Stress Level of Winter Wheat from Hyperspectral Imagery Based on Harmonic Analysis. Remote Sens. 2022, 14, 122. [Google Scholar] [CrossRef]
- Jiang, J.; Steven, M.D.; He, R.; Chen, Y.; Du, P.; Guo, H. Identifying the spectral responses of several plant species under CO2 leakage and waterlogging stresses. J. Greenh. Gas Control. 2015, 37, 1–11. [Google Scholar] [CrossRef]
- Kovar, M.; Brestic, M.; Sytar, O.; Barek, V.; Hauptvogel, P.; Zivcak, M. Evaluation of Hyperspectral Reflectance Parameters to Assess the Leaf Water Content in Soybean. Water 2019, 11, 443. [Google Scholar] [CrossRef]
- Emengini, E.J.; Blackburn, G.A.; Theobald, J.C. Discrimination of plant stress caused by oil pollution and waterlogging using hyperspectral and thermal remote sensing. JARS 2013, 7, 073476. [Google Scholar] [CrossRef]
- Serrano-Calvo, R.; Cutler, M.E.J.; Bengough, A.G. Spectral and Growth Characteristics of Willows and Maize in Soil Contaminated with a Layer of Crude or Refined Oil. Remote Sens. 2021, 13, 3376. [Google Scholar] [CrossRef]
- Zahir, S.A.D.M.; Omar, A.F.; Jamlos, M.F.; Azmi, M.A.M.; Muncan, J. A review of visible and near-infrared (Vis-NIR) spectroscopy application in plant stress detection. Sens. Actuators A Phys. 2022, 338, 113468. [Google Scholar] [CrossRef]


Disclaimer/Publisher’s Note: The statements, opinions and data contained in all publications are solely those of the individual author(s) and contributor(s) and not of MDPI and/or the editor(s). MDPI and/or the editor(s) disclaim responsibility for any injury to people or property resulting from any ideas, methods, instructions or products referred to in the content. |
© 2023 by the authors. Licensee MDPI, Basel, Switzerland. This article is an open access article distributed under the terms and conditions of the Creative Commons Attribution (CC BY) license (https://creativecommons.org/licenses/by/4.0/).