Article

Research on the Identification of Some Optimal Threshing and Separation Regimes in the Axial Flow Apparatus

1
National Institute of Research—Development for Machines and Installations Designed for Agriculture and Food Industry—INMA Bucharest, 013811 Bucharest, Romania
2
Department of Biotechnical Systems, Faculty of Biotechnical Systems Engineering, University Politehnica of Bucharest, 006042 Bucharest, Romania
3
Agricultural Research and Development Station Secuieni, 617415 Secuieni, Romania
4
Faculty of Agronomy, University of Craiova, 200421 Craiova, Romania
5
Department of Production Management and Engineering, Warsaw University of Life Sciences, 02-787 Warsaw, Poland
6
Department of Horticulture, “Ion Ionescu de la Brad” Iasi University of Life Sciences, 700490 Iasi, Romania
*
Authors to whom correspondence should be addressed.
Agriculture 2023, 13(4), 838; https://doi.org/10.3390/agriculture13040838
Submission received: 8 March 2023 / Revised: 28 March 2023 / Accepted: 29 March 2023 / Published: 7 April 2023
(This article belongs to the Section Agricultural Technology)

Abstract

:
Starting from the influencing parameters of threshing and separation and implicit seed losses that occur within this process, this paper searched for and identified the optimal threshing regimes to minimize losses depending on the process parameters. The evacuation losses (pev) depend on threshing rotor speed (n) and implicit rotor peripheral speed (vp), material feed speed (va), the space between the rotor and counter-rotor (δ), material feed flow (Q), material density (ρ), and the length of the threshing apparatus (L). As the parameters ρ and L are constant, the variation of losses in relation to each of the arguments was followed: vp, Q, ρ, and va, respectively, for the minimization of losses by the variation of the loss function by two arguments each (represented graphically); the four arguments targeted being: vp, va, ρ, and Q. Using these input parameters, it was possible to determine the optimal threshing regimes for the variation of losses in relation to the rotor peripheral speed, the feed flow, the space between the rotor and the counter-rotor, and the feed speed, so as to obtain a seed separation percentage (Ss) as close as possible to 100% (and implicitly the smallest threshing losses—towards zero) in relation to these parameters.

1. Introduction

Combine harvesters are agricultural machines designed to simultaneously carry out operations such as cutting, threshing, separation, cleaning [1], and temporary storage of seeds [2], threshing being their most important function [3].
Cereal harvesting apparatus can perform the work process in a stationary mode or on the move (towed/self-propelled), the latter being the most widespread. The seeds are collected by mechanical methods based on combined impact and friction forces [4,5,6].
The threshing and separating apparatus is the most important part of the combine; according to its type, the combines can have axial longitudinal or tangential flow [7].
In threshing apparatus with axial flows, the harvested cereals move helically along the axis of the cylinder between the threshing part and the counter-rotor [8] during several complete revolutions, being threshed for a longer period of time through the repeated impact of the coils at low speed [9].
Around 80% of the seeds are separated in the first half of the rotor, whereas the remaining 20% are separated in the other half of the rotor [10]. This threshing principle produces minimal deterioration of seeds with greater yield and threshing performance [11]. Basically, the repeated passes of the seeds in the axial thresher ensure a longer retention time with a gentle threshing action (the seeds rub more than they hit in the case of the tangential thresher), protecting the seeds from deterioration [12]. Additionally, the percentage of broken seeds in threshing apparatuses with axial flow is lower than that in those with tangential flow [9].
In threshing apparatuses with tangential flow, the harvested cereals are threshed while they travel transversely between the drum and the counter-rotor.
The threshing device has an important role in the combine’s performance [13,14] because it influences the threshing efficiency (maximum yield, with optimal separation and minimal seed loss) [13,14], the power requirement for threshing [15,16], and the adaptability of the whole combine [17].
Cereal harvesters operate in variable soil, crop, and environmental conditions; they must ensure minimal seed losses and a final product with a preordained level of quality (cereal seeds in seed bin). During harvesting, the efficiency of the threshing and cereal seed cleaning apparatuses can undergo rapid changes [18,19], both due to some parameters related to the agricultural crop and the field conditions, such as crop variety and seed moisture [20], the degree of plant maturity [21], certain biometric indices that change during harvesting [22], the non-uniformity of crop density per surface unit, and soil unevenness [23], as well as due to some operating combine parameters, such as harvester working speed, threshing rotor speed, rotor peripheral speed, stubble cutting height, speed of the centrifugal fan, angle of inclination of the air distributor, screen holes, feed speed, etc. [24,25,26]. These factors directly influence seed losses as well as the energy requirements and the efficiency of the combine, which in turn will determine crop productivity and the overall working costs [27]. For example, losses during cutting, threshing, separation, and cleaning are higher with the increasing of the forward speed of the combine and with the decrease of the moisture content of cereal seeds; threshing efficiency increases by decreasing the forward speed of the combine and decreases by reducing the speed of the threshing drum and by increasing the clearance between the cylinder and the counter-rotor [28]. These parameters also affect air distribution in the cleaning device and, therefore, the seed cleaning efficiency [23].
Some of the parameters that characterize the performance of a combine are: productivity, threshing efficiency, seed losses, seed impurity content, broken seeds, and energy consumption [29,30]. The performance of cereal harvesters increases by increasing the rate of crop production, provided that crop quality is maintained and that seed losses are minimized [31]. Air-field distribution depends on the main working parameters of the harvester [26] and can directly affect its performance indices (expressed by seed losses and seed purity) [32].
Seed losses occur from both natural and mechanical causes. Losses due to natural causes occur before the actual harvest and are due, for example, to unfavorable weather conditions such as wind or rain [33], over-ripeness, microbes, insects, weeds, birds, or rodents [6]. Mechanical losses include deteriorated seeds due to impact with the hard surface of the threshing unit, cutting, threshing, separation, and transport losses [6,34]. It is considered that approximately 75% of cereal harvest losses are due to the improper adjustment of the cutting mass height [35,36,37]. Deteriorated seeds have a lower value in the market, they cause problems during storage [12,38], and have a lower germination rate (by approximately 10%) [22]. Minimizing harvest and post-harvest losses is very important for ensuring global food security. In addition to seed losses through separation, the mixture consisting of seeds, chaff, and small straw particles (or MOG—material other than grain) indicates the qualitative performance of the cleaning unit [35]. The impurity content, which represents the ratio between the materials’ mass (other than seeds) and the mass of cereal seeds [39], is one of the key parameters that must be optimized to increase the qualitative operating performance of the combine [40].
Since the major objective of any grain harvester is to recover the largest possible amount of mature and non-deteriorated seeds from the field, a major problem for combine harvester designers is the identification of solutions to minimize harvest losses [41,42], as well as harvesting in the shortest period of time and with as little fuel consumption as possible [43]. Mathematical modeling has a particularly important role in achieving these objectives.
The development of seed threshing apparatuses with high qualitative indices was analyzed by the authors of study [44], who came to the conclusion that an optimization of the input parameters is necessary so as to obtain the improvement of these indices simultaneously with the reduction in operating costs (sunflower separation in an MVU-1500 equipment). Additionally, in study [45], research was carried out on the separation of sunflower seeds by air flow, the cleaning of impurities, and the sorting into dimensional fractions in separation apparatus fitted with flat sieves with different types of meshes [46].
The fundamental goal of this paper is to identify the optimal threshing and separation regimes depending on the most important input parameters identified: rotor peripheral speed, material feed speed, space between rotor and counter-rotor, and material feed flow, which allow obtaining of a seed separation percentage as close as possible to 100% (and implicitly the threshing losses as small as possible—towards zero) in relation to these parameters.
This paper aims to identify optimal threshing and separation regimes in axial flow combines in order to set limits/values in the software that monitors the parameters and working indices of the combine, so that the losses of the combine are minimal. Through the software, the maximum values of the input parameters that can lead to increased losses (and not only) can be limited, the optimal intervals in which a combine can work and be preset can be established, so that after the combine enters the field crop to automatically switch to such a working regime.

2. Materials and Methods

To identify the optimal threshing regimes, we started from the hypothesis that combine losses within the threshing process (without taking into account the process and implicitly the losses that occur until the material enters the threshing apparatus) are represented by the evacuation losses (pev). These losses are influenced by: threshing rotor speed (n) and implicitly rotor peripheral speed (vp); material feed speed (va); space between rotor and counter-rotor (δ); material feed flow (Q); material density (ρ); and the length of the threshing apparatus (L).
Minimizing losses, will be achieved taking into account the parameters of the work regime, on which they depend. Thus, the loss function has the following form:
p = p e v ( n , v a , δ , Q , ρ , L )
However, since ρ and L are constant, the minimization of losses will be tried in turn, in relation to each of the arguments: vp, Q, va (Q is closely related to va), and to δ; instead of the rotor speed n, we will use the rotor peripheral speed vp (which is closely related to the speed but directly influences the threshing process, its intensity, the losses, and the degree of seeds deterioration). In this case, the minimization of losses will be pursued (taking into account the average of the results obtained during the experiments).
Data on the main parameters of the experiments carried out on the Fundulea 4 wheat variety are presented in Table 1.
The material separated by the counter-rotor was collected in 50 boxes (10 × 5) with the dimensions L × W × H: 200 × 200 × 100 [mm × mm × mm], designated from 1 to 50. The boxes were divided in two blocks. Boxes 1 to 25 were arranged in a spacious box made of metal and those from 26 to 50 in another. Thus, they were simpler to manipulate and the destruction of the cardboard boxes was prevented (their damage could have happened due to reduced space of 3–10 mm between the block of boxes and the counter-rotors’ grid). The boxes made of 1 mm sheet were arranged in the support guides on the chassis of the towed threshing apparatus model B 90, developed by INMA Bucharest. Boxes 1 to 25 collected the material from the threshing area (being placed in front), whereas boxes 26 to 50 mainly collected the material from the separation area.
Figure 1a presents the constructive scheme of the axial flow threshing apparatus. Figure 1b shows a section through the threshing apparatus, under which the boxes for collecting the material are placed (Figure 2).
Each line of boxes gathers the material separately between two adjacent counter-rotor crossbars. Seeds separated last are collected in the last boxes (from the back) in the transition zone to the extension zone of the counter-rotor.
After threshing the mass of material prepared for experimentation, the threshing apparatus was stopped, the blocks of collecting boxes (from Figure 2) were removed from inside the threshing apparatus, and the material from them (seeds, straws, and chaff) was carefully collected in plastic bags (each bag was marked with the number of the box from which the material was collected and that of the experience). All 50 bags in which the threshed material was collected and separated from the blocks of collecting boxes were placed in a bag on which both the number of the experiment and the date when it took place were noted.
The material collected in each box was weighed using a KERN balance of 0.01% precision (Figure 3a). The moisture was determined in a Memmert oven (Figure 3b). Both pieces of equipment belong to the testing laboratory of INMA Bucharest.
Mathcad software was used to process the experimental data and plot the graphs.
Along the length of the threshing apparatus (longitudinally), the 10 boxes were numbered as Li, from L1 to L10 (from the feeding area to the outlet—the back of the threshing apparatus). Along the threshing apparatus width (transversally), the 5 boxes were numbered: A, B, C, D, and E (from the material supply area to the opposite side). Thus, it was possible to accurately determine for each section of the threshing apparatus length the amount of total material (straw + seeds) separated, the number of separated seeds, and the mass of separated straw.

3. Results and Discussions

The data obtained experimentally are presented in Figure 4.
To better observe how the separation of the total material (seeds + straw) evolves on each section of the threshing apparatus length, Table 2 presents these data, including the cumulative data along the threshing apparatus length.
Considering that the percentage of separated seeds from straw (Ss), together with free seeds in straw and unthreshed seeds represents 100%, then:
Sn = 100 − SsSl [%]
where Sn—unthreshed seeds (threshing losses) and Sl—free seeds in straws.
The separation process was subjected to an extensive mathematical modeling in study [6], where the characteristics of the threshing and separation processes were determined. Following the proposed methodology, Equations (3) and (4) resulted, which are associated with the separation and distribution.
S s ( x ) = 1.00462 1.1643 e 2.769 x
S d ( x ) = 3.224 ( e 2.769 x e 20.189 x )
Under the specific operating conditions, the variation in the distribution function is depicted in Figure 5a, whereas the distribution density function is presented in Figure 5b.
To observe how the percentage of unthreshed seeds (threshing losses), Sn, evolves along the threshing apparatus length on each section, Table 3 presents the percentage of separated seeds (Ss), the distribution density along the threshing apparatus length (Sd), and free seeds in straw (Sl) cumulatively along the length of the threshing apparatus, so that in the end the final losses from the threshing process (Sn) result.
The variation in losses (from the threshing process) was graphically represented in relation to the main parameters (previously identified) that have the highest influence, namely va, Q, δ, and vp.

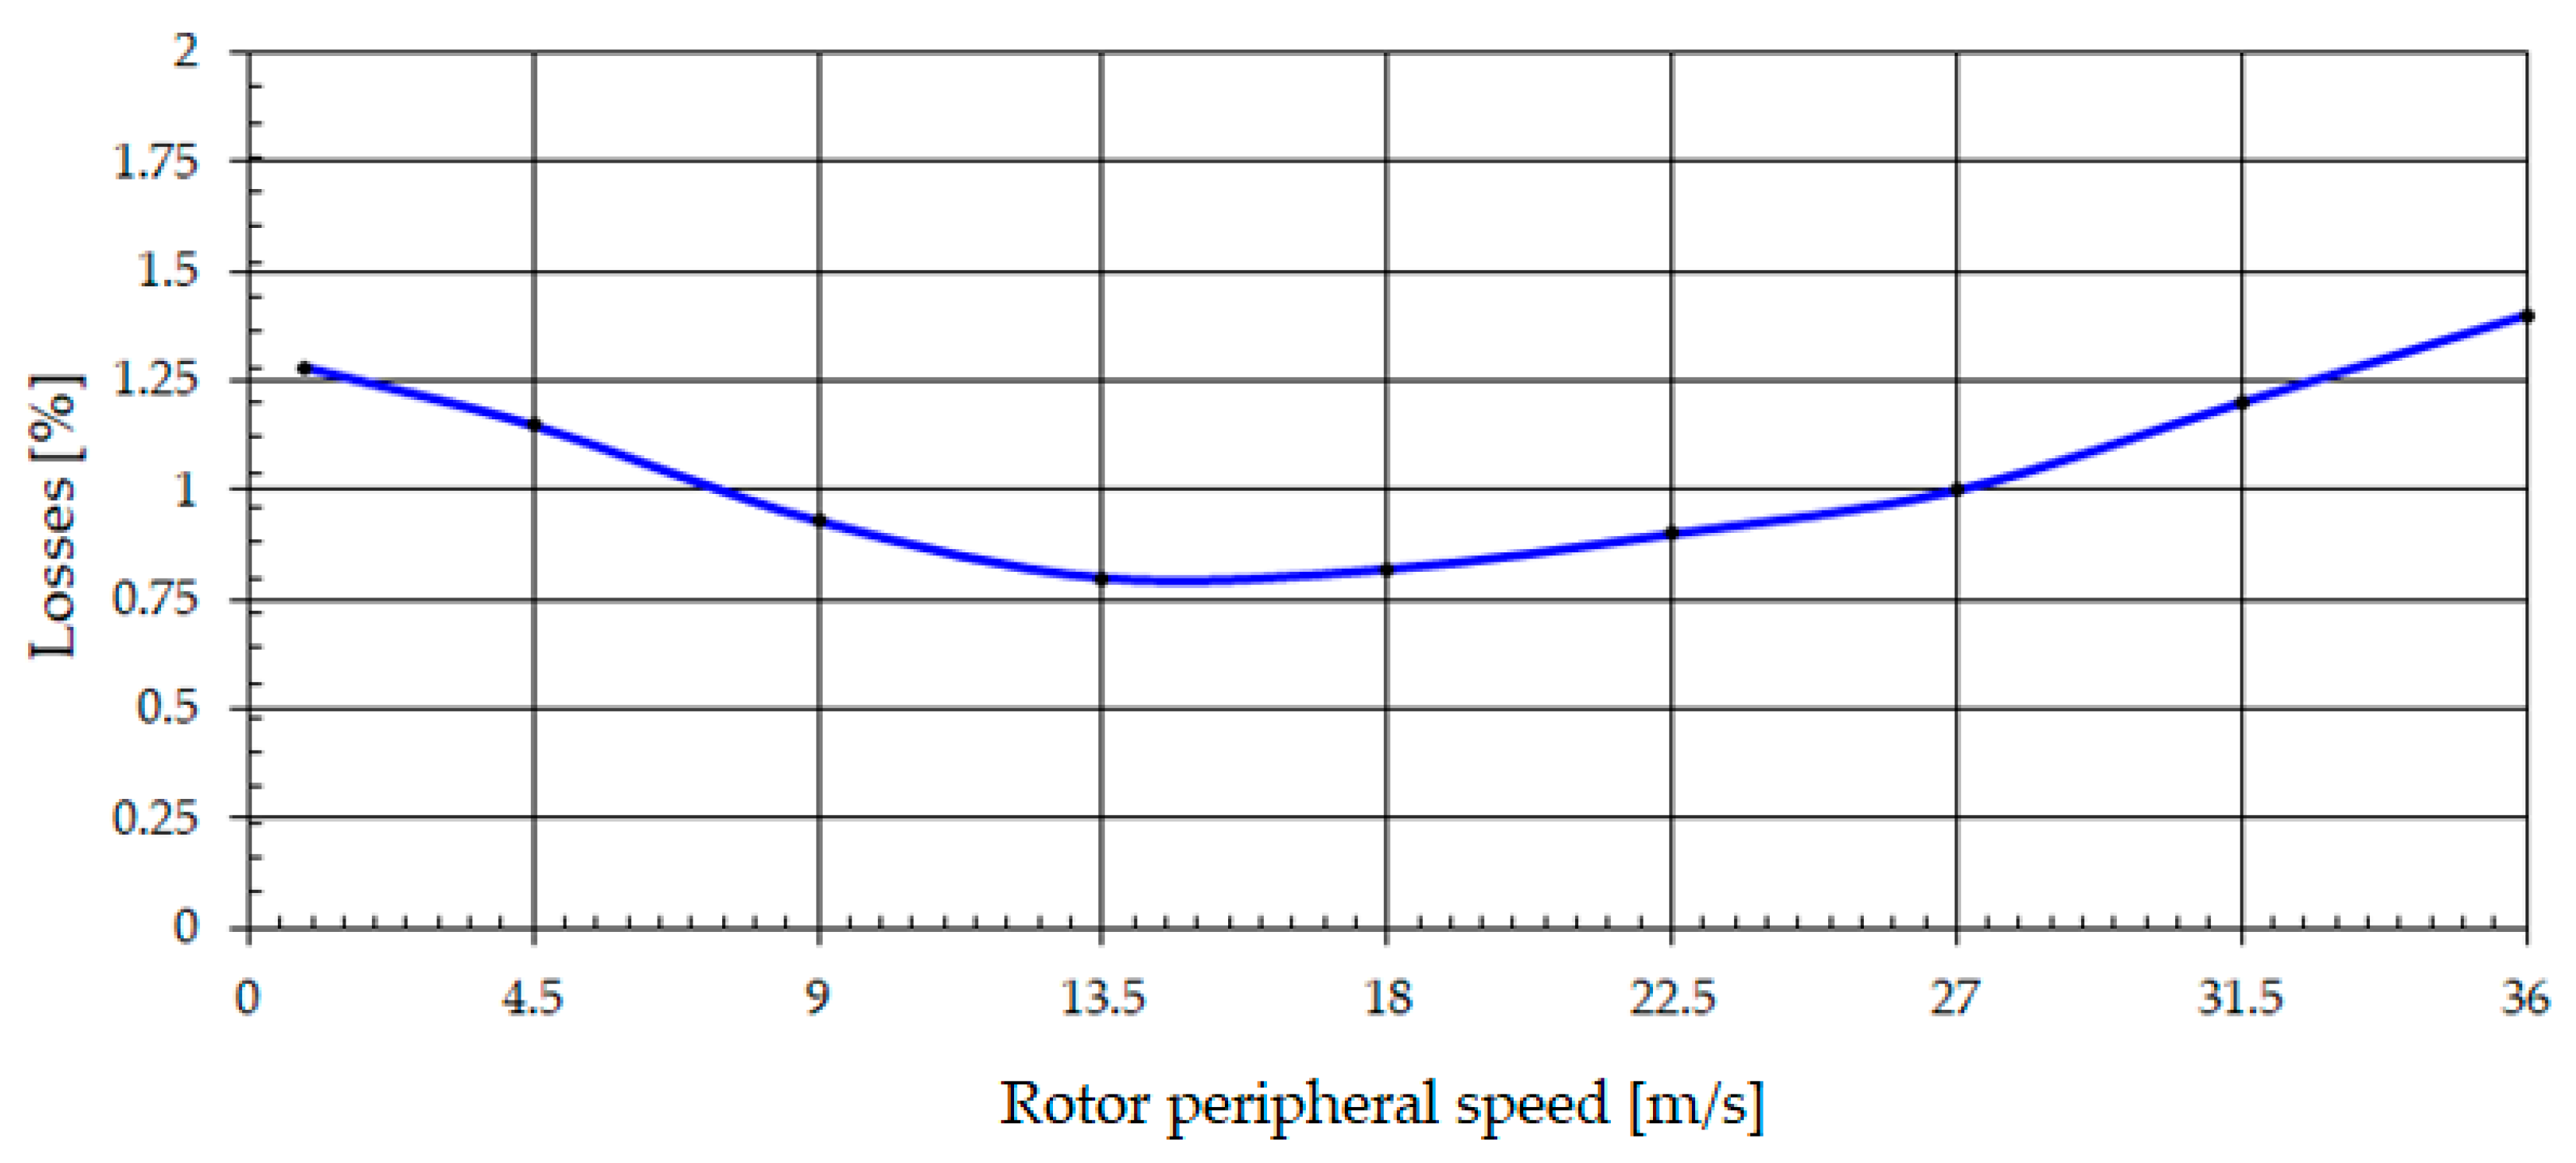
3.1. The Variation in Losses in Relation to the Rotor Peripheral Speed—vp (Revolution)

The graphic representation of the variation in seed losses in relation to the rotor peripheral speed is presented in Figure 6.
The losses show a minimum for a rotor peripheral speed in the range 13–20 m/s, then they increase slowly as the rotor peripheral speed also increases. To be able to choose the optimal peripheral speed that will be used during the threshing and separation process, an acceptable level of losses must be taken into account so that the intensity of the process is not influenced (it is known that when harvesting cereals and especially wheat, the optimum rotor peripheral speed, depending on the type and condition of the crop, must have values between 30–38 m/s).

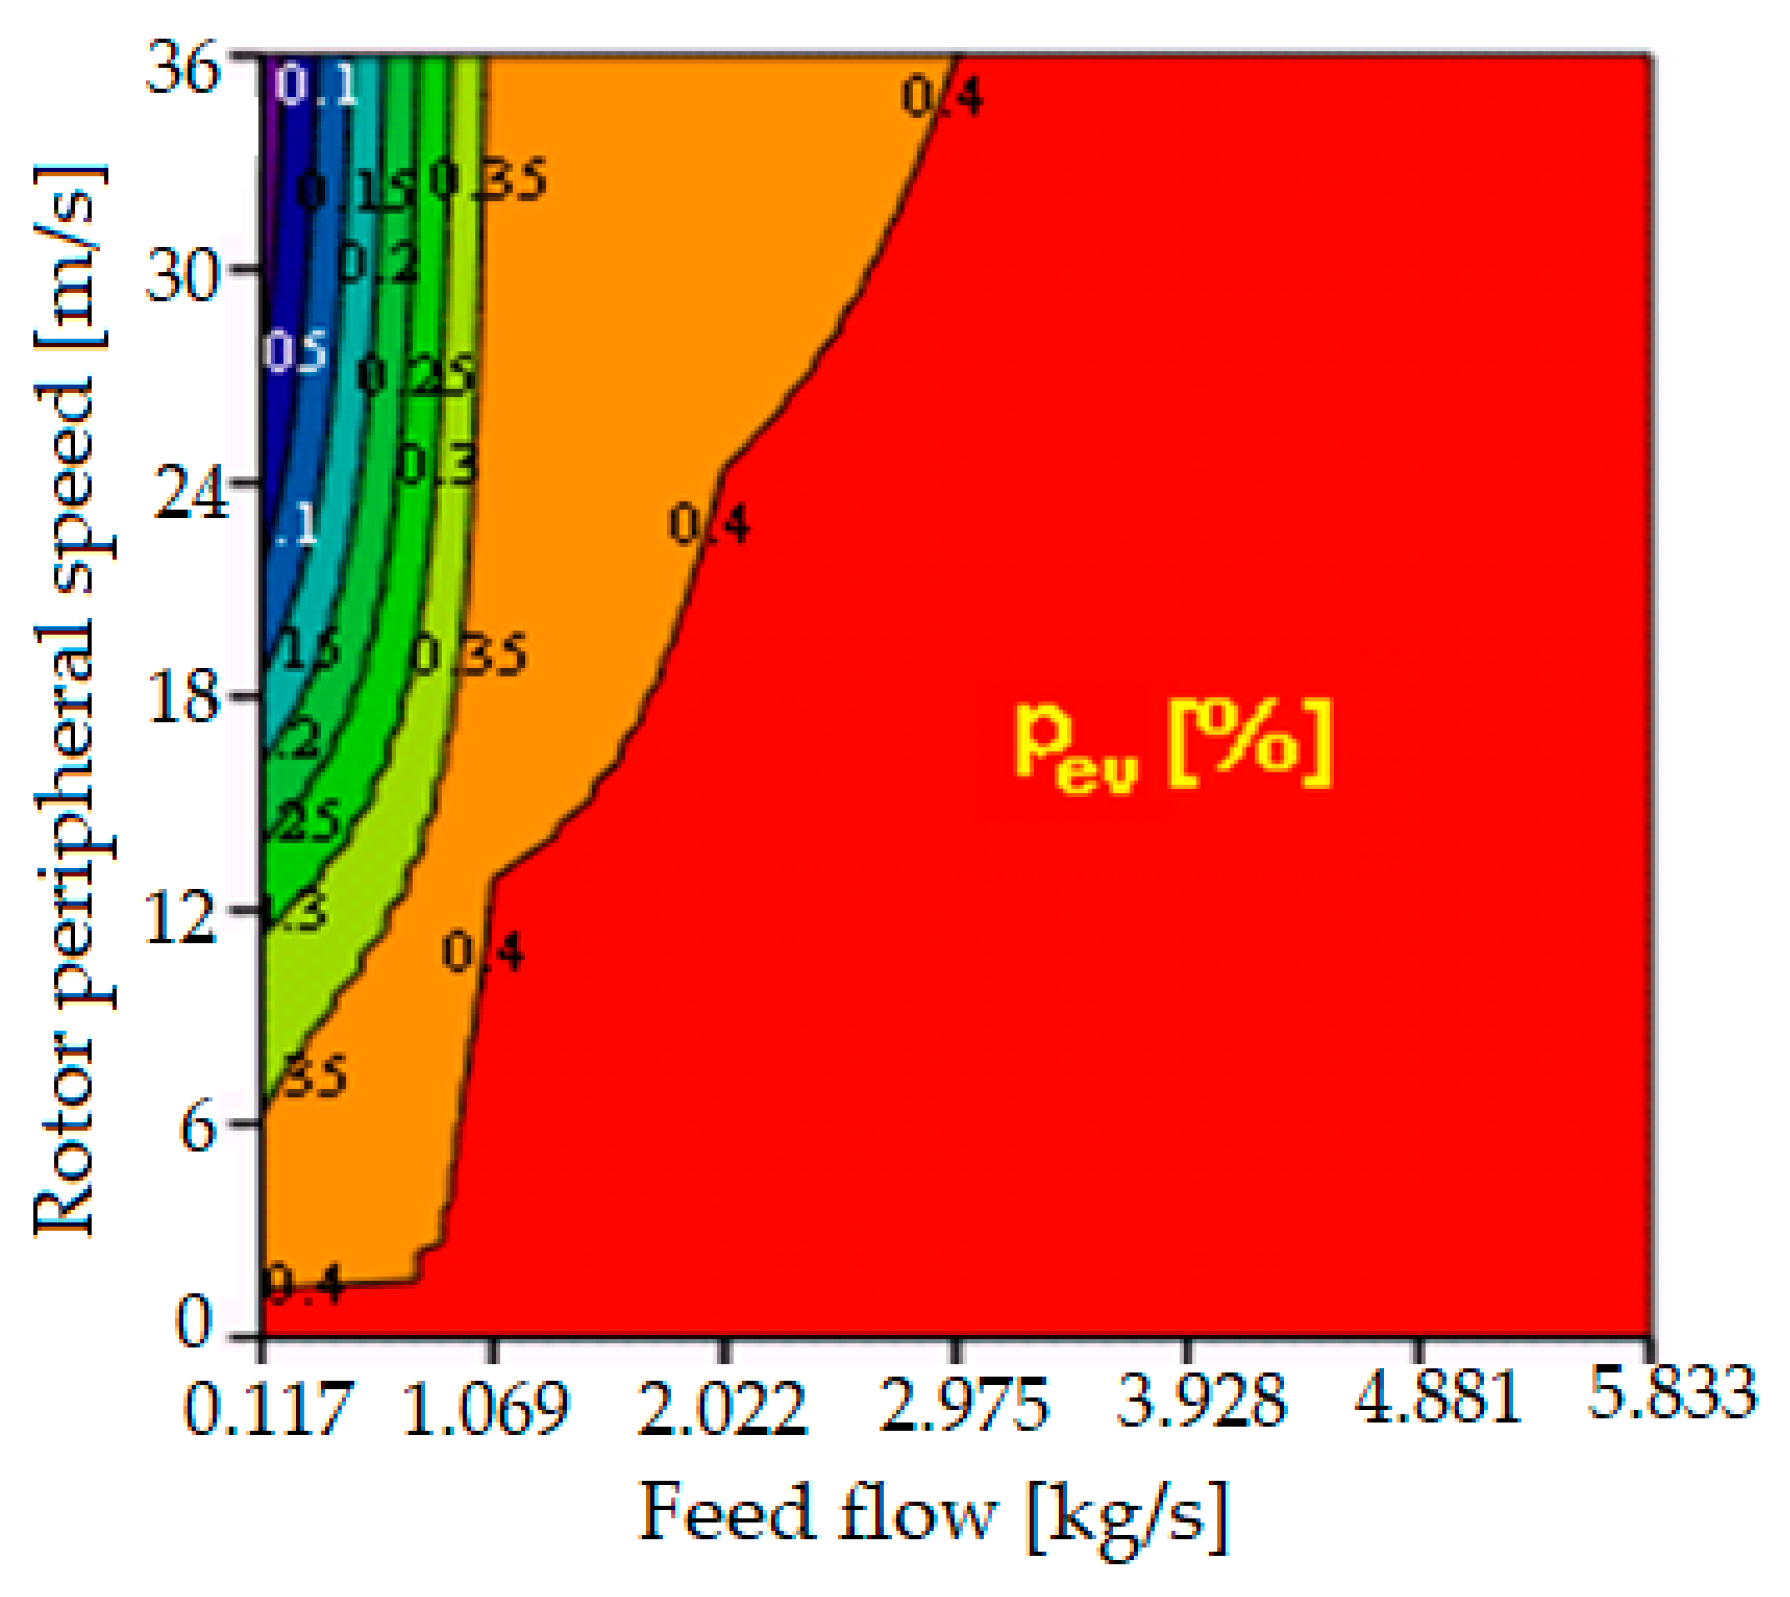
3.2. The Variation in Losses in Relation to the Feed Flow (Q)

The graphic representation of the variation of seed losses in relation to the feed flow is presented in Figure 7.
Figure 7 shows that for this type of axial threshing apparatus the losses are more pronounced at the maximum feed flows that the threshing apparatus can reach; the maximum value of 2.6% is registered at a flow of 6 kg/s and the minimum loss value at flows of 1.8–2 kg/s.
Similar to the case for losses depending on the rotor peripheral speed, an acceptable level of losses must be taken into account in this case also, so that the combine works with a feed flow as high as possible to result in a high work productivity.

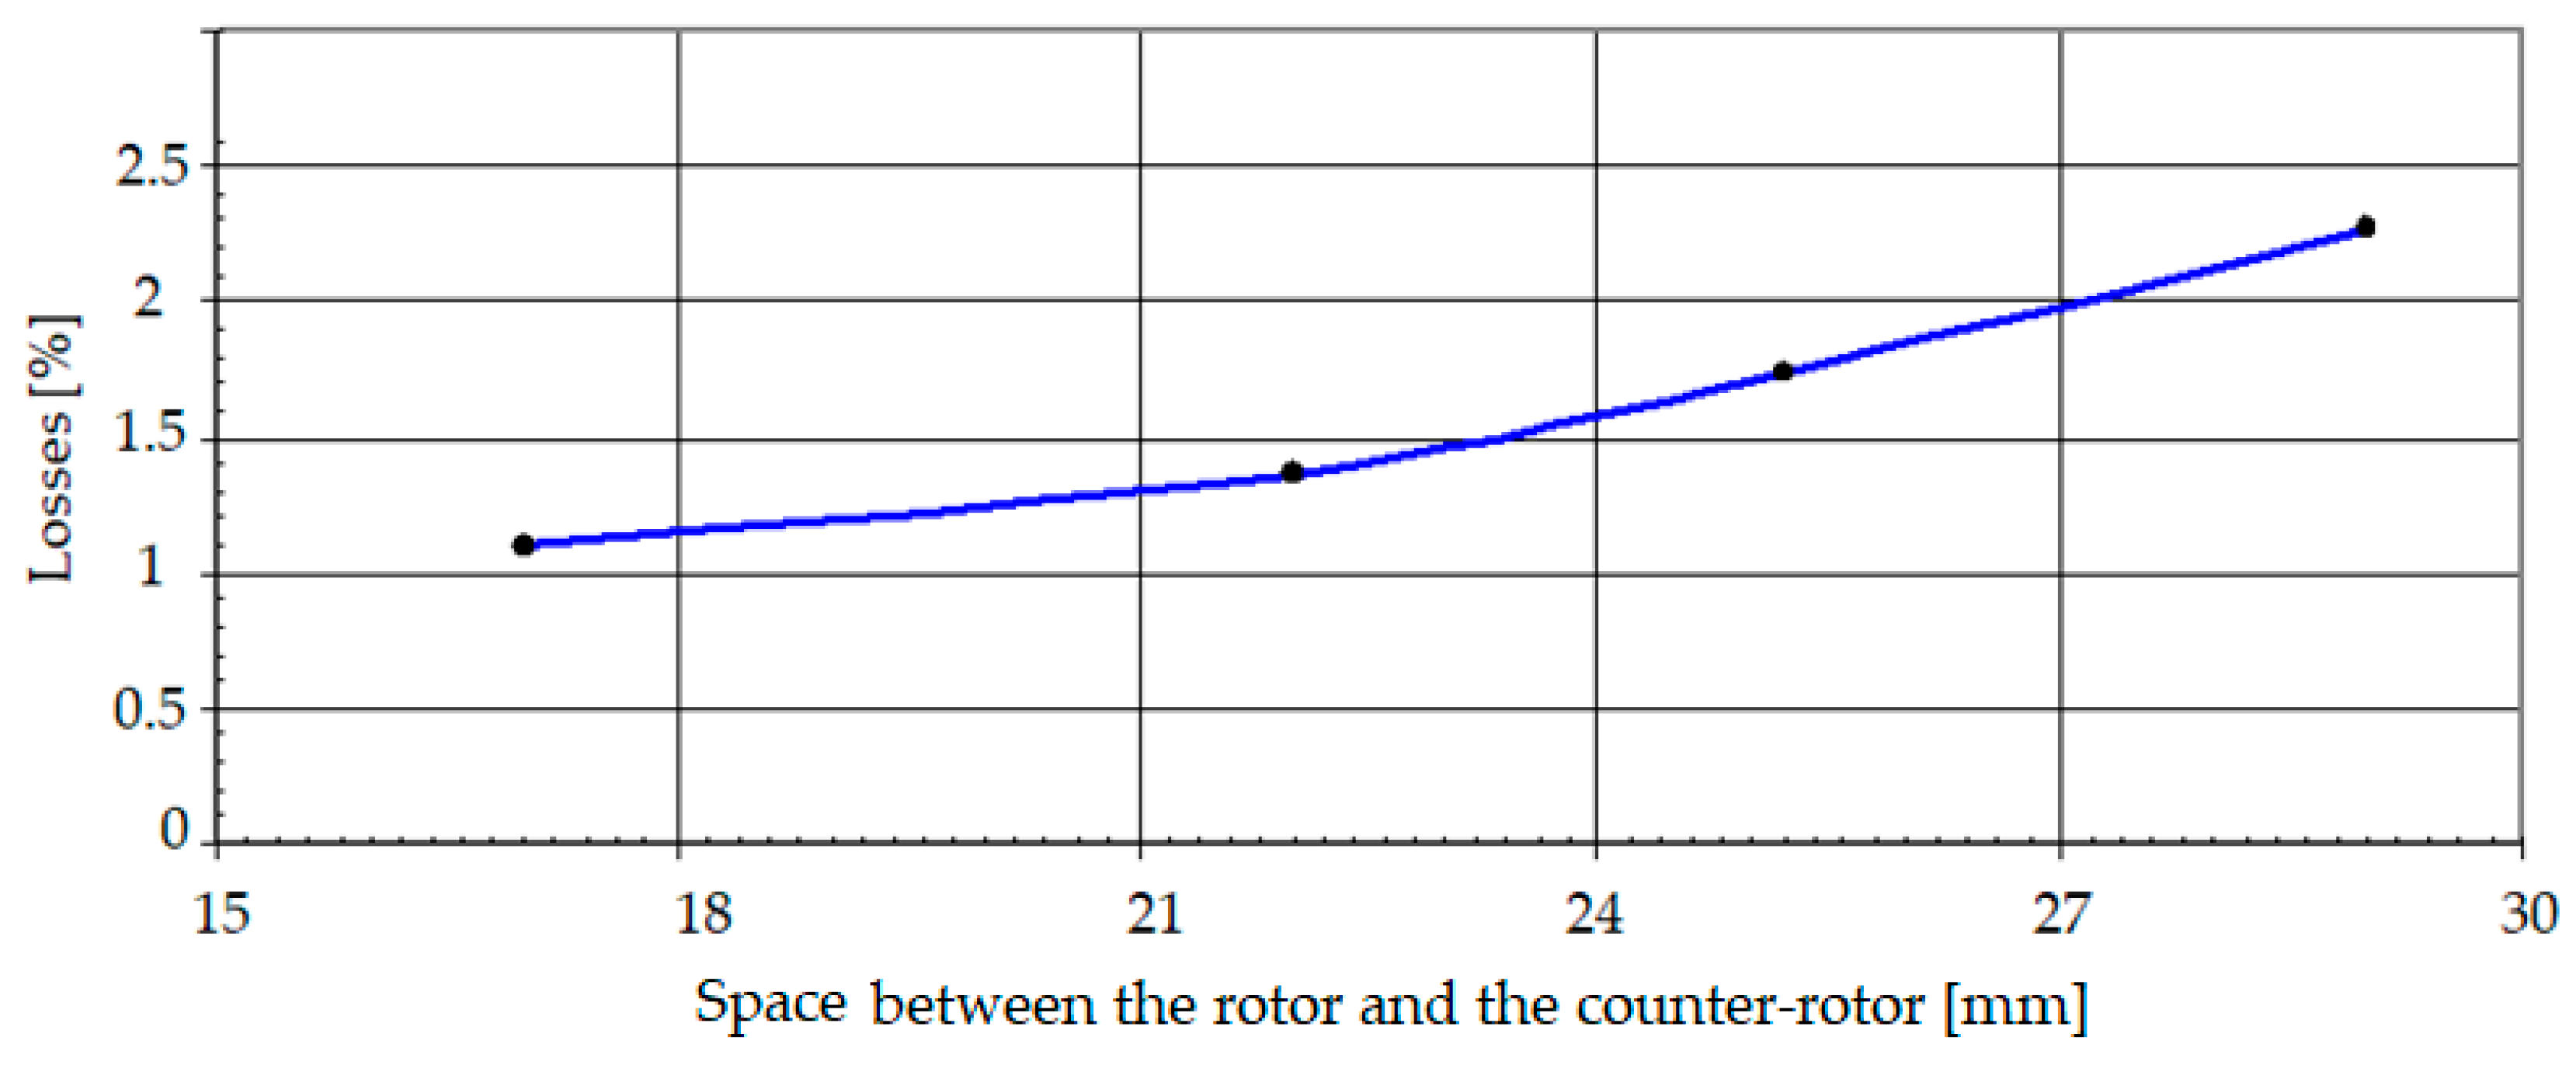
3.3. The Variation in Losses in Relation to the Space between the Rotor and the Counter-Rotor (δ)

The variation in losses in relation to the space between the rotor and counter-rotor (δ) is graphically represented in Figure 8.
Examining the variation in losses, they are inversely proportional to the space between the rotor and the counter-rotor, the losses increasing as the space between the rotor and the counter-rotor increases. This can be explained by the fact that by increasing the space between the rotor and the counter-rotor, the intensity of the threshing and separation process decreases (the friction between the bars of the threshing apparatus, the bars of the counter-rotor, and the ears/straw is no longer so pronounced, the layer of material being looser).

3.4. The Variation in Losses in Relation to the Feed Speed (va)

The variation in losses in relation to the feed speed (va) is graphically represented in Figure 9.
From the analysis of Figure 9, it can be seen that the losses increase with increasing the feed speed. The increase in losses due to the feed speed results from the increase in the amount of material introduced into the threshing apparatus and therefore the decrease in threshing intensity (the friction between the bars of the threshing apparatus, the bars of the counter-rotor, and the ears is greatly mitigated by the large amount of straw and chaff introduced together with them).

3.5. Variation of the Loss of Two Arguments Function

We will further discuss the variations in losses as functions of two arguments each. With the four arguments in question, namely n, va, δ, and Q, six functions of two arguments each can be obtained that should be studied. In the following, only those more important than the results of the study on the partial functions of a single variable will be presented.

3.5.1. Variation of Losses as Partial Functions of Rotor Peripheral Speed and Feed Speed

This study follows the variation of losses through the consideration of two process parameters (two arguments). The two variables taken into account are chosen from the process parameters adjustable by the operators that have been previously considered; the resulting diagrams can be further used either in operation or in design.
As depicted in Figure 10, the losses are lower if the rotor peripheral speed is higher and the feed speed is lower. The function reaches its minimum value on the boundary of the definition plane domain, a behavior similar to harmonic functions. Extreme points within the two-dimensional interval do not exist. Depending on each type of apparatus, based on such diagrams the peripheral speeds (rotor speed) and optimal feed speeds can be chosen, so that minimal losses will result from the threshing and separation process.

3.5.2. The Variation in Losses as Partial Functions of the Rotor Peripheral Speed and the Space between the Rotor and Counter-Rotor

The variation in losses depending on the rotor peripheral speed and the space between the rotor and the counter-rotor is represented graphically in Figure 11.
The structure of evacuation losses depending on rotor peripheral speed (vp) and the space between the rotor and the counter-rotor (δ) is more complex; the maximum and minimum ceiling are very close (which produces some instability because small variations in the choice of values arguments can move the regime from the state with minimum evacuation losses to the state with maximum evacuation losses). The lowest values for the losses are reached with higher values for the rotor peripheral speed and for the space between the rotor and the counter-rotor.

3.5.3. Variation in Losses as Partial Functions of Feed Speed and Space between Rotor and Counter-Rotor

The variation in losses depending on the feed speed and the space between the rotor and the counter-rotor is represented graphically in Figure 12.
The evacuation losses depending on the feed speed (va) and the space between the rotor and the counter-rotor (δ) are the lowest when the feed speed and the space between the rotor and the counter-rotor have minimum values. However, this is not possible because, depending on the harvested crop, δ must have certain values; δ cannot be reduced very much because in this case the percentage of deteriorated seeds increases and there is a risk of clogging the threshing apparatus; however, it cannot be increased excessively either because the intensity of the threshing process decreases and the threshing and separation process is compromised (a small amount is separated from the seeds).
This diagram is useful because, based on it; the optimal values for the feed speed and the space between the rotor and the counter-rotor can be chosen so as to result in minimal losses. It should be noted that this diagram is useful for this type of threshing apparatus or for apparatuses with similar lengths and characteristics; for apparatus that differs in construction or dimensions, another diagram must be drawn corresponding to those types.

3.5.4. The Variation in Losses as Partial Functions of the Material Flow and the Rotor Peripheral Speed

The variation in losses depending on the material feed flow and rotor speed is graphically represented in Figure 13, from the analysis of which it can be observed that the losses are lower if the rotor peripheral speed is higher and the feed flow is lower. This is explainable because the higher the rotor peripheral speed, the more intense the threshing and separation process will be. As the flow of material entering the threshing apparatus increases progressively (due to the large amount of material in it), the intensity of the threshing and separation decreases (the amount of straw increases) and therefore a larger amount of unseparated seeds will result, representing an increase in losses.

3.5.5. Variation in Losses as Partial Functions of Material Flow and Space between Rotor and Counter-Rotor

The variation in losses depending on the material feed flow and the space between the rotor and the counter-rotor is graphically represented in Figure 14.
From the analysis of the variation in losses depending on the material feed flow and the space between the rotor and the counter-rotor, we can see that the losses have minimum values if as the feed flow increases the space between the rotor and the counter-rotor similarly increases. However, the optimal flow with which the combine will operate must be chosen taking into account the space between the rotor and counter-rotor recommended for a certain type of crop (e.g., for wheat, 16–17 mm at the entrance to the device and 4 mm at the exit). It should be noted, however, that this diagram can only be used for this type of threshing apparatus or for those with similar construction characteristics and dimensions.

3.5.6. Variation in Losses as Partial Functions of Material Flow and Feed Speed

The variation in losses depending on the feed flow and material feed speed is graphically represented in Figure 15.
The losses are directly proportional to the feed flow. Therefore, the losses increase with an increase in the feed flow and remain constant throughout the entire range. The graphic form presented in Figure 16 results from the fact that the feed flow depends directly on the material feed speed:
Q = M · v a l s
where M—mass of material and ls—length of the feeding section.
The increase in losses as the feed flow increases is normal because a larger amount of material (more straw) is introduced into the thresher and this decreases the intensity of the threshing process and separation, resulting in a larger amount of unseparated seeds.

4. Conclusions

Depending on the input parameters considered (after modeling the threshing and separation process), optimal threshing regimes were searched for and identified to minimize losses depending on the process parameters.
Thus, the variation in the losses in relation to each of the arguments: rotor peripheral speed (Figure 5—the losses present a minimum for a rotor peripheral speed in the range between 13 and 20 m/s, after which they increase slowly as rotor peripheral speed increases), the feed flow (Figure 6—the losses are more pronounced for the maximum flows that the thresher can reach, with the maximum value of 2.6% at a flow of 6 kg/s and the minimum value for the losses being recorded at flows of 1.8–2 kg/s.), the space between the rotor and the counter-rotor (Figure 7—the examination of the variation of losses shows that they are inversely proportional to the space between the rotor and the counter-rotor, the losses increasing as the space between the rotor and counter-rotor increases), and feed speed (Figure 8—the losses increase with increasing feed speed). It should be noted that the peripheral speed was used instead of revolution; in addition, the variation in losses in relation to the feed flow, which is closely related to feed speed and at the same time one of the most important input parameters, was followed.
The aim was to minimize the losses by varying the loss function by two arguments each (represented graphically); the four arguments targeted were vp, va, δ, and Q. From the graphical representation of the losses as a function of rotor peripheral speed and feed speed (Figure 9), we could observe that the loss function reaches its minimum value on the boundary of the definition plane domain, so there was a behavior similar to the harmonic functions; the losses were lower when the rotor peripheral speed was higher and the feed speed was lower.
Following the variation in the losses depending on the rotor peripheral speed and the space between the rotor and the counter-rotor (Figure 10), it was found that the structure of the losses is more complex, the maximum and the minimum ceiling being very close. The lowest values for the losses are reached with higher values for the rotor peripheral speed and the space between the rotor and the counter-rotor.
From the analysis of the variation in losses as a function of the feed speed and the space between the rotor and the counter-rotor (Figure 11), we can see that the losses are lower when the feed speed and the space between the rotor and the counter-rotor have minimum values. However, this is not possible because, depending on the harvested crop, the space between the rotor and the counter-rotor must have certain values; it cannot be reduced very much because in this case the percentage of deteriorated seeds increases and there is a risk that the threshing apparatus will clog. However, the space between the rotor and the counter-rotor it cannot be excessively increased either, because in this way the intensity of the threshing process decreases and the threshing and separation process is compromised (a small amount is separated from the seeds).
The graphical representation of the losses as a function of rotor peripheral speed and feed flow (Figure 12) highlighted the fact that the losses are the lowest if the rotor peripheral speed is higher and feed flow is lower; this happens because the more the rotor peripheral speed increases the more intense the threshing and separation process is. Additionally, with the increase in the flow of material entering the threshing apparatus, the intensity of the threshing and separation decreases (the amount of straw increases). As a result, a larger number of unseparated seeds will be obtained, leading to an increase in losses.
The variation in the losses as a function of the distance between the rotor and counter-rotor and the feed flow (Figure 13) highlighted the fact that the losses are minimal if the feed flow increases and, similarly, the space between the rotor and the counter-rotor increases.
From Figure 14 (variation of losses as a function of feed speed and feed flow), it can be seen that the losses are directly proportional to the feed speed, so the losses increase with the increase in the feed speed and remain constant throughout the interval. The graphic form results from the fact that the feed flow is directly dependent on the material feed speed.
For a better appreciation of the losses depending on feed speed and feed flow, a more detailed representation is presented in Figure 15 (with a smaller range of values). Figure 16 shows in detail the variation in losses depending on the feed flow and the feed speed, which remain constant throughout the entire interval. The chosen range is very small so that it is very clear to see both the increase in losses with the increase in the feed speed and the dependence between the feed flow and feed speed. This dependence takes into account the fact that the flow of material directly depends on the speed with which the threshing apparatus is fed during the work process. In addition, if the variation of the losses were realized separately, depending on only one of the arguments (the feed speed or the feed flow), it would be seen that the variation curves will have the same shape for each of the two parameters.
The results obtained in this work allowed the identification of the optimal threshing and separation regimes within an axial flow threshing apparatus. Based on these regimes it will be possible to adjust the working regimes of these types of threshers in the future, so that a percentage of seed separation as close as possible to 100% is obtained (and implicitly losses during threshing are as small as possible—towards zero) at an optimal material feed speed and with as little deterioration of the separated seeds as possible.

Author Contributions

Conceptualization, N.-V.V. and N.U.; methodology, N.-V.V., I.V., F.N., I.G. and D.C.; software, S.-Ş.B., S.B. and G.M.; validation, I.V., F.N., I.G. and D.C.; formal analysis, N.-V.V., N.U. and G.M.; investigation, I.V., F.N., I.G., D.C. and G.-C.T.; resources, N.-V.V., I.V., D.C., S.-Ş.B., N.U., S.B. and G.M.; data curation, N.-V.V., S.-Ş.B., A.E. and G.M.; writing—original draft preparation, N.-V.V. and N.U.; writing—review and editing, N.-V.V., N.U. and F.N.; visualization, L.-D.P., A.E. and G.-C.T.; supervision, N.-V.V. All authors have read and agreed to the published version of the manuscript.

Funding

This work was supported by a grant of the Romanian Research and Innovation Ministry, through Programme 1—Development of the national research-development system, sub-programme 1.2—Institutional performance—Projects for financing excellence in RDI, contract no. 1 PFE/2021. The APC was funded by University Politehnica of Bucharest, Romania, within the PubArt Program.

Institutional Review Board Statement

Not applicable.

Data Availability Statement

Not applicable.

Acknowledgments

All authors have equal rights and have contributed evenly to this paper.

Conflicts of Interest

The authors declare no conflict of interest.

References

  1. Wang, J.; Li, H.; Yuan, J.; Ma, G.; Xiong, Y. Design and test on an all feed axial flow same diameter differential speed thresher. INMATEH—Agric. Eng. 2018, 54, 73–80. [Google Scholar]
  2. Liang, Z.; Li, Y.; Zhao, Z.; Xu, L. Structure optimization of a grain impact piezoelectric sensor and its application for monitoring separation losses on tangential-axial combine harvesters. Sensors 2015, 15, 1496–1517. [Google Scholar] [CrossRef] [Green Version]
  3. Hanna, H.M.; Quick, G.R. Grain Harvesting Machinery. In Handbook of Farm, Dairy and Food Machinery Engineering; Academic Press: Cambridge, MA, USA, 2013; pp. 223–257. [Google Scholar]
  4. Fu, J.; Chen, Z.; Han, L.; Ren, L. Review of grain threshing theory and technology. Int. J. Agric. Biol. Eng. 2018, 11, 12–20. [Google Scholar] [CrossRef]
  5. Cujbescu, D.; Găgeanu, I.; Iosif, A. Mathematical modeling of ear grain separation process depending on the length of the axial low threshing apparatus. INMATEH—Agric. Eng. 2021, 65, 101–110. [Google Scholar] [CrossRef]
  6. Vlăduț, N.-V.; Biriş, S.-Ş.; Cârdei, P.; Găgeanu, I.; Cujbescu, D.; Ungureanu, N.; Popa, L.-D.; Perişoară, L.; Matei, G.; Teliban, G.-C. Contributions to the mathematical modeling of the threshing and separation process in an axial flow combine. Agriculture 2022, 12, 1520. [Google Scholar] [CrossRef]
  7. Li, Y.; Su, Z.; Liang, Z.; Li, Y. Variable-diameter drum with concentric threshing gap and performance comparison experiment. Appl. Sci. 2020, 10, 5386. [Google Scholar] [CrossRef]
  8. Jiangtao, J.; Jingpeng, H.; Shengsheng, W.; Ruihong, Z.; Jing, P. Vibration and impact detection of axial-flow threshing unit under dynamic threshing conditions. INMATEH—Agric. Eng. 2020, 60, 183–192. [Google Scholar] [CrossRef]
  9. Sinha, J.P. Performance evaluation of axial flow and tangential axial flow threshing system for basmati rice (Oryza Sativa). Int. J. Res. Agric. For. 2014, 1, 44–49. [Google Scholar]
  10. Alizadeh, M.R.; Bagheri, I. Field performance evaluation of different rice threshing methods. Int. J. Nat. Sci. Eng. 2009, 3, 139–143. [Google Scholar]
  11. Sessiz, A.; Ulger, P. Determination of threshing losses with a raspbar type axial flow threshing unit. J. Agric. Eng. 2003, 40, 1–8. [Google Scholar]
  12. Bhardwaj, M.; Dogra, R.; Javed, M.; Singh, M.; Dogra, B. Optimization of conventional combine harvester to reduce combine losses for basmati rice (Oryza Sativa). Agric. Sci. 2021, 12, 259–272. [Google Scholar]
  13. Tang, Z.; Zhang, B.; Wang, M.; Zhang, H. Damping behaviour of a prestressed composite beam designed for the thresher of a combine harvester. Biosyst. Eng. 2021, 204, 130–146. [Google Scholar] [CrossRef]
  14. Zhou, X.; Wang, Z.; Tian, L.; Su, Z.; Ding, Z. Innovative design and performance test of threshing-separating device for horizontal axial-flow combine harvester. INMATEH—Agric. Eng. 2022, 67, 497–508. [Google Scholar] [CrossRef]
  15. Miu, P.; Kutzbach, H.D. Simulation of threshing and separation processes in threshing units. Agrartech. Forsch. 2000, 6, SE 1–SE 6. [Google Scholar]
  16. Abdeen, M.A.; Salem, A.E.; Zhang, G. Longitudinal axial flow rice thresher performance optimization using the Taguchi technique. Agriculture 2021, 11, 88. [Google Scholar] [CrossRef]
  17. Su, Z.; Ding, Z.; Tian, L.; Lin, X.; Wang, Z. Design and performance test of variable diameter threshing drum of combine harvester. Food Sci. Nutr. 2021, 9, 4322–4334. [Google Scholar] [CrossRef]
  18. Guan, Z.; Zhang, Z.; Jiang, T.; Li, Y.; Wu, C.; Mu, S. Development and test of speed control system for combine harvester threshing and cleaning device. INMATEH—Agric. Eng. 2020, 61, 305–314. [Google Scholar] [CrossRef]
  19. Song, Z.; Diao, P.; Pang, H.; Zhao, D.; Miao, H.; Li, X.; Yang, D. Design and experiment of threshing and separating device of corn grain harvester. INMATEH—Agric. Eng. 2022, 66, 182–190. [Google Scholar] [CrossRef]
  20. Osueke, C.O. Frictional impact modeling of a cereal thresher. Am. J. Eng. Appl. Sci. 2011, 4, 405–412. [Google Scholar] [CrossRef] [Green Version]
  21. Zhang, S.Z.; Yuzhong, H. Design and test of backpack harvester for sunflowers. J. Mech. Des. 2018, 35, 67–71. [Google Scholar]
  22. Špokas, L.; Steponavičius, D.; Petkevičius, S. Impact of technological parameters of threshing apparatus on grain damage. Agron. Res. 2008, 6, 367–376. [Google Scholar]
  23. Coen, T.; De Baerdemaek, J.; Saeys, W. Throughput control on a combine harvester using stochastic model-based predictive control. Biosyst. Eng. 2010. [Google Scholar] [CrossRef]
  24. Craessaerts, G.; Sayes, W.; Missotten, B.; De Baerdemaeker, J. A genetic input selection methodology for identification of the cleaning process on a combine harvester, Part II: Selection of relevant input variables for identification of material other than grain (MOG) content in the grain bin. Biosyst. Eng. 2007, 98, 297–303. [Google Scholar] [CrossRef] [Green Version]
  25. Chuan-udom, S.; Chinsuwan, W. Effects of operating factors of an axial flow rice combine harvester on grain breakage. Songklanakarin J. Sci. Technol. 2011, 33, 221–225. [Google Scholar]
  26. Li, Y.; Xu, L.; Zhou, Y.; Li, B.; Liang, Z.; Li, Y. Effects of throughput and operating parameters on cleaning performance in air-and-screen cleaning unit. Comput. Electron. Agric. 2018, 152, 141–148. [Google Scholar] [CrossRef]
  27. Bawatharani, R.; Bandara, M.H.M.A.; Senevirathne, D.I.E. Influence of cutting height and forward speed on header losses in rice harvesting. Int. J. Agric. For. Plant. 2016, 4, 1–9. [Google Scholar]
  28. Suliman, A.E.R.; Taieb, A.A.; Atallah, M.M. Development of threshing system in combine harvester for improving of its performance efficiency in rice threshing. Misr J. Ag. Eng. 2012, 29, 143–178. [Google Scholar] [CrossRef]
  29. Li, X.; Du, Y.; Guo, J.; Mao, E. Design, simulation, and test of a new threshing cylinder for high moisture content corn. Appl. Sci. 2020, 10, 4925. [Google Scholar] [CrossRef]
  30. Ali, K.A.M.; Zong, W.; Md-Tahir, H.; Ma, L.; Yang, L. Design, simulation and experimentation of an axial flow sunflower-threshing machine with an attached screw conveyor. Appl. Sci. 2021, 11, 6312. [Google Scholar] [CrossRef]
  31. Miu, P.; Wacker, P.; Kutzbach, H.-D. A comprehensive simulation model of threshing and separating process in axial units part I. Further model development. In Proceedings of the International Conference on Agricultural Engineering, Oslo, Norway, 24–27 August 1998; pp. 533–1064. [Google Scholar]
  32. Xu, T.; Li, Y. Effect of airflow field in the tangential-longitudinal flow threshing and cleaning system on harvesting performance. Adv. Mater. Sci. Eng. 2020, 2020, 4121595. [Google Scholar] [CrossRef]
  33. Audilakshmi, A.S.C.; Solunke, R.B.; Kamatar, M.Y.; Kandalkar, H.G.; Gaikwad, P. Approaches to grain quality improvement in rainy season sorghum in India. Crop Prot. 2007, 26, 630–641. [Google Scholar] [CrossRef]
  34. Srivastava, A.K.; Goering, C.E.; Rohrbach, R.P.; Buckmaster, D.R. Grain harvesting. In Engineering Principles of Agricultural Machines, 2nd ed.; ASABE: Saint Joseph, MI, USA, 2006. [Google Scholar]
  35. Craessaerts, G.; De Baerdemaeker, B.J. Fuzzy control of the cleaning process on a combine harvester. Biosyst. Eng. 2010, 106, 103–111. [Google Scholar] [CrossRef]
  36. Xie, Y.; Alleyne, A.G.; Greer, A.; Deneault, D. Fundamental limits in combine harvester header height control. J. Dyn. Meas. Control 2013, 135, 0345031–0345038. [Google Scholar] [CrossRef] [Green Version]
  37. Yang, R.; Wang, Z.; Shang, S.; Zhang, J.; Qing, Y.; Zha, X. The design and experimentation of EVPIVS-PID harvesters’ header height control system based on sensor ground profiling monitoring. Agriculture 2022, 12, 282. [Google Scholar] [CrossRef]
  38. Masek, J.; Kumhala, F.; Novak, P.; Fic, T. Influence of different threshing system design on grain damage. In Proceedings of the 15th International Scientific Conference Engineering for Rural Development, Jelgava, Latvia, 25–27 May 2016; pp. 756–761. [Google Scholar]
  39. Guan, Z.; Li, H.; Chen, X.; Mu, S.; Jiang, T.; Zhang, M.; Wu, C. Development of impurity-detection system for tracked rice combine harvester based on DEM and Mask R-CNN. Sensors 2022, 22, 9550. [Google Scholar] [CrossRef]
  40. Chai, X.Y.; Xu, L.Z.; Sun, Y.X.; Liang, Z.W.; Lu, E.; Li, Y.M. Development of a cleaning fan for a rice combine harvester using computational fluid dynamics and response surface methodology to optimise outlet airflow distribution. Biosyst. Eng. 2020, 192, 232–244. [Google Scholar] [CrossRef]
  41. Oduori, M.F.; Mbuya, T.O.; Sakai, J.; Inoue, E. Shattered rice grain loss attributable to the combine harvester reel: Model formulation and fitting to field data. Agric. Eng. Int. CIGR Ejournal 2008, 10, 1–25. [Google Scholar]
  42. Kumar, N.; Upadhyay, G.; Choudhary, S.; Patel, B.; Chhokar, R.S.; Gill, S.C. Resource conserving mechanization technologies for dryland agriculture. In Enhancing Resilience of Dryland Agriculture under Changing Climate: Interdisciplinary and Convergence Approaches; Springer Nature: Heidelberg, Germany, 2023; pp. 657–688. [Google Scholar]
  43. Jasper, S.P.; Zimmermann, G.G.; Savi, D.; Strapasson Neto, L.; Leonidas Kmiecik, L.; Sobenko, L.R. Operational performance and energy efficiency of axial harvesters with single and double rotor systems in soybean seed harvest. Ciência Agrotecnologia 2021, 45, e031720. [Google Scholar] [CrossRef]
  44. Priporov, I.E. Mathematical model of the separation process of sunflower seeds in innovative air-sieve grain-cleaning machine. Bulg. J. Agric. Sci. 2022, 28, 362–366. [Google Scholar]
  45. Aliev, E.B.; Yaropud, V.M.; Dudin, V.Y.; Pryshliak, V.M.; Pryshliak, N.V.; Ivlev, V.V. Research on sunflower seeds separation by airflow. INMATEH–Agric. Eng. 2018, 56, 119–128. [Google Scholar]
  46. Tkachev, V.; Borodin, N.; Knyazev, A.; Borovikov, R.; Lebedev, V. Improving the efficiency of separating machines equipped with flat oscillating sieves. In IOP Conference Series: Earth and Environmental Science; IOP Publishing: Bristol, England, 2021; Volume 839, p. 052026. [Google Scholar] [CrossRef]
Figure 1. Constructive schemes of the experimental installation. (a) The axial threshing apparatus. (b) Cross section through the threshing apparatus. 1—material feeding system; 2—threshing machine with axial flow; 3—material feeding area; 4—threshing area; 5—seed separation area; 6—the discharge area for threshed straws and ears; 7—counter-rotor; 8—combined casing-cleaning system.
Agriculture 13 00838 g001
Figure 2. Block of collecting boxes. (a) Before being mounted under the threshing apparatus. (b) Mounted under the threshing apparatus.
Agriculture 13 00838 g002
Figure 3. Laboratory instrumentation. (a) KERN balance for determining the mass of seeds/straws. (b) Memmert oven for determining seed/straw moisture (Author’s own pictures).
Agriculture 13 00838 g003
Figure 4. The variation of total separated material (straw + seeds), Ms, mass of seeds separated, Md, and mass of straw separated in each section (A, B, C, D, E) of the length of the threshing apparatus; A1, B1, C1, D1, E1—the total separated material (straw + seeds), Ms, on each section of the threshing apparatus length; A2, B2, C2, D2, E2—mass of seeds separated, Md, on each section of the threshing apparatus length; A3, B3, C3, D3, E3—mass of straw separated on each section of the threshing apparatus length.
Agriculture 13 00838 g004
Figure 5. Variation in the distribution functions. (a) Function of separated seeds Ss. (b) Function of the distribution density, Sd, along the threshing apparatus length L (where: ♦ experimental points; Agriculture 13 00838 i001 
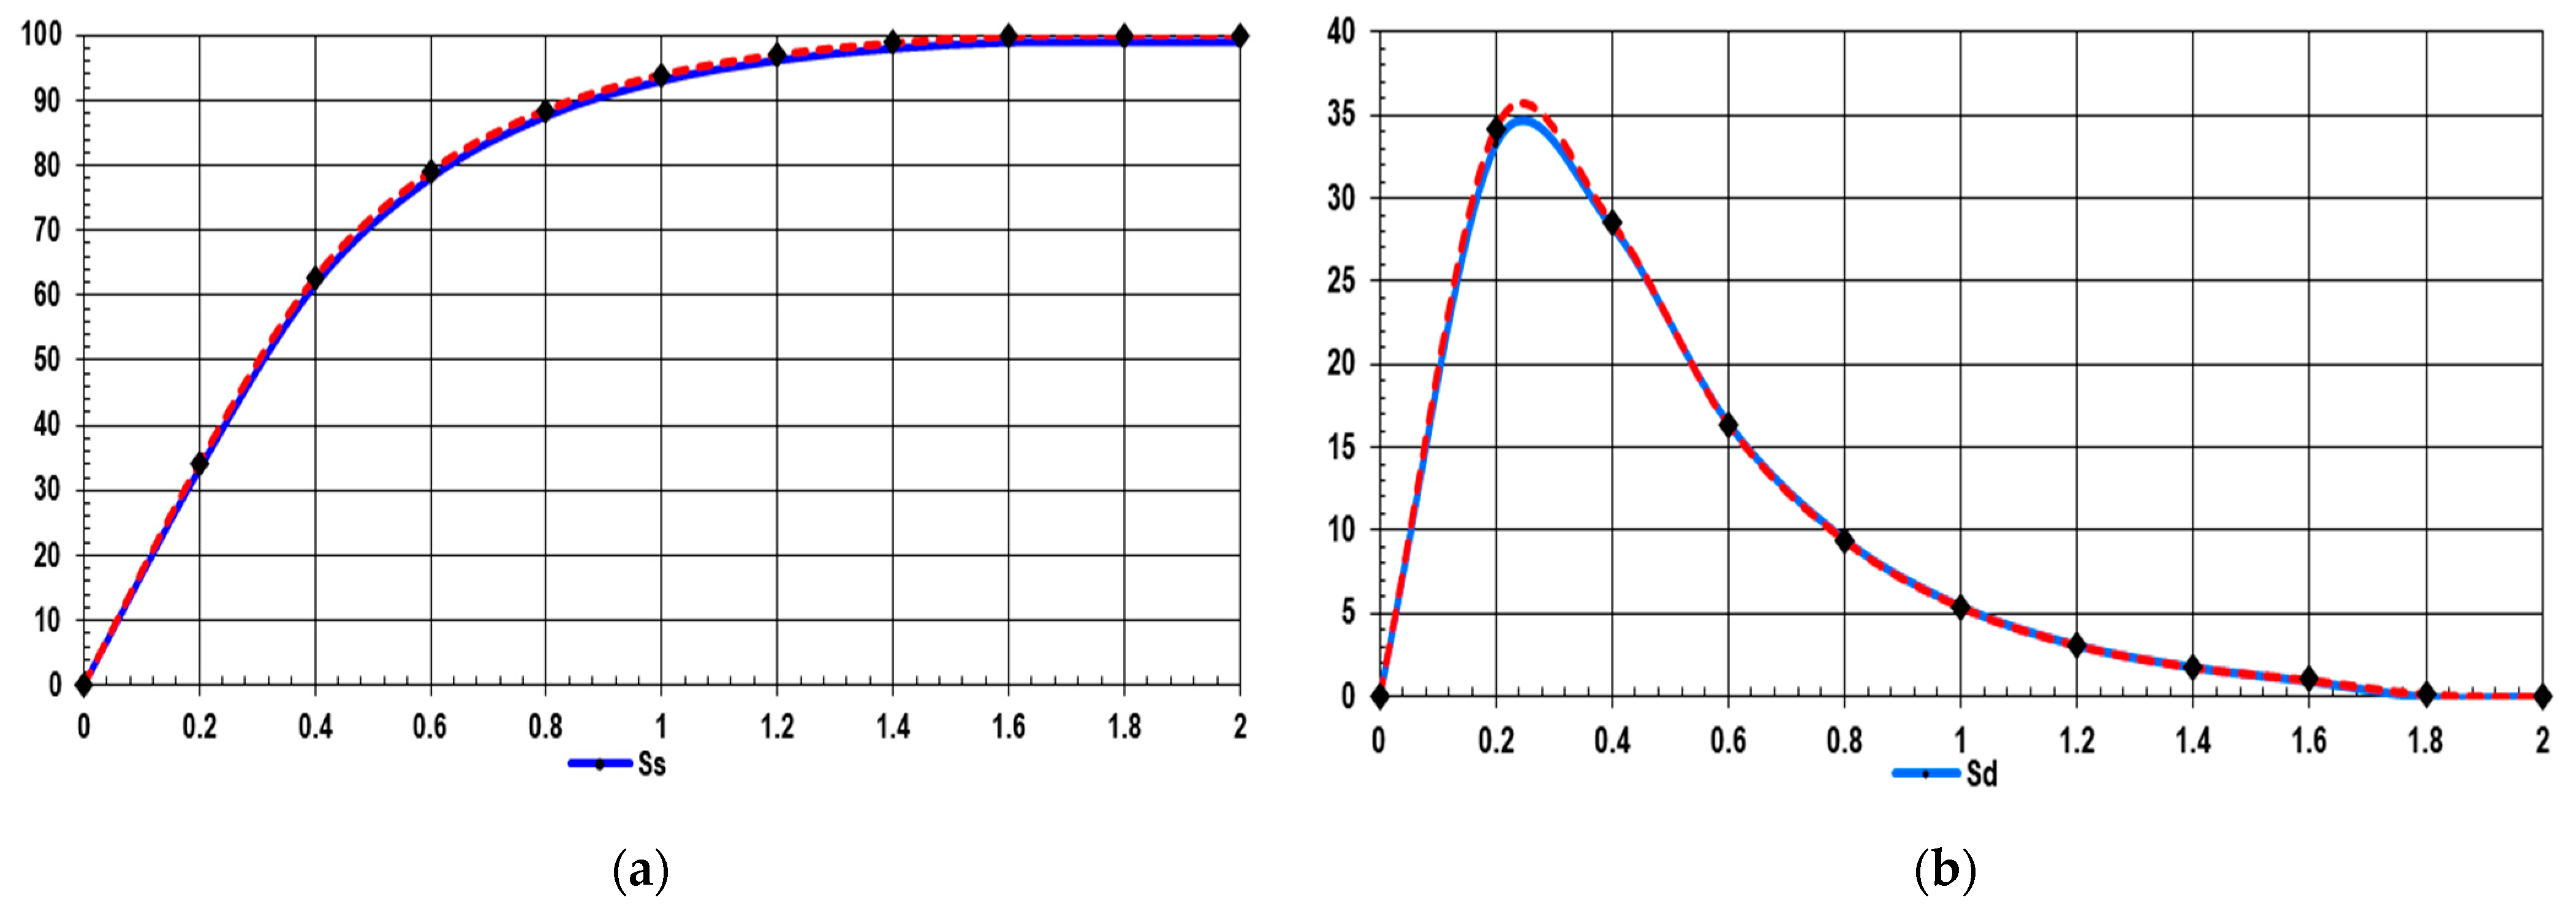
curve drawn by points; Agriculture 13 00838 i002 theoretical curve).
Agriculture 13 00838 g005
Figure 6. The variation of losses (p) depending on the rotor peripheral speed (vp).
Agriculture 13 00838 g006
Figure 7. The variation in losses (p) depending on the feed flow (Q).
Agriculture 13 00838 g007
Figure 8. The variation of losses (p) depending on the space between the rotor and counter-rotor (δ).
Agriculture 13 00838 g008
Figure 9. The variation in losses (p) depending on the feed speed (va).
Agriculture 13 00838 g009
Figure 10. Graphic representation of evacuation losses (pev) as a function of rotor peripheral speed (vp) and feed speed (va).
Agriculture 13 00838 g010
Figure 11. Graphical representation of the evacuation losses (pev) as a function of rotor peripheral speed (vp) and space between the rotor and the counter-rotor (δ).
Agriculture 13 00838 g011
Figure 12. Graphical representation of evacuation losses (pev) as a function of feed speed (va) and space between rotor and counter-rotor (δ).
Agriculture 13 00838 g012
Figure 13. Graphical representation of evacuation losses (pev) as a function of rotor peripheral speed (vp) and feed flow (Q).
Agriculture 13 00838 g013
Figure 14. Graphical representation of the evacuation losses (pev) as a function of space between the rotor and the counter-rotor (δ) and feed flow (Q).
Agriculture 13 00838 g014
Figure 15. Graphic representation of evacuation losses (pev) as a function of feed speed (va) and feed flow (Q).
Agriculture 13 00838 g015
Figure 16. Graphic representation of evacuation losses (pev) as a function of feed speed (va) and feed flow (Q).
Agriculture 13 00838 g016
Table 1. The main parameters of the experiences achieved on the Fundulea 4 wheat variety.
ParameterValue
Ratio of seeds/straw parts1/1.865
Mass of the material5.0 [kg]
Measurement duration4.0 [s]
Flow1.25 [kg/s]
Rotor speed:900 [rpm]
Rotor peripheral speed28.274 [m/s]
Rotor length2000 [mm]
Rotor radius300 [mm]
Space between the rotor and the counter-rotor
(inlet/outlet)
22/5 [mm]
Separated seeds1732.58 [g]
Separated unthreshed seeds0.11 [g]
Evacuation losses12.37 [g]
Deteriorated seeds1.32 [%]
Separated straw parts1216.138 [g]
Evacuated straw parts2038.692 [g]
Seeds moisture15.28 [%]
Straw moisture17.75 [%]
Material feeding speed0.225 [m/s]
Table 2. The total separated material (straw + seeds), Ms, on each section of the threshing apparatus length L (values expressed in [g], respectively [%], and cumulatively [%]).
Li [mm]Separated Material [g]
ABCDETotalCumulative Total
Ms [%]
[g][%]
L1 = 20084.971.3115.963.28.4343.711.6611.66
L2 = 400117.6121.8189.3114.613.7557.018.9030.56
L3 = 600133.8119.2209.8104.917.8585.519.8650.42
L4 = 800105.097.3168.196.040.0506.417.1767.59
L5 = 100079.140.673.283.133.9309.910.5178.10
L6 = 120043.922.131.739.7105.9243.38.2586.35
L7 = 140039.329.723.625.9101.9220.47.4793/82
L8 = 160026.020.537.590.42.1176.55.9899.80
L9 = 18001.020.41.020.52.75.640.1999.99
L10 = 20000.0540.0270.0810.0810.1350.3780.01100.00
Total: [g]
Md [%]
630.674522.927850.201618.381326.5352948.718100.00Length
21.3917.7328.8320.9711.08100.00
Cumulative
total: Ms [%]
21.3939.1267.9588.92100.00Width
Md—mass of material (seeds) separated/length of threshing section; Ms—cumulative seed mass along the threshing length.
Table 3. The variation in the percentage of separated seeds, free seeds, distribution density, and unthreshed seeds along the threshing length of the axial apparatus.
Li [mm]Ss [%]Sd [%]Sl [%]Sn [%]
L1 = 200Ss1 = 12.945Sd1 = 12.945Sl1 = 60.297Sn1 = 26.758
L2 = 400Ss2 = 34.927Sd2 = 21.982Sl2 = 34.620Sn2 = 30.453
L3 = 600Ss3 = 57.310Sd3 = 22.383Sl3 = 19.919Sn3 = 22.771
L4 = 800Ss4 = 78.976Sd4 = 21.666Sl4 = 11.449Sn4 = 9.575
L5 = 1000Ss5 = 90.145Sd5 = 11.169Sl5 = 6.580Sn5 = 3.275
L6 = 1200Ss6 = 94.340Sd6 = 4.195Sl6 = 3.782Sn6 = 1.878
L7 = 1400Ss7 = 97.389Sd7 = 3.049Sl7 = 2.174Sn7 = 0.437
L8 = 1600Ss8 = 99.091Sd8 = 1.702Sl8 = 0.901Sn8 = 0.008
L9 = 1800Ss9 = 99.265Sd9 = 0.174Sl9 = 0.718Sn9 = 0.017
L10 = 2000Ss10 = 99.285Sd10 = 0.020Sl10 = 0.413Sn10 = 0.302
Disclaimer/Publisher’s Note: The statements, opinions and data contained in all publications are solely those of the individual author(s) and contributor(s) and not of MDPI and/or the editor(s). MDPI and/or the editor(s) disclaim responsibility for any injury to people or property resulting from any ideas, methods, instructions or products referred to in the content.

