Abstract
The nitrogen (N) load of broiler meat production is known for its high contribution to the environmental footprint of animal agriculture. The modeling work presented here is to be used as a tool to understand and quantify N excretion via a dynamic mechanistic nutrient partitioning simulation. The model has been developed for broilers, representing energy and protein utilization. Three case studies are presented and discussed, such as (1) feeding schedules with adjusted protein content feeds; (2) feeding diets with different digestibility of crude protein; and (3) feeding diets with the same digestible protein and different SID lysine, methionine plus cystine or threonine contents. In addition to N retention and total N excretion, diagnostic variables for N excretion via urine and obligatory urinary N excretion were studied to evaluate N partitioning in response to different feeding schedules. The excess N was calculated in each scenario for the whole fattening period. This in silico study has confirmed that unprecise diet formulation has considerable consequences: overestimation of digestibility or oversupply of dietary protein increases the total ammonia N in the manure and thus the N emission potential of poultry meat production. The presented approach may be recommended to design alternative feeding strategies with a low environmental footprint.
1. Introduction
In the year 2021, European Parliament adopted a new European Climate Law [1], which aims to drastically reduce greenhouse gas emissions. The law is a part of the European Green Deal (2019) program [2] that is aiming to achieve climate neutrality by 2050. The extent of the demanded reduction is huge, but according to professionals, it can be realized. In order to achieve net zero carbon emissions, not only should CO2 production be mitigated and counterbalanced by carbon sequestration but all other greenhouse gas (GHG) emissions should be reduced. Among GHGs, nitrous oxides are of high risk since they have enormous relative radiative effectiveness (per unit mass), more than 200 times higher than CO2 [3]. According to the European Environment Agency, agriculture is responsible for 94% of ammonia emissions, and animal production, among other broiler farming, contributed to the high N load on the environment. Emissions are mainly from the volatilization of ammonia from livestock manure. Excessive levels of NH3 emitted into the air can be transformed into N-oxides. In the case of leaching into the soil, it can negatively affect aquatic ecosystems such as rivers and lakes by compromising the water quality.
To reach climate neutrality, besides political decisions and acts, the prompt adaptation of relevant research results is also needed. Eurostat’s agri-environmental indicator confirmed the mitigation of the annual atmospheric NH3 emission of almost one-fourth in the EU-28 countries in the period of 1990–2015 [4]. This trend was achieved due to both the genetic improvement of livestock and poultry species and more precise diet formulation. For the latter, to achieve more precise diet formulation, the principal research in the last decades to develop reliable protein evaluation systems and to determine nutrient requirements of different genotypes was essential. The question that arises is whether further improvement in N efficiency is achievable, thus mitigating N excretion.
Since the improvement in the efficiency of animal production is accompanied by the reduction in nutrient excretion, at least in terms of excreted nutrients per head of animals, a tremendous number of research results are available to develop alternatives for environmentally friendly animal feeding strategies. There is a general agreement that avoiding N oversupply as well as improving digestibility and/or availability of dietary protein are the most efficient strategies to mitigate N excretion. Certainly, precise quantitative estimation on the effect of different nutritional strategies would be a great support for further mitigation. According to reports of European Commission reducing NH3 emissions will continue to be a major challenge in Europe, and almost all Member States need to lower emissions to reach their 2030 commitments [5]. For this purpose, mathematical modeling of nutrient use mechanisms, particularly the simulation of N partitioning, might be an efficient and suitable method. In this paper, a modelling work is presented in order to provide a tool to quantify the N excretion in broilers. Our aim is to show some case studies how the N partitioning model can estimate the effect of different feeding strategies on N footprint of broilers. Three different scenarios have been quantitatively evaluated: firstly, the effect of dietary protein content; secondly, the effect of protein digestibility; and thirdly the effect of amino acid limitation.
2. Materials and Methods
2.1. Model Description
A dynamic mechanistic nutrient partitioning model has been developed for broilers to represent energy and protein utilization [6]. The post-digestive model simulates the flow of digestible nutrients (i.e., amino acids, fat, starch, sugars, and residue) and their conversion through intermediary metabolism to produce net protein and lipid gain (Figure 1). The time scale of the model is 1 day, the inputs are digestible nutrients in the feed and characteristic traits of the genotype such as traits describing the feed intake capacity of the bird and traits related to the potential body protein deposition and its dynamics. The feed intake capacity is expressed as the anticipated dietary energy intake at two body weights (i.e., 1 and 2 kg for broilers). Traits related to potential protein deposition include the initial body (and protein) weight, the average protein deposition during the starter-grower-finisher phases (meanPD), and a shape parameter of the protein deposition curve (precocity), which indicates whether the deposition peak occurs in early ages or later.
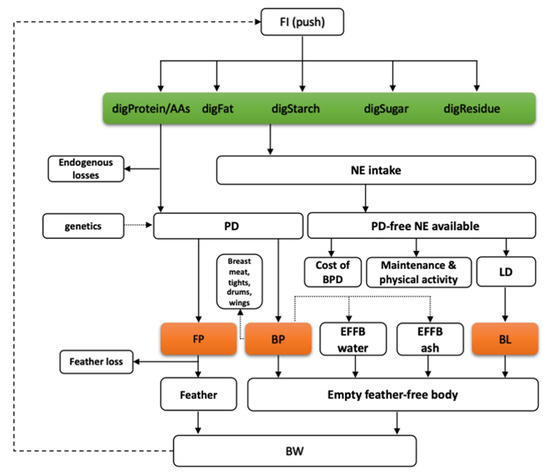
Figure 1.
The flowchart of the nutrient partitioning model for digestible nutrients, including protein (amino acids, digProt, and digAAs), starch (digStarch), sugars (digSugar), lipids (digFat), and residue (digResidue); where: FI—feed intake, NE intake—net energy intake, PD—protein deposition, PD-free NE—protein deposition free net energy, LD—lipid deposition, FP—feather protein, BP—empty feather-free body protein, BL—empty feather-free body lipid, EFFB water—empty feather-free body water, EFFB ash—empty feather-free body ash, BW—body weight [6].
The model simulates N partitioning with particular consideration of dietary protein quality and phenotypic potential of the broiler strains. Ingested digestible amino acids—derived from estimated daily feed intake x digestible amino acid (AA) content of the feed—are used first for maintenance purposes covering (i) endogenous AA loss in the gut depending on dry matter intake, (ii) urinary N loss originating from evitable AA catabolism related to metabolic body weight, and (iii) AAs needed for feather development (including feather growth and recovery of feather loss). The rest of the AAs are potentially used for feather-free body protein deposition. In this process, there is a so-called obligatory AA loss due to the fact that protein deposition is the result of continuous protein synthesis and degradation. Urinary N is the sum of maintenance and the N is from non-utilized dietary protein. This latter is the result of excess protein supplied above the need for genetically determined protein deposition or the result of the unbalanced protein. In the case of feeding unbalanced protein, the limiting essential amino acid (EAA) determines the protein deposition and does not let other amino acids be utilized with their maximum biological efficiency.
The broiler growth model has been validated with independent datasets and showed a good predictive ability in terms of simulating individual birds’ growth response to various nutrient content feeds. It was also proven that the model predicts the chemical composition of gain including daily protein and fat deposition, as well as the body composition of a broiler if the 5 initial model parameters are well established [6].
2.2. Application of the Model to Estimate N Excretion
As mentioned, the model simulates the utilization of digestible protein intake (AAs) and the protein retention of broilers on each day of the simulation. Due to the model structure, the total N excretion as well as its partitioning between faeces and urine can also be estimated (Figure 2).
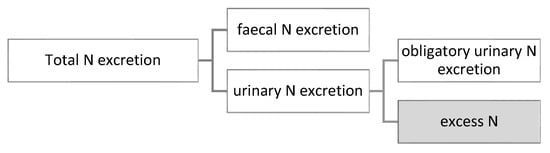
Figure 2.
Partitioning of nitrogen excretion.
The daily total N excretion is calculated as crude protein intake minus protein deposition at a certain day, divided by 6.25, while faecal N excretion (g/day) is calculated from the undigested protein consumption (Equations (1) and (2), respectively).
where —total nitrogen excretion (g/d), —dietary protein intake (g/d), PD—protein deposition (g/d) simulated by the model, —undigestible (faecal) nitrogen excretion (g/d), DFI—daily feed intake (g/d), dietary CP—dietary crude protein content, protein digestibility in the model is about 0.8 (or 80%).
The components of the urinary N excretion (Equation (3)) are the obligatory urinary N losses (Equation (4)) and the surplus (excess) of N (Equation (5)). Obligatory urinary excretion is equal to N needed for maintenance purposes and losses related to protein turnover. Excess N is calculated as digestible N intake subtracting retained N and obligatory N excretion, where digestible N intake and retained N are taken from the model as digestible protein intake and protein accretion, respectively, and divided by 6.25.
where —urinary nitrogen excretion (g/d), —obligatory urinary nitrogen loss (g/d), —urinary nitrogen for maintenance (g/d), —efficiency of empty feather-free body protein deposition (0.85); BPD—empty feather-free body protein accretion (g/d); Excess N—excess of nitrogen (g/d).
The model estimates the partitioning and use of digestible protein supply in the metabolism, thus the need for dietary protein as defined by the phenotypic potential of the broiler can be determined for each day. Figure 3 shows the use of protein in the body as given by the model. The sum of protein used for the maintenance, total protein deposition (empty feather-free body protein deposition plus feather protein deposition as distinguished in the model), as well as the obligatory urinary N excretion related to protein deposition, is the total digestible protein requirement expressed in grams per day. That output was used to design the different scenarios in the present in silico study.
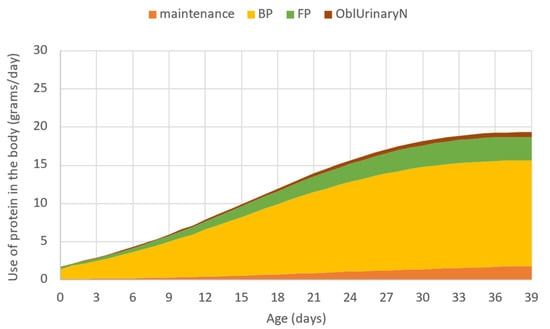
Figure 3.
The use of protein in the body in grams per day simulated by the model, where: maintenance—protein used for maintenance; BP—empty feather-free body protein deposition; FP—feather protein deposition; OblUrinaryN—obligatory excretion related to protein deposition.
2.3. Scenarios of In Silico Studies
The model was calibrated first with the data given in the management guideline of Aviagen for Ross 308 broiler males [7] including adjustment of model outputs to target BW and feed consumption each day. The nutrient content of diets was set according to nutritional recommendations in different phases (Starter, Grower, and Finisher I) [8]. The simulation was run arbitrarily for 39 days with the following initial key parameters: initial BW was 0.048 kg, precocity was 0.0471, meanPD was set as 9.698 g/d and FI1 and FI2 indicating the net energy consumption at 1 and 2 kg body weight were 1.288 and 2.091 MJ/d, respectively.
Three different scenarios were evaluated for the N excretion, such as (1) feeding schedules with adjusted protein content feeds; (2) feeding diets with different digestibility of crude protein; and (3) feeding diets with the same digestible protein, but different SID lysine (Lys), methionine plus cystine (Met + Cys) or threonine (Thr) content.
In addition to N retention and total N excretion given in g per day, diagnostic variables such as N excretion via urine and obligatory urinary N excretion were studied to evaluate the partitioning of N excretion in response to different feeding schedules. The excess N was calculated in each scenario for the whole fattening period too. Further diagnostic variables were computed to evaluate the N footprint of the production. Total ammonia N (TAN) was assumed to be equal to total urinary N excretion, considering that uric acid and ammonia that is the two major N-containing compounds in the urine are used in the so-called TAN-based flow models in the ammonia emission calculations [9]. Moreover, the theoretical maximum efficiency of N utilization was calculated daily as genetically determined protein deposition (g) per its protein requirement (g) considering the 80% digestibility of dietary crude protein.
In the first case study, the feeding schedules (Sc) with adjusted protein content feeds were examined. The control feed sequence plan was according to the recommendation of Aviagen [8] (Sc1) while two alternative strategies were studied as follows: 3-phase-feeding was adjusted to the simulated protein requirement (Sc2) and a 7-phase-feeding schedule (Sc3) with a more gradual decrease in dietary protein levels during fattening (Table 1). The energy content of the feeds was increased from 12.55 MJ/kg to 13.39 MJ/kg in all feeding schedules. Dietary crude protein was decreased from 230 to 195 g/kg, 170 g/kg, or 140 g/kg in Sc1, Sc2, or Sc3, respectively.

Table 1.
Nutrient content of feeds used in different feeding schedules, in Sc1 feeding schedule recommended by Aviagen for Ross 308 (3-phases), in Sc2 feeding schedule adjusted to the simulated crude protein requirement (3-phases), and in Sc3 feeding schedule with smoother adjustment of protein requirement (7-phases).
Practically, the MS Excel version was run separately with the three feeding scenarios for 39 days long fattening. The ratio of EAAs to protein was assumed to be the same in all simulations in each phase. Thus, the AA content of the feeds was proportionally reduced as CP was reduced in different phases, except Lys and Thr in Sc2 in the grower phase. According to the model simulation, in the case of Lys and Thr, their dietary content needed to be kept as it was in Sc1 otherwise they would have become limiting at the beginning of the phase.
The second case study aimed to evaluate the model response to shifts in protein digestibility. In these simulations, the Sc2 as described above was used as a default. This means dietary AMEn content was 12.55, 12.97, and 13.39 MJ/kg, while crude protein content was 230, 210, and 170 g/kg in starting, growing, and finishing phases, respectively. The digestibility of dietary protein and EAAs was settled at 80% as a default value. The simulations were run with the digestibility either higher at 85% (Hdig) or lower at 75% level (Ldig).
As above, the MS Excel version was run separately with the default and the shifted digestibility values, and the performance parameters (body weight, feed intake, and feed conversion) as well as the N excretion and its partitioning were evaluated.
In the third case study, the default simulation was Sc2 as defined above and was run with a reduced individual amino acid content of the feeds in order to model a practical situation when a single AA supply limits the protein deposition. The Lys, Met + Cys, or Thr contents were arbitrarily reduced by 10, 30, or 10%, respectively, in each phase over the whole simulated fattening period. Again, performance parameters and the N excretion and its partitioning were evaluated.
3. Results
The effect of different feeding schedules on the total N excretion, the faecal and the urinary obligatory and excess N excretion, as described in case study 1, is displayed in Figure 4. A reduction in dietary protein (Sc1 vs. Sc2) content resulted in lower total N excretion, as indicated by the orange line. The use of more phases with refinement to the protein requirement resulted in even lower total N excretion (Sc2 vs. Sc3). The N excretion via faeces decreases in the simulated feeding schedules when dietary protein was reduced. The digestibility of crude protein was fixed in the model; thus, the lower CP content obviously resulted in lower faecal N excretion (blue area). The obligatory urinary N loss (grey area), which is attributed to protein deposition, was the same in all scenarios. The yellow area indicates the excess N that decreased drastically in the order of Sc1, Sc2, and Sc3. It can be also seen that the oversupply of N is low at the beginning of the phase and increases over each phase.
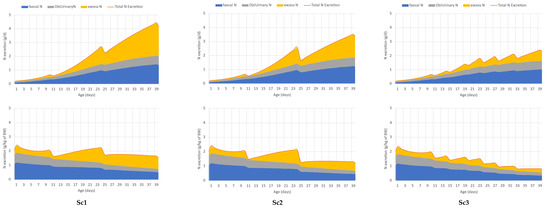
Figure 4.
Case study 1. Effect of different feeding schedules (Sc1—recommendation of Aviagen; Sc2—3-phase feeding adjusted to the simulated protein and AA requirement; Sc3—7-phase feeding schedule with more gradual decrease in dietary protein levels) on total N excretion (orange line) and its partitioning between urinary (obligatory N excretion—grey area and excess N—yellow area) and faecal N excretion (blue area), in grams per day (upper panel) and grams per kg of live weight (down panel).
Table 2 and Table 3 summarize the results of the simulation regarding the performance and N footprint of broilers in different feeding schedules. In case study 1, there are no differences in final body weight (BW), feed consumption (FI), and feed conversion (FCR) among the various scenarios. The numerical difference between BW and FI in the simulations is lower than 0.5%, and only 0.6% for FCR. The relative difference in average daily gain is only 1.5% (70.75 vs. 71.86 g/d) between Sc1 and Sc3. While running a simulation with each of the three feeding schedules, the N retention did not change, and it was 69 g (Table 3). The total N excretion is 76.4, 63.7, and 49.9 g per bird and the TAN also reduced from 47.3 to 37.7 and 26.1 g in Sc1, Sc2, and Sc3, respectively. Since the N intake decreased in each consecutive feeding scenario, while N retention did not, the reduction in excess N (yellow area in Figure 4) with the decreasing dietary protein content is clearly seen and understood. Figure 4 suggests, though it has also been confirmed quantitively, that the efficiency of N utilization improves (from 48.4 to 58.0% in these specific simulations, Table 3) if the protein and amino acid content of the feed is adjusted to the requirements.
Table 2.
Simulated performance in the case studies run with different scenarios.
Table 3.
Simulated performance in the case studies run with different scenarios.
Figure 5 displays the potential maximum N utilization on the basis of the total assuming 80% dietary crude protein digestibility (blue line), and maximum N utilization on the basis of the digestible protein requirement (orange line). As defined earlier, the potential maximum N utilization is calculated for each day by the retained N over the N intake required for maintenance and deposition. Figure 5 clearly shows the effect of age on the efficiency of N use. If the efficiency of N utilization is expressed on a digestible protein requirement basis, it ranges between 80% and 68% (d1–39), and it is 75.8% for the whole simulation. In total N basis (when efficiency is defined as retained N/total N intake), the efficiency of N utilization is worse and ranges from 64% to 54%, with a mean of 60.6% in the simulated 39-day period.
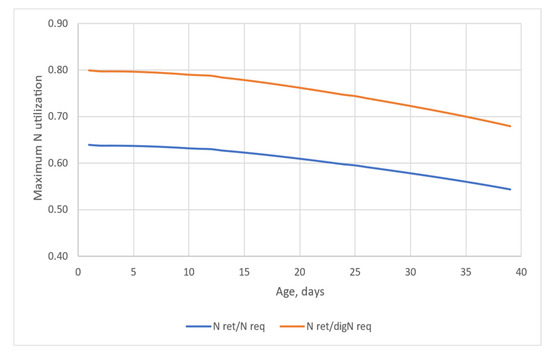
Figure 5.
The theoretical maximum efficiency of N utilization defined as retained protein per protein requirement (N ret/N req; assuming 80% digestibility of dietary protein) or per digestible protein requirement (N ret/digN req) over the age.
Figure 6 demonstrates the output of the simulation carried out in case study 2. The upper graph (a) represents the comparison of model simulation results for the reference vs. lower digestibility protein feeds. The N retention is almost the same in the simulations except between d10–13, which is confirmed numerically in Table 3 as well (N retention is 69.0 vs. 68.67 g), with deviation in total 0.5%. Based on Figure 6a, there is no difference in total N excretion and obligatory urinary N loss, but Table 3 data indicate that total N excretion increased slightly (63.7 to 65.1 g) when the protein digestibility was lower. The total urinary N excretion is lower when the dietary protein had lower digestibility compared to the default situation (Figure 6a). There is approximately a 20% difference in TAN and excess N, and the low digestibility protein feed resulted in lower values, 37.1 vs. 31.6 g TAN, and 23.0 vs. 17.5 g surplus N for the total simulation (Table 3).
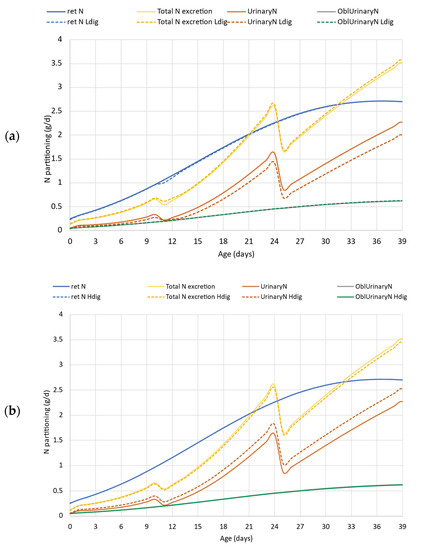
Figure 6.
Case study 2. Effect of lower (80% vs. 75%, upper panel (a)) and higher (80% vs. 85%, down panel (b)) dietary crude protein digestibility on N excretion and its partitioning. ret N—retained nitrogen (g/d); Total N excretion—sum of fecal and urinary N excretions (g/d); Ldig—lower digestibility (75%); Hdig—higher digestibility (85%); UrinaryN—urinary nitrogen excretion, (g/d); OblUrinaryN—obligatory urinary nitrogen loss (g/d).
Comparing the outputs of the simulation where protein digestibility was elevated by 5% (Figure 6b), it can be seen that since the AA requirement of the genetic potential was fulfilled in the default simulation, the improvement in protein digestibility apparently did not change the total N excretion, and only a marginal, 2.5% decrease is confirmed by Table 3 data (63.7 vs. 62.1 g). The higher protein digestibility, however, shifted the form of excreted N, i.e., reduced the faecal to urinary N ratio and increased the TAN by 13.7% (from 37.1 to 42.4 g), but also increased the N excess by more than 20%, from default 23.0 g to 28.3 g (Table 3).
There is no considerable difference in the simulated growth performance of the compared scenarios, the final BW and ADG are the same, and there is only 1% deviation in FI and FCR.
The results of case study 3 are presented in Figure 7. A reduction of each of the EAA in the feed limited the simulated N retention, particularly at the beginning of the grower phase (d11). The daily N retention reached the default curve only at the end of the simulation from d35 (Figure 7a). Between d10 and 15, both the total and the urinary N excretions were higher than that in the default simulation (default simulation denoted with solid lines, simulation for EAAs reduced feed denoted with dotted lines). In the further period, N excretion both in total and via urine was lower in the simulation on Lys, Met + Cys or Thr reduced feed.
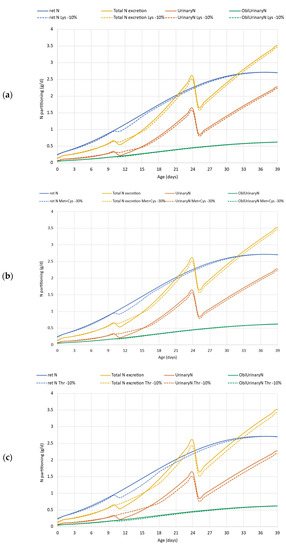
Figure 7.
Case study 3. Effect of reduced dietary digestible lysine (a), methionine + cystine (b) and threonine (c) supply on N retention, total N excretion, and its partitioning. ret N—retained nitrogen (g/d); Total N excretion—sum of fecal and urinary N excretions (g/d); UrinaryN—urinary nitrogen excretion, (g/d); OblUrinaryN—obligatory urinary nitrogen loss (g/d); Lys—lysine; Met + Cys—methionine + cysteine; Thr—threonine.
For the dietary Lys reduction, the cumulative data showed a 2.1% (69 vs. 67.61 g) reduction in N retention, and 1.5 g (63.66 vs. 62.16 g) in N excretion and 0.92 g (37.13 vs. 36.12 g) in TAN (Table 3). ADG conceded from 71.70 to 70.37 g/d, thus declining the final BW (2.92 vs. 2.86 kg) (Table 2). A similar tendency was obtained in other comparisons of case study 3. Limiting the amount of Met + Cys in the diet issued a 2.4% reduction in the N retention (69.0 vs. 67.39 g), and 1.6 g and 1.0 g differences in N excretion and TAN (63.66 vs. 62.06 g and 37.13 vs. 36.17 g), respectively. The compromised N retention resulted in a lower growth rate, ADG decreased from default 71.70 to 70.17 g/d, and resulted in lower final BW (2.92 vs. 2.85 kg; Table 2). The reduction in dietary Thr by 10% limited the N retention that resulted in lower daily gain and final BW compared to the default simulation (69.0 vs. 66.35 g, 71.70 vs. 69.19, 2.92 vs. 2.82 kg, respectively). The lower BW resulted in lower FI and thus lower N intake (132.67 vs. 127.53 g). There was no change in the efficiency of N utilization, thus total N excretion, as well as TAN, were lower in the simulation when dietary Thr was reduced (63.66 vs. 61.18 g and 37.13 vs. 35.67 g). The excess N was higher—15.7% in the case of Lys and Met + Cys limitation, and 14.1% in the case of Thr limitation compared to the reference scenario (22.97 and 26.59, 26.58 and 26.21 g, respectively, for Lys, Met + Cys and Thr).
4. Discussion
High nitrogen and phosphorus (P) concentrations in poultry manure are two major macroelements contributing to many environmental problems, such as water eutrophication, global climate change, and soil acidification [10,11]. In the current in silico study, we are dealing with N excretion and not with P excretion, considering that the National Emission Ceiling Directive of European Union includes ammonia reduction [12] but has no expected mitigation requirement on P.
The presented simulation outputs have confirmed that by formulating feeds close to the nutrient requirement of broilers, the N footprint and particularly urinary N excretion can be reduced considerably. It is well known, however, that too low dietary CP and particularly insufficient dietary AA supply limit protein deposition. The nutrient inputs were set considering the AA and protein requirement of the strain in all scenarios in case study 1. Thus, N retention was the same in all simulations as it was driven by the phenotypic potential of the animal and was not limited by the nutrient supply. The outputs of case study 1 showed that N excretion can be reduced by more than 20% of dietary protein is reduced. It can be further reduced (by 40%) if more phases were implemented with adjusted dietary protein content and consideration of AA requirement. Moreover, it has to be emphasized that the ratio of urinary N that is easily volatilized is shifted from 62% to 58% and 52% in total excretion when comparing Sc1, Sc2, and Sc3 strategies, respectively. Those results are promising for the expected mitigation of ammonia emissions and showed the potential and responsibility of nutrition in environmental loads of broiler production.
Recent in vivo studies have also confirmed that a reduction in dietary protein level might not compromise the protein deposition and growth rate of broilers if the AA supply is in accordance with the requirements [13,14,15,16]. Lemme et al. [14] used a 4-phase feeding in their performance trial and reported no significant difference in slaughter weight and feed conversion of broilers. They used a standard schedule—22.0, 20.6, 20.0, and 19.5% CP, respectively, in starter (1–10 d), grower I (11–16 d), grower II (17–30 d), and finisher feed (31–40 d)—in comparison to an approximately 1.0–1.5% lower protein diet series—21.0, 19.5, 18.7, and 18.0%, respectively. When further reduction in CP was applied (21.0, 19.0, 18.0, and 17.0% CP), the feeds slightly impaired the body weight, but not the feed conversion [15]. In the referred study it seemed that the reduction in dietary protein compromised the growth rate in the first part of the trial. From approximately d19 the growth curves of birds assigned to different treatments were parallel. That phenomenon indicated that the body weight gain was the same in the last two phases and dietary protein content had no impact on it. In line with that result, we confirmed that in the grower phase (d11–24) the CP and the amino acid supply cannot be reduced considerably (Sc1 vs. Sc2). Although, in modern feed manufacturing, feed formulations are based on AAs rather than on protein as it is recognized that birds have a requirement for AAs and not for protein per se [17], if the environmental footprint is evaluated, dietary crude protein should be considered. Lemme et al. [17] emphasized that a minimum CP content of feed in different phases must be respected even if the formulation is in accordance with the ideal AA concept, and the minimum CP in starter (d1–5), grower I (d6–14), grower II (d15–35), and finisher (d35–45) is 22.0%, 20.0%, 18.0%, and 17.0%, respectively. Chrystal et al. [15] also confirmed that dietary CP can be reduced from 210 to 180 g/kg over 14 days of age without negatively influencing broiler performance.
From an environmental point of view, the excreted N via urine is worse than via faeces since urinary N is easily volatilized. TAN, temperature, and pH affect the chemical equilibrium between free ammonium nitrogen NH3 and ammonium ions (NH4+). NH3 is far more toxic to nature as well as to microorganisms (i.e., methanogenic archaea) when producing bioenergy with chicken manure inclusion [18]. Typically, the pH of chicken manure when excreted and the pH of litter are between 7.5 and 8.5, and around 50 to 80% of the N in manure is converted to NH3 [19]. The microorganisms, particularly bacteria, presented in the manure are responsible for the ammonification. In this process, microorganisms mineralize low molecular weight, dissolved molecules presenting amine or amide groups (of general formula R-NH2), and produce ammonium (NH4+). The simpler the molecule, for example, the uric acid that is the major N compound in poultry urine, the quicker the process is. Consequently, the TAN that is derived from the urinary N has a particular interest, and thus not only the amount of excreted N in total but the partitioning of N excretion via faeces and urine matters when N footprint is evaluated [20]. According to Groenstein et al. [21], poultry, particularly broiler chicken, have the highest N utilization efficiency and the lowest ammonia N losses. However, the question rises what is the maximum efficiency that might be achieved. We believe that our in silico approach can answer that question. In the simulation run from d1 to d39 the efficiency of N utilization declined with age. That phenomenon was confirmed by Such et al. [16] in their in vivo study as well. It is obvious that the efficiency of N utilization in terms of retained N per N intake is highly dependent on the digestibility of dietary protein. Lemme et al. [14] obtained maximum of 64.9% N efficiency in their broiler study when the CP in different phases were the lowest and the AA content was according to the ideal protein concept. This value, however, seems high compared to our theoretical maximum value ranging from 64% to 54%, from d1 to d39. The discrepancy in the values may have different reasons. If instead of 80% default, 90% digestibility is implemented for dietary CP, the theoretical efficiency of N utilization on total N intake basis is 68% in the model calculation. This is in line with the trial data considering that in phase feeding the theoretical maximum N efficiency cannot be reached. Furthermore, the difference between the in silico and in vivo values obtained could be explained by either the overestimation of maintenance and obligatory N loss in the model or some N loss in the broiler study of Lemme et al. [14].
The CP content of the feed is routinely measured in practice. The digestibility of dietary protein is not determined, but table values are used in diet formulation. Digestible nutrient (particularly AA) content is additively calculated for the mixed feeds. In general, the digestibility (or availability) may be improved (e.g., enzyme supplementation) or compromised (e.g., over-processing) by heat treatment, which can potentially lead to a reduction in AA availability due to the Maillard reaction [22,23,24].
The results of our second case study showed how important is to know the digestibility of dietary protein when the environmental footprint is evaluated. In the case of formulating the feeds in different phases close to the requirements and the digestibility is lower than expected in the diet formulation, the improper feed may be limiting in necessary nutrients for growth. As reported, it would increase the feed consumption for a certain period of time, while to some measure delaying the growth performance via indulging the abdominal fat increment [13]. When the simulation was run with a lower digestibility protein (Ldig) feed, there was a small glitch in N retention in the first days of the grower phase (Figure 6a) that does not make a considerable impact on the later performance including the growth rate, final body weight, and N retention (Table 2 and Table 3). This glitch is caused by the limiting amount of several AAs entering the metabolism due to their lower digestibility. Thus, the total N excretion was slightly higher in the lower digestibility protein feed compared to the default simulation. The daily feed intake was modeled based on the energy intake. As the diets were isocaloric for each case, the lower digestibility protein slightly increased the feed intake with the Ldig scenario. The results on the shift in faecal to urinary N ratio, and particularly the decrease in TAN value emphasized the importance of precise diet formulation and that magnitude of oversupplied N entering the metabolism is much more harmful from an environmental point of view than the non-digested protein excreted via faeces.
Our results confirmed that in formulating feed with higher than expected protein digestibility (Hdig, Figure 6b), the urinary N excretion increases due to the excess of digested N entering the metabolism. As N cannot be retained at a higher amount (in terms of g/day) that is allowed by the genotype, the higher digestible protein and AA supply results in higher surplus N in the metabolism, but that cannot be utilized in the metabolism and must be excreted. The lower faecal N to urinary N ratio results in higher TAN in both absolute and relative terms. Hence, it can be concluded that using feed supplements or specific feed processing technology to improve protein digestibility is beneficial only if the diet is formulated on digestible protein and AA basis [17,25].
The 5% difference compared to the default value in digestibility coefficient may be too high from the practical point of view. However, the old dataset of Sibbald et al. (1986) showed a very wide range of amino acid digestibility—10 to 15% difference in true digestibility of individual AAs—in wheat, barley, and soybean meal samples [26]. Thus, the use of an imprecise table value may cause a 5–10% difference in CP digestibility. Moreover, the ileal digestibility of CP and AAs varies between protein source origin and treatments [27] and enzyme supplementation has a different impact on the digestibility coefficient of AAs [28]. Our case study showed that from an environmental point of view, it is more critical to underestimate the digestibility value or ignore the improvement of digestibility if for instance enzyme supplementation is used, compared to overestimation of CP digestibility since it results in a higher total ammonia N.
Case study 3 aimed to evaluate the environmental footprint when AA supply is limiting. In this example, 30% less Met + Cys supply was chosen compared to the reference simulation (Sc2). This situation might be the result of the lack of AA supplementation in a corn-soybean meal-based feed that is known as being deficient in sulfuric AAs. Sulfuric AA supply has high importance in poultry nutrition since it is highly demanded in feather development. The model simulation presented in Figure 7b, however, showed that the relatively high extent of reduction in Met + Cys supply has a moderate impact on protein deposition (viz. N retention). This is because dietary Met + Cys does not exactly match the requirement and Met + Cys is slightly oversupplied in the default simulation (Sc2). The result of the simulation, however, may indicate that the Met + Cys requirement should be reconsidered in modern hybrids. In addition, the relative insensitivity of the model may be due to the fact that in the model the Met + Cys are considered as one AA flow, with an efficiency of 0.6 for a feather-free body [29] and 1 for a feather. The model, therefore, is not very sensitive to changes in dietary Met level solely. Thus, in simulations, dietary Met and Cys have the same impact on the production, while in the metabolism Met cannot be replaced by Cys in many processes.
The impact of the reduction in AA supply obviously depends on the reference situation. The output for the decrease of 10% Lys and 30% of dietary Met + Cys had almost the same impact on growth performance and N retention. Compared to them, the impact of a 10% reduction in dietary Thr was somewhat higher resulting in more depressed daily gain and final BW, as well as N retention. According to the simulation, a 30% reduction in Met + Cys decreased the final BW by 70 g, while a 10% decrease in Thr or Lys decreased it by 100 g, and 60 g, respectively, while having no impact on FCR. The compromised N retention by AA limitation resulted in a lower growth rate. Thus, it has been confirmed that a moderated AA supply leads to lower BW each day. Since BW is a determinant in the model calculation for the actual daily feed consumption, the lower BW slightly reduced the simulated feed intake and N intake too. Unexpectedly, the urinary N excretion, and thus the TAN, is lower in the simulation when the AAs were limiting (Figure 7 and Table 3). Although N excretion values are not directly confirmed, it is still a concern that AA limitation has a negative impact on the N footprint. Our simulation proves that the loss of performance and the change in the supply of utilizable AAs resulted in higher N excess over the fattening period (viz. 3.62, 3.61, or 3.24 g more excess N being around 16% and 14% higher than the default) if Lys, Met + Cys or Thr was limiting. Our results have confirmed that reduction in dietary AA content was more critical in the starter and particularly in the grower phase since the N retention was compromised the most in the grower phase in all scenarios.
The modeling approach has also been used in other studies to evaluate the N footprint of farm animals. Bikker et al. [19] developed a linear programming model to estimate the total tract protein digestibility as well as to optimize feed composition based on dietary crude protein, prices of the feed compounds, and season. The calculated average N digestibility of the feed is then used to calculate the TAN excretion of farm animals, including broiler chicken with consideration of total N intake, digestibility, and N retention. In parallel with Bikker’s project, Van Bruggen et al. [30] and Velthof et al. [31] developed a deterministic N flow model to estimate the TAN-based NH3-inventory (National Emission Model for Ammonia; NEMA) that has been used for calculating ammonia emission from agriculture in the Netherlands. In that model, the N excreted is calculated as the difference between the intake of N and retention of N in animal products, using standard N balance calculation methods (e.g., Canh et al., [32]; Valk, [33]; Wilkerson et al., [34]). The fraction of TAN in the N excretion is calculated as the excretion of urinary N, which is the digested part of the N in the feed not converted into animal products, the undigested N is excreted as faecal N. The NEMA model has been adopted by the European Commission too [31]. The additional value of our approach is that the N retention is estimated more precisely than the referred methods. Therefore, we believe that the use of an N partitioning model as presented in this paper can be applied in the inventory calculation and may further refine the method of calculating the TAN produced in broiler production. Our dynamic mechanistic model predicts the retained N in broilers, as well as gives a user-friendly tool to study the rate of faecal and urinary N excretion. Thus, it is suitable to precisely estimate the TAN values and to evaluate feeding strategies from an environmental point of view when digestible dietary inputs are applied.
5. Conclusions
This in silico study has confirmed that diet formulation must be based on digestible AA requirements using as many phases as possible; otherwise, the urinary N excretion increases. The theoretical maximum efficiency of N utilization depends on age, and it is more reliable to account for it on digestible protein rather than total protein requirement basis. The maximum efficiency of digestible protein utilization is 80% in the early ages of broilers, and it declines to 68% around slaughter. In the case of formulating the feeds close to the requirements, the deviation from the target values has considerable consequences. The oversupply of dietary protein—either due to the use of safety margin or underestimation of protein digestibility—increases the total ammonia N in the manure and thus the N emission potential of poultry meat production. An overestimation of digestible AA supply may not only limit the production and, therefore, result in economic loss and also impair the efficiency of N utilization, even if it has a low to moderate impact on N excretion by shifting from the urinal to a faecal N excretion. The use of the modeling approach presented in this paper allows a better understanding of the feed use mechanism and quantifies the N excretion under different circumstances. The model may be recommended to design alternative feeding strategies for broiler production with low environmental footprints.
Author Contributions
Conceptualization—G.D. and V.H.; methodology, G.D.; software, G.D.; validation, G.D.; formal analysis, G.D. and V.H.; investigation, G.D. and V.H.; resources, V.H.; data curation, G.D. and V.H.; writing—original draft, G.D. and V.H.; writing—review and editing, G.D. and V.H.; visualization, G.D. and V.H.; supervision, V.H.; project administration, G.D. and V.H.; funding acquisition, V.H. All authors have read and agreed to the published version of the manuscript.
Funding
This project was funded by European Union’s Horizon 2020 research and innovation programme “Feed-a-Gene” under grant agreement No 633531, and co-financed by the European Union Social Fund under grant agreement No EFOP-3.6.3-VEKOP-16-2017-00005, project title “Strengthening the scientific replacement by supporting the academic workshops and programs of students, developing a mentoring process”.
Institutional Review Board Statement
Not applicable.
Data Availability Statement
No new data were created or analyzed in this study. Data sharing is not applicable to this article.
Conflicts of Interest
The authors declare no conflict of interest.
References
- Regulation (EU) 2021/1119 of the European Parliament and of the Council of 30 June 2021 Establishing the Framework for Achieving Climate Neutrality and Amending Regulations (EC) No 401/2009 and (EU) 2018/1999 (“European Climate Law”). Available online: https://eur-lex.europa.eu/eli/reg/2021/1119/oj (accessed on 26 March 2023).
- European Green Deal. Available online: https://ec.europa.eu/commission/presscorner/detail/en/ip_19_6691 (accessed on 1 December 2022).
- First Assessment Report Overview and Policymaker Summaries, in Climate Change: The IPCC 1990 and 1992 Assessments; World Meteorological Organization, United Nations Environment Programme: IPCC. Available online: https://www.ipcc.ch/report/climate-change-the-ipcc-1990-and-1992-assessments/ (accessed on 1 December 2022).
- Eurostat. Archive: Agri-Environmental Indicator-Ammonia Emissions-Statistics Explained. 2017. Available online: https://ec.europa.eu/eurostat/statistics-explained/index.php?oldid=357966 (accessed on 1 December 2022).
- Emissions of the Main Air Pollutants in Europe. Available online: https://www.eea.europa.eu/ims/emissions-of-the-main-air (accessed on 1 December 2022).
- Dukhta, G.; van Milgen, J.; Halas, V. Description of a dynamic mechanistic model to simulate nutrient partitioning and growth in broilers. Poult. Sci. 2023. submitted. [Google Scholar]
- Ross 308 AP 2017 Performance Objectives; Aviagen: Huntsville, AL, USA; Available online: http://www.aviagen.com (accessed on 26 March 2019).
- Ross 308 AP 2017 Nutrition Specifications; Aviagen: Huntsville, AL, USA; Available online: http://www.aviagen.com (accessed on 26 March 2019).
- EMEP/EEA. Air Pollutant Emission Inventory Guidebook 2019—Publications Office of the EU. Available online: https://op.europa.eu/en/publication-detail/-/publication/ce310211-4bc5-11ea-8aa5-01aa75ed71a1/language-en (accessed on 12 December 2022).
- Angel, R.; Powers, W. Broiler production and the environment. In Bulletin No. EB368; College of Agriculture and Natural Resources, University of Maryland: Baltimore, MD, USA, 2006. [Google Scholar]
- Gerber, P.; Opio, C.; Steinfeld, H. Poultry Production and the Environment—A Review; Animal Production and Health Division, Food and Agriculture Organization of the United Nations: Roma, Italy, 2007; p. 153. [Google Scholar]
- Directive (EU) 2016/2284 of the European Parliament and of the Council of 14 December 2016 on the Reduction of National Emissions of Certain Atmospheric Pollutants, Amending Directive 2003/35/EC and Repealing Directive 2001/81/EC (OJ L 344, 17.12.2016, pp. 1–31). Available online: http://data.europa.eu/eli/dir/2016/2284/oj (accessed on 3 January 2023).
- Widyaratne, G.P.; Drew, M.D. Effects of protein level and digestibility on the growth and carcass characteristics of broiler chickens1. Poult. Sci. 2011, 90, 595–603. [Google Scholar] [CrossRef] [PubMed]
- Lemme, A.; Hiller, P.; Klahsen, M.; Taube, V.; Stegemann, J.; Simon, I. Reduction of dietary protein in broiler diets not only reduces N-emissions but is also accompanied by several further benefits. J. Appl. Poult. Res. 2019, 28, 867–880. [Google Scholar] [CrossRef]
- Chrystal, P.V.; Moss, A.F.; Khoddami, A.; Naranjo, V.D.; Selle, P.H.; Liu, S.Y. Impacts of reduced-crude protein diets on key parameters in male broiler chickens offered maize-based diets. Poult. Sci. 2020, 99, 505–516. [Google Scholar] [CrossRef]
- Such, N.; Pál, L.; Strifler, P.; Horváth, B.; Koltay, I.A.; Rawash, M.A.; Farkas, V.; Mezőlaki, Á.; Wágner, L.; Dublecz, K. Effect of feeding low protein diets on the production traits and the nitrogen composition of excreta of broiler chickens. Agriculture 2021, 11, 781. [Google Scholar] [CrossRef]
- Lemme, A.; Ravindran, V.; Bryden, W.L. Ileal digestibility of amino acids in feed ingredients for broilers. World's Poult. Sci. J. 2004, 60, 423–438. [Google Scholar] [CrossRef]
- Cai, Y.; Gallegos, D.; Zheng, Z.; Stinner, W.; Wang, X.; Pröter, J.; Schäfer, F. Exploring the combined effect of total ammonia nitrogen, pH and temperature on anaerobic digestion of chicken manure using response surface methodology and two kinetic models. Bioresour. Technol. 2021, 337, 125328. [Google Scholar] [CrossRef]
- Ritz, C.W.; Fairchild, B.D.; Lacy, M.P. Implications of ammonia production and emissions from commercial poultry facilities: A review. J. Appl. Poult. Res. 2004, 13, 684–692. [Google Scholar] [CrossRef]
- Bikker, P.; Van Krimpen, M.M.; Remmelink, G.J. Stikstofverteerbaarheid in voeders voor landbouwhuisdieren: Berekeningen voor de TAN-excretie. In WOT Werkdocument (No. 224); Wettelijke Onderzoekstaken Natuur & Milieu: Wageningen, The Netherlands, 2011. (In Dutch) [Google Scholar]
- Groenestein, C.M.; Hutchings, N.J.; Haenel, H.D.; Amon, B.; Menzi, H.; Mikkelsen, M.H.; Misselbrook, T.H.; Van Bruggen, C.; Kupper, T.; Webb, J. Comparison of ammonia emissions related to nitrogen use efficiency of livestock production in Europe. J. Clean. Prod. 2019, 211, 1162–1170. [Google Scholar] [CrossRef]
- Ravindran, V.; Cabahug, S.; Ravindran, G.; Bryden, W.L. Influence of microbial phytase on apparent ileal amino acid digestibility of feedstuffs for broilers. Poult. Sci. 1999, 78, 699–706. [Google Scholar] [CrossRef]
- Bryan, D.D.; MacIsaac, J.L.; McLean, N.L.; Rathgeber, B.M.; Anderson, D.M. Nutritive Value of Expeller-Pressed Yellow Canola Meal for Broiler Chickens Following Enzyme Supplementation. J. Appl. Poult. Res. 2019, 28, 1156–1167. [Google Scholar] [CrossRef]
- Dunmire, K.M.; Braun, M.B.; Evans, C.E.; Fallen, B.D.; Stark, C.R.; Paulk, C.B. Determining the apparent ileal digestibility of amino acids for soybean meal from select soybean varieties with varying levels of crude protein. J. Appl. Poult. Res. 2023, 100333. [Google Scholar] [CrossRef]
- Kumar, C.B.; Gloridoss, R.G.; Singh, K.C.; Prabhu, T.M.; Suresh, B.N. Performance of broiler chickens fed low protein, limiting amino acid supplemented diets formulated either on total or standardized ileal digestible amino acid basis. Asian-Australas. J. Anim. Sci. 2016, 29, 1616. [Google Scholar] [CrossRef]
- Johnson, R.J. Principles, problems and application of amino acid digestibility in poultry. World's Poult. Sci. J. 1992, 48, 232–246. [Google Scholar] [CrossRef]
- Sheikhhasan, B.S.; Moravej, H.; Shivazad, M.; Ghaziani, F.; Esteve-Garcia, E.; Kim, W.K. Prediction of the total and standardized ileal digestible amino acid contents from the chemical composition of soybean meals of different origin in broilers. Poult. Sci. 2020, 99, 4947–4957. [Google Scholar] [CrossRef]
- Bryden, W.L.; Li, X. Digestibilidade de aminoácidos e formulação de rações para aves: Expressão, limitações e aplicações. Rev. Bras. De Zootec. 2010, 39, 279–287. [Google Scholar] [CrossRef]
- Pacheco, L.G.; Sakomura, N.K.; Suzuki, R.M.; Dorigam, J.C.; Viana, G.S.; Leme, B.B. Efficiency of methionine and cystine utilization by broiler chickens using stable isotopes. J. Anim. Physiol. Anim. Nutr. 2020, 104, 224–229. [Google Scholar] [CrossRef]
- Van Bruggen, C.; Groenestein, C.M.; de Haan, B.J.; Hoogeveen, M.W.; Huijsmans, J.F.M.; Sluis, S.M.; Velthof, G.L. Ammonia Emissions from Animal Manure and Inorganic Fertilisers in 2009: Calculated with the Dutch National Emissions Model for Ammonia (NEMA) (No. 302); Wettelijke Onderzoekstaken Natuur & Milieu: Wageningen, The Netherlands, 2012. [Google Scholar]
- Velthof, G.L.; Van Bruggen, C.; Groenestein, C.M.; De Haan, B.J.; Hoogeveen, M.W.; Huijsmans, J.F.M. A model for inventory of ammonia emissions from agriculture in the Netherlands. Atmos. Environ. 2012, 46, 248–255. [Google Scholar] [CrossRef]
- Canh, T.T.; Aarnink, A.J.A.; Schutte, J.B.; Sutton, A.; Langhout, D.J.; Verstegen, M.W.A. Dietary protein affects nitrogen excretion and ammonia emission from slurry of growing–finishing pigs. Livest. Prod. Sci. 1998, 56, 181–191. [Google Scholar] [CrossRef]
- Valk, H. Effects of partial replacement of herbage by maize silage on Nutilization and milk production of dairy cows. Livest. Prod. Sci. 1994, 40, 241–250. [Google Scholar] [CrossRef]
- Wilkerson, V.A.; Mertens, D.R.; Casper, D.P. Prediction of excretion of manure and nitrogen by Holstein dairy cattle. J. Dairy Sci. 1997, 80, 3193–3204. [Google Scholar] [CrossRef] [PubMed]


Disclaimer/Publisher’s Note: The statements, opinions and data contained in all publications are solely those of the individual author(s) and contributor(s) and not of MDPI and/or the editor(s). MDPI and/or the editor(s) disclaim responsibility for any injury to people or property resulting from any ideas, methods, instructions or products referred to in the content. |
© 2023 by the authors. Licensee MDPI, Basel, Switzerland. This article is an open access article distributed under the terms and conditions of the Creative Commons Attribution (CC BY) license (https://creativecommons.org/licenses/by/4.0/).