Abstract
Pests are always the main source of field damage and severe crop output losses in agriculture. Currently, manually classifying and counting pests is time consuming, and enumeration of population accuracy might be affected by a variety of subjective measures. Additionally, due to pests’ various scales and behaviors, the current pest localization algorithms based on CNN are unsuitable for effective pest management in agriculture. To overcome the existing challenges, in this study, a method is developed for the localization and classification of pests. For localization purposes, the YOLOv5 is trained using the optimal learning hyperparameters which more accurately localize the pest region in plant images with 0.93 F1 scores. After localization, pest images are classified into Paddy with pest/Paddy without pest using the proposed quantum machine learning model, which consists of fifteen layers with two-qubit nodes. The proposed network is trained from scratch with optimal parameters that provide 99.9% classification accuracy. The achieved results are compared to the existing recent methods, which are performed on the same datasets to prove the novelty of the developed model.
1. Introduction
Crop pests are among the key factors that lower the productivity and quality of the crop. Therefore, both academics and businesses are paying close attention to the efficient prevention and management of pest species. The most effective method used to control crop pests is the use of agrochemicals. However, farmers who lack the knowledge to identify pests recklessly apply vast quantities of pesticides, endangering not only their health but also the environment and soil [1]. The real-time monitoring of agricultural pests at an early stage, according to the integrated pest management (IPM) theory, could lessen the damage caused by careless use of pesticides. To improve the situation, forecasting, proper identification, and localization of crop pests are crucial first steps [2]. Pest classification initially relied heavily on agricultural professionals with technical knowledge, which was time consuming and caused lags in farmers’ information [3]. The disparity between the growing need for precise and real-time insect identification and the dearth of professionals who can meet it is indeed growing. Therefore, fast and accurate automatic detection of pest systems must be proposed [4]. Three methods can be used to assess the number of agricultural pests in a field, per an examination of recent literature: (1) manual monitoring and measuring, which takes time and delays the release of agricultural statistics; (2) multi-dimensional data, such as field temperature and moisture levels, which can be utilized to calculate the level of pest prevalence in the absence of precise data; (3) employing trapping devices to capture photos of agricultural pests, then counting the pests using object tracking detection methods [5]. The third method was adopted as the primary location for crop pest monitoring studies. Manual monitoring and identification of pest diseases are time-consuming and error-prone assignments [6]. Computerized methods play a significant role in pest disease detection. Currently, more attention is paid to ML methods to conquer challenges relating to the detection of pest disease. In ML models SVM, ANN, AdaBoost, MLR, and decision trees are utilized based on the hand-crafted features used for the analysis of plant pests [7,8]. Deep learning methodologies rely on convolutional kernels that provide innovative results to overcome the problems of ML methods. Compared to ML models, DL ascertains automatically significant features from training plant data and allows the users to develop end-to-end systems, avoiding processing the input images separately [9]. Achieving good results in a variety of object detection and classification tasks using DL has been made possible by exceptional CNNs performance [10]. K-means clustering is employed to segment the pest disease after the custom 2D-CNN model is used to predict pest/normal images. Moreover, pre-trained models such as VGG-16,19, Xception, Mobile-Net, Dense-Net201, NAS-Net-Mobile, and InceptionResNet-v2 are fine-tuned for pest disease classification [11]. The empirical research observes that k-means performed better compared to watershed and thresholding methods. In the classification experiment, the custom CNN model provides 0.96 prediction accuracy, while transfer learning Mobile-Net and InceptionRes-Net-V2 provides 0.82 and 0.81 prediction accuracy [12]. To improve the detection accuracy, we investigate the segmentation based on DL. The size of the pest dataset needs to be increased and must include the grading of the pest infections [13]. The Faster RCNN model is applied for the recognition of five types of pests such as Cicadellidae, Flea Beetles, Aphids, Red spiders, and Flax Budworm. The results are computed in terms of precision of 0.50 on mobile-net, 0.86 on SSD, and 0.98 on the F-RCNN model. After the experimental analysis, we conclude that F-RCNN performs better compared to Mobile-Net and single-shot detectors [14]. The deep convolutional network is used for pest disease detection. The transfer learning ResNet-50 model is also applied and fine-tuned using the optimal hyper-parameters for pest disease classification. This model provides average accuracy of 0.95 [15].
Although sufficient work has been conducted based on the detection of pest disease, there is still room for improvement [16]. Occlusion, one of the main challenges, is caused by changes in the position of the blade and external lighting. The DL model training is difficult due to the occlusion problem, which leads to false detection. To overcome the existing challenge, two models are proposed for more accurate localization and classification of pest diseases. The core contributions of this research are as follows:
- ▪ The YOLOv5 is designed based on optimal learning parameters for the recognition of pests in RGB images.
- ▪ The novel quantum machine learning model is designed on the selected layers and trained on the selected hyperparameters that help with the accurate classification of Paddy with/without pest images.
2. Related Work
In this method, an optimum super-resolution model is applied to enhance the quality of images. The pest region is localized using D2Det’s model. The proposed model provides detection scores of the 0.78 mAp [17]. The regional proposal network is used for rich feature extraction, which provides an mAP of 0.78 on the AgriPest21 dataset [18]. The multi-features fusion network is used for pest classification, in which dilated convolution is applied for features extraction and deep features are also derived using the deep features extraction network. Finally, the extracted features are fused for classification. This model provides 98.2% accuracy for the classification of 12 different types of pest diseases [19]. The attention model based on activation mapping is used for pest classification. In this model, tiny pest regions are detected using weighted mapping of activation, prediction scores, and labels with an average accuracy of 68.3 ± 0.3 [20]. In the saliency discriminative guided model, two types of branches are utilized: raw and fine grained. In the raw branch, coarse-grained features such as global and features fine-grained modules are used as a raw branch. A salient object detection model is used for the localization of pest diseases [21]. The pretrained Mobile network is used for pest disease classification. This model is trained on optimal parameters, which are selected after extensive experimentation. The results are computed on the IP102 dataset, which provides an accuracy of 0.916 [22]. The regional CNN model is used for pest disease detection with 100% accuracy for palm-infected trees [23]. The multi-detection pest model is used to localize the pest region in which the feature pyramid multi-scale model and adaptive novel regional proposal model are included. The results are computed using a multi-pests MP-2021 dataset that provides a 0.67 precision rate and 0.89 recall [24]. The super-resolution multi-scale network and soft IoU models are used for enhancement. The results are computed on the LLPD-26 pest classes dataset, which contains 18,585 pest images with an mAP of 0.67 [25]. The four-step network is proposed for pest disease detection in this network acquired frames of videos are de-noised using the Bayesian model. The guided context residual model is applied for segmentation that is fed to the CNN model to establish a model for the detection of pest diseases with a 0.99 mAP [26]. Pre-trained Resnet-50 uses the backbone of mask-RCNN for pest disease segmentation. Three-dimensional coordinates are obtained precisely for the target points that provide the average rate of precision: 0.94 [27]. The pyramid attention features extraction model and fine-grained models are used for pest disease detection. This method is evaluated on D0 and IP102 datasets with 0.74 and 0.99 accuracy, respectively [28]. The plant images are augmented by applying a data augmentation approach. Then, four pre-trained models such as Google-net, Alex-net, VGG-net, and Res-Net are trained on the selected hyper-parameters. The proposed models provide accuracy of 0.96 on the NBAIR dataset, 0.97 on 24 classes Xie1 and 0.95 on the Xie2 dataset [29]. The SVM model is used with different functions of the kernel for the classification of parasites in strawberry plants [30]. A simple and new method is proposed in which blocks of original and feature reuse residual blocks are combined. This is known as the feature re-use residual model [31]. The spatial channel network is fused with the CNN model. The regional proposal model is adopted to detect pest illnesses. In this model, a position-sensitive score map is applied, in which the FC layer is replaced by a regression layer. The results are computed on the MPD-2018, which provides an mAP of 0.75 [32]. The transfer learning DenseNet-169 is used for pest detection in tomato plants. The results are computed on 859 images of 10 classes of pest that affect tomatoes, providing 0.88 accuracy [33]. The GAN model is used for the generation of synthetic pest images. The GAN results are visualized through the t-SNE method. The classification of the pest insect is performed using a CNN model that provides a 0.95 F1-score [34]. The Deep neural network is used for pest disease classification, in which modified ResNet-50 provides 0.95 accuracy [15]. The image contrast is improved using contrast enhancement, then k-means clustering is used for segmentation. The geometrical features such as GLCM and GLRLM are fed to the SVM and KNN for classification of normal/pest images of leaves with 0.93 prediction accuracy [35]. The HOG, GIST, and color features are used with SVM, NB, MLP, bagging, KNN, XGBoost and RF classifiers on 10 fold cross-validation for pest disease classification [36]. The CNN model is applied with softmax for the classification of the pest images, which provides 0.91 accuracy [37].
3. Material and Methods
The proposed method steps are localization and classification. In the localization step, the YOLOv5 model is trained on the selected parameters to localize the pest region in plant images. After localization, pest images are classified into Paddy with pest/Paddy without pest using the proposed quantum neural network, as presented in Figure 1.
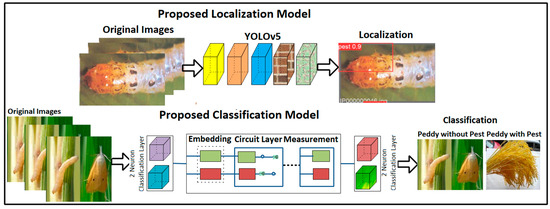
Figure 1.
Proposed pest localization and classification models.
3.1. Localization of Pests Using the YOLOv5 Model
You look once (YOLO) models are widely used in different sectors for medical and agricultural purposes, as well as in parking meters, traffic signals, etc., In terms of recognition accuracy, YOLOv5 outperforms other detectors such as RCNN, YOLOv2, v3, etc. [38]. Therefore, the localization model is used to locate the actual region of pests in plant images more accurately.
The YOLOv5 detector contains three vital parts: the model backbone, the neck of the model, and the head model [39], in which the cross stage of the partial model is utilized for the extraction of rich features. The model neck is utilized for the generation of feature pyramids. Feature pyramids provide better generalizability when scaling the object. This helps with the identification of objects with distinct scales and sizes. Pyramid features help improve the performance of testing data. In the proposed model, FPN pyramids are used. The head of the model is utilized for the final part of the detection process. The anchor boxes are applied to the features that generate the final output vector with probabilities of class, scores of objectiveness, and rectangular boxes. The Leaky ReLU is applied in the hidden/middle layer and the sigmoid function is utilized in the detection of the final layer. The model is trained on the Sgdm optimizer function. YOLOv5 comprises the head and backbone.
The YOLOv5 head contains 16 convolutional, 1 focus, and 1 spatial pyramid pooling, while the YOLOv5 backbone comprises 23 layers: 16 convolutional, 2 up-sampling, 4 concatenation, and 1 detection layer. The proposed YOLOv5 architecture is shown in Figure 2. Table 1 lists the YOLOv5 model’s training parameters.
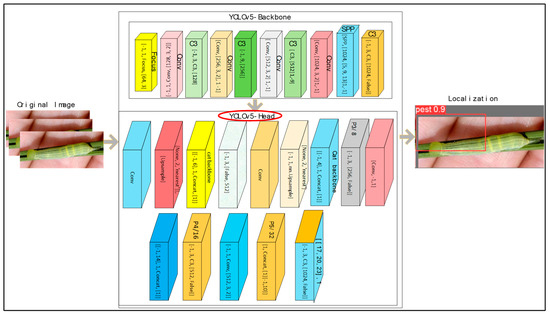
Figure 2.
Proposed YOLOv5 model for localization.

Table 1.
Parameters of YOLOv5 training.
The loss function of the YOLOv5 is mathematically explained as:
Here, represents the objects in i and represent the jth bounding box, s denotes the grid and denote the center of the jth bounding box related to the i grid cell. represents the center of ground truth related to the i grid cell.
Table 1 depicts training parameters in which 400 epochs, 8 batch-size, an Sgdm optimizer, (10, 13, 16, 30, 33, 23), (30, 61, 62, 45, 59, 119), (116, 90, 156, 198, 373, 326) and two classes are selected, providing better localization results.
3.2. Classification of Paddy with Pest/Paddy without Pest
The classical images are transformed through the computation of a matrix. The same images are presented as quantum states and encoded for the n qubits. The transformation of quantum images is achieved through the evolution of unitary ^U under Hamiltonian. The qubits might store multiple values at the same time, which provides a huge advantage in terms of speed over the normal/classical algorithms. Therefore, in this article, the quantum model is proposed for the classification of the pest images. A qubit’s state in quantum computing is represented by a unit vector in a complex two-dimensional vector space [40,41]. Consider a quantum system in two dimensions that are described by so-called computational states and . The column vectors , serve as a numerical representation of these reports. The basis of orthonormal for space of a qubit space is called a Hilbert. The primary distinction between quantum and classical bits is that bits of quantum are not limited to the binary states of and . For instance, a qubit can exist in two states at once (a two-states superposition) [42].
The model consists of three-layered hybrid architecture that contains two neurons of the classical fully connected (FC) layer. The two-qubit neurons are transformed into another two classical FC layers. A softmax activation function is applied for classification based on probability. The proposed model contains 15 layers and 2-qubit neurons, and it is trained with selected parameters such as the Adam optimizer, 16 batch size and 100 training epochs, and the data are divided into 5- and 10-fold cross-validation. The model layered architecture and training parameters are displayed in Table 2 and Table 3.

Table 2.
Training parameters of the proposed model.

Table 3.
Proposed model layered architecture.
Table 2 depicts training parameters that are selected after extensive experiments that provide better testing outcomes. Table 3 shows the layered design of the suggested model.
The proposed architecture is presented in Figure 3.

Figure 3.
A proposed quantum model for classification.
4. Results and Discussion
Paddy pest data are downloaded from the Kaggle website “Paddy Pests Dataset | Kaggle”. This dataset contains 135 files of Paddy with pests and 513 files of Paddy without pests. The IP102 dataset used for the recognition of pest insects contains 75,000 images split into 102 classes. Furthermore, 19,000 images are annotated to bounding boxes [43]. The proposed method is implemented on MATLAB toolbox 2022 on a Windows operating system with a 2070 RTX Nvidia Graphic Card. In this research, two experiments are performed: one for localization (Figure 4) and the second for the classification of pest images.
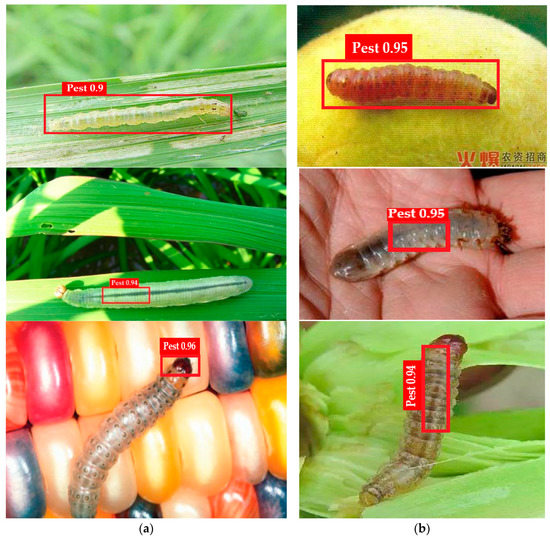
Figure 4.
(a,b) Shows the proposed method localization results.
4.1. Experiment#1: Localization of Pest Images Using the YOLOv5 Model
In this experiment, the localization method’s performance is computed in terms of recall (R), precision (P), and mAP. The mathematical expression of performance metrics is as follows:
The proposed localization model is trained/validated on the IP102 pest recognition dataset. The proposed model results are graphically presented in Figure 4. The statistical results are mentioned in Table 4 and Table 5.

Table 4.
Proposed method localization outcomes.

Table 5.
Localization results in comparison.
The proposed model training results with loss rate and validation outcomes are presented in Figure 5.
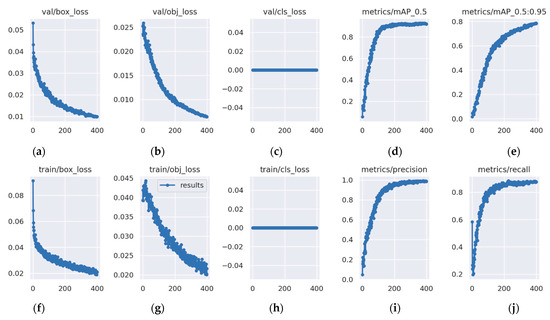
Figure 5.
Training/validation results (a) loss of training box, (b) loss of training object, (c) loss of training cls, (d) metrics/precision, (e) metrics/recall, (f) loss of validation box, (g) loss of validation object, (h) loss of validation cls, (i) mAP (0.5), (j) mAP (0.95).
Figure 6 depicts the proposed model training/validation loss in terms of P, R, and mAP scores. In Figure 6, the proposed model validation results are visualized.
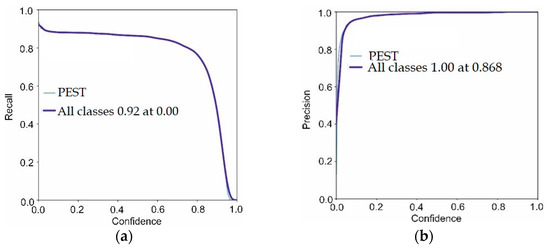
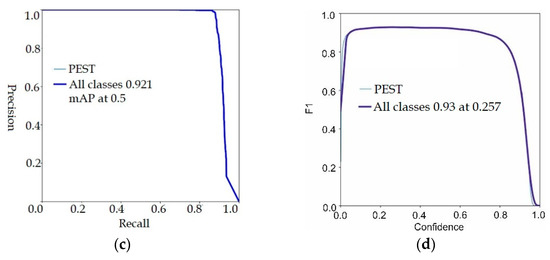
Figure 6.
Proposed model validation results (a) precision, (b) mAP, (c) F1-score, (d) recall.
The validation scores of the proposed model are 0.86 precision, 0.92 recall, 0.93 F1-score and 0.92 mAP. The achieved outcomes prove that the proposed model more accurately localizes the pest regions. The tabular results are mentioned in Table 4.
Table 4 presents the results of the localization method, which achieves mean scores of 0.98764 precision, 0.87739 recall, 0.92728 mAP-0.5, and 0.78367 mAP-0.95. The proposed localization method’s results are compared to the latest existing methods, as mentioned in Table 5.
Table 5 presents the localization results that are compared to the existing methods [39,40,41,42]. An explainable neural model is used for localization, which provides 55.05 F1 scores [44]. CornerNet with DenseNet-100 is used for localization on the IP102 dataset, which provides an mAP of 57.23 [45]. The multi-scale attention model is utilized for localization on the IP102 dataset, which provides 67.28 F1 scores [46]. The multiple-scale attention method is utilized for the recognition of pest regions with 77.04 mAP [47].
As compared with the existing methods used in this research area, fine-tuned YOLOv5 provides better localization outcomes.
4.2. Experiment#2: Classification of Pest Images Based on Proposed Quantum Neural Network
The proposed model classifies the input images into two classes: pest/without pest. On 5/10-fold cross-validation, the performance of the suggested strategy is assessed in terms of various metrics, such as precision accuracy, F1 scores, and recall. Figure 7 shows a graphical representation of the suggested model training.
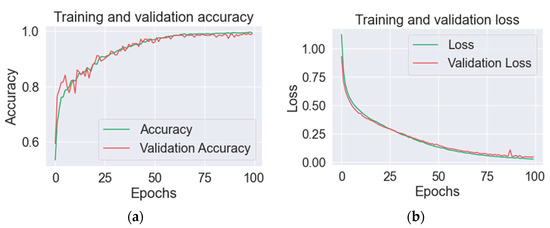
Figure 7.
Proposed model results in (a) training and validation precision, and (b) loss of training and validation.
The classification results are computed using a confusion matrix, as shown in Figure 8.
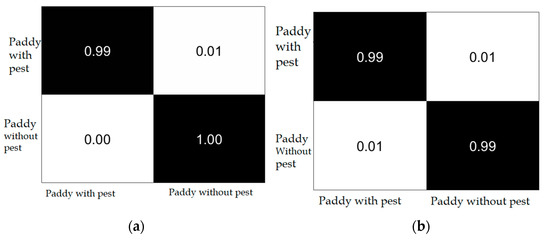
Figure 8.
Confusion matrix (a) 5-fold; (b) 10-fold.
Figure 8 shows the binary classification results of Paddy with pest and Paddy without pest. The achieved outcomes are mentioned in Table 6.

Table 6.
Classification outcomes using the suggested model.
The proposed classification model achieves 99.31% accuracy, 0.99 precision, 1.00 recall, and a 0.99 F1 score with 5-fold cross-validation and 99.56% accuracy, 0.99 precision, 0.99 recall, and 0.99 F1 score with 10-fold cross-validation.
4.3. Statistical Analysis for Classification Model
The statistical analysis is performed in terms of mean/variation to compute the results of classification on 5- and 10-fold cross-validation. In this experiment, AUC values are computed on each fold, and the mean of AUC is measured using the deviation rate. The achieved results are graphically presented in Figure 9. The quantitative results are mentioned in Table 7 and Table 8.
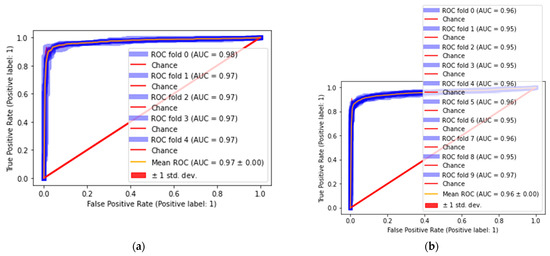
Figure 9.
Classification results (a) 5-fold and (b) 10-fold.

Table 7.
Classification results in terms of mean/variance on 5-fold cross-validation.

Table 8.
Results of classification in terms of mean/variance on 10-fold cross-validation.
Based on the five-fold cross-validation results, we achieve 0.98 ROC on 0-fold and 0.97 ROC on 1-, 2-, 3- and 4-fold, and 0.97 ± 0.00 mean/variation. The classification of pests is provided in Table 8.
The classification outcomes in Table 8 are 0.96 ROC for 0-fold, 0.95 ROC for 1-, 2-, 3-, 6- and 8-fold, 0.96 ROC for 4- and 7-fold, 0.97 ROC for 9-fold, and 0.96 ± 0.00 mean/variation. The proposed results comparison is provided in Table 9.

Table 9.
Comparison of results.
Table 9 depicts the comparison of results with [37,49,50,51,52]. Transfer learning models such as MobileNet and VGG16 are used for classification, with 93.83% accuracy [49]. A Custom CNN model is developed for paddy classification with 97.70% accuracy [50]. The VGG19,16 and ResNet-50 are applied with a voting classifier for classification, which provides 82.50% accuracy [51]. The FCN model is applied to the conditional random field for refinement of the contour of the insect and localized boundaries. Finally, Densenet is applied with attention to the classification and provides accuracy of 98.28% [52]. The CNN model is designed for classification through softmax and SVM, which provides 91.45% accuracy [37]. However, compared to the existing method in this research, quantum machine learning is proposed which is trained from the scratch using the optimal parameters that provide 99.90% accuracy.
5. Conclusions
In agricultural domain, pests cause damage in fields, leading to significant losses in the crop yield. Therefore, it is necessary to obtain accurate and early detection of pests using plant images. Although researchers are working on accurate detection, there is still room for improvement because of several factors such as noise, illumination, occlusion, etc., That is why the end-to-end deep learning YOLOv5 model was designed based on a features pyramid (FPN) with optimal hyperparameters which provides a significant improvement in localization results, offering 0.987 Precision, 0.877 Recall, 0.927 mAP-0.5, 0.783 mAP-0.5:0.95 compared to existing methods.
The classification of the pest images is also a necessary part of this domain, which depends on optimal feature extraction and selection. Therefore, a fifteen-layered, two-qubit quantum model is designed and trained from scratch and based on selected learning parameters. The results achieved in terms of accuracy are 99.56%, 0.99 precision, 0.99 recall, and 0.99 F1 scores. The comparison between the proposed and the existing models authenticates that the proposed model performs better.
In this article, binary classification is performed; in the future, the work may be extended for multi-classification of pest images.
Author Contributions
Conceptualization, J.A. and M.A.A.; methodology, J.A.; software, R.Z.; validation, S.K. and M.A.A.; formal analysis, L.S. and M.I.S.; investigation, S.K.; resources, L.S.; data curation, R.Z. and M.I.S. All authors have read and agreed to the published version of the manuscript.
Funding
This work has been supported by the project of Operational Program Integrated Infrastructure: Independent re-search and development of technological kits based on wearable electronics products, as tools for raising hygienic standards in a society exposed to the virus causing the COVID-19 disease, ITMS2014+ code 313011ASK8.
Institutional Review Board Statement
Not applicable.
Informed Consent Statement
Not applicable.
Data Availability Statement
https://www.kaggle.com/datasets/zeeniye/paddy-pests-dataset, accessed on 15 August 2022.
Conflicts of Interest
All authors declare that there is no conflict of interest.
References
- Lacey, L.; Grzywacz, D.; Shapiro-Ilan, D.; Frutos, R.; Brownbridge, M.; Goettel, M. Insect pathogens as biological control agents: Back to the future. J. Invertebr. Pathol. 2015, 132, 1–41. [Google Scholar] [CrossRef]
- Vreysen, M.; Robinson, A.; Hendrichs, J.; Kenmore, P. Area-wide integrated pest management (AW-IPM): Principles, practice and prospects. In Area-Wide Control of Insect Pests: From Research to Field Implementation; Springer: Berlin/Heidelberg, Germany, 2007; pp. 3–33. [Google Scholar]
- Tian, H.; Wang, T.; Liu, Y.; Qiao, X.; Li, Y. Computer vision technology in agricultural automation—A review. Inf. Process. Agric. 2020, 7, 1–19. [Google Scholar] [CrossRef]
- Barbedo, J.G.A. Detecting and classifying pests in crops using proximal images and machine learning: A review. AI 2020, 1, 312–328. [Google Scholar] [CrossRef]
- Smith, M. Scouting: The Tip of the IPM Spear. EDIS 2019, 2019, 24–27. [Google Scholar]
- Orchi, H.; Sadik, M.; Khaldoun, M. On using artificial intelligence and the internet of things for crop disease detection: A contemporary survey. Agriculture 2022, 12, 9. [Google Scholar] [CrossRef]
- Miranda, J.L.; Gerardo, B.D.; Tanguilig, B.T., III. Pest detection and extraction using image processing techniques. Int. J. Comput. Commun. Eng. 2014, 3, 189. [Google Scholar] [CrossRef]
- Li, W.; Zheng, T.; Yang, Z.; Li, M.; Sun, C.; Yang, X. Classification and detection of insects from field images using deep learning for smart pest management: A systematic review. Ecol. Inform. 2021, 66, 101460. [Google Scholar] [CrossRef]
- Shafkat, I. Intuitively Understanding Convolutions for Deep Learning. 2018. Available online: https://towardsdatascience.com/intuitively-understanding-convolutions-for-deep-learning-1f6f42faee1 (accessed on 6 June 2020).
- Alzubaidi, L.; Zhang, J.; Humaidi, A.J.; Al-Dujaili, A.; Duan, Y.; Al-Shamma, O.; Santamaría, J.; Fadhel, M.A.; Al-Amidie, M.; Farhan, L. Review of deep learning: Concepts, CNN architectures, challenges, applications, future directions. J. Big Data 2021, 8, 53. [Google Scholar] [CrossRef]
- Javed, M.H.; Noor, M.H.; Khan, B.Y.; Noor, N.; Arshad, T. K-means based automatic pests detection and classification for pesticides spraying. Int. J. Adv. Comput. Sci. Appl. 2017, 8, 236–240. [Google Scholar]
- Thar, S.P.; Ramilan, T.; Farquharson, R.J.; Pang, A.; Chen, D. An empirical analysis of the use of agricultural mobile applications among smallholder farmers in Myanmar. Electron. J. Inf. Syst. Dev. Ctries 2021, 87, e12159. [Google Scholar] [CrossRef]
- Singh, P.; Verma, A.; Alex, J.S.R. Disease and pest infection detection in coconut tree through deep learning techniques. Comput. Electron. Agric. 2021, 182, 105986. [Google Scholar] [CrossRef]
- Karar, M.E.; Alsunaydi, F.; Albusaymi, S.; Alotaibi, S. A new mobile application of agricultural pests recognition using deep learning in cloud computing system. Alex. Eng. J. 2021, 60, 4423–4432. [Google Scholar] [CrossRef]
- Malathi, V.; Gopinath, M. Classification of pest detection in paddy crop based on transfer learning approach. Acta Agric. Scand. Sect. B—Soil Plant Sci. 2021, 71, 552–559. [Google Scholar] [CrossRef]
- He, J.; Chen, K.; Pan, X.; Zhai, J.; Lin, X. Advanced biosensing technologies for monitoring of agriculture pests and diseases: A review. J. Semicond. 2023, 44, 023104. [Google Scholar] [CrossRef]
- Wang, H.; Li, Y.; Dang, L.M.; Moon, H. An efficient attention module for instance segmentation network in pest monitoring. Comput. Electron. Agric. 2022, 195, 106853. [Google Scholar] [CrossRef]
- Wang, R.; Jiao, L.; Xie, C.; Chen, P.; Du, J.; Li, R. S-RPN: Sampling-balanced region proposal network for small crop pest detection. Comput. Electron. Agric. 2021, 187, 106290. [Google Scholar] [CrossRef]
- Wei, D.; Chen, J.; Luo, T.; Long, T.; Wang, H. Classification of crop pests based on multi-scale feature fusion. Comput. Electron. Agric. 2022, 194, 106736. [Google Scholar] [CrossRef]
- Bollis, E.; Maia, H.; Pedrini, H.; Avila, S. Weakly supervised attention-based models using activation maps for citrus mite and insect pest classification. Comput. Electron. Agric. 2022, 195, 106839. [Google Scholar] [CrossRef]
- Luo, Q.; Wan, L.; Tian, L.; Li, Z. Saliency guided discriminative learning for insect pest recognition. In Proceedings of the 2021 International Joint Conference on Neural Networks (IJCNN), Shenzhen, China, 18–22 July 2021; pp. 1–8. [Google Scholar]
- Rimal, K.; Shah, K.; Jha, A. Advanced multi-class deep learning convolution neural network approach for insect pest classification using TensorFlow. Int. J. Environ. Sci. Technol. 2022, 20, 4003–4016. [Google Scholar] [CrossRef]
- Alsanea, M.; Habib, S.; Khan, N.F.; Alsharekh, M.F.; Islam, M.; Khan, S. A Deep-Learning Model for Real-Time Red Palm Weevil Detection and Localization. J. Imaging 2022, 8, 170. [Google Scholar] [CrossRef] [PubMed]
- Dong, S.; Du, J.; Jiao, L.; Wang, F.; Liu, K.; Teng, Y.; Wang, R. Automatic Crop Pest Detection Oriented Multiscale Feature Fusion Approach. Insects 2022, 13, 554. [Google Scholar] [CrossRef] [PubMed]
- Teng, Y.; Zhang, J.; Dong, S.; Zheng, S.; Liu, L. MSR-RCNN: A multi-class crop pest detection network based on a multi-scale super-resolution feature enhancement module. Front. Plant Sci. 2022, 13, 810546. [Google Scholar] [CrossRef] [PubMed]
- Chodey, M.D.; Noorullah Shariff, C. Hybrid deep learning model for in-field pest detection on real-time field monitoring. J. Plant Dis. Prot. 2022, 129, 635–650. [Google Scholar] [CrossRef]
- Li, Y.; Feng, Q.; Lin, J.; Hu, Z.; Lei, X.; Xiang, Y. 3D Locating System for Pests’ Laser Control Based on Multi-Constraint Stereo Matching. Agriculture 2022, 12, 766. [Google Scholar] [CrossRef]
- Ung, H.T.; Ung, H.Q.; Nguyen, B.T. An efficient insect pest classification using multiple convolutional neural network based models. arXiv 2021, arXiv:2107.12189. [Google Scholar]
- Thenmozhi, K.; Reddy, U.S. Crop pest classification based on deep convolutional neural network and transfer learning. Comput. Electron. Agric. 2019, 164, 104906. [Google Scholar] [CrossRef]
- Ebrahimi, M.; Khoshtaghaza, M.H.; Minaei, S.; Jamshidi, B. Vision-based pest detection based on SVM classification method. Comput. Electron. Agric. 2017, 137, 52–58. [Google Scholar] [CrossRef]
- Ren, F.; Liu, W.; Wu, G. Feature reuse residual networks for insect pest recognition. IEEE Access 2019, 7, 122758–122768. [Google Scholar] [CrossRef]
- Liu, L.; Wang, R.; Xie, C.; Yang, P.; Wang, F.; Sudirman, S.; Liu, W. PestNet: An end-to-end deep learning approach for large-scale multi-class pest detection and classification. IEEE Access 2019, 7, 45301–45312. [Google Scholar] [CrossRef]
- Pattnaik, G.; Shrivastava, V.K.; Parvathi, K. Transfer learning-based framework for classification of pest in tomato plants. Appl. Artif. Intell. 2020, 34, 981–993. [Google Scholar] [CrossRef]
- Lu, C.-Y.; Rustia, D.J.A.; Lin, T.-T. Generative adversarial network based image augmentation for insect pest classification enhancement. IFAC-Pap. 2019, 52, 1–5. [Google Scholar] [CrossRef]
- Dey, A.; Bhoumik, D.; Dey, K.N. Automatic detection of whitefly pest using statistical feature extraction and image classification methods. Int. Res. J. Eng. Technol. 2016, 3, 950–959. [Google Scholar]
- Kasinathan, T.; Uyyala, S.R. Machine learning ensemble with image processing for pest identification and classification in field crops. Neural Comput. Appl. 2021, 33, 7491–7504. [Google Scholar] [CrossRef]
- Haridasan, A.; Thomas, J.; Raj, E.D. Deep learning system for paddy plant disease detection and classification. Environ. Monit. Assess. 2023, 195, 120. [Google Scholar] [CrossRef] [PubMed]
- Kuznetsova, A.; Maleva, T.; Soloviev, V. YOLOv5 versus YOLOv3 for apple detection. In Cyber-Physical Systems: Modelling and Intelligent Control; Springer: Berlin/Heidelberg, Germany, 2021; pp. 349–358. [Google Scholar]
- Solawetz, J.; Nelson, J. How to Train YOLOv5 on a Custom Dataset. Volume 19. 2020. Available online: https://blog.roboflow.com/how-to-train-yolov5-on-a-custom-dataset/ (accessed on 10 December 2022).
- Beer, K.; Bondarenko, D.; Farrelly, T.; Osborne, T.J.; Salzmann, R.; Scheiermann, D.; Wolf, R. Training deep quantum neural networks. Nat. Commun. 2020, 11, 808. [Google Scholar] [CrossRef]
- Langenfeld, S.; Morin, O.; Körber, M.; Rempe, G. A network-ready random-access qubits memory. Npj Quantum Inf. 2020, 6, 86. [Google Scholar] [CrossRef]
- Gyurik, C.; Dunjko, V. Structural risk minimization for quantum linear classifiers. Quantum 2023, 7, 893. [Google Scholar] [CrossRef]
- Wu, X.; Zhan, C.; Lai, Y.-K.; Cheng, M.-M.; Yang, J. Ip102: A large-scale benchmark dataset for insect pest recognition. In Proceedings of IEEE/CVF Conference on Computer Vision and Pattern Recognition, Long Beach, CA, USA, 15–20 June 2019; pp. 8787–8796. [Google Scholar]
- Couliably, S.; Kamsu-Foguem, B.; Kamissoko, D.; Traore, D. Explainable deep convolutional neural networks for insect pest recognition. J. Clean. Prod. 2022, 371, 133638. [Google Scholar] [CrossRef]
- Albattah, W.; Masood, M.; Javed, A.; Nawaz, M.; Albahli, S. Custom CornerNet: A drone-based improved deep learning technique for large-scale multiclass pest localization and classification. Complex Intell. Syst. 2022, 1–18. [Google Scholar] [CrossRef]
- Feng, F.; Dong, H.; Zhang, Y.; Zhang, Y.; Li, B. MS-ALN: Multiscale Attention Learning Network for Pest Recognition. IEEE Access 2022, 10, 40888–40898. [Google Scholar] [CrossRef]
- Zhang, W.; Sun, Y.; Huang, H.; Pei, H.; Sheng, J.; Yang, P. Pest region detection in complex backgrounds via contextual information and multi-scale mixed attention mechanism. Agriculture 2022, 12, 1104. [Google Scholar] [CrossRef]
- Li, M.; Cheng, S.; Cui, J.; Li, C.; Li, Z.; Zhou, C.; Lv, C. High-Performance Plant Pest and Disease Detection Based on Model Ensemble with Inception Module and Cluster Algorithm. Plants 2023, 12, 200. [Google Scholar] [CrossRef] [PubMed]
- Murugan, D. Paddy Doctor: A Visual Image Dataset for Paddy Disease Classification. arXiv 2022, arXiv:2205.11108. [Google Scholar]
- Debnath, O.; Saha, H.N. An IoT-based intelligent farming using CNN for early disease detection in rice paddy. Microprocess. Microsyst. 2022, 94, 104631. [Google Scholar] [CrossRef]
- Anwar, Z.; Masood, S. Exploring Deep Ensemble Model for Insect and Pest Detection from Images. Procedia Comput. Sci. 2023, 218, 2328–2337. [Google Scholar] [CrossRef]
- Gong, H.; Liu, T.; Luo, T.; Guo, J.; Feng, R.; Li, J.; Ma, X.; Mu, Y.; Hu, T.; Sun, Y. Based on FCN and DenseNet Framework for the Research of Rice Pest Identification Methods. Agronomy 2023, 13, 410. [Google Scholar] [CrossRef]
Disclaimer/Publisher’s Note: The statements, opinions and data contained in all publications are solely those of the individual author(s) and contributor(s) and not of MDPI and/or the editor(s). MDPI and/or the editor(s) disclaim responsibility for any injury to people or property resulting from any ideas, methods, instructions or products referred to in the content. |
© 2023 by the authors. Licensee MDPI, Basel, Switzerland. This article is an open access article distributed under the terms and conditions of the Creative Commons Attribution (CC BY) license (https://creativecommons.org/licenses/by/4.0/).