Analysis of the Determinants of Agriculture Performance at the European Union Level
Abstract
1. Introduction
- What are the determinants of agricultural performance in the EU?
- What are the relationships between the determinants of EU agricultural performance and how are Member States ranked according to them?
- How do EU countries differ and group according to the analyzed agricultural influencing factors?
2. Literature Review
3. Materials and Methods
3.1. Data and Hypotheses
3.2. Methodology
4. Results and Discussion
5. Conclusions
Author Contributions
Funding
Institutional Review Board Statement
Informed Consent Statement
Data Availability Statement
Acknowledgments
Conflicts of Interest
References
- Sunderji, S.; Bass, R.; Hand, D.; Nova, N. Understanding Impact Performance: Agriculture Investments, Global Impact Investing Network, New York. 2020. Available online: https://thegiin.org/assets/Understanding%20Impact%20Performance_Agriculture%20Investments_webfile.pdf (accessed on 21 December 2022).
- Domagała, J. Economic and Environmental Aspects of Agriculture in the EU Countries. Energies 2021, 14, 7826. [Google Scholar] [CrossRef]
- Popescu, A. Considerations on utilized agricultural land and farm structure in the European Union. Sci. Pap. Ser. Manag. Econ. Eng. Agric. Rural Dev. 2013, 13, 221–226. [Google Scholar]
- Baldock, D.; Buckwell, A. Just Transition in the EU Agriculture and Land Use Sector; Institute for European Environmental Policy: London, UK, 2021. [Google Scholar]
- Martinho, V.J.P.D. Profitability and financial performance of European Union farms: An analysis at both regional and national levels. In Open Agriculture; De Gruyter Publishing: Berlin, Germany, 2022; Volume 7, pp. 529–540. [Google Scholar]
- Klikocka, H.; Zakrzewska, A.; Chojnacki, P. Characteristics of Models of Farms in the European Union. Sustainability 2021, 13, 4772. [Google Scholar] [CrossRef]
- Nowak, A.; Różańska-Boczula, M. The Competitiveness of Agriculture in EU Member States According to the Competitiveness Pyramid Model. Agriculture 2022, 12, 28. [Google Scholar] [CrossRef]
- Loizou, E.; Karelakis, C.; Galanopoulos, K.; Mattas, K. The Role of Agriculture as a Development Tool for a Regional Economy. Agric. Syst. 2019, 173, 482–490. [Google Scholar] [CrossRef]
- Nowak, A.; Kijek, T.; Domanska, K. Technical efficiency and its determinants in the European Union. Agric. Econ. 2015, 61, 275–283. [Google Scholar] [CrossRef]
- Reiff, M.; Surmanová, K.; Balcerzak, A.P.; Pietrzak, M.B. Multiple Criteria Analysis of European Union Agriculture. J. Int. Stud. 2016, 9, 62–74. [Google Scholar] [CrossRef]
- Sauer, J.; Moreddu, C. Drivers of Farm Performance: Empirical Country Case Studies; OECD Food, Agriculture and Fisheries Papers, No. 143; OECD Publishing: Paris, France, 2020. [Google Scholar]
- Guth, M.; Smędzik-Ambroży, K. Economic resources versus the efficiency of different types of agricultural production in regions of the European Union. Econ. Res. Ekon. Istraživanja 2020, 3, 1036–1051. [Google Scholar] [CrossRef]
- Magrini, A. Assessment of agricultural sustainability in European Union countries: A group-based multivariate trajectory approach. AstA Adv. Stat. Anal. 2022, 106, 673–703. [Google Scholar] [CrossRef]
- Pawlak, K.; Smutka, L.; Kotyza, P. Agricultural Potential of the EU Countries: How Far Are They from the USA? Agriculture 2021, 11, 282. [Google Scholar] [CrossRef]
- Zsarnóczai, S.; Zéman, Z. Output value and productivity of agricultural industry in Central-East Europe. Agric. Econ. 2019, 65, 185–193. [Google Scholar] [CrossRef]
- Ilić, I.; Krstić, B.; Jovanović, S. Environmental performances of agriculture in the European Union countries. Econ. Agric. 2017, 64, 41–55. [Google Scholar]
- Reidsma, P.; Ewert, F.; Lansink, A.O. Analysis of farm performance in Europe under different climatic and management conditions to improve understanding of adaptive capacity. Clim. Chang. 2007, 84, 403–422. [Google Scholar] [CrossRef]
- EC. EU agricultural outlook for markets, income and environment, 2021–2031. European Commission, DG Agriculture and Rural Development, Brussels. EU Farm Accountancy Data Network (FADN). 2021. Available online: https://agriculture.ec.europa.eu/system/files/2022-10/agricultural-outlook-2021-report_en.pdf (accessed on 4 October 2022).
- Florea, N.V.; Duică, M.C.; Ionescu, C.A.; Duică, A.; Ibinceanu, M.C.O.; Stanescu, S.G. An Analysis of the Influencing Factors of the Romanian Agricultural Output within the Context of Green Economy. Sustainability 2021, 13, 9649. [Google Scholar] [CrossRef]
- Coca, O.; Mironiuc, M.; Pânzaru, R.L.; Crețu, A.M.; Ștefan, G. Exploring the statistical association between the economic, environmental and innovative areas of performance: The case of European Union Agriculture. Rom. Agric. Res. 2020, 37, 253–261. [Google Scholar]
- EU. Sustainable Development in the European Union Monitoring Report on Progress towards the Sdgs in an EU Context 2022 Edition; Eurostat, Publications Office of the European Union: Luxembourg, 2022; Available online: https://ec.europa.eu/eurostat/documents/3217494/14665254/KS-09-22-019-EN-N.pdf/2edccd6a-c90d-e2ed-ccda-7e3419c7c271?t=1653042954499, (accessed on 9 January 2023).
- OECD. Environmental Performance of Agriculture in OECD Countries since 1990, Organisation for Economic Co-Operation and Development. 2008. Available online: https://www.oecd.org/greengrowth/sustainable-agriculture/44254899.pdf (accessed on 5 December 2022).
- OECD. Measuring the Environmental Performance of Agriculture across OECD Countries; OECD Publishing: Paris, France, 2022. [Google Scholar]
- Guth, M.; Smędzik-Ambroży, K.; Czyżewski, B.; Stępień, S. The Economic Sustainability of Farms under Common Agricultural Policy in the European Union Countries. Agriculture 2020, 10, 34. [Google Scholar] [CrossRef]
- Smędzik-Ambroży, K.; Guth, M.; Stępień, S.; Brelik, A. The Influence of the European Union’s Common Agricultural Policy on the Socio-Economic Sustainability of Farms (the Case of Poland). Sustainability 2019, 11, 7173. [Google Scholar] [CrossRef]
- Andrejovská, A.; Glova, J. Sustainability of Farms in EU Countries in the Context of Income Indicators: Regression Analysis Based on a New Classification. Agriculture 2022, 12, 1–14. [Google Scholar] [CrossRef]
- Jayson, B.; Ivanic, M.; Jelliffe, J.; Baquedano, F.; Scott, S. Economic and Food Security Impacts of Agricultural Input Reduction under the European Union Green Deal’s Farm to Fork and Biodiversity Strategies; EB-30; U.S. Department of Agriculture, Economic Research Service: Washington, DC, USA, 2020; Available online: https://ageconsearch.umn.edu/record/307277 (accessed on 6 January 2023).
- Meredith, S.; Allen, B.; Kollenda, E.; Maréchal, A.; Hart, K.; Hulot, J.F.; Frelih Larsen, A.; Wunder, S. European Food and Agriculture in a New Paradigm: Can Global Challenges Like Climate Change Be Addressed through a Farm to Fork Approach? Think 2030 Policy Paper by the Institute for European Environmental Policy and the Ecologic Institute. 2021. Available online: https://www.researchgate.net/publication/352120624_Policy_Paper_European_food_and_agriculture_in_a_new_paradigm (accessed on 23 November 2022).
- Ambros, P.; Granvik, M. Trends in Agricultural Land in EU Countries of the Baltic Sea Region from the Perspective of Resilience and Food Security. Sustainability 2020, 12, 5851. [Google Scholar] [CrossRef]
- Fi-compass. Financial Needs in Agriculture and Agri-Food Sectors in Romania. Study Report, 85 Pages. 2020. Available online: https://www.fi-compass.eu/sites/default/files/publications/financial_needs_agriculture_agrifood_sectors_Romania.pdf. (accessed on 24 November 2022).
- Finger, R.; El Benni, N. Farm income in European agriculture: New perspectives on measurement and implications for policy evaluation. Eur. Rev. Agric. Econ. 2021, 48, 253–265. [Google Scholar] [CrossRef]
- Erjavec, E.; Volk, T.; Rednak, M.; Ciaian, P.; Lazdinis, M. Agricultural policies and European Union accession processes in the Western Balkans: Aspirations versus reality. Eurasian Geogr. Econ. 2021, 62, 46–75. [Google Scholar] [CrossRef]
- Volkov, A.; Balezentis, T.; Morkunas, M.; Streimikiene, D. In a Search for Equity: Do Direct Payments under the Common Agricultural Policy Induce Convergence in the European Union? Sustainability 2019, 11, 3462. [Google Scholar] [CrossRef]
- Coca, O.; Ştefan, G.; Crețu, A.; Creangã, D.E. Research on the development of agriculture in the European Union. A structural analysis by geographical groups of countries. Rom. Agric. Res. 2020, 37, 229–242. [Google Scholar]
- Kusz, B.; Kusz, D.; Bak, I.; Oesterreich, M.; Wicki, L.; Zimon, G. Selected Economic Determinants of Labor Profitability in Family Farms in Poland in Relation to Economic Size. Sustainability 2022, 14, 13819. [Google Scholar] [CrossRef]
- Li, M.; Long, H.; Tang, L.; Tu, S.; Zhang, Y.; Qu, Y. Analysis of the spatial variations of determinants of agricultural production efficiency in China. Comput. Electron. Agric. 2021, 180, 105890. [Google Scholar]
- Alem, H.; Lien, G.; Hardaker, J. Economic performance and efficiency determinants of crop-producing farms in Norway. Int. J. Product. Perform. Manag. 2018, 67, 1418–1434. [Google Scholar] [CrossRef]
- Burja, C. Determinants of the agricultural productivity growth among Romanian regions. Ann. Univ. Apulensis Ser. Oecon. 2012, 1, 218–225. [Google Scholar] [CrossRef]
- Hornowski, A.; Parzonko, A.; Kotyza, P.; Kondraszuk, T.; Bórawski, P.; Smutka, L. Factors Determining the Development of Small Farms in Central and Eastern Poland. Sustainability 2020, 12, 5095. [Google Scholar] [CrossRef]
- Andrei, J.V.; Popescu, G.; Nica, E.; Chivu, L. The impact of agricultural performance on foreign trade concentration and competitiveness: Empirical evidence from Romanian agriculture. J. Bus. Econ. Manag. 2020, 21, 317–343. [Google Scholar] [CrossRef]
- Bacsi, Z.; Dávid, L.D.; Hollósy, Z. Industry Differences in Productivity—In Agriculture and Tourism by Lake Balaton, Hungary. Sustainability 2022, 14, 11809. [Google Scholar] [CrossRef]
- Wrzaszcz, W.; Zegar, J.S. Economic sustainability of Farms in Poland. Eur. J. Sustain. Dev. 2014, 3, 165. [Google Scholar]
- Andrei, J.V.; Ungureanu, A. The importance of economic structure evolution in achieving performance from agrarian economy to competitiveness in Romanian economy. Екoнoмика пoљoпривреде 2014, 61, 945–957. [Google Scholar] [CrossRef]
- D’Amico, M.; Coppola, A.; Chinnici, G.; Di Vita, G.; Gioacchino, P. Agricultural systems in the European Union: An analysis of regional differences, New Medit. Mediterr. J. Econ. Agric. Environ. 2013, 4, 28–34. [Google Scholar]
- Martinho, V.J.P.D. Efficiency, total factor productivity and returns to scale in a sustainable perspective: An analysis in the European Union at farm and regional level. Land Use Policy 2017, 7, 529–540. [Google Scholar] [CrossRef]
- Sterghiu, N.; Draghici, M.; Necula, R. The agricultural holdings structural analysis from European Union and from Romania by characterizing their main indicators. Sci. Pap. Ser. Manag. Econ. Eng. Agric. Rural Dev. 2014, 14, 375–380. [Google Scholar]
- Szabo, L.; Grznar, M.; Zelina, M. Agricultural performance in the V4 countries and its position in the European Union. Agric. Econ. 2018, 64, 337–346. [Google Scholar] [CrossRef]
- Ryś-Jurek, R. Working Capital Management vs Profitability in Agricultural Holdings (in the Context of Integration for “Old” and “New” EU Members). Eur. Res. Stud. J. 2021, 24, 173–187. [Google Scholar] [CrossRef] [PubMed]
- Martinho, V.J.P.D. Testing for Structural Changes in the European Union’s Agricultural Sector. Agriculture 2019, 9, 92. [Google Scholar] [CrossRef]
- Alaoui, A.; Barão, L.; Ferreira, C.S.S.; Hessel, R. An Overview of Sustainability Assessment Frameworks in Agriculture. Land 2022, 11, 537. [Google Scholar] [CrossRef]
- Jarosz-Angowska, A.; Nowak, A.; Kołodziej, E.; Klikocka, H. Effect of European Integration on the Competitiveness of the Agricultural Sector in New Member States (EU-13) on the Internal EU Market. Sustainability 2022, 14, 13124. [Google Scholar] [CrossRef]
- Zakrzewska, A.; Nowak, A. Diversification of Agricultural Output Intensity across the European Union in Light of the Assumptions of Sustainable Development. Agriculture 2022, 12, 1370. [Google Scholar] [CrossRef]
- EUROSTAT Database. Agriculture, Forestry and Fisheries. Available online: https://ec.europa.eu/eurostat/databrowser/explore/all/agric?lang=en&display=list&sort=category&extractionId=AACT_EAA01__custom_3183076 (accessed on 16 December 2022).
- EC. European Commission, Eurostat, Statistical Factsheet, European Union. 2021. Available online: https://agriculture.ec.europa.eu/document/download/6aa74b11-9ea9-454d-80df-53e0c9cfe3f8_en?filename=agri-statistical-factsheet-eu_en.pdf (accessed on 13 December 2022).
- FAO. Food and Agriculture Organization of the United Nations. Productivity and Efficiency Measurement in Agriculture Literature Review and Gaps Analysis. Publication Prepared in the Framework of the Global Strategy to Improve Agricultural and Rural Statistics. 2017. Available online: https://www.fao.org/3/ca6428en/ca6428en.pdf (accessed on 13 October 2022).
- The Organisation for Economic Co-Operation and Development. Glossary of Statistical Terms. Available online: https://stats.oecd.org/glossary/detail.asp?ID=956 (accessed on 11 October 2022).
- Eurostat. Statistics Explained. Agriculture Glossary. Available online: https://ec.europa.eu/eurostat/statistics-explained/index.php?title=Category:Agriculture_glossary (accessed on 11 October 2022).
- European Commission. Agri-Food Data Portal. Available online: https://agridata.ec.europa.eu/Qlik_Downloads/InfoSheetSectorial/infoC25.html (accessed on 19 October 2022).
- Seyed Mojtaba, M.; Shahrokh, D.; Zohreh, A. A Short Introduction to Comparative Research. 2019. Available online: https://www.researchgate.net/publication/336278925_A_Short_Introduction_to_Comparative_Research (accessed on 3 January 2023).
- Ionescu, R.V.; Zlati, M.L.; Antohi, V.M. A New Approach on Making European Agriculture More Efficient under Uncertainty Conditions. Agronomy 2022, 12, 2559. [Google Scholar] [CrossRef]
- Šverko, Z.; Vrankić, M.; Vlahinić, S.; Rogelj, P. Complex Pearson Correlation Coefficient for EEG Connectivity Analysis. Sensors 2022, 22, 1477. [Google Scholar] [CrossRef] [PubMed]
- Murtagh, F.; Legendre, P. Ward’s Hierarchical Clustering Method: Clustering Criterion and Agglomerative Algorithm. 2011. Available online: https://www.researchgate.net/publication/51962445_Ward’s_Hierarchical_Clustering_Method_Clustering_Criterion_andAgglomerative_Algorithm (accessed on 4 January 2023).
- Vranken, L.; Tabeau, E.; Roebeling, P. Final Report Data and Information on Agricultural Land Market Regulations across EU MS “Agricultural Land Market Regulations in the EU Member States” under the AgEconEurope II Framework Contract for Services 935680-2018-A08-NL. 2021. Available online: https://www.europeanlandowners.org/images/AGRI__LAND_MARKET_REGULATIONS_IN_THE_EU_/Agri-Land_EU_-_D3_-_MAIN_REPORT_final-3_21.04.27.pdf (accessed on 3 January 2023).
- Martin, W. Economic growth, convergence and agricultural economics. Agric. Econ. 2019, 50, 7–27. [Google Scholar] [CrossRef]
- Cingiz, K.; Gonzalez-Hermoso, H.; Heijman, W.; Wesseler, J.H.H. A Cross-Country Measurement of the EU Bioeconomy: An Input–Output Approach. Sustainability 2021, 13, 3033. [Google Scholar] [CrossRef]
- Suh, D.H.; Moss, C.B. Examining the Input and Output Linkages in Agricultural Production Systems. Agriculture 2021, 11, 54. [Google Scholar] [CrossRef]
- Reza Anik, A.; Rahman, S.; Sarker, J.R. Five Decades of Productivity and Efficiency Changes in World Agriculture (1969–2013). Agriculture 2020, 10, 200. [Google Scholar] [CrossRef]
- Ðokic, D.; Novakovic, T.; Tekic, D.; Matkovski, B.; Zekic, S.; Milic, D. Technical Efficiency of Agriculture in the European Union and Western Balkans: SFA Method. Agriculture 2022, 12, 1992. [Google Scholar] [CrossRef]
- Kołodziejczak, W. Employment and Gross Value Added in Agriculture Versus Other Sectors of the European Union Economy. Sustainability 2020, 12, 5518. [Google Scholar] [CrossRef]
- Kyrgiakos, L.S.; Vlontzos, G.; Pardalos, P.M. Ranking EU Agricultural Sectors under the Prism of Alternative Widths on Window DEA. Energies 2021, 14, 1021. [Google Scholar] [CrossRef]

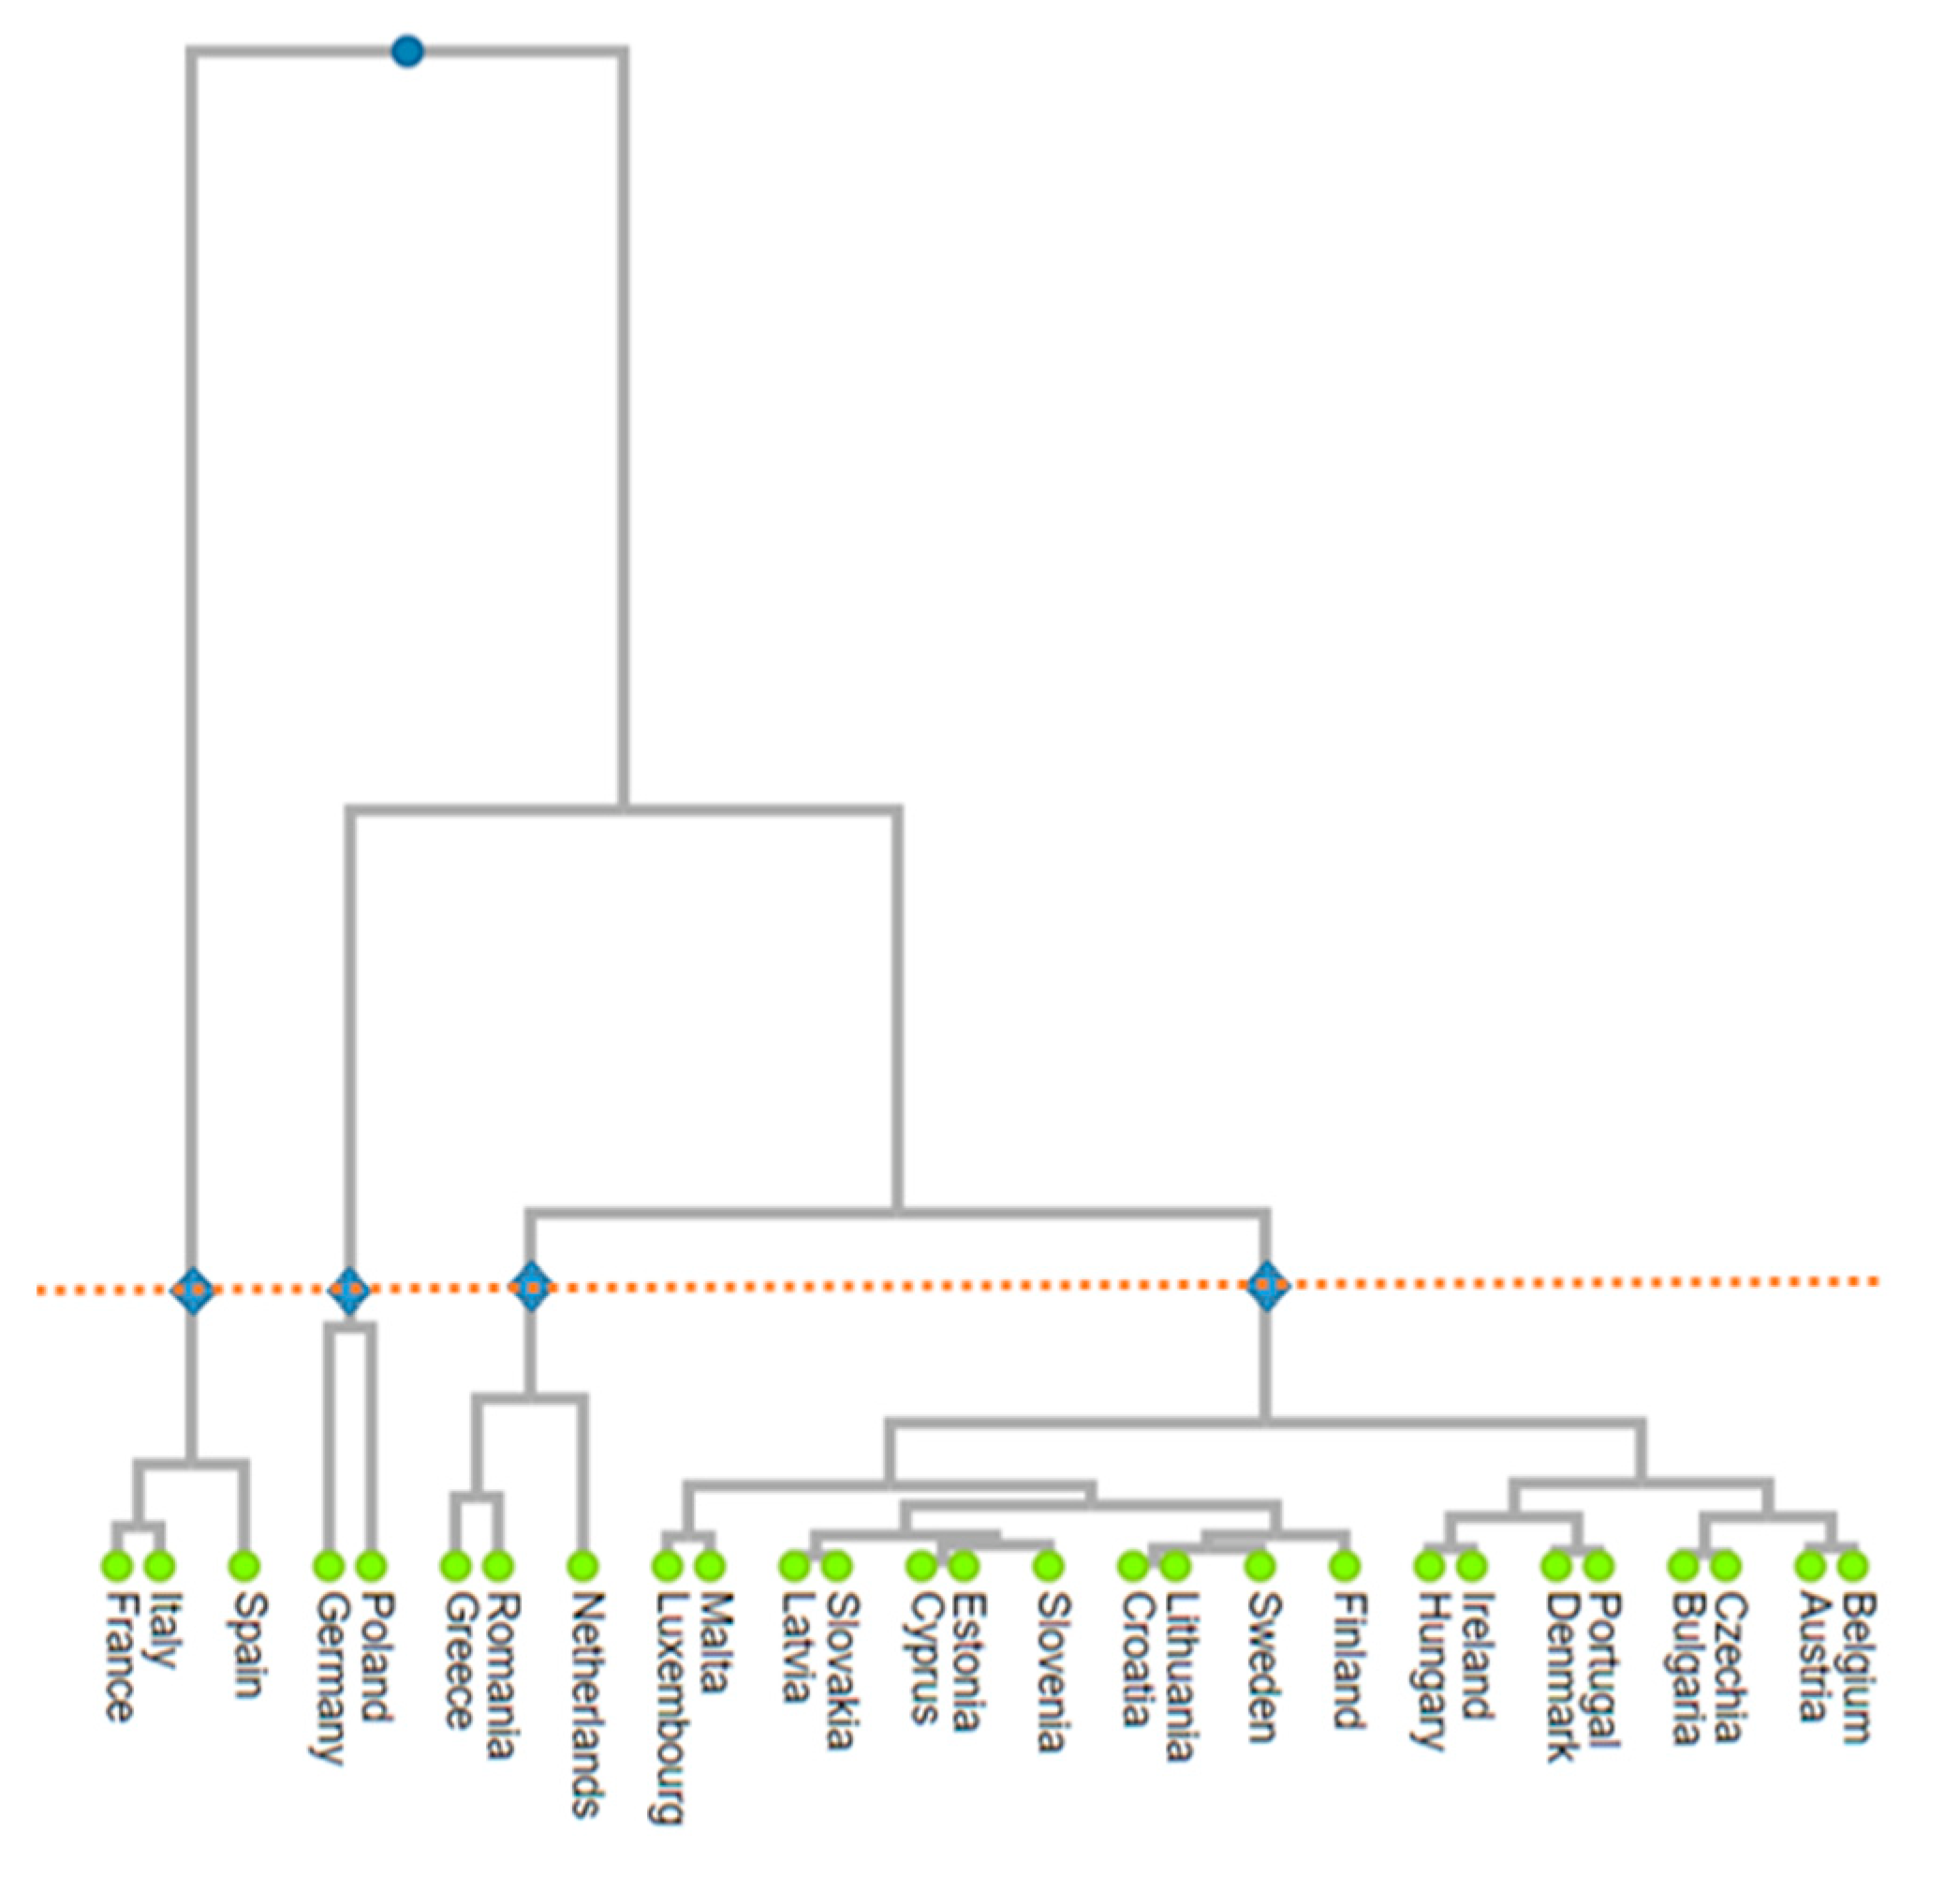
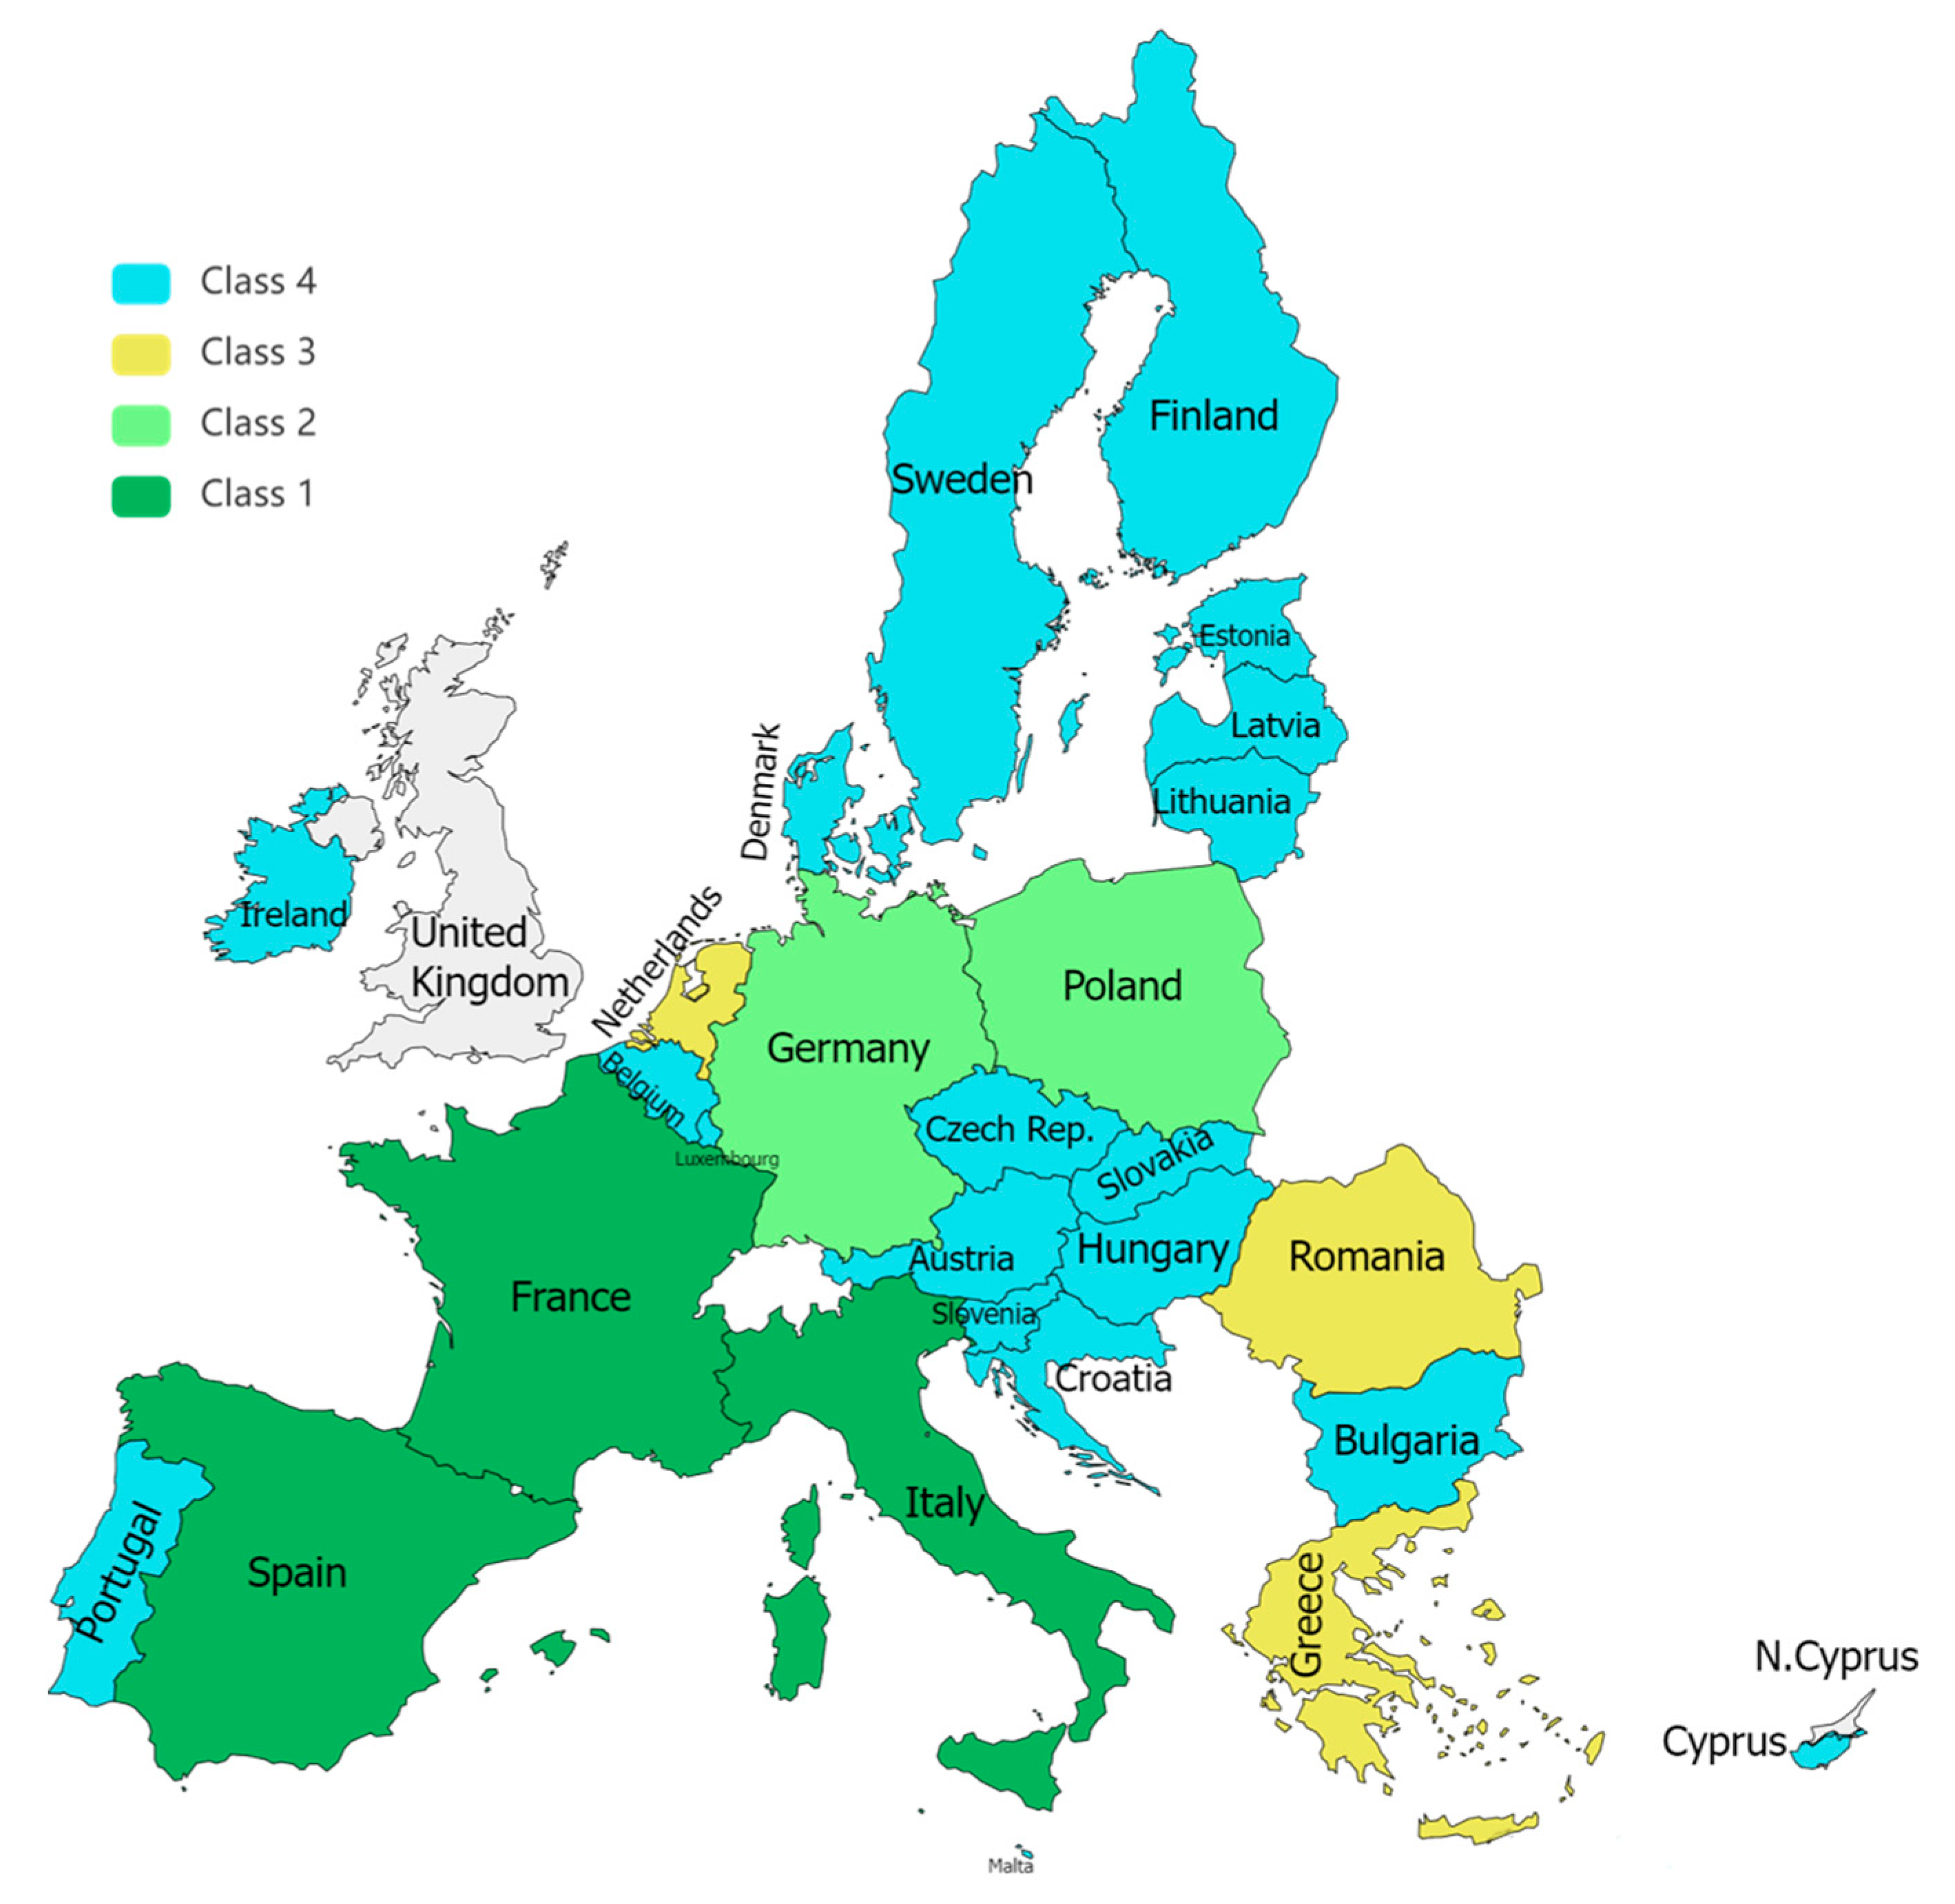
| No. | Country/Item | Farm Area | UAA | Arable Land | |||
|---|---|---|---|---|---|---|---|
| Value | % of EU | Value | % of EU | Value | % of EU | ||
| 1 | Austria | 4798 | 2.5 | 2603 | 1.7 | 13,229 | 1.3 |
| 2 | Belgium | 1392 | 0.7 | 1368 | 0.9 | 8693 | 0.9 |
| 3 | Bulgaria | 4907 | 2.6 | 4564 | 2.9 | 33,184 | 3.4 |
| 4 | Croatia | 1647 | 0.9 | 1505 | 1.0 | 8880 | 0.9 |
| 5 | Cyprus | 146 | 0.1 | 134 | 0.1 | 1022 | 0.1 |
| 6 | Czechia | 4923 | 2.6 | 3493 | 2.2 | 24,767 | 2.5 |
| 7 | Denmark | 3152 | 1.7 | 2630 | 1.7 | 23,734 | 2.4 |
| 8 | Estonia | 1211 | 0.6 | 975 | 0.6 | 6929 | 0.7 |
| 9 | Finland | 5305 | 2.8 | 2282 | 1.4 | 22,557 | 2.3 |
| 10 | France | 29,239 | 15.4 | 27,365 | 17.4 | 170,394 | 17.4 |
| 11 | Germany | 18,314 | 9.6 | 16,595 | 10.5 | 116,638 | 11.9 |
| 12 | Greece | 4066 | 2.1 | 3917 | 2.5 | 15,021 | 1.5 |
| 13 | Hungary | 6439 | 3.4 | 4922 | 3.1 | 40,280 | 4.1 |
| 14 | Ireland | 5215 | 2.7 | 4920 | 3.1 | 12,098 | 1.2 |
| 15 | Italy | 16,462 | 8.7 | 12,524 | 8.0 | 71,977 | 7.3 |
| 16 | Latvia | 2830 | 1.5 | 1969 | 1.3 | 13,333 | 1.4 |
| 17 | Lithuania | 3086 | 1.6 | 2915 | 1.9 | 22,373 | 2.3 |
| 18 | Luxembourg | 138 | 0.1 | 132 | 0.1 | 623 | 0.1 |
| 19 | Malta | 11 | 0.0 | 10 | 0.0 | 78 | 0.0 |
| 20 | Netherlands | 1947 | 1.0 | 1818 | 1.2 | 10,082 | 1.0 |
| 21 | Poland | 16,662 | 8.8 | 14,784 | 9.4 | 111,472 | 11.4 |
| 22 | Portugal | 5121 | 2.7 | 3964 | 2.5 | 10,367 | 1.1 |
| 23 | Romania | 13,787 | 7.3 | 12,763 | 8.1 | 85,707 | 8.7 |
| 24 | Slovakia | 3016 | 1.6 | 1863 | 1.2 | 13,253 | 1.4 |
| 25 | Slovenia | 907 | 0.5 | 483 | 0.3 | 1731 | 0.2 |
| 26 | Spain | 28,930 | 15.2 | 23,914 | 15.2 | 117,147 | 11.9 |
| 27 | Sweden | 6478 | 3.4 | 3006 | 1.9 | 25,382 | 2.6 |
| 28 | EU 27 (from 2020) | 190,130 | 100.0 | 157,416 | 100.0 | 980,948 | 100.0 |
| No. | Country/Item | Farm Number | Total Economic Size | UAA/Farm (ha) | Economic Size/Farm (Thousand Euro/S.O.) | ||
|---|---|---|---|---|---|---|---|
| Number (Thousands) | % of EU | Value (Millions Euro/S.O.) | % of EU | ||||
| 1 | Austria | 110.8 | 1.2 | 6330.0 | 1.8 | 23.5 | 57.1 |
| 2 | Belgium | 36.0 | 0.4 | 8083.5 | 2.3 | 38.0 | 224.5 |
| 3 | Bulgaria | 132.7 | 1.5 | 3772.0 | 1.1 | 34.4 | 28.4 |
| 4 | Croatia | 143.9 | 1.6 | 1945.5 | 0.6 | 10.5 | 13.5 |
| 5 | Cyprus | 34.1 | 0.4 | 749.3 | 0.2 | 3.9 | 22.0 |
| 6 | Czechia | 28.9 | 0.3 | 5224.7 | 1.5 | 120.9 | 180.8 |
| 7 | Denmark | 37.1 | 0.4 | 8886.7 | 2.5 | 70.9 | 239.5 |
| 8 | Estonia | 11.4 | 0.1 | 756.5 | 0.2 | 85.5 | 66.4 |
| 9 | Finland | 45.6 | 0.5 | 3192.4 | 0.9 | 50.0 | 70.0 |
| 10 | France | 393.0 | 4.3 | 62,267.6 | 17.7 | 69.6 | 158.4 |
| 11 | Germany | 262.8 | 2.9 | 44,050.0 | 12.5 | 63.1 | 167.6 |
| 12 | Greece | 530.8 | 5.9 | 7354.9 | 2.1 | 7.4 | 13.9 |
| 13 | Hungary | 232.1 | 2.6 | 6387.9 | 1.8 | 21.2 | 27.5 |
| 14 | Ireland | 130.2 | 1.4 | 6851.2 | 2.0 | 37.8 | 52.6 |
| 15 | Italy | 1133.0 | 12.5 | 65,353.4 | 18.6 | 11.1 | 57.7 |
| 16 | Latvia | 69.0 | 0.8 | 1319.6 | 0.4 | 28.5 | 19.1 |
| 17 | Lithuania | 132.1 | 1.5 | 2215.6 | 0.6 | 22.1 | 16.8 |
| 18 | Luxembourg | 1.9 | 0.0 | 323.5 | 0.1 | 69.5 | 170.3 |
| 19 | Malta | 7.7 | 0.1 | 66.9 | 0.0 | 1.3 | 8.7 |
| 20 | Netherlands | 52.6 | 0.6 | 23,571.2 | 6.7 | 34.6 | 448.1 |
| 21 | Poland | 1302.3 | 14.4 | 25,630.6 | 7.3 | 11.4 | 19.7 |
| 22 | Portugal | 290.2 | 3.2 | 6369.1 | 1.8 | 13.7 | 21.9 |
| 23 | Romania | 2887.1 | 31.8 | 11,692.8 | 3.3 | 4.4 | 4.1 |
| 24 | Slovakia | 19.6 | 0.2 | 1836.2 | 0.5 | 95.1 | 93.7 |
| 25 | Slovenia | 72.5 | 0.8 | 1120.9 | 0.3 | 6.7 | 15.5 |
| 26 | Spain | 914.9 | 10.1 | 40,368.2 | 11.5 | 26.1 | 44.1 |
| 27 | Sweden | 58.8 | 0.6 | 5359.1 | 1.5 | 51.1 | 91.1 |
| 28 | EU 27 (from 2020) | 9071.0 | 100.0 | 351,079.3 | 100.0 | 17.4 | 38.7 |
| No. | Country/Item | Total Economy | Agriculture | Machines and Other Agricultural Equipment | |||
|---|---|---|---|---|---|---|---|
| Value (Million Euro) | % of GDP | Value (Million Euro) | % of Total Economy | Value (Million Euro) | % of Agricultural GFCF | ||
| 1 | Austria | 95,768.40 | 25.2 | 2251.38 | 2.52 | 995.00 | 44.2 |
| 2 | Belgium | 109,301.80 | 23.9 | 1327.63 | 1.43 | 315.39 | 23.8 |
| 3 | Bulgaria | 11,750.20 | 19.2 | 436.33 | 4.84 | 211.71 | 48.5 |
| 4 | Croatia | 11,197.50 | 22.3 | 201.40 | 3.92 | 37.28 | 18.5 |
| 5 | Cyprus | 4308.30 | 19.9 | 34.47 | 0.68 | 1.48 | 4.3 |
| 6 | Czechia | 57,290.80 | 26.5 | 972.94 | 3.00 | 402.64 | 41.4 |
| 7 | Denmark | 69,506.20 | 22.3 | 1217.46 | 1.55 | 711.28 | 58.4 |
| 8 | Estonia | 8233.10 | 30.7 | 213.01 | 2.64 | 128.38 | 60.3 |
| 9 | Finland | 57,463.00 | 24.1 | 1186.00 | 2.87 | 204.00 | 17.2 |
| 10 | France | 529,854.00 | 22.9 | 10,317.77 | 2.19 | 6556.33 | 63.5 |
| 11 | Germany | 735,869.00 | 21.9 | 9342.96 | 1.29 | 5698.00 | 61.0 |
| 12 | Greece | 19,271.20 | 11.7 | 1792.99 | 9.84 | 904.46 | 50.4 |
| 13 | Hungary | 36,602.90 | 26.6 | 1148.20 | 3.54 | 287.45 | 25.0 |
| 14 | Ireland | 158,065.80 | 42.4 | 1127.24 | 0.79 | 606.19 | 53.8 |
| 15 | Italy | 295,658.80 | 17.8 | 8262.10 | 3.11 | 2377.51 | 28.8 |
| 16 | Latvia | 7217.00 | 24.5 | 243.12 | 6.03 | 180.97 | 74.4 |
| 17 | Lithuania | 10,423.50 | 21.1 | 543.30 | 5.92 | 208.00 | 38.3 |
| 18 | Luxembourg | 10,788.60 | 16.8 | 99.55 | 1.41 | 30.81 | 30.9 |
| 19 | Malta | 2686.10 | 20.6 | 11.78 | 0.67 | 2.76 | 23.4 |
| 20 | Netherlands | 172,937.00 | 21.7 | 4984.88 | 2.99 | 2390.73 | 48.0 |
| 21 | Poland | 90,667.80 | 17.2 | 1370.46 | 3.80 | 485.44 | 35.4 |
| 22 | Portugal | 38,183.10 | 19.1 | 1129.79 | 3.47 | 277.73 | 24.6 |
| 23 | Romania | 52,182.60 | 23.8 | 1612.95 | 4.19 | 333.21 | 20.7 |
| 24 | Slovakia | 18,072.90 | 19.6 | 132.89 | 3.69 | 27.76 | 20.9 |
| 25 | Slovenia | 8860.50 | 18.9 | 236.44 | 4.51 | 70.32 | 29.7 |
| 26 | Spain | 227,599.00 | 20.3 | 4823.95 | 2.92 | 908.92 | 18.8 |
| 27 | Sweden | 120,694.30 | 25.1 | 1148.45 | 2.14 | 549.05 | 47.8 |
| 28 | EU 27 (from 2020) | 2,960,453.50 | 22.1 | 56,169.44 | 2.30 | 24,902.79 | 44.3 |
| No. | Country/Item | GFCF—Total Value (Million Euro) | GFCF/Farm (Euro/Farm) | GFCF/UAA (Euro/ha) |
|---|---|---|---|---|
| 1 | Austria | 2251.38 | 20,323.0 | 865.0 |
| 2 | Belgium | 1327.63 | 36,878.6 | 970.4 |
| 3 | Bulgaria | 436.33 | 3287.1 | 95.6 |
| 4 | Croatia | 201.40 | 1399.3 | 133.8 |
| 5 | Cyprus | 34.47 | 1012.3 | 257.0 |
| 6 | Czechia | 972.94 | 33,654.1 | 278.6 |
| 7 | Denmark | 1217.46 | 32,824.5 | 462.9 |
| 8 | Estonia | 213.01 | 18,734.4 | 218.4 |
| 9 | Finland | 1186.00 | 25,991.7 | 519.8 |
| 10 | France | 10,317.77 | 26,251.9 | 377.0 |
| 11 | Germany | 9342.96 | 35,554.3 | 563.0 |
| 12 | Greece | 1792.99 | 3378.2 | 457.8 |
| 13 | Hungary | 1148.20 | 4947.9 | 233.3 |
| 14 | Ireland | 1127.24 | 8656.4 | 229.1 |
| 15 | Italy | 8262.10 | 7292.1 | 659.7 |
| 16 | Latvia | 243.12 | 3524.5 | 123.5 |
| 17 | Lithuania | 543.30 | 4113.4 | 186.4 |
| 18 | Luxembourg | 99.55 | 52,952.1 | 753.4 |
| 19 | Malta | 11.78 | 1539.9 | 1202.0 |
| 20 | Netherlands | 4984.88 | 94,697.6 | 2742.1 |
| 21 | Poland | 1370.46 | 1052.3 | 92.7 |
| 22 | Portugal | 1129.79 | 3892.7 | 285.0 |
| 23 | Romania | 1612.95 | 558.7 | 126.4 |
| 24 | Slovakia | 132.89 | 6769.7 | 71.3 |
| 25 | Slovenia | 236.44 | 3262.6 | 489.1 |
| 26 | Spain | 4823.95 | 5272.8 | 201.7 |
| 27 | Sweden | 1148.45 | 19,534.8 | 382.1 |
| 28 | EU 27 (from 2020) | 56,169.44 | 6192.2 | 356.8 |
| No. | Country/Item | Direct Payments | Market Measures | Rural Development | Total |
|---|---|---|---|---|---|
| 1 | Austria | 691,597 | 22,298 | 567,266 | 1281,161 |
| 2 | Belgium | 481,836 | 60,758 | 102,723 | 645,317 |
| 3 | Bulgaria | 781,855 | 18,386 | 338,990 | 1,139,231 |
| 4 | Croatia | 317,338 | 13,061 | 282,343 | 612,741 |
| 5 | Cyprus | 48,125 | 5922 | 18,881 | 72,929 |
| 6 | Czechia | 855,832 | 16,537 | 321,615 | 1,193,984 |
| 7 | Denmark | 814,070 | 12,212 | 151,589 | 977,871 |
| 8 | Estonia | 142,536 | 1476 | 129,177 | 273,189 |
| 9 | Finland | 523,450 | 6473 | 344,777 | 874,699 |
| 10 | France | 6,909,823 | 550,551 | 1,987,740 | 9,448,114 |
| 11 | Germany | 4,768,123 | 117,256 | 1,394,589 | 6,279,967 |
| 12 | Greece | 1,982,609 | 59,445 | 698,261 | 2,740,315 |
| 13 | Hungary | 1,266,719 | 40,211 | 486,663 | 1,793,593 |
| 14 | Ireland | 1,201,194 | 59,338 | 312,570 | 1,573,102 |
| 15 | Italy | 3,599,133 | 677,514 | 1,501,763 | 5,778,411 |
| 16 | Latvia | 277,306 | 3048 | 161,492 | 441,846 |
| 17 | Lithuania | 480,492 | 3344 | 264,151 | 747,987 |
| 18 | Luxembourg | 32,841 | 556 | 14,511 | 47,909 |
| 19 | Malta | 5117 | 344 | 13,859 | 19,320 |
| 20 | Netherlands | 666,190 | 22,583 | 147,976 | 836,749 |
| 21 | Poland | 3,402,201 | 25,553 | 1,187,301 | 4,615,055 |
| 22 | Portugal | 680,228 | 107,898 | 582,456 | 1,370,581 |
| 23 | Romania | 1,912,461 | 65,671 | 1,139,927 | 3,118,059 |
| 24 | Slovakia | 447,758 | 11,255 | 214,525 | 673,538 |
| 25 | Slovenia | 133,869 | 7022 | 120,721 | 261,611 |
| 26 | Spain | 5,125,093 | 599,856 | 1,183,394 | 6,908,343 |
| 27 | Sweden | 686,818 | 11,875 | 249,819 | 948,511 |
| 28 | EU 27 (from 2020) | 38,234,612 | 2,520,441 | 13,919,080 | 54,674,132 |
| No. | Country/Item | Direct Payments Euro/ha | % of Direct Payments in Agricultural Output/UAA (Including Subsidies) | % of Direct Payments in Factor Income | |
|---|---|---|---|---|---|
| Value | Deviation | ||||
| 1 | Austria | 350 | 34.4 | 10.6 | 40.51 |
| 2 | Belgium | 377 | 61.4 | 5.4 | 20.64 |
| 3 | Bulgaria | 229 | −86.6 | 20.6 | 44.62 |
| 4 | Croatia | 365 | 49.4 | 18.5 | 40.72 |
| 5 | Cyprus | 377 | 61.4 | 6.2 | 12.40 |
| 6 | Czechia | 273 | −42.6 | 14.5 | 41.12 |
| 7 | Denmark | 308 | −7.6 | 6.5 | 26.34 |
| 8 | Estonia | 170 | −145.6 | 14.3 | 48.37 |
| 9 | Finland | 302 | −13.6 | 13.3 | 39.21 |
| 10 | France | 291 | −24.6 | 9.4 | 30.63 |
| 11 | Germany | 283 | −32.6 | 7.6 | 30.12 |
| 12 | Greece | 546 | 230.4 | 15.1 | 29.64 |
| 13 | Hungary | 254 | −61.6 | 13.0 | 33.40 |
| 14 | Ireland | 239 | −76.6 | 11.7 | 29.33 |
| 15 | Italy | 379 | 63.4 | 7.6 | 18.64 |
| 16 | Latvia | 166 | −149.6 | 15.9 | 43.86 |
| 17 | Lithuania | 176 | −139.6 | 12.8 | 38.51 |
| 18 | Luxembourg | 318 | 2.4 | 8.7 | 44.36 |
| 19 | Malta | 911 | 595.4 | 6.9 | 12.24 |
| 20 | Netherlands | 369 | 53.4 | 2.3 | 9.38 |
| 21 | Poland | 246 | −69.6 | 12.1 | 30.26 |
| 22 | Portugal | 264 | −51.6 | 11.1 | 32.44 |
| 23 | Romania | 215 | −100.6 | 14.0 | 44.10 |
| 24 | Slovakia | 231 | −84.6 | 15.5 | 48.17 |
| 25 | Slovenia | 371 | 55.4 | 11.6 | 31.17 |
| 26 | Spain | 254 | −61.6 | 10.5 | 22.31 |
| 27 | Sweden | 258 | −57.6 | 11.2 | 52.11 |
| 28 | EU 27 (from 2020) average | 315.6 | - | 10.7 | 29.90 |
| No. | Country/Item | AWU | Total Agricultural Output | |||
|---|---|---|---|---|---|---|
| Total Value | AWU/ Farm | Total Value | Euro/ Farm | Euro/ AWU | ||
| 1 | Austria | 121.57 | 1.1 | 7645.59 | 69,003.5 | 62,890.4 |
| 2 | Belgium | 52.21 | 1.5 | 9057.99 | 251,610.8 | 173,491.5 |
| 3 | Bulgaria | 181.90 | 1.4 | 4021.96 | 30,308.7 | 22,110.8 |
| 4 | Croatia | 172.28 | 1.2 | 2422.11 | 16,831.9 | 14,059.1 |
| 5 | Cyprus | 19.13 | 0.6 | 759.14 | 22,262.2 | 39,683.2 |
| 6 | Czechia | 95.37 | 3.3 | 5632.71 | 194,903.5 | 59,061.7 |
| 7 | Denmark | 51.14 | 1.4 | 11,617.20 | 313,132.1 | 227,164.6 |
| 8 | Estonia | 17.28 | 1.5 | 995.34 | 87,310.5 | 57,600.7 |
| 9 | Finland | 65.59 | 1.4 | 4475.27 | 98,141.9 | 68,231.0 |
| 10 | France | 710.21 | 1.8 | 76,630.72 | 194,989.1 | 107,898.7 |
| 11 | Germany | 469.00 | 1.8 | 57,345.40 | 218,209.3 | 122,271.6 |
| 12 | Greece | 326.40 | 0.6 | 12,051.74 | 22,704.9 | 36,923.2 |
| 13 | Hungary | 326.94 | 1.4 | 8398.47 | 36,184.7 | 25,688.1 |
| 14 | Ireland | 156.94 | 1.2 | 8891.82 | 68,293.5 | 56,657.4 |
| 15 | Italy | 1059.30 | 0.9 | 57,833.34 | 51,044.4 | 54,595.8 |
| 16 | Latvia | 67.15 | 1.0 | 1727.16 | 25,031.3 | 25,720.9 |
| 17 | Lithuania | 125.26 | 0.9 | 3486.40 | 26,392.1 | 27,833.3 |
| 18 | Luxembourg | 3.55 | 1.9 | 439.85 | 231,500.0 | 123,901.4 |
| 19 | Malta | 5.40 | 0.7 | 121.09 | 15,726.0 | 22,424.1 |
| 20 | Netherlands | 156.70 | 3.0 | 28,235.59 | 536,798.3 | 180,188.8 |
| 21 | Poland | 1427.70 | 1.1 | 26,405.78 | 20,276.3 | 18,495.3 |
| 22 | Portugal | 233.36 | 0.8 | 8403.49 | 28,957.6 | 36,010.8 |
| 23 | Romania | 1090.00 | 0.4 | 16,824.17 | 5827.4 | 15,435.0 |
| 24 | Slovakia | 42.50 | 2.2 | 2348.02 | 119,796.9 | 55,247.5 |
| 25 | Slovenia | 74.05 | 1.0 | 1370.29 | 18,900.6 | 18,504.9 |
| 26 | Spain | 851.38 | 0.9 | 51,787.23 | 56,604.3 | 60,827.4 |
| 27 | Sweden | 57.41 | 1.0 | 6170.33 | 104,937.6 | 107,478.3 |
| 28 | EU 27 (from 2020) | 7959.72 | 0.9 | 415,098.18 | 45,761.0 | 52,149.8 |
| No. | Country/Item | AWU | Total Agricultural Output | Gross Fixed Capital Formation | |||
|---|---|---|---|---|---|---|---|
| Total Value (Thousand) | AWU/ UAA | Total Value (Million Euro) | Euro/ UAA | Total Value (Million Euro) | Euro/ UAA | ||
| 1 | Austria | 121.57 | 0.05 | 7645.59 | 2937.6 | 2251.38 | 865.0 |
| 2 | Belgium | 52.21 | 0.04 | 9057.99 | 6620.8 | 1327.63 | 970.4 |
| 3 | Bulgaria | 181.90 | 0.04 | 4021.96 | 881.2 | 436.33 | 95.6 |
| 4 | Croatia | 172.28 | 0.11 | 2422.11 | 1608.9 | 201.40 | 133.8 |
| 5 | Cyprus | 19.13 | 0.14 | 759.14 | 5659.3 | 34.47 | 257.0 |
| 6 | Czechia | 95.37 | 0.03 | 5632.71 | 1612.8 | 972.94 | 278.6 |
| 7 | Denmark | 51.14 | 0.02 | 11,617.20 | 4417.3 | 1217.46 | 462.9 |
| 8 | Estonia | 17.28 | 0.02 | 995.34 | 1020.5 | 213.01 | 218.4 |
| 9 | Finland | 65.59 | 0.03 | 4475.27 | 1961.4 | 1186.00 | 519.8 |
| 10 | France | 710.21 | 0.03 | 76,630.72 | 2800.4 | 10,317.77 | 377.0 |
| 11 | Germany | 469.00 | 0.03 | 57,345.40 | 3455.6 | 9342.96 | 563.0 |
| 12 | Greece | 326.40 | 0.08 | 12,051.74 | 3077.1 | 1792.99 | 457.8 |
| 13 | Hungary | 326.94 | 0.07 | 8398.47 | 1706.4 | 1148.20 | 233.3 |
| 14 | Ireland | 156.94 | 0.03 | 8891.82 | 1807.2 | 1127.24 | 229.1 |
| 15 | Italy | 1059.30 | 0.08 | 57,833.34 | 4618.0 | 8262.10 | 659.7 |
| 16 | Latvia | 67.15 | 0.03 | 1727.16 | 877.2 | 243.12 | 123.5 |
| 17 | Lithuania | 125.26 | 0.04 | 3486.40 | 1196.2 | 543.30 | 186.4 |
| 18 | Luxembourg | 3.55 | 0.03 | 439.85 | 3328.7 | 99.55 | 753.4 |
| 19 | Malta | 5.40 | 0.55 | 121.09 | 12,356.1 | 11.78 | 1202.0 |
| 20 | Netherlands | 156.70 | 0.09 | 28,235.59 | 15,532.0 | 4984.88 | 2742.1 |
| 21 | Poland | 1427.70 | 0.10 | 26,405.78 | 1786.1 | 1370.46 | 92.7 |
| 22 | Portugal | 233.36 | 0.06 | 8403.49 | 2120.0 | 1129.79 | 285.0 |
| 23 | Romania | 1090.00 | 0.09 | 16,824.17 | 1318.2 | 1612.95 | 126.4 |
| 24 | Slovakia | 42.50 | 0.02 | 2348.02 | 1260.6 | 132.89 | 71.3 |
| 25 | Slovenia | 74.05 | 0.15 | 1370.29 | 2834.5 | 236.44 | 489.1 |
| 26 | Spain | 851.38 | 0.04 | 51,787.23 | 2165.6 | 4823.95 | 201.7 |
| 27 | Sweden | 57.41 | 0.02 | 6170.33 | 2052.8 | 1148.45 | 382.1 |
| 28 | EU 27 (from 2020) | 7959.72 | 0.05 | 415,098.18 | 2637.0 | 56,169.44 | 356.8 |
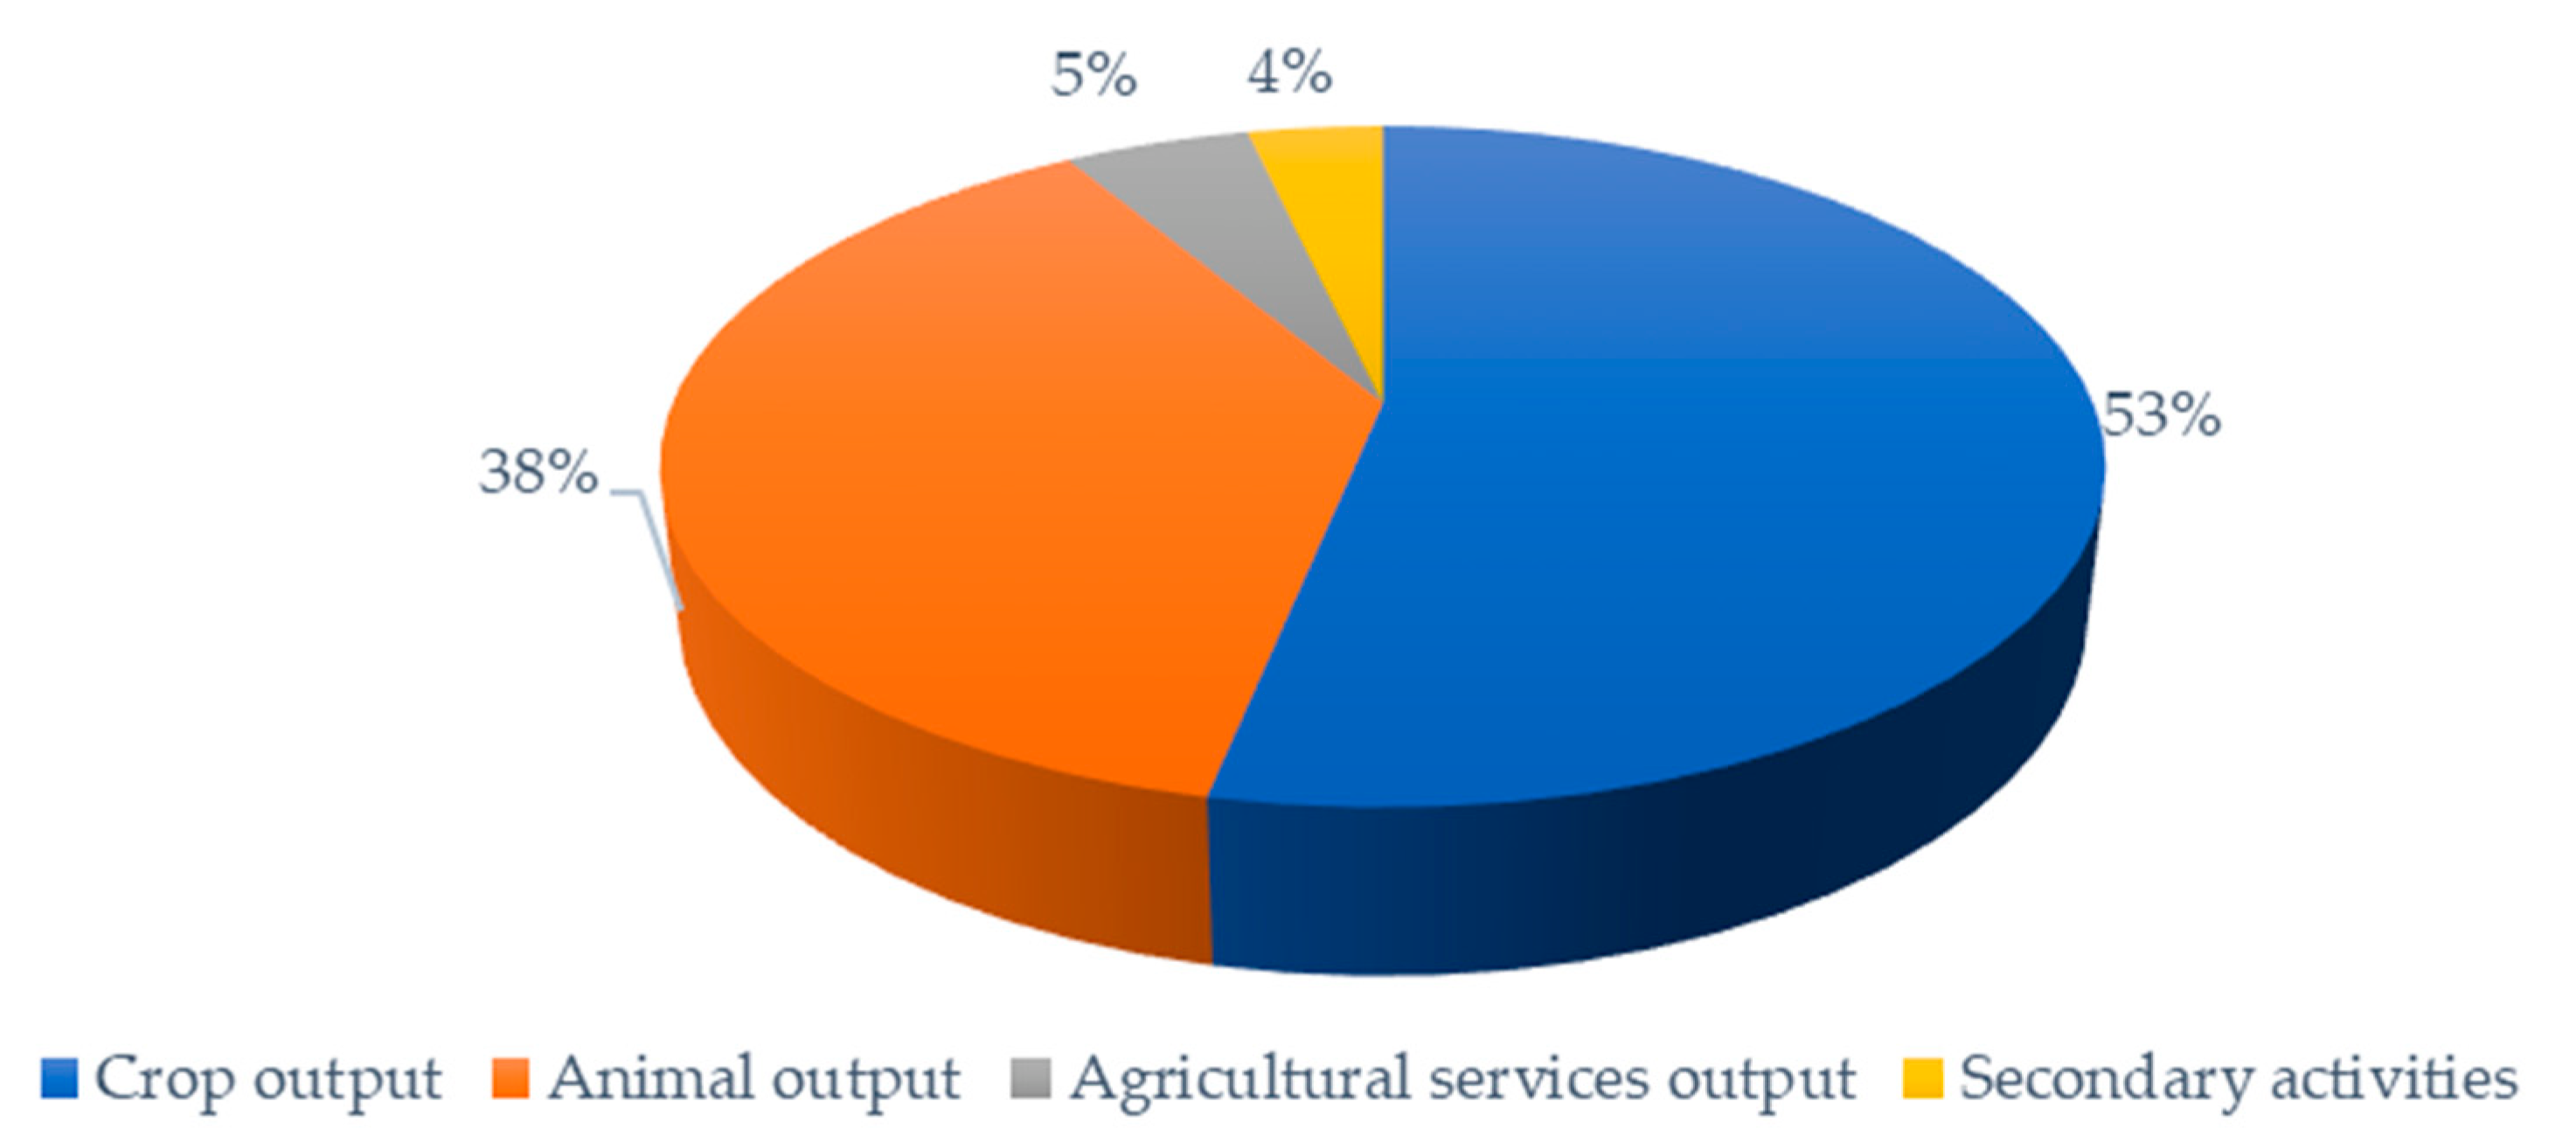
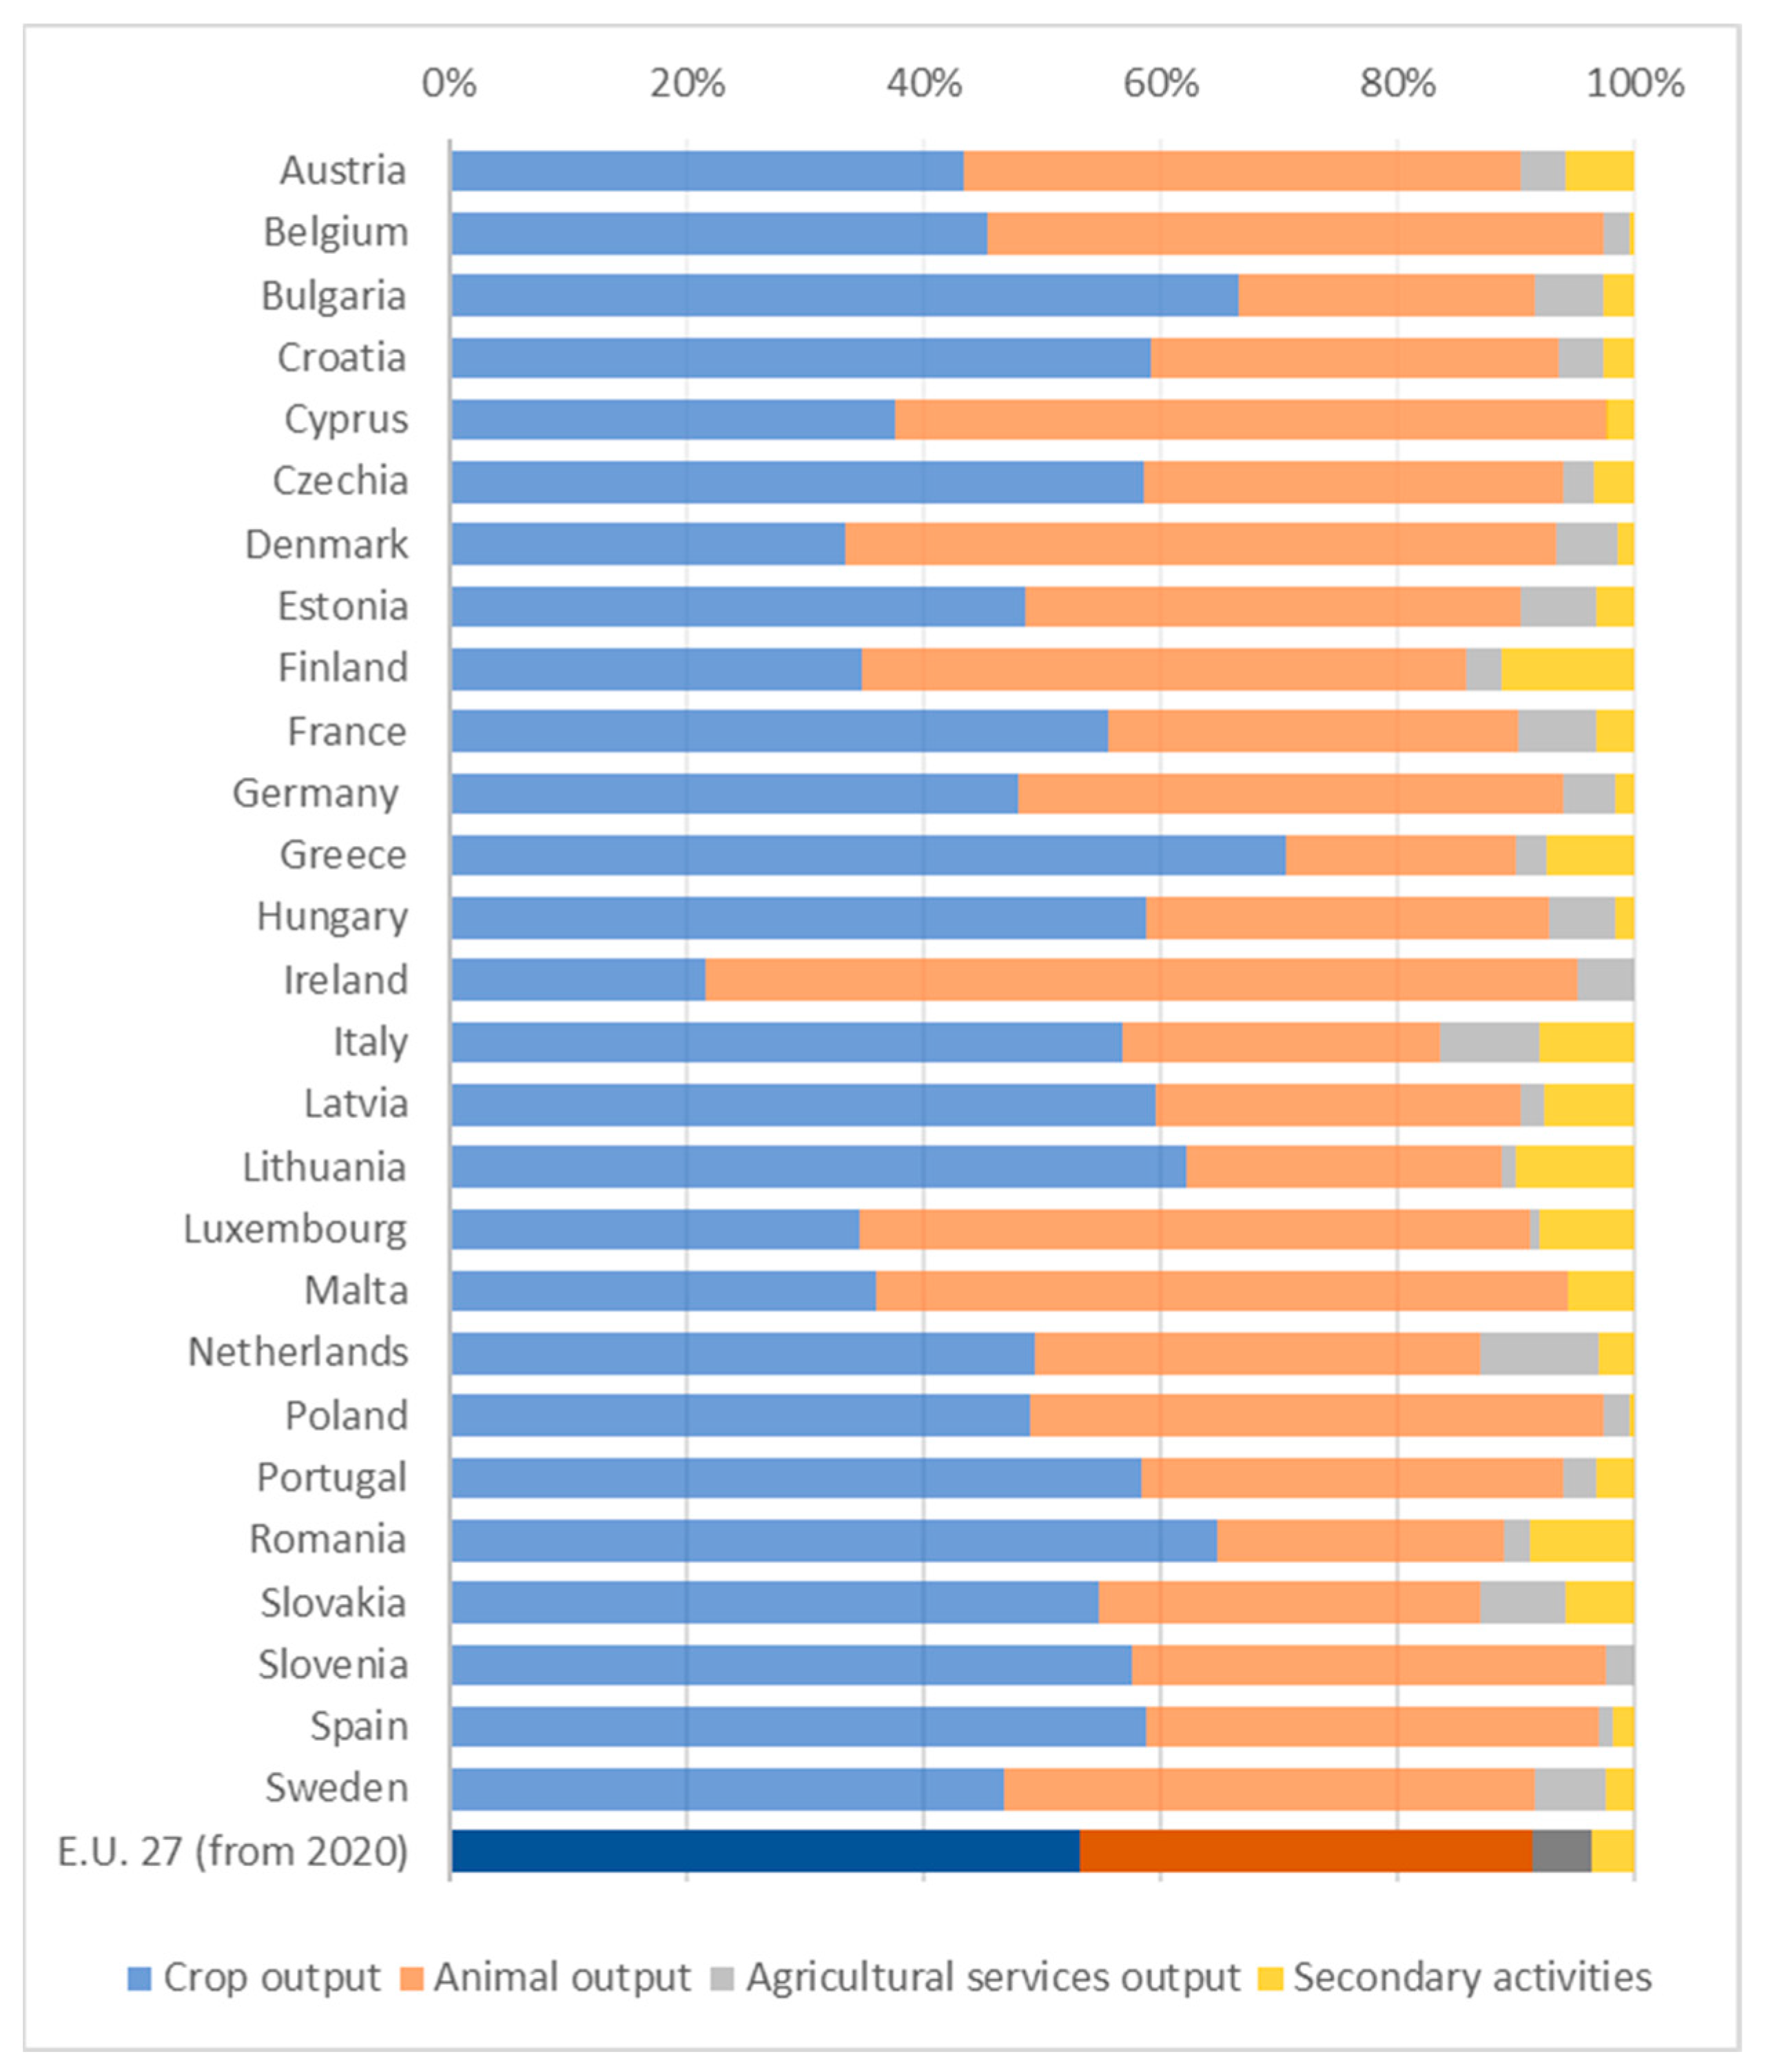
| No. | Country/Item | Crop Output | Animal Output | Agricultural Services Output | Secondary Activities | Total Output |
|---|---|---|---|---|---|---|
| 1 | Austria | 3324.96 | 3582.74 | 290.38 | 447.51 | 7645.59 |
| 2 | Belgium | 4110.79 | 4711.29 | 199.43 | 36.48 | 9057.99 |
| 3 | Bulgaria | 2678.21 | 1003.17 | 236.24 | 104.34 | 4021.96 |
| 4 | Croatia | 1434.10 | 832.76 | 94.52 | 60.73 | 2422.11 |
| 5 | Cyprus | 285.56 | 455.65 | 0.37 | 17.56 | 759.14 |
| 6 | Czechia | 3302.55 | 1988.06 | 151.17 | 190.93 | 5632.71 |
| 7 | Denmark | 3888.43 | 6957.68 | 599.96 | 171.13 | 11,617.20 |
| 8 | Estonia | 484.27 | 414.87 | 63.47 | 32.73 | 995.34 |
| 9 | Finland | 1556.81 | 2286.14 | 135.54 | 496.78 | 4475.27 |
| 10 | France | 42,670.67 | 26,458.82 | 5030.30 | 2470.93 | 76,630.72 |
| 11 | Germany | 27,528.47 | 26,416.83 | 2432.78 | 967.32 | 57,345.40 |
| 12 | Greece | 8504.76 | 2353.60 | 304.98 | 888.40 | 12,051.74 |
| 13 | Hungary | 4939.01 | 2858.23 | 469.78 | 131.45 | 8398.47 |
| 14 | Ireland | 1927.02 | 6534.02 | 430.78 | 0.00 | 8891.82 |
| 15 | Italy | 32,824.79 | 15,506.83 | 4914.08 | 4587.64 | 57,833.34 |
| 16 | Latvia | 1029.04 | 533.19 | 34.74 | 130.19 | 1727.16 |
| 17 | Lithuania | 2167.28 | 930.18 | 42.60 | 346.34 | 3486.40 |
| 18 | Luxembourg | 152.19 | 248.98 | 3.21 | 35.47 | 439.85 |
| 19 | Malta | 43.55 | 70.72 | 0.00 | 6.82 | 121.09 |
| 20 | Netherlands | 13,952.68 | 10,634.50 | 2817.38 | 831.03 | 28,235.59 |
| 21 | Poland | 12,925.06 | 12,799.27 | 592.36 | 89.09 | 26,405.78 |
| 22 | Portugal | 4914.59 | 2992.37 | 235.94 | 260.59 | 8403.49 |
| 23 | Romania | 10,914.36 | 4047.46 | 379.56 | 1482.79 | 16,824.17 |
| 24 | Slovakia | 1288.88 | 755.29 | 165.47 | 138.38 | 2348.02 |
| 25 | Slovenia | 790.65 | 546.39 | 33.25 | 0.00 | 1370.29 |
| 26 | Spain | 30,484.60 | 19,732.35 | 609.93 | 960.35 | 51,787.23 |
| 27 | Sweden | 2892.09 | 2754.47 | 378.43 | 145.34 | 6170.33 |
| 28 | EU 27 (from 2020) | 221,015.36 | 158,405.87 | 20,646.67 | 15,030.28 | 415,098.18 |
| No. | Country/Item | Gross Value Added (GVA) | Total Intermediate Consumption | Fixed Capital Consumption | Other Taxes on Production | Other Subsidies on Production | Factor Income | Factor Income/UAA |
|---|---|---|---|---|---|---|---|---|
| 1 | Austria | 2472.3 | 6504.04 | 812.30 | 2.84 | 622.62 | 2249.16 | 864.1 |
| 2 | Belgium | 3122.3 | 4410.47 | 1878.16 | 155.95 | 1488.53 | 2498.79 | 1826.6 |
| 3 | Bulgaria | 1748.4 | 2181.84 | 453.27 | 7.70 | 1125.64 | 2342.56 | 513.3 |
| 4 | Croatia | 1153.2 | 1291.14 | 316.27 | 0.00 | 491.92 | 1349.12 | 896.4 |
| 5 | Cyprus | 362.3 | 401.38 | 15.79 | 10.07 | 66.85 | 407.37 | 3040.1 |
| 6 | Czechia | 1935.1 | 3652.94 | 773.94 | 43.20 | 1224.29 | 2318.90 | 663.9 |
| 7 | Denmark | 3567.8 | 7832.34 | 1141.14 | 138.39 | 883.15 | 3075.26 | 1169.3 |
| 8 | Estonia | 256.7 | 742.55 | 150.57 | 3.93 | 239.08 | 342.68 | 351.5 |
| 9 | Finland | 1469.8 | 2961.59 | 1221.90 | 0.00 | 1531.32 | 1757.78 | 770.3 |
| 10 | France | 30,910.8 | 44,481.16 | 10,554.53 | 1533.83 | 8009.23 | 25,994.09 | 949.9 |
| 11 | Germany | 20,457.7 | 36,231.50 | 10,738.98 | 251.68 | 6487.51 | 15,590.69 | 939.5 |
| 12 | Greece | 6221.0 | 5880.03 | 1197.55 | 400.51 | 2539.28 | 7214.77 | 1841.9 |
| 13 | Hungary | 3420.4 | 5055.95 | 1085.52 | 32.76 | 1386.93 | 3742.56 | 760.4 |
| 14 | Ireland | 3276.7 | 5704.41 | 1009.48 | 38.22 | 1727.31 | 4008.48 | 814.7 |
| 15 | Italy | 32,470.8 | 24,959.42 | 10,071.44 | 604.01 | 4187.27 | 25,466.58 | 2033.4 |
| 16 | Latvia | 590.1 | 1138.40 | 142.80 | 20.41 | 317.54 | 745.14 | 378.4 |
| 17 | Lithuania | 1499.8 | 1958.05 | 391.10 | 1.11 | 246.36 | 1332.37 | 457.1 |
| 18 | Luxembourg | 126.1 | 299.70 | 95.61 | 1.77 | 71.59 | 94.62 | 716.8 |
| 19 | Malta | 53.4 | 66.69 | 7.25 | 0.00 | 29.07 | 74.41 | 7441.0 |
| 20 | Netherlands | 10,571.7 | 17,329.60 | 4306.92 | 348.52 | 1436.30 | 7152.50 | 3934.3 |
| 21 | Poland | 10,305.6 | 15,968.14 | 1767.85 | 438.26 | 4002.03 | 12,017.04 | 812.8 |
| 22 | Portugal | 3305.1 | 4998.24 | 850.62 | 49.64 | 886.29 | 3226.19 | 813.9 |
| 23 | Romania | 8273.6 | 8391.82 | 4251.80 | 24.95 | 2379.80 | 6222.99 | 487.6 |
| 24 | Slovakia | 641.8 | 1666.71 | 262.90 | 51.14 | 580.53 | 893.47 | 479.6 |
| 25 | Slovenia | 589.1 | 771.48 | 271.77 | 3.29 | 268.20 | 574.90 | 1190.3 |
| 26 | Spain | 27,841.4 | 23,655.81 | 5463.74 | 443.99 | 5634.78 | 27,231.24 | 1138.7 |
| 27 | Sweden | 1727.4 | 4313.12 | 1075.91 | 0.00 | 887.20 | 1488.27 | 495.1 |
| 28 | EU 27 (from 2020) | 178,370.6 | 232,848.51 | 63,202.23 | 4726.95 | 52,208.28 | 166,170.61 | 1055.6 |
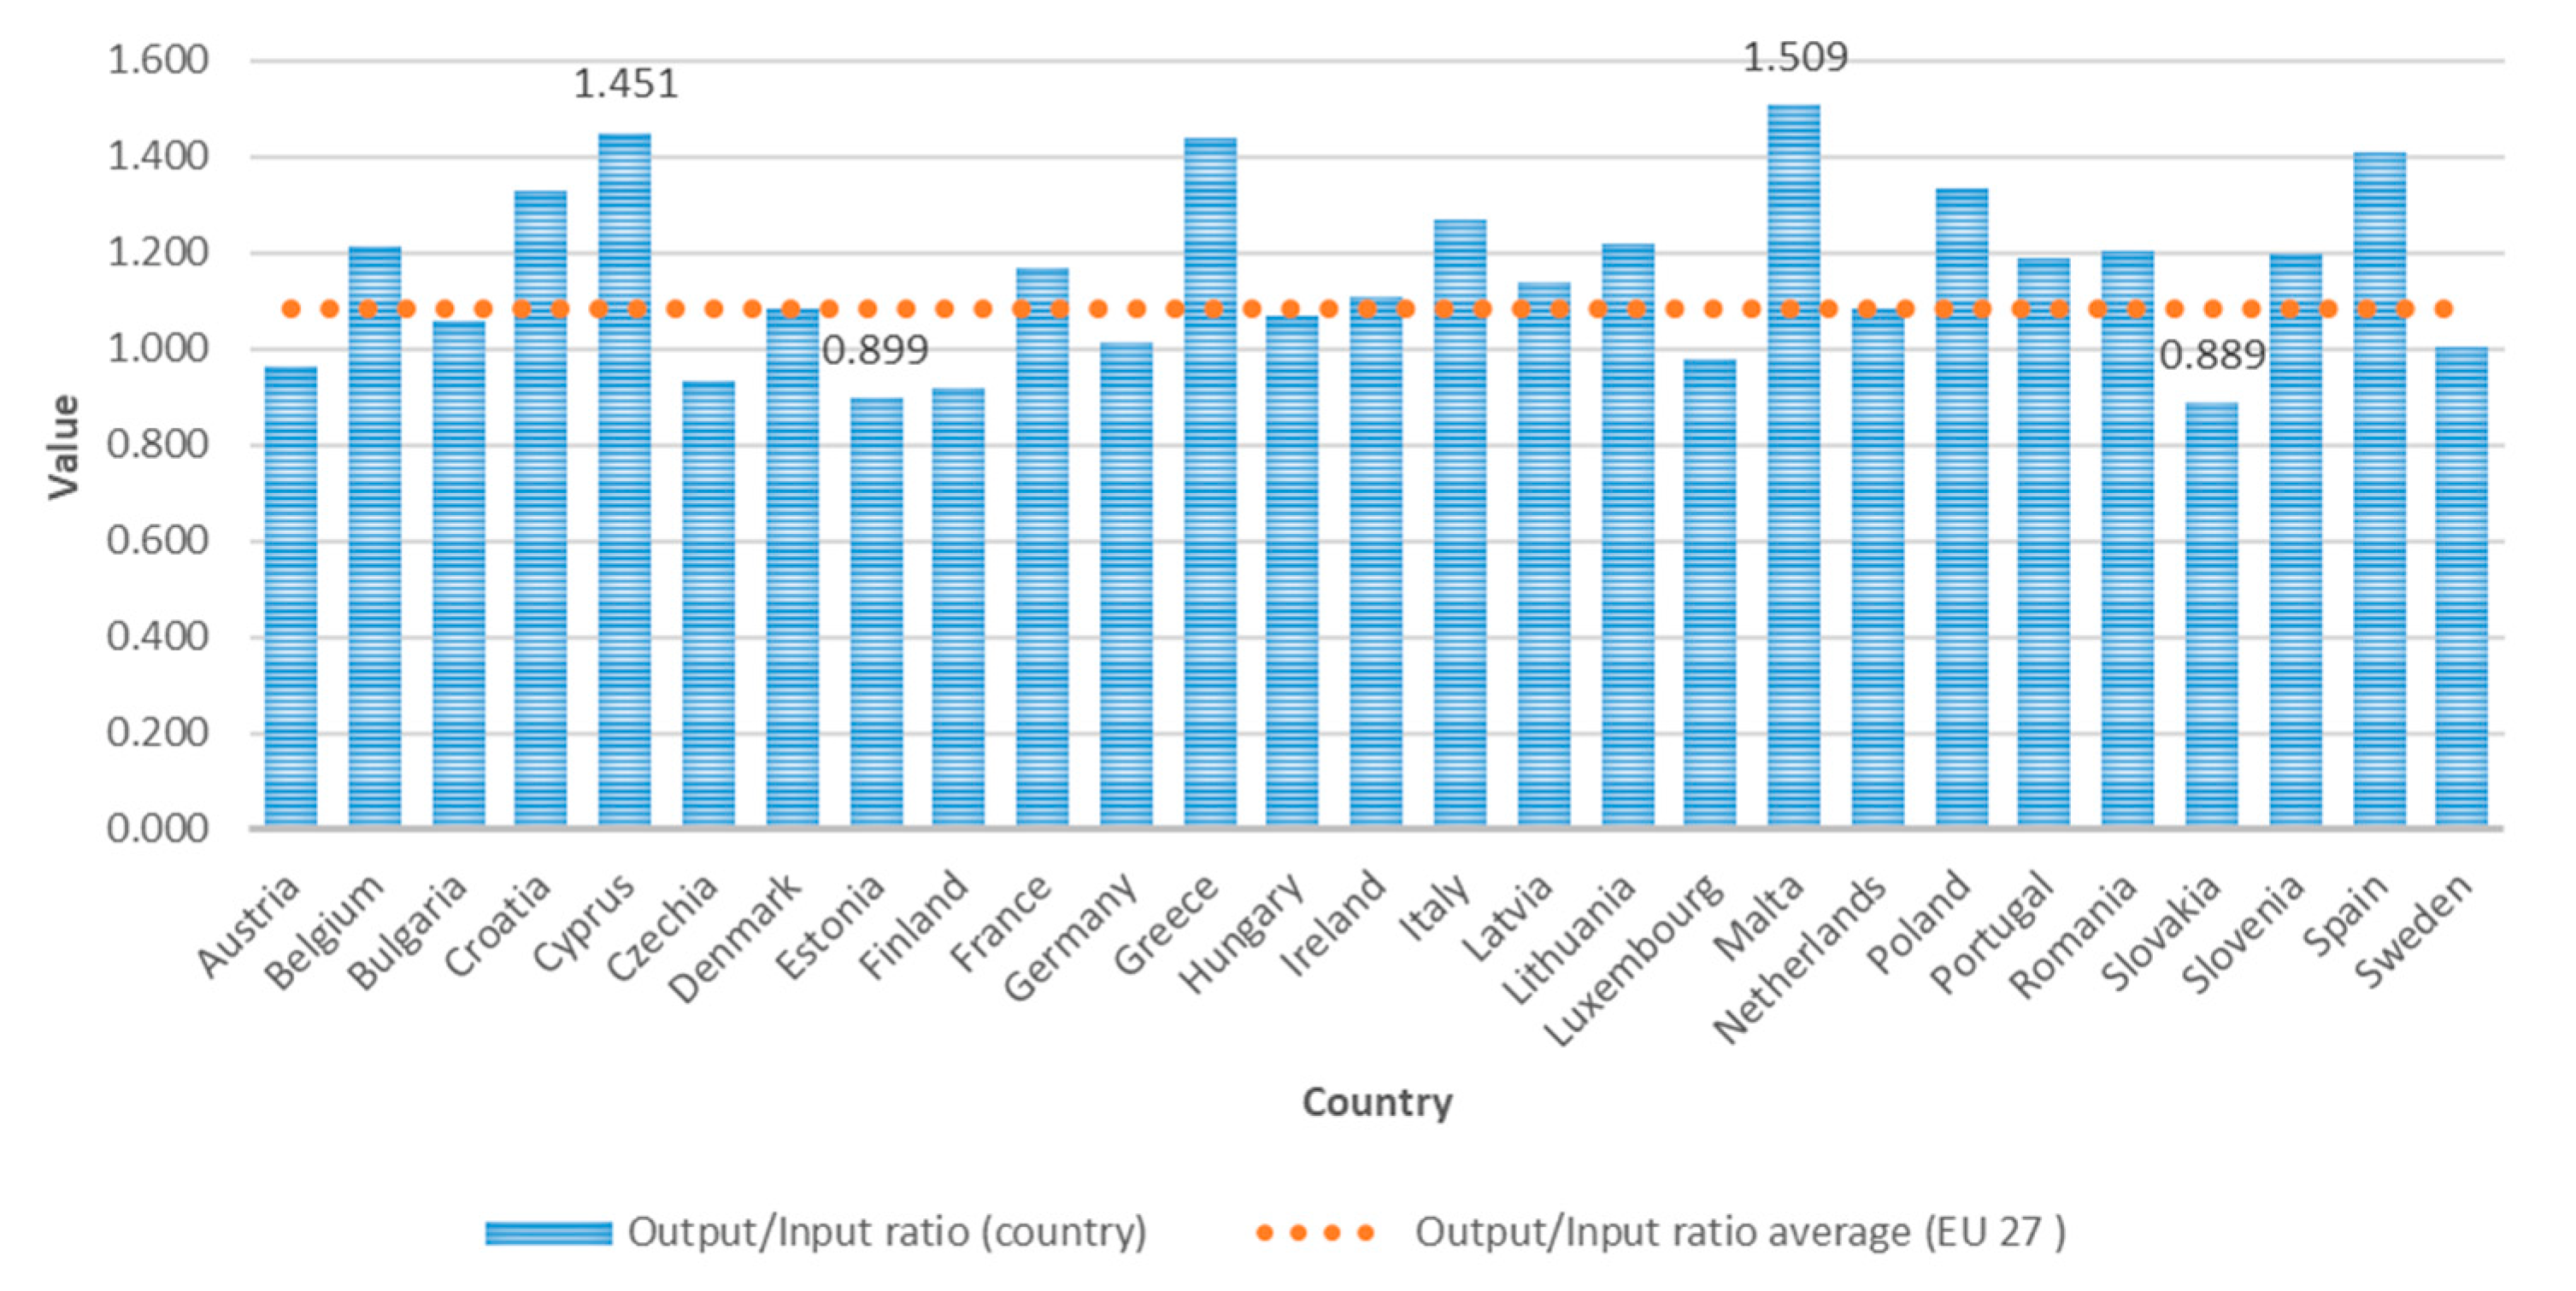
| No. | Country/Item | Output of the Agricultural Industry | Total Intermediate Consumption | Fixed Capital Consumption | Compensation of Employees | Rents and Other Charges to be Paid | Interest Paid | Interest Received | Output/Input Ratio |
|---|---|---|---|---|---|---|---|---|---|
| 1 | Austria | 7645.59 | 6504.04 | 812.30 | 466.2 | 225.0 | 21.4 | 102.5 | 0.965 |
| 2 | Belgium | 9057.99 | 4410.47 | 1878.16 | 682.3 | 244.3 | 234.4 | 0.0 | 1.216 |
| 3 | Bulgaria | 4021.96 | 2181.84 | 453.27 | 543.6 | 595.1 | 31.2 | 11.9 | 1.060 |
| 4 | Croatia | 2422.11 | 1291.14 | 316.27 | 153.7 | 41.7 | 26.8 | 10.2 | 1.329 |
| 5 | Cyprus | 759.14 | 401.38 | 15.79 | 90.9 | 11.1 | 4.0 | 0.0 | 1.451 |
| 6 | Czechia | 5632.71 | 3652.94 | 773.94 | 1246.4 | 325.0 | 65.1 | 30.6 | 0.934 |
| 7 | Denmark | 11,617.20 | 7832.34 | 1141.14 | 1184.8 | 591.9 | 51.7 | 83.7 | 1.083 |
| 8 | Estonia | 995.34 | 742.55 | 150.57 | 157.8 | 37.1 | 21.2 | 1.3 | 0.899 |
| 9 | Finland | 4475.27 | 2961.59 | 1221.90 | 408.9 | 197.1 | 88.7 | : | 0.917 |
| 10 | France | 76,630.72 | 44,481.16 | 10,554.53 | 7602.6 | 2426.4 | 470.8 | 62.0 | 1.170 |
| 11 | Germany | 57,345.40 | 36,231.50 | 10,738.98 | 5519.4 | 3349.4 | 889.4 | 37.7 | 1.012 |
| 12 | Greece | 12,051.74 | 5880.03 | 1197.55 | 650.9 | 436.5 | 209.2 | 0.0 | 1.439 |
| 13 | Hungary | 8398.47 | 5055.95 | 1085.52 | 1288.8 | 416.5 | 10.0 | 16.2 | 1.071 |
| 14 | Ireland | 8891.82 | 5704.41 | 1009.48 | 812.0 | 477.5 | 34.5 | 0.0 | 1.106 |
| 15 | Italy | 57,833.34 | 24,959.42 | 10,071.44 | 8073.1 | 1556.7 | 1014.6 | 0.0 | 1.266 |
| 16 | Latvia | 1727.16 | 1138.40 | 142.80 | 188.7 | 43.3 | 7.9 | 1.1 | 1.136 |
| 17 | Lithuania | 3486.40 | 1958.05 | 391.10 | 409.8 | 98.6 | 9.5 | 0.5 | 1.216 |
| 18 | Luxembourg | 439.85 | 299.70 | 95.61 | 31.0 | 20.5 | 2.5 | 0.0 | 0.979 |
| 19 | Malta | 121.09 | 66.69 | 7.25 | 5.2 | 0.7 | 0.4 | 0.0 | 1.509 |
| 20 | Netherlands | 28,235.59 | 17,329.60 | 4306.92 | 3134.2 | 673.4 | 724.1 | 82.6 | 1.082 |
| 21 | Poland | 26,405.78 | 15,968.14 | 1767.85 | 1750.0 | 106.3 | 221.9 | 34.6 | 1.334 |
| 22 | Portugal | 8403.49 | 4998.24 | 850.62 | 1024.4 | 34.8 | 169.3 | 6.4 | 1.188 |
| 23 | Romania | 16,824.17 | 8391.82 | 4251.80 | 1103.0 | 140.1 | 125.1 | 6.2 | 1.201 |
| 24 | Slovakia | 2348.02 | 1666.71 | 262.90 | 590.8 | 85.6 | 44.0 | 7.8 | 0.889 |
| 25 | Slovenia | 1370.29 | 771.48 | 271.77 | 76.8 | 21.0 | 2.7 | 0.6 | 1.199 |
| 26 | Spain | 51,787.23 | 23,655.81 | 5463.74 | 5842.7 | 1377.2 | 364.7 | : | 1.411 |
| 27 | Sweden | 6170.33 | 4313.12 | 1075.91 | 330.0 | 301.6 | 167.8 | 46.0 | 1.005 |
| 28 | EU 27 (from 2020) | 415,098.18 | 232,848.51 | 63,202.23 | 43,368.1 | 13,834.3 | 5012.7 | 541.9 | 1.160 |
Disclaimer/Publisher’s Note: The statements, opinions and data contained in all publications are solely those of the individual author(s) and contributor(s) and not of MDPI and/or the editor(s). MDPI and/or the editor(s) disclaim responsibility for any injury to people or property resulting from any ideas, methods, instructions or products referred to in the content. |
© 2023 by the authors. Licensee MDPI, Basel, Switzerland. This article is an open access article distributed under the terms and conditions of the Creative Commons Attribution (CC BY) license (https://creativecommons.org/licenses/by/4.0/).
Share and Cite
Coca, O.; Creangă, D.; Viziteu, Ș.; Brumă, I.S.; Ștefan, G. Analysis of the Determinants of Agriculture Performance at the European Union Level. Agriculture 2023, 13, 616. https://doi.org/10.3390/agriculture13030616
Coca O, Creangă D, Viziteu Ș, Brumă IS, Ștefan G. Analysis of the Determinants of Agriculture Performance at the European Union Level. Agriculture. 2023; 13(3):616. https://doi.org/10.3390/agriculture13030616
Chicago/Turabian StyleCoca, Oana, Diana Creangă, Ștefan Viziteu, Ioan Sebastian Brumă, and Gavril Ștefan. 2023. "Analysis of the Determinants of Agriculture Performance at the European Union Level" Agriculture 13, no. 3: 616. https://doi.org/10.3390/agriculture13030616
APA StyleCoca, O., Creangă, D., Viziteu, Ș., Brumă, I. S., & Ștefan, G. (2023). Analysis of the Determinants of Agriculture Performance at the European Union Level. Agriculture, 13(3), 616. https://doi.org/10.3390/agriculture13030616


