Abstract
The rapid increase in the number of new maize varieties and the intensification of market competition have raised the need to precisely promote new maize varieties to suitable planting areas and fully exploit the variety potential and win the market competition. This paper proposes a precise recommendation method for suitable planting areas of maize varieties based on a knowledge graph. The meteorology knowledge graph of maize ecological regions is constructed at county-scale and a RippleNet recommendation model is used to mine the potential spatial correlation of maize variety suitability in different meteorological environments. The county-scale precise recommendation for suitable planting areas is then realized. In total, 331 maize varieties and agricultural meteorological data of 59 experimental areas in the Huang-Huai-Hai ecological region are used for model training and testing (accuracy 76.3%). Through experimental comparison, the recommendation accuracy of this method is 24.3% higher than that of six traditional machine learning methods, 11.2% higher than that of graph attention networks, and 5.8% higher than that of graph convolution neural networks. This study provides a data-driven solution for the precise recommendation and market positioning of maize varieties, enhances the scientificity of variety recommendation and helps to fully exploit their planting potential.
1. Introduction
The number of maize varieties approved increases year by year due to the rapid development of the maize breeding industry. In 2021, the number of Chinese national authorized maize varieties reached 919. Many varieties entered the market, making the competition extremely fierce. The digital process in the breeding industry has advanced considerably, with many tools available on the market, such as the national regional trial system and breeding system [1,2], which bring great convenience to both breeding companies and consumers. The demand of breeding companies and consumers for faster and more convenient recommendation methods has resulted in new requirements for the recommendation methods of suitable growing areas of maize varieties that are lagging behind in development [3]. Simultaneously, China’s national maize variety validation test considers the ecological region as the research unit, with each ecological region covering a large area. For instance, the Huang-Huai-Hai maize ecological region covers eight provinces, namely Hebei, Shanxi, Jiangsu, Anhui, Shandong, Henan, Hubei and Shaanxi. However, great differences in the meteorological environment and yield performance of varieties exist in each ecological region [4,5]. Therefore, conducting in-depth research on the precise recommendation of varieties at the county scale and exploring the optimal planting area for each variety is crucial to give full play to the planting potential of varieties.
Factors such as accumulated temperature, planting density, lodging, large spot and empty stalk are the main indicators for fine zoning of maize varieties [4]. The previous research methods of crop suitability regionalization include, among others, the overlapping method, dominant factor method and the clustering method. These methods employ correlation analysis [6], principal component analysis [7] and other statistical analysis methods to determine the indicators, while the analytic hierarchy process [8], maximum entropy model [9] and other methods impact the weight distribution of indicators considerably. In the process of constructing the index evaluation system, the determination method of the index weight coefficient has the problem of too much qualitative analysis, which does not conform to the laws of data science or has the problem of practical application difficulties [8,9]. With the development and application of artificial intelligence technology in recent years, machine learning has been introduced into crop environmental suitability evaluation research. Qiusi et al. [10] collected the crop phenotype data and meteorological data of multiple maize field experiment areas, a graph neural network was introduced to mine the similarity between features through node aggregation, and the correlation between geographical locations was fully utilized. Compared with traditional machine learning classification models, this method achieved better results in crop suitability evaluation. Qi et al. [11] designed a crop variety yield prediction system, CVYPS-VYDC, based on the random forest model. The system can analyze the impact of the environment on maize yield and figure out the most important environmental factors, which has guiding value for maize production. Additionally, the impact of multiple maize varieties can be analyzed by the system under multiple environmental factors at the same time. Machine learning methods not only help to improve the accuracy of suitability evaluation by self-learning, real data and mining the potential relationship between various features, but also reduce human interference and are more consistent with the actual law compared with the completion of crop environmental suitability evaluation based on the construction of the index system.
The knowledge graph (KG) method has achieved good application results in various agricultural fields, such as agricultural knowledge services and pest diagnosis [12]. Chen et al. [13] proposed an agricultural KG (AgriKG) for effective integration of fragmented information generated by many applications in the agricultural field, used for agricultural entity retrieval and agricultural knowledge Q&A. Researching the application of KG in crop disease and pest diagnosis, Damos et al. [14] used ontology and semantic knowledge representation to classify pests, and developed a pest expert system to simulate the ability of pests and diseases to affect crops. In the cross-field between agriculture and meteorology, Chenglin et al. [15] proposed a construction method for a Chinese meteorological and agricultural KG (Cn-MAKG) based on semi-structured data, which was successfully applied to the automatic generation of crop meteorological reports.
In addition, the research results of KG-based recommendation models are remarkable. Zhang et al. [16] proposed a collaborative filtering recommendation algorithm based on KG embedding (KGECF), built a sub-knowledge base based on Freebase KG, designed an end-to-end joint learning model and embedded structured information and historical preference information into a unified vector space. This algorithm outperformed BPR [17], LINE [18], CFKG [19] and KTUP [20] in multiple indicators. Zhao et al. [21] proposed a unified graph-based recommendation model (UGRec) to fully utilize the item–item co-occurrence information (i.e., co-view) that contains rich item–item similarity information. This model integrated the traditional directed relationship and undirected item–item co-occurrence relationship in the KG. The results of experiments on multiple public datasets were superior to several previous state-of-the-art methods. Zhang et al. [22] proposed a new recommendation method in social media recommendation called multi graph heterogeneous interactive fusion (MG-HIF), to address the problem of early summarization and data sparsity. Yixin et al. [20] introduced the KG into the recommendation system. Considering the impact of the incompleteness of the KG on the recommendation results, the translation-based user preference model (TUP) proposed in this article jointly trains the recommendation model and completes the KG. Wang et al. [23] proposed an end-to-end framework called RipleNet, which naturally incorporates the KG into the recommendation system to address the limitations of existing embedded-based and path-based methods for knowledge-graph-aware recommendation. Finally, standard recommendation models based on the KG, such as CKE [24], DKN [25] and SHINE [26], have produced good results in fields like movie recommendation, news recommendation and social media sentiment analysis, respectively.
Artificial intelligence technology has been widely used in crop variety recommendation [10,11] and has achieved good results. The maize varieties in the Huang-Huai-Hai ecological region are hereby explored as the research object. Based on the meteorological data of cities and counties in the Huang-Huai-Hai ecological region, the hidden relationship of environmental factors in different planting areas is discovered using the meteorology KG, the meteorological similarity between maize variety test stations is evaluated and categorized, and the RippleNet recommendation model is integrated to provide a new method for precise crop variety recommendation. The suitable planting area of each maize variety can be accurately located from the large ecological area to the county planting area, so as to achieve accurate recommendation of maize varieties.
2. Materials and Methods
2.1. The General Situation of Research Area
The Huang-Huai-Hai ecological region is the largest maize production area in China, with a planting area of about 7.5 million hectares, accounting for more than 30% of the national maize area. The yellow area in Figure 1 is the scope of the Huang-Huai-Hai ecological region. Extending from 31°5′ N to 39°5′ N, the variety of climates in this region is great. The annual accumulated active temperature of ≥10 °C is 4000–5000 °C, and the annual accumulated rainfall is 500–900 mm. The Huang-Huai-Hai ecological region includes 558 districts and counties in the middle and lower reaches of the Yellow River, Huaihe River and Haihe River basins, including Shandong, Henan, south-central Hebei, southern Shanxi, Guanzhong of Shaanxi, southern Shaanxi, northern Jiangsu and northern Anhui. The specific distribution per province is shown in Table 1.
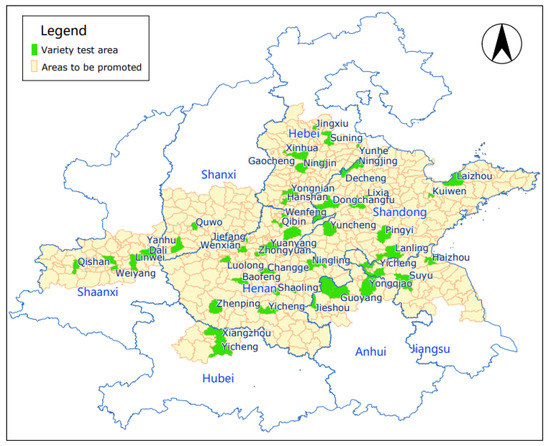
Figure 1.
Graph of geographical area of Huang-Huai-Hai ecological region.

Table 1.
Distribution of cities in Huang-Huai-Hai ecological region.
2.2. Technical Process of This Research
Figure 2 shows the model flowchart, which includes three parts: data processing, construction of meteorology KG and recommendations for planting areas. The data processing part involves the meteorological data and maize field test data classification to obtain the meteorological factor data of each region to be recommended, as described previously. The construction of the meteorology KG includes the correlation establishment between counties according to the meteorological factor data of each region to be recommended. The planting area recommendation part is based on the RippleNet model and the constructed meteorology KG to recommend the suitable planting area of maize varieties. The meteorology KG data and the implicit feedback of “variety-test station” data (“variety-test station” implicit feedback is the planting behavior of varieties that does not directly indicate the preference of varieties) are input into RippleNet. After multiple iterations of the model training, the suitable planting probability of each variety in each planting area is output.
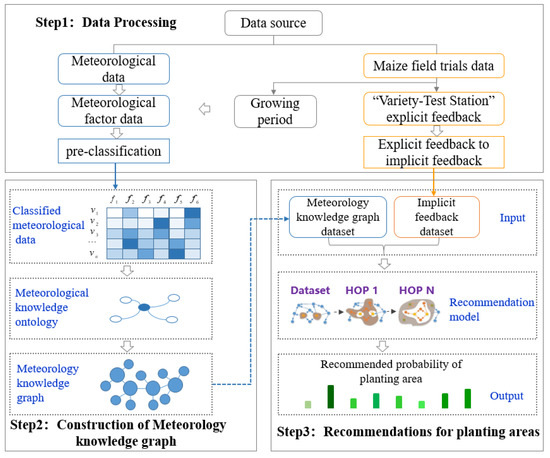
Figure 2.
Overall flow chart of recommendation model based on knowledge graph.
2.3. Acquisition and Processing of Data
2.3.1. Primitive Meteorological Data
The meteorological data was acquired from the National Meteorological Information Center and included daily meteorological data from 558 meteorology stations distributed in the Huang-Huai-Hai ecological region during 2017–2021, recording 11 meteorological indicators, namely daily maximum temperature, surface pressure, relative humidity, daily minimum temperature, wind level, daily average temperature, daily precipitation, daily average wind speed, wind direction angle, daily maximum wind speed and daily sunshine duration.
2.3.2. Primitive Test Data from Chinese National Maize Variety Field Trials
The field trials data were collected from the national maize variety regional trial conducted from 2017 to 2021 at 59 test stations in the Huang-Huai-Hai ecological region, involving 331 maize varieties (including 13 check varieties). In total, 49 traits were collected for each variety, including plant height, ear level, growth period, plot yield, fall rate, empty stalk rate, disease and pest incidence level and others.
2.3.3. Processing of Primitive Meteorological Data and Test Data
- Meteorological data processing during the growth period of maize varieties.
The effective meteorological data of maize varieties during their growth period in the Huang-Huai-Hai ecological region were analyzed in this study. Therefore, before processing meteorological data, it is necessary to determine the time range of meteorological data processing for each county according to the growth period of maize varieties. For counties including the national maize variety field test station, the time range was determined by the sowing date and maturity period in the historical field test. For counties without test stations, that is, non-test areas, the time range calculation adopted the mean of the sowing date and maturity of the county where the test station was located.
The meteorological factor data were processed according to the starting and ending time range of the growth period in each county. The data included effective accumulated temperature, maximum temperature, minimum temperature, accumulated precipitation, total sunshine duration and maximum wind speed. Since the meteorological factor data are numerical data, which cannot meet the requirements of constructing a meteorology KG, the meteorological factor data were further pre-classified according to the characteristics of the maize planting environment.
- (1)
- Effective accumulated temperature (eaT).
The accumulated temperature of the daily average temperature ≥10 °C at each meteorology station during the growth period was annually calculated from 2017 to 2021. The accumulated temperature of each year was used to calculate the mean value, which was taken as the local effective accumulated temperature. Effective accumulated temperature data were normally distributed. To ensure that the number of classified meteorology stations under each classification label was evenly distributed, the accumulated temperature was divided into nine categories (Table 2). The same data processing method was followed for the other five meteorological factors as well.
Table 2.
Classification of effective accumulated temperature (eaT).
- (2)
- Maximum temperature (maxT) and minimum temperature (minT).
The maximum and minimum temperatures values of each meteorology station during the growth period were annually counted. The mean values of maximum and minimum temperature of the meteorology stations from 2017 to 2021 were obtained and used as the maximum and minimum temperature of the counties where each meteorology station is located. The classification of maximum and minimum temperature is shown in Table 3 and Table 4, respectively.
Table 3.
Classification of maximum temperature (maxT).
Table 4.
Classification of minimum temperature (minT).
- (3)
- Cumulative precipitation (pre).
The cumulative sum of daily precipitation during the growth period of each meteorology station was annually calculated. The mean value of the sum of the annual precipitation of the meteorology stations from 2017 to 2021 was taken as the cumulative precipitation during the growth period of each station. The classification of cumulative precipitation is shown in Table 5.
Table 5.
Classification of cumulative precipitation (pre).
- (4)
- Maximum wind speed (maxWS).
The maximum value of the maximum wind speed in the growth period of each station was annually calculated. The mean value of the maximum wind speed at each meteorology station from 2017 to 2021 was calculated as the maximum wind speed during the growth period of the counties where each meteorology station is located. We can see the classification of maximum wind speed in Table 6.
Table 6.
Classification of maximum wind speed (maxWS).
- (5)
- Total sunshine duration (tsD).
According to the sunshine duration in the meteorological data, the sunshine duration of each station during the growth period was calculated by the annual sum of the day by day, and the average of the total sunshine duration of each station from 2017 to 2021 was calculated as the total sunshine duration of each station. The classification of total sunshine duration is shown in Table 7.
Table 7.
Classification of total sunshine duration (tsD).
- Experimental data processing for field trials of maize varieties.
In the field trials of maize varieties, the varieties with stable performance are usually selected as the check varieties used for comparison. Taking yield as an example, the yield of a test variety that exceeds the yield of the check variety indicates that the variety is suitable for local planting. Before the validation of each maize variety, field tests need to be conducted for three consecutive years. After the field tests meet the standards in each year, the field tests in the next year can be conducted, the maize variety is considered to be unsuitable and is eliminated. For varieties with multiple test records at the same test station, the test data of the latest year in the field test is retained, and the data of other stages are excluded. The location, yield and evaluation of the maize field test data in the Huang-Huai-Hai ecological region are shown in Table 8.
Table 8.
Field trials data of maize varieties in Huang-Huai-Hai.
For the purposes of this study, the explicit feedback of varieties and test areas in Table 8 needs to be converted into implicit feedback. To this end, the data in Table 8 were labeled with 1 after they met the threshold value (refer to Formula (1) for threshold setting), and 0 if they did not meet the threshold value.
2.4. Construction of the Meteorology KG
2.4.1. Schema Design of the Meteorology KG
The top-down approach and bottom-up approach were used in the construction of the meteorology KG. Among them, the top-down approach starts with designing the schema layer, and then filling in the data of a specific instance (entity), while the bottom-up approach is to directly face the data, extract entities according to the characteristics of the data, and then abstract and summarize the concepts based on these entities, and finally form the ontology concept hierarchy that can be used as the schema layer. Before constructing the meteorology KG, the meteorological schema design needs to be first implemented. Before design, therefore, the relevant domain knowledge of the impact of weather on the maize growth must be studied.
The knowledge graph built in this study needs to be applied to the recommendation of maize varieties. Before designing the meteorological ontology model, we take the knowledge related to the recommendation of maize varieties and the core requirements of variety recommendation in reality as the knowledge boundary of building the meteorology KG. Many scientific experiments and production practices have proven that the yield of maize is closely related to the meteorological conditions in the growing season [27]. For example, meteorological changes are closely related to maize pests and diseases, both of which are important factors leading to maize yield reduction [28,29,30]. Among meteorological conditions, temperature, light and precipitation are the most important factors for maize growth [31]. Maximum wind speed is also an important factor affecting maize lodging. In order to more comprehensively describe the meteorological characteristics of the county (district) to which the meteorology station belongs, the temperature during the growth period was subdivided into effective accumulated temperature, maximum temperature and minimum temperature. Illumination was represented by the accumulation of sunshine duration. Precipitation was calculated as the cumulative total of daily precipitation during the maize growth period. The schema of the meteorology KG constructed in this paper is shown in Figure 3.
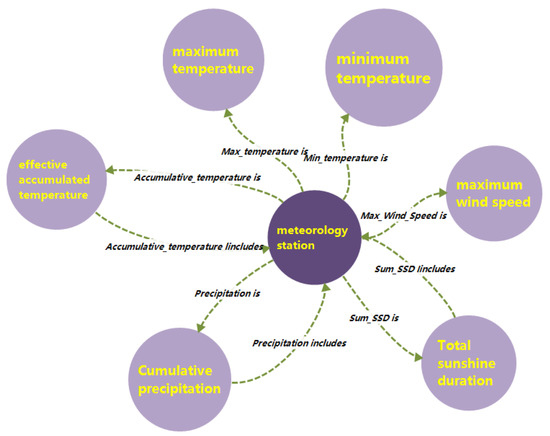
Figure 3.
The schema of meteorology knowledge graph.
2.4.2. Storage of the Meteorology KG
In this paper, the storage method for the meteorology KG is the graphical database Neo4j. Neo4j has many advantages, such as its excellent and complete query language, Cypher, and it can also support various graphic algorithms. The details of the constructed meteorology KG are shown in Table 9.
Table 9.
Statistical details of the meteorology knowledge graph (KG) composition.
2.5. Recommendation Model of Suitable Planting Area for Maize Based on RippleNet
2.5.1. The Role of Knowledge Graph in Recommendation Model Based on RippleNet
The meteorology KG describes the meteorological characteristics of the counties in the Huang-Huai-Hai ecological region and builds a foundation for the recommendation of suitable planting areas by using the recommendation model. The RippleNet model is hereby introduced as the recommendation model. In the process of recommendation, the model takes the planting performance of maize varieties in the tested area as the seed on the meteorology KG, discovers the preference of maize varieties for meteorological conditions through iterative propagation in the meteorology KG and recommends the untested areas with similar meteorological characteristics according to the meteorological preferences of maize varieties. In addition to the small-scale division of the Huang-Huai-Hai ecological region from the ecological region-level to the county-level, the meteorology KG can also provide rich connections between varieties and the meteorological environment, thereby improving the accuracy and interpretability of the recommended results. An example of the specific recommendation process is shown in Figure 4. A maize variety was planted in three test areas (i.e., Chuanhui District, Zhoukou City; Jiefang District, Jiaozuo City; and Laizhou City, Yantai City) and performed better than in other test areas. During the dissemination of the meteorology KG, it was revealed that if other untested areas with the same meteorological characteristics as the three test areas exist, they can be used as the suitable planting areas for this maize variety, according to their meteorological preferences.
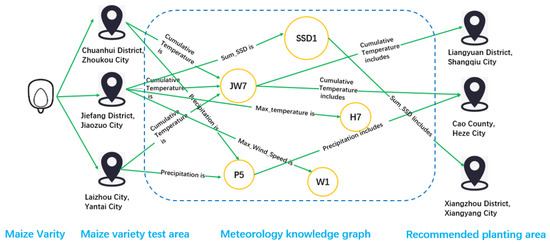
Figure 4.
Example of precise recommendation process for suitable planting area of maize varieties enhanced by knowledge graph.
2.5.2. Concrete Implementation of Recommendation Model Based on RippleNet
- Relative definition of the recommendation model.
The recommendation problem based on the meteorology KG is formulated as follows. In the maize variety precise recommendation system, this study needs to define the maize variety set and the planting area set, where the set of maize varieties is represented by , and the planting areas set is . is the interaction matrix between the approved maize varieties and the planting areas, where is the suitability result of the maize varieties in the test planting area, and the value rules are shown in Equation (1).
In addition, the meteorology KG needs to be defined in this study. The meteorology KG is represented by , and the meteorology KG contains a large number of triples , in which represent the head entity, relationship and tail entity, respectively, and and represent the sets of entities and relations in the meteorology KG. The refers to a prediction function, where is the probability that maize varieties will be recommended in planting area , and are the model parameters of function .
- The recommendation model based on RippleNet [23].
The framework of the recommendation model based on RippleNet is shown in Figure 5. The model takes maize variety and planting area as input, and outputs the probability of recommending maize variety in planting area . The seed in the meteorology KG is generally composed of the field test data of maize variety ., which refers to multiple ripple sets of maize variety , is formed when the seed is expanded with the link. The set of knowledge triples that are k-hop(s) away from the seed set consist of a ripple set . These ripple sets interact iteratively with the planting area embedding (the light yellow block) to obtain the responses of maize variety to planting area (the green blocks). The recommendation model obtains the final embedding (the dark gray block) of the maize variety by combining all the responses. Finally, the probability that each planting area is suitable for planting the maize variety is calculated by embedding the approved maize variety and the planting area .
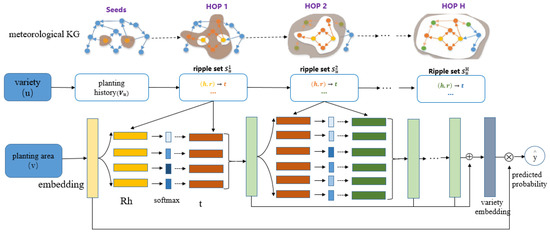
Figure 5.
Recommendation model of suitable planting area based on RippleNet.
The meteorology KG contains rich facts and relationships between entities. In order to express the hierarchical meteorological preference of maize varieties in the meteorological KG, we recursively define the k-hop relevant entities set of maize variety in the recommendation model based on RippleNet, as shown below:
Definition 1 is the detailed explanation of the relevant entity, and Definition 2 is used to elaborate how a ripple set is formed by the recommended model with the help of the meteorology KG.
Definition 1.
The relevant entity set of k-hop of maize varieties is defined as Equation (2) when “variety–plant station” interaction matrixand the meteorology knowledge graphis given.
in Equation (2) refers to the area set where the maize variety has been tested in the field and the yield increase percentage compared to the control variety of the variety in the tested area is larger than the specified threshold, which could be regarded as the seed set of the maize variety in the meteorology KG.
Definition 2.
The seed (the historical planting records of maize variety) in the meteorology KG extends along the link to form relevant entities of maize variety. The k-hop ripple set of maize varietyis defined as Equation (3) when the definition of relevant entities is given. The k-hop ripple set of maize varietyis defined as the set of knowledge triples starting from.
In this study, the preference propagation technique is very valuable for the recommendation model based on RippleNet. This technique not only models the interaction between maize variety and planting area in a more detailed way, but also can be used to explore the potential interests of maize varieties in the ripple sets.
is the planting area embedding of each planting area , where refers to the dimension of the embeddings (Figure 5). Generally, each triple in the 1-hop ripple set of maize variety will be assigned a relevance probability by comparing the planting area embedding to head and relation in this triple:
In Equation (4), the embeddings of relation and head are expressed by and , respectively. In the recommendation model, we regard the relevance probability as the similarity of planting area and entity . In order to implement the preference propagation technique, the relevance probability needs to be measured in the embeddings of relation ().
According to the relevance probability obtained in Equation (4), the second step of preference propagation is realized, and the relevance probability is used as a weight to control the direction of preference propagation. We will get the vector by taking the sum of tails in weighted by the corresponding relevance probabilities.
is the embedding of tail from the knowledge triple . In addition, vector is the 1-order response of maize variety ’s history record with respect to planting area . Equations (4) and (5) are the main steps of the preference propagation technique of this recommendation model. Through these two steps, the interests of a maize variety are transferred along the links in . The set of relevant entities will inherit the interests of the maize variety from the maize variety’s history set . After the preference propagation in is completed, is used to replace in Equation (4), and we see the ripple sets repeat Equations (4) and (5), and finally the second response vector is returned. When preference propagation iterates on maize variety ’s ripple sets , we obtain corresponding response vectors in each ripple set, which carry the meteorological preferences of maize varieties at different levels. In order to fully reflect the meteorological preference of maize varieties and help make the subsequent recommendation more precise, we obtain the embedding of maize variety by combining all the response vectors from all orders. This embedding is the preference of maize varieties for planting area . The specific calculation is shown in Equation (6).
Finally, by calculating the inner product of maize variety embedding and planting area embedding, the output prediction recommendation probability is obtained:
In Equation (7), is the sigmoid function.
Through the above content, the relevant definitions in the recommendation model and the recommendation process of the recommendation model are introduced in detail. Next, we introduce the algorithm derivation process of the recommendation model.
In the recommendation model for suitable planting areas for maize based on RippleNet, we intend to maximize the posterior probability of the model parameters when the meteorology KG, and the matrix of “variety–test station” implicit feedback are given. According to Bayes’ theorem, this is equivalent to maximizing
In Equation (8), the embeddings of all entities, relations and planting areas are included in the model parameters . Further, measures the priori probability of model parameters and is set as a Gaussian distribution with zero mean and a diagonal covariance matrix according to [24]:
The in Equation (8) could be used as the likelihood function of the observed meteorology knowledge graph when is given. In the recommendation model based on RippleNet, the likelihood function for knowledge graph embedding (KGE) is defined by the three-way tensor factorization method:
When ,the indicator in Equation (10) equals 1, otherwise equals 0. Based on the definition in Equation (10), the scoring functions of entity–entity pairs in KGE and planting area–entity pairs in preference propagation can be unified under the same calculation model. The likelihood function of the observed “variety-test station” implicit feedback uses the in Equation (8) when model parameters and the meteorology KG is given. Additionally, the definition of is the product of Bernouli distributions based on Equations (2)–(7).
In subsequent algorithms, we take the negative logarithm of Equation (8) as the following loss function for the recommendation model based on Ripplenet. See Equation (12) for details.
The embedding matrices for all planting areas and entities are and in Equation (12), respectively. For relation , the indicator tensor in the meteorology KG can be sliced into , and its embedding matrix is represented by . The cross-entropy loss between the ground truth of interactions and the predicted value by the recommendation model based on Ripplenet is measured by the first term of Equation (12). According to the second term, the squared error between the ground truth of the meteorology KG and the reconstructed indicator matrix will be returned. The third term is the regularizer for preventing over-fitting.
In order to solve the problem, the method of optimizing the loss function in this study is the stochastic gradient descent (SGD) algorithm. The negative sampling strategy in [32] is used to randomly sample a minibatch of positive/negative interactions from and true/false triplets from during each iteration. Then the gradients of loss with respect to model parameters are calculated, and all parameters are updated by back-propagation based on the sampled minibatch. The detailed process of the recommendation model algorithm is shown in Algorithm 1.
| Algorithm 1: Learning algorithm for the recommendation model based on RippleNet |
| Input of this model: The field test data and the meteorology knowledge graph |
| Output of this model:, a prediction function for recommending non-test planting areas for maize varieties |
| 1: Initialize all the recommendation model parameters; |
| 2: The ripple sets for each maize variety is calculated through the meteorology knowledge graph; |
| 3: for number of training iteration do |
| 4: Positive and negative interactions from and true and false triples from are sampled by the minibatch; |
| 5: Calculate gradients and on the minibatch by back-propagation according to Equations (4)–(12); |
| 6: Update , and by gradient descent with learning rate ; |
| 7: end for |
| 8: return the prediction function |
3. Results
The influence of relevant model parameters on the performance of the RippleNet model was assessed. The influence of matrix embedded dimension and KG embedding training weight on the performance of the Ripplenet model was first analyzed. Then, the change process of RippleNet performance was analyzed by changing the maximal hop number H and the size of the ripple set in each hop. The experimental results are shown in Figure 6. Finally, the maximal hop number H of the experiment and the optimal value of the size of the ripple set in each hop were selected, and the optimal model parameters were finally obtained (Table 10).
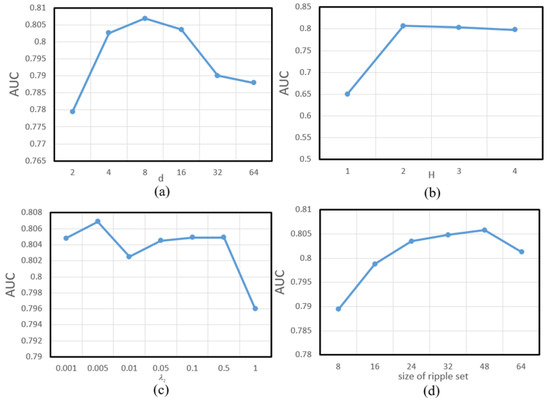
Figure 6.
Parameter sensitivity analysis of RippleNet model. (a) The influence of the change of matrix embedding dimension on model AUC index. (b) The influence of the change of the maximal hop number H on model AUC. (c) The influence of the change of the parameter on model AUC. (d) The influence of the size of ripple set on model AUC.
Table 10.
Optimum performance parameters of RippleNet model.
In the above table, and refer to the weight of L2 regularization and the learning rate, respectively.
Compared with six other traditional machine learning methods, the performance of this model was assessed. The models included K-nearest neighbor (KNN, K = 15), logical regression (LR), support vector machine (SVM), naive Bayes classifier (NB), decision tree (DT) and random forest (RF). During the experiment, the dataset was divided into training and test sets according to the ratio of 4:1, and then the machine learning methods were trained, respectively. In addition, the proposed model was compared with the graph attention neural network (GAT) [33] model and the graph convolution neural network (GCN) [34] model. The traditional machine learning model and graph neural network training datasets are tabular data comprising meteorological factor data. However, the meteorological factor data used to construct the meteorology KG in this research requires pre-classification. The impact of the pre-classification of the original meteorological factor data on the performance of the eight models mentioned above were also explored. In this paper, the datasets of meteorological factors before and after pre-classification were taken as the input of training, and the impact of pre-classification on model performance was experimentally assessed. Table 11 shows the comparison of accuracy results in different models before and after dataset pre-classification.
Table 11.
Comparison of accuracy of different models before and after pre-classification of meteorological factor data.
Accuracy, recall rate, precision, F1-Score and area under curve (AUC) are the five evaluation indicators that are usually used to assess the performance of the proposed model. Finally, the experimental result is obtained by the mean value of the 20 repeated experiments. Accuracy can be obtained by calculating the ratio of the number of correctly classified samples to the total number of samples, which can directly reflect the performance of the model. AUC is defined as the area under the receiver operating characteristic (ROC) curve. The closer the AUC value obtained by the method is to 1, the greater the authenticity of the detection method. In contrast, the authenticity is lower and the detection method has no application value when the AUC value is lower than 0.5. Precision rate is the ratio of the number of correctly classified positive examples to the number of classified positive examples. Recall rate refers to the proportion of correctly classified positive samples to the number of real positive samples and is specific to the sample. The definition of the F1-score is shown in Equation (13). We can see the training results of the mode in Table 12, and highlight the higher performance in bold.
Table 12.
Performance comparison of the recommendation model based on RippleNet with 8 contrast models.
4. Discussion
4.1. Result Analysis
The results in Table 11 indicate that the pre-classification of meteorological feature data did not notably improve the performance of eight contrast models. The reason may be that the pre-classification of the original meteorological factor data did not change the feature distribution of each row of data in the dataset.
RF and DT in traditional machine learning models performed slightly better than other machine learning models (Table 12). This may be because this training set is tabular data, and the tree model performs better on tabular datasets than other traditional machine learning models. The operation of RF is based on the integration of multiple DTs, and the results are determined by majority voting or averaging of each tree. Therefore, RF performed slightly better than DT in some evaluation indices. Among them, KNN model, SVM and LR performed the worst, and the correlation between meteorological characteristic data rows is small, which cannot provide more classification features. When the machine learning model is faced with such a situation, it cannot achieve good results. Different data in this training sample comes from different test areas, and there is obvious correlation between adjacent test areas (such as climate factors). On the other hand, one of characteristics of graph neural networks is that they can transfer information with the help of the graph structure. In addition, the state of hidden nodes of graph neural networks can be updated through the sum of weights of adjacent nodes, and graph neural networks can effectively use associations between feature nodes. The graph neural network can both mine the similarity between features, in addition to exploiting the association between geographical locations with the help of node aggregation, which may also be the reason why the graph neural network outperformed the traditional machine learning model [10]. GAT needs two steps to update the characteristics of nodes. GAT needs to calculate the attention score of all adjacent nodes. This step is the data basis for aggregating adjacent features in the next step. In this way, GAT makes full use of the correlation between features. GAT (69.4%) may not perform as well as GCN (72.4%) in this study because edge information is not fully utilized and the weight learning ability between nodes is relatively weak. The accuracy value of RippleNet in this test was 76.3%. Compared with the traditional machine learning optimal value (61.6%), RippleNet obtained a higher accuracy rate of recommended suitable planting areas for maize varieties in a limited sample. In addition, compared with GAT (69.4%) and GCN (72.4%), RippleNet also performed better in terms of accuracy, but its recall value was slightly lower than the GCN model and better than GAT model. RippleNet also produced good precision (78.8%), F1 (83.9%) and AUC (80.7%) scores, which were considerably higher than in other methods, further verifying the superiority the model.
The constructed meteorology KG of the Huang-Huai-Hai ecological region presented in this paper will help to precisely locate suitable planting areas for maize varieties from the ecological region-level to the county-level and connect all counties in the Huang-Huai-Hai ecological region. The meteorology KG can fully explore and utilize the meteorological correlation between locations through its strong link connectivity and the rich relationships and nodes to cluster locations with the same meteorological characteristics. The historical research of crop variety recommendation focuses on the construction of an indicator system. For example, [4] takes the Huang-Huai-Hai ecological region as the research object, uses the characteristics of accumulated temperature, average planting density, etc., to build an indicator system, so as to achieve the fine division of maize variety planting areas in the Huang-Huai-Hai ecological region. However, this method requires a large amount of crop variety planting data in the ecological area to ensure that the constructed index system is more in line with scientific laws. This kind of method is not suitable for maize varieties that have only been investigated in field trials. In recent years, researchers have introduced artificial intelligence technology into crop yield prediction, such as [10,11]. The application of artificial intelligence technology has greatly improved the accuracy of yield prediction. This research needs to predict the yield of crop varieties before realizing the recommendation of crop varieties, and cannot directly recommend crop varieties, which complicates the recommendation process. In addition, compared with GCN in [10], which simply uses the node aggregation method to explore the geographical association between nodes, the method proposed in this paper can also use the preference propagation of RippleNet to iteratively expand on the meteorology KG of the Huang-Huai-Hai ecological region, and effectively discover the meteorological preference of each maize variety. As such, the recommended planting area can better meet the requirements of each variety’s planting environment, which is conducive to the precise promotion of varieties.
4.2. The Future Research Focus
The suitability of maize varieties is affected not only by meteorological factors, but also by soil moisture and other factors. In the future, more factors related to the recommendation of suitable planting areas will be introduced into the KG, a KG with richer node relationships will be constructed and the accuracy of the recommendation of suitable planting areas will be increased. Simultaneously, the expansion of the KG leads to more nodes and increased complexity of the relationship between nodes, which puts forward higher requirements for the operation efficiency of the algorithm. Future work will also focus on the optimization of the generalization ability of the algorithm and its application to rice, wheat and other crops.
5. Conclusions
The field performance of maize varieties is affected by many factors, so it is of great significance to construct a precise recommendation model for maize varieties at the county-scale to extract the yield and income potential of new varieties. Based on the spatial correlation of the meteorological environment in the variety planting area, a precise recommendation method for suitable planting areas of maize varieties is hereby proposed based on the knowledge graph. The RippleNet recommendation model was used to construct a propagation network of preference for variety environmental adaptability, which also explored the implicit relationship between the variety field performance and the meteorological factors in the planting area. Consequently, a precise evaluation of the suitability of maize varieties was achieved. In terms of recommendation accuracy, the accuracy of this method reached 76.3%, which is notably better than traditional machine learning methods such as K-nearest neighbor, and has significant application value in precision recommendations for maize variety suitability.
Author Contributions
Conceptualization, Y.Z. and K.W.; methodology, Y.Z. and K.W.; software, Y.Z.; validation, S.P., F.Y., X.Z. and D.Z.; formal analysis, Y.Z.; investigation, Y.H.; resources, K.W. and Y.H.; data curation, Y.Z.; writing—original draft preparation, Y.Z.; writing—review and editing, Y.Z. and K.W.; visualization, Y.Z. and S.P.; supervision, K.W. and C.Z.; project administration, K.W.; funding acquisition, K.W., Y.H. and X.Z. All authors have read and agreed to the published version of the manuscript.
Funding
This work was supported by the Sci-Tech Innovation 2030 Agenda (Grant No. 2022ZD0115703).
Institutional Review Board Statement
Not applicable.
Data Availability Statement
The data presented in this study are available on request from the corresponding author. The data are not publicly available due to content that could compromise the privacy of research participants.
Acknowledgments
The authors would like to thank Kaiyi Wang for his insightful guidance and Feng Yang and Shouhui Pan for their meaningful discussion.
Conflicts of Interest
The authors declare no conflict of interest.
References
- Pan, S.; Zhao, X.; Han, Y.; Wang, X.; Yang, F.; Wang, S.; Liu, Z.; Zhang, Q.; Zhang, Q.; Wang, K. Online information platform for the management of national variety test of major crops in China: Design, development, and applications. Comput. Electron. Agric. 2022, 201, 107292. [Google Scholar] [CrossRef]
- Zhao, X.; Pan, S.; Liu, Z.; Han, Y.; Zhang, Q.; Wang, K. Intelligent upgrading of plant breeding: Decision support tools in the golden seed breeding cloud platform. Comput. Electron. Agric. 2022, 194, 106672. [Google Scholar] [CrossRef]
- Tong, P. Review of the development situation of China’s seed industry in the past 20 years. Seed Technol. 2022, 40, 1–5. [Google Scholar]
- Liu, Z.; Tang, R.; Zhao, Z.; Li, S.; Zhu, D.; Zhang, X. Study on Fine Zoning of Maize Variety Suitability in Huang-Huai-Hai Area. J. Agric. Mach. 2015, 46, 281–288. [Google Scholar]
- Tian, H. Analysis of agricultural climate resources during maize growth period in Huang-Huai-Hai region. Meteorol. Environ. Sci. 2016, 39, 56–61. [Google Scholar]
- Su, Z.; Qin, Q.; Chen, X. Application of GIS for Climate mapping of Chinese Wolfberry in Ningxia Hui Autonomous Region. Resour. Sci. 2006, 28, 68–72. [Google Scholar]
- Zhao, Z.; Peng, G.; Xin, B. The climatic regionalization for vegetable production in energy-saving solar greenhouse in northwest of China. J. Agric. Mech. Res. 2006, 5, 87–90. [Google Scholar]
- Zhao, H.; Mi, H.; Du, Z. Application of AHP-based fuzzy comprehensive evaluation in climate regionalization for tea planting. Meteorol. Sci. Technol. 2013, 41, 1134–1137. [Google Scholar]
- He, Q.; Zhou, G. Climatic suitability of potential summer maize planting zones in China. Acta Geogr. Sin. 2011, 66, 1443–1450. [Google Scholar]
- Zhang, Q.; Li, B.; Zhang, Y.; Wang, S. Suitability Evaluation of Crop Variety via Graph Neural Network. Comput. Intell. Neurosci. 2022, 2022, 5614974. [Google Scholar] [CrossRef]
- Zhang, Q.; Wang, K.; Han, Y.; Liu, Z.; Yang, F.; Wang, S.; Zhao, X.; Zhao, C. A crop variety yield prediction system based on variety yield data compensation. Comput. Electron. Agric. 2022, 203, 107460. [Google Scholar] [CrossRef]
- Liu, X.; Bai, X.; Wang, L.; Ren, B.; Lu, S.; Li, L. Review and Trend Analysis of Knowledge Graphs for Crop Pest and Diseases. IEEE Access 2019, 7, 62251–62264. [Google Scholar]
- Chen, Y.; Kuang, J.; Cheng, D.; Zheng, J.; Gao, M.; Zhou, A. AgriKG: An Agricultural Knowledge Graph and Its Applications. In Proceedings of the DASFAA2019, Chiang Mai, Thailand, 22–25 April 2019. [Google Scholar]
- Damos, P. Modular Structure of Web-Based Decision Support Systems for Integrated Pest Management. A Review; Springer: Paris, France, 2015; Volume 35, pp. 1347–1372. [Google Scholar]
- Qi, C.; Song, Q.; Zhang, P.; Hui, Y. Cn-MAKG: China Meteorology and Agriculture Knowledge Graph Construction Based on Semi-structured Data. In Proceedings of the 2018 IEEE/ACIS 17th International Conference on Computer and Information Science (ICIS), Singapore, 6–8 June 2018. [Google Scholar]
- Zhang, Y.; Wang, W.; Liu, H.; Gu, R.; Hao, Y. Collaborative Filtering Recommendation Algorithm Based on Knowledge Graph Embedding. Comput. Appl. Res. 2021, 38, 3590–3596. [Google Scholar] [CrossRef]
- Rendle, S.; Freudenthaler, C.; Gantner, Z. BPR: Bayesian personalized ranking from implicit feedback. In Proceedings of the Twenty-Fifth Conference on Uncertainty in Artificial Intelligence, UAI 2009, Montreal, QC, Canada, 18–21 June 2009. [Google Scholar]
- Tang, J.; Qu, M.; Wang, M. LINE: Large-scale information network embedding. In Proceedings of the 24th International World Wide Web, Genewa: International WWW Conferences Steering Committee, Geneva, Switzerland, 18–22 May 2015. [Google Scholar]
- Ai, Q.; Azizi, V.; Chen, X. Learning Heterogeneous Knowledge Base Embeddings for Explainable Recommendation. Algorithms 2018, 11, 137. [Google Scholar] [CrossRef]
- Cao, Y.; Wang, X.; He, X.; Hu, Z.; Chua, T.S. Unifying Knowledge Graph Learning and Recommendation: Towards a Better Understanding of User Preferences. In Proceedings of the ACM Press The World Wide Web Conference, San Francisco, CA, USA, 13–17 May 2019. [Google Scholar]
- Zhao, X.; Cheng, Z.; Zhu, L.; Li, X. UGRec: Modeling Directed and Undirected Relations for Recommendation. In Proceedings of the 44th International ACM SIGIR Conference on Research and Development in Information Retrieval, Virtual Event, Canada, 11–15 July 2021. [Google Scholar]
- Zhang, C.; Wang, Y.; Zhu, L.; Song, J.; Yin, H. Multi-Graph Heterogeneous Interaction Fusion for Social Recommendation. ACM Trans. Inf. Syst. 2021, 40, 1–26. [Google Scholar] [CrossRef]
- Wang, H.; Zhang, F.; Wang, J.; Zhao, M.; Li, W.; Xie, X.; Guo, M. RippleNet: Propagating User Preferences on the Knowledge Graph for Recommender Systems. In Proceedings of the 27th ACM International Conference on Information and Knowledge Management, Torino, Italy, 22–26 October 2018. [Google Scholar]
- Zhang, F.; Yuan, N.J.; Lian, D.; Xie, X.; Ma, W.Y. Collaborative knowledge base embedding for recommender systems. In Proceedings of the 22nd ACM SIGKDD International Conference on Knowledge Discovery and Data Mining, San Francisco, CA, USA, 13–17 August 2016. [Google Scholar]
- Hongwei, W.; Fuzheng, Z.; Xing, X.; Minyi, G. DKN: Deep Knowledge-Aware Network for News Recommendation. In Proceedings of the 2018 World Wide Web Conference on World Wide Web, Lyon, France, 23–27 April 2018. [Google Scholar]
- Wang, H.; Zhang, F.; Hou, M.; Xie, X.; Guo, M.; Liu, Q. SHINE: Signed Heterogeneous Information Network Embedding for Sentiment Link Prediction. In Proceedings of the Eleventh ACM International Conference, Marina Del Rey, CA, USA, 5–9 February 2017. [Google Scholar]
- Ma, Y.; Wang, Z.; Luan, Q.; Hu, L.; Zhang, A. The relationship between maize yield and ecological climate factors. China Agrometeorol. 2009, 30, 565–568. [Google Scholar]
- Liu, L. Impact of Climate Change on Maize Diseases and Pests. China Agric. Inf. 2015, 9, 85–85. [Google Scholar]
- Wang, X.; Liu, R.; Zhan, J. Research Progress on the Effect of Continuously Cloudy or Rainy Weather on Maize. Meteorol. Environ. Sci. 2016, 39, 121–125. [Google Scholar]
- Huo, Z.; Li, M.; Wang, L.; Xiao, J.; Huang, D.; Wang, C. Impact of precipitation change on crop diseases and insect pests in China. China Agric. Sci. 2012, 45, 1935–1945. [Google Scholar]
- Zhai, Z.; Hu, W.; Yan, C.; Liu, Q.; Liu, S. Study on the Change of Maize Growth Period in China and Its Influencing Factors. China Agric. Sci. 2012, 45, 4587–4603. [Google Scholar]
- Tomas, M.; Ilya, S.; Kai, C.; Greg, S.C.; Jeff, D. Distributed representations of words and phrases and their compositionality. Adv. Neural Inf. Process. Syst. 2013, 26, 3111–3119. [Google Scholar]
- Veličković, P.; Cucurull, G.; Casanova, A.; Romero, A.; Lio, P.; Bengio, Y. Graph attention networks. Stat 2017, 1050, 20. [Google Scholar]
- Kipf, T.N.; Welling, M. Semi-supervised classification with graph convolutional networks. arXiv 2016, arXiv:1609.02907. [Google Scholar]


Disclaimer/Publisher’s Note: The statements, opinions and data contained in all publications are solely those of the individual author(s) and contributor(s) and not of MDPI and/or the editor(s). MDPI and/or the editor(s) disclaim responsibility for any injury to people or property resulting from any ideas, methods, instructions or products referred to in the content. |
© 2023 by the authors. Licensee MDPI, Basel, Switzerland. This article is an open access article distributed under the terms and conditions of the Creative Commons Attribution (CC BY) license (https://creativecommons.org/licenses/by/4.0/).